|

SEC S-K 229.1300 Technical Report Summary Stage of Property: Production/Pre-Feasibility Study Property: Minera Escondida Limitada Location: Antofagasta Region, Chile For the fiscal year ended: 30 June 2022 |
Report Prepared for BHP Group Limited (ABN 49 004 028 077) 171 Collins Street, Melbourne VICTORIA 3000, AUSTRALIA |
Report Prepared by:
|
|
|
|
Qualified Person |
Specific Type of Activity and Area of Accountability |
Signature |
Date |
Rodrigo Maureira |
Mineral Resources – Chapter 8, 9 and 11 in full, Chapter 7 excluding Sections 7.3 and 7.4, and Chapter 1-5 and 20-25 jointly with Mineral Reserve QP |
/s/Rodrigo Maureira |
June 30, 2026 |
Camila Bustos |
Mineral Reserves – Chapter 12, 15, 16, 18 and 19 in full, Chapter 13 excluding 13.3.1 and 13.3.2, and Chapter 1- 5 and 20-25 jointly with Mineral Resources QP |
/s/Camila Bustos |
June 30, 2026 |
Andres Salazar |
Geology – Chapter 6 in full |
/s/Andres Salazar |
June 30, 2026 |
Pablo Vasquez |
Geotechnical & Hydrogeology (Sections 7.3 and 7.4), Hydrogeology (Section 13.3.2), Pit Geotechnical (Section 13.3.1) |
/s/Pablo Vasquez |
June 30, 2026 |
German Urrutia |
Tailings Management (Section 17.2.1) |
/s/German Urrutia |
June 30, 2026 |
Carlos Delgado |
Mineral Processing and Metallurgical Testing – Chapter 10 in full
Processing and Recovery Methods - Chapter 14 in full |
/s/Carlos Delgado |
June 30, 2026 |
Andres Naranjo |
Infrastructure Chapter 15 in full
Environmental Studies, Permitting, Plans and Agreements – Chapter 17 excluding Section 17.2.1 |
/s/Andres Naranjo |
June 30, 2026 |
|
|
SEC Technical Report Summary – Minera Escondida Limitada |
Page ii |
Note regarding Forward-Looking Statements
This Technical Report Summary (TRS) contains forward-looking statements, including: statements regarding trends in commodity prices and currency exchange rates; demand for commodities; reserves, resources and production forecasts; plans, strategies and objectives of management; climate scenarios; approval of certain projects and consummation of certain transactions; closure or divestment of certain assets, operations or facilities (including associated costs); anticipated production or construction commencement dates; capital costs and scheduling; operating costs and supply of materials and skilled employees; anticipated productive lives of projects, mines and facilities; provisions and contingent liabilities; and tax and regulatory developments.
Forward-looking statements may be identified by the use of terminology including, but not limited to, ‘intend’, ‘aim’, ‘project’, ‘see’, ‘anticipate’, ‘estimate’, ‘plan’, ‘objective’, ‘believe’, ‘expect’, ‘commit’, ‘may’, ‘should’, ‘need’, ‘must’, ‘will’, ‘would’, ‘continue’, ‘forecast’, ‘guidance’, ‘trend’ or similar words. These statements discuss future expectations concerning the results of assets or financial conditions, or provide other forward-looking information.
Forward-looking statements are based on current expectations and reflect judgments, assumptions, estimates and other information available as at the date of this TRS. These statements do not represent guarantees or predictions of future financial or operational performance and involve known and unknown risks, uncertainties and other factors, many of which are beyond Minera Escondida Ltda’s control and which may cause actual results to differ materially from those expressed in the statements contained in this TRS. Readers are cautioned against reliance on any forward-looking statements or guidance, including in light of the current economic climate and the significant volatility, uncertainty and disruption arising in connection with COVID-19. Other factors that may affect actual results are set out in BHP’s reports that are filed with, and furnished to, the U.S. Securities and Exchange Commission, including BHP’s latest Annual Report on Form 20-F for the period ended June 30, 2022.
Except as required by applicable regulations or by law, BHP does not undertake to publicly update or review any forward-looking statements, whether as a result of new information or future events.
The production schedule data included in Sections 13 and 19 of this TRS has been prepared to demonstrate the economic viability of the mineral reserves of the Minera Escondida Limitada property only and may differ from production guidance published by BHP from time to time in accordance with the relevant ASX Listing Rules. See Sections 11, 12, 16, 17, 18 and 19 for more information on the pricing and cost assumptions utilised to produce Minera Escondida Limitada production schedule data in this TRS.
Specifically, the production schedule data for the entire life of mineral reserves included in Sections 13 and 19 of this TRS has been prepared utilising the median of historical monthly average commodity prices and the average of annual costs for the preceding three financial years (1 July 2018 to 30 June 2021), whereas BHP’s forward production and cost guidance published in accordance with the ASX Listing Rules are prepared utilising BHP’s internally generated projected long-term commodity prices and cost assumptions. Therefore, the production schedule data included in this TRS may differ from BHP’s production guidance published in accordance with the ASX Listing Rules.
|
|
|
|
MEL_TRS_June 2022_Mike |
June 2022 |
|
|
SEC Technical Report Summary – Minera Escondida Limitada |
Page iii |
Table of Contents
|
|
|
|
|
1 |
Executive Summary |
19 |
|
1.1 |
Property Description |
19 |
|
1.2 |
Geology and Mineralization |
19 |
|
1.3 |
Existing Infrastructure |
20 |
|
1.4 |
Mineral Tenure |
21 |
|
1.5 |
Royalties |
23 |
|
1.6 |
Present Condition of the Property |
23 |
|
1.7 |
History of previous operations |
23 |
|
1.8 |
Significant Encumbrances to the Property |
24 |
|
1.9 |
Summary of All Mineral Resources and Mineral Reserves |
24 |
|
1.10 |
Changes to Mineral Resources and Reserves between 30 June 2021 and 2022 |
25 |
|
1.11 |
Material Assumptions and Criteria |
25 |
|
1.12 |
Qualified Person's Conclusions and Recommendations |
26 |
2 |
Introduction |
27 |
|
2.1 |
Registrant for Whom the Technical Report Summary was Prepared |
27 |
|
2.2 |
Terms of Reference and Purpose of the Report |
27 |
|
2.3 |
Sources of Information |
27 |
|
2.4 |
Details of Inspection |
28 |
|
2.5 |
Report Version Update |
29 |
3 |
Property Description |
29 |
|
3.1 |
Property Location |
29 |
|
3.2 |
Mineral Tenure |
30 |
|
3.3 |
Mineral Rights Description and How They Were Obtained |
33 |
|
3.4 |
Encumbrances |
33 |
|
3.5 |
Royalties or Similar Interest |
33 |
4 |
Accessibility, Climate, Local Resources, Infrastructure and Physiography |
33 |
|
4.1 |
Topography, Elevation, and Vegetation |
34 |
|
4.2 |
Means of Access |
34 |
|
4.3 |
Climate and Length of Operating Season |
34 |
|
4.4 |
Local Resources |
34 |
|
4.5 |
Infrastructure and Availability |
34 |
|
|
4.5.1 |
Water |
35 |
|
|
4.5.2 |
Electricity |
35 |
|
|
4.5.3 |
Personnel |
35 |
|
|
4.5.4 |
Supplies |
35 |
5 |
History |
36 |
|
5.1 |
Previous Operations |
36 |
|
5.2 |
Exploration and Development by Previous Owners or Operators |
37 |
|
|
|
|
MEL_TRS_June 2022_Mike |
June 2022 |
|
|
SEC Technical Report Summary – Minera Escondida Limitada |
Page iv |
|
|
|
|
|
6 |
Geological Setting, Mineralisation, and Deposit |
39 |
|
6.1 |
Regional Geology |
39 |
|
|
6.1.1 |
Palaeozoic |
39 |
|
|
6.1.2 |
Mesozoic |
39 |
|
|
6.1.3 |
Cenozoic |
40 |
|
6.2 |
Local Geology |
41 |
|
6.3 |
Property Geology |
43 |
|
6.4 |
Mineral Deposit |
44 |
|
|
6.4.1 |
Escondida Deposit |
44 |
|
|
6.4.2 |
Escondida Norte Deposit |
46 |
7 |
Exploration |
48 |
|
7.1 |
Exploration Work (Other Than Drilling) |
48 |
|
7.2 |
Exploration Drilling |
48 |
|
|
7.2.1 |
Drilling Type and Extent |
48 |
|
|
7.2.2 |
Drilling, Sampling, and Recovery Factors |
53 |
|
|
7.2.3 |
Drilling Results and Interpretation |
53 |
|
|
7.2.4 |
Qualified Person’s Statement on Exploration Drilling |
55 |
|
7.3 |
Hydrogeology |
56 |
|
|
7.3.1 |
Mine Operation |
58 |
|
|
7.3.2 |
Projects |
61 |
|
7.4 |
Geotechnical Data, Testing, and Analysis |
61 |
|
|
7.4.1 |
Geotechnical Drilling |
62 |
|
7.5 |
Property Plan View |
64 |
|
7.6 |
Exploration Targets |
65 |
8 |
Sample Preparation, Analyses and Security |
65 |
|
8.1 |
Sample Preparation Methods and Quality Control Measures |
65 |
|
|
8.1.1 |
Methods |
65 |
|
|
8.1.2 |
Sample Security |
69 |
|
8.2 |
Sample Preparation, Assaying and Analytical Procedures |
70 |
|
|
8.2.1 |
Name and Location of Laboratory, Relationship and Certification |
70 |
|
|
8.2.2 |
Sample Preparation and Analysis Protocol at Laboratory |
70 |
|
|
8.2.3 |
Analytical Methods |
71 |
|
8.3 |
Quality Control Procedures/Quality Assurance |
74 |
|
|
8.3.1 |
Sample Analysis Controls and Results |
76 |
|
8.4 |
Opinion on Adequacy |
80 |
|
8.5 |
Non-Conventional Industry Practice |
80 |
9 |
Data Verification |
81 |
|
9.1 |
Data Verification Procedures |
81 |
|
|
9.1.1 |
External Reviews |
82 |
|
|
9.1.2 |
Internal Reviews |
83 |
|
9.2 |
Limitations |
83 |
|
9.3 |
Opinion on Data Adequacy |
83 |
|
|
|
|
MEL_TRS_June 2022_Mike |
June 2022 |
|
|
SEC Technical Report Summary – Minera Escondida Limitada |
Page v |
|
|
|
|
|
10 |
Mineral Processing and Metallurgical Testing |
84 |
|
10.1 |
Testing and Procedures |
84 |
|
|
10.1.1 |
General |
84 |
|
|
10.1.2 |
Testing and Laboratories |
84 |
|
10.2 |
Sample Representativeness |
88 |
|
|
10.2.1 |
Sulphide Concentrator Sampling |
88 |
|
|
10.2.2 |
Acid Leach (Oxide and Mixed) and Acid Bio Leach (Sulphide) Sampling |
91 |
|
10.3 |
Relevant Results |
91 |
|
|
10.3.1 |
Hardness Model |
93 |
|
|
10.3.2 |
Throughput in Milling Plants |
94 |
|
|
10.3.3 |
Copper Recovery in Flotation Plants |
95 |
|
|
10.3.4 |
Acid Leaching of Oxides and Mixed Mineralisation |
97 |
|
|
10.3.5 |
Acid Bioleaching of Sulphide Mineralisation |
98 |
|
10.4 |
Payables and Deleterious Elements |
100 |
|
10.5 |
Adequacy of Data and Non-Conventional Industry Practice |
101 |
11 |
Mineral Resources Estimate |
101 |
|
11.1 |
Key Assumptions, Parameters, and Methods Used |
102 |
|
11.2 |
Geological Modelling |
102 |
|
|
11.2.1 |
Lithology |
102 |
|
|
11.2.2 |
Alteration |
103 |
|
|
11.2.3 |
Mineralogical Zone |
104 |
|
|
11.2.4 |
Copper Sulphide Abundance |
105 |
|
|
11.2.5 |
Porphyry Intrusive Pulse |
107 |
|
11.3 |
Block Modelling |
108 |
|
|
11.3.1 |
Composite Length |
109 |
|
|
11.3.2 |
Estimation Domain |
110 |
|
|
11.3.3 |
Contact Analysis |
113 |
|
|
11.3.4 |
Capping |
114 |
|
|
11.3.5 |
Variography |
115 |
|
|
11.3.6 |
Estimation |
117 |
|
11.4 |
Validation |
120 |
|
|
11.4.1 |
Visual Comparison |
121 |
|
|
11.4.2 |
Swath Plots |
125 |
|
|
11.4.3 |
Global Statistics |
126 |
|
|
11.4.4 |
Comparison Against Blasthole Grade |
128 |
|
11.5 |
Cut-Off Grades Estimates |
131 |
|
11.6 |
Reasonable Prospects for Economic Extraction |
132 |
|
11.7 |
Resource Classification and Criteria |
133 |
|
11.8 |
Uncertainty |
135 |
|
11.9 |
Mineral Resources Statement |
137 |
|
11.10 |
Discussion of Relative Accuracy/Confidence |
138 |
|
11.11 |
Opinion on Influence for Economic Extraction |
139 |
|
|
|
|
MEL_TRS_June 2022_Mike |
June 2022 |
|
|
SEC Technical Report Summary – Minera Escondida Limitada |
Page vi |
|
|
|
|
|
12 |
Mineral Reserves Estimate |
139 |
|
12.1 |
Key Assumptions, Parameters, and Methods |
139 |
|
|
12.1.1 |
Geologic Resource and Mining Models |
139 |
|
12.2 |
Modifying Factors |
140 |
|
|
12.2.1 |
Property Limits |
140 |
|
|
12.2.2 |
Project Constraints |
141 |
|
|
12.2.3 |
Processing |
142 |
|
|
12.2.4 |
Commodity Prices Used |
142 |
|
|
12.2.5 |
Cut-off Grade Estimate |
143 |
|
|
12.2.6 |
Cut-off Grade Calculation for Mill |
143 |
|
|
12.2.7 |
Cut-off Grade Calculation for Sulphide Bioleaching Process |
144 |
|
|
12.2.8 |
Cut-off Grade Calculation for Acid Leaching Process |
144 |
|
|
12.2.9 |
Pit Optimisation |
145 |
|
12.3 |
Mineral Reserves Classification and Criteria |
148 |
|
12.4 |
Material Risks Associated with the Modifying Factors |
149 |
|
12.5 |
Mineral Reserves Statement |
150 |
|
12.6 |
Discussion of Relative Accuracy/Confidence |
150 |
13 |
Mining Methods |
150 |
|
13.1 |
Selected Mining Method |
150 |
|
13.2 |
Production Tasks |
151 |
|
|
13.2.1 |
Drill and Blast |
151 |
|
|
13.2.2 |
Waste Removal and Storage |
151 |
|
|
13.2.3 |
Ore Removal and Transport |
151 |
|
13.3 |
Additional Parameters Relevant to Mine Designs and Plans |
151 |
|
|
13.3.1 |
Geotechnical Models |
151 |
|
|
13.3.2 |
Hydrological Models |
156 |
|
|
13.3.3 |
Mine Design Parameters |
161 |
|
|
13.3.4 |
Dilution, Loss, and Mine Recovery |
161 |
|
|
13.3.5 |
Mining Pushbacks |
163 |
|
|
13.3.6 |
Mining Strategy and Production Rates |
164 |
|
13.4 |
Production Schedule |
165 |
|
13.5 |
Production Rates and Mine Life |
166 |
|
13.6 |
Equipment and personnel |
166 |
|
13.7 |
Final Mine Outline |
167 |
14 |
Processing and Recovery Methods |
168 |
|
14.1 |
Process Plant |
168 |
|
14.2 |
Plant Throughput and Design, Equipment Characteristics and Specifications |
168 |
|
|
14.2.1 |
Primary Crushing |
168 |
|
|
14.2.2 |
Concentration Process Description |
170 |
|
|
14.2.3 |
Oxide Leach Process Description |
173 |
|
|
14.2.4 |
Bioleaching Process Description |
175 |
|
|
|
|
MEL_TRS_June 2022_Mike |
June 2022 |
|
|
SEC Technical Report Summary – Minera Escondida Limitada |
Page vii |
|
|
|
|
|
|
14.3 |
Requirements for Energy, Water, Process Materials, and Personnel |
177 |
|
|
14.3.1 |
Energy |
177 |
|
|
14.3.2 |
Water |
177 |
|
|
14.3.3 |
Suppliers for Process |
178 |
|
|
14.3.4 |
Personnel |
178 |
|
14.4 |
Novel Processing Methods |
178 |
15 |
Infrastructure |
179 |
|
15.1 |
Description |
180 |
|
15.2 |
Rail and Roads |
182 |
|
|
15.2.1 |
Rail |
182 |
|
|
15.2.2 |
Roads |
183 |
|
15.3 |
Port Facilities |
185 |
|
15.4 |
Tailings Disposal |
186 |
|
15.5 |
Power, Water, and Pipelines |
188 |
|
|
15.5.1 |
Power (Electric Energy) |
188 |
|
|
15.5.2 |
Water |
191 |
|
15.6 |
Infrastructure Layout Map |
194 |
16 |
Market Studies |
195 |
|
16.1 |
Copper |
195 |
|
|
16.1.1 |
Copper Long Term Price for Establishing the Economic Viability |
195 |
|
|
16.1.2 |
Supply and Demand |
196 |
|
|
16.1.3 |
Evaluation of Competitors |
198 |
|
16.2 |
Products and Markets |
198 |
|
|
16.2.1 |
Cathode |
199 |
|
|
16.2.2 |
Concentrate |
199 |
|
16.3 |
Contracts and Status |
200 |
17 |
Environmental Studies, Permitting, Plans and Agreements |
200 |
|
17.1 |
Environmental Studies and Impact Assessments |
200 |
|
17.2 |
Waste and Tailings Disposal |
201 |
|
|
17.2.1 |
Tailings Management |
201 |
|
|
17.2.2 |
Waste Management and Circular Economy |
201 |
|
|
17.2.3 |
Water Strategy |
201 |
|
|
17.2.4 |
Land Management |
201 |
|
|
17.2.5 |
Biodiversity |
202 |
|
|
17.2.6 |
Air Quality |
202 |
|
17.3 |
Project Permitting |
202 |
|
17.4 |
Social Plans and Agreements |
203 |
|
|
17.4.1 |
Indigenous Partnerships |
203 |
|
|
17.4.2 |
Cultural Heritage |
203 |
|
17.5 |
Closure Planning |
203 |
|
17.6 |
Local Procurement and Hiring |
205 |
|
|
17.6.1 |
Local Procurement |
205 |
|
|
17.6.2 |
Social Investment |
205 |
|
|
|
|
MEL_TRS_June 2022_Mike |
June 2022 |
|
|
SEC Technical Report Summary – Minera Escondida Limitada |
Page viii |
|
|
|
|
|
|
|
17.6.3 |
Reconversion and Developing MEL Capabilities |
206 |
|
|
17.6.4 |
Local Procurement Strategy |
206 |
|
17.7 |
Discussion of Relative Accuracy/Confidence |
206 |
18 |
Capital and Operating Costs |
207 |
|
18.1 |
Basis of Cost estimation |
207 |
|
18.2 |
Capital and Operating Cost Estimates |
207 |
|
|
18.2.1 |
Capital Costs |
207 |
|
|
18.2.2 |
Opex Costs |
209 |
19 |
Economic Analysis |
211 |
|
19.1 |
Key assumptions, parameters and methods used |
211 |
|
|
19.1.1 |
Mine Plan Physicals |
211 |
|
|
19.1.2 |
Prices and payable metals |
212 |
|
|
19.1.3 |
Foreign Exchange Rate |
213 |
|
|
19.1.4 |
Capital and Operating Costs |
213 |
|
|
19.1.5 |
Closure Costs |
213 |
|
|
19.1.6 |
Taxes |
214 |
|
|
19.1.7 |
Valuation Assumptions |
214 |
|
19.2 |
Results of Economic Analysis |
214 |
|
19.3 |
Sensitivity Analysis |
216 |
20 |
Adjacent Properties |
216 |
21 |
Other Relevant Data and Information |
217 |
|
21.1 |
Independent Audits |
217 |
|
21.2 |
Plan Compliance |
218 |
22 |
Interpretation and Conclusions |
220 |
|
22.1 |
Mineral Resources |
220 |
|
22.2 |
Mineral Reserves |
221 |
23 |
Recommendations |
221 |
|
23.1 |
Recommended Work Programmes |
221 |
|
|
23.1.1 |
Geology and Mineral Resources |
221 |
|
|
23.1.2 |
Mineral Reserves |
221 |
24 |
References |
222 |
25 |
Reliance on Information Provided by the Registrant |
224 |
|
|
|
|
MEL_TRS_June 2022_Mike |
June 2022 |
|
|
SEC Technical Report Summary – Minera Escondida Limitada |
Page ix |
List of Tables
|
|
Table 1‑1: |
MEL Main Mining Concessions |
Table 1‑2: |
MEL Main Surface Rights |
Table 1‑3: |
Escondida Property BHP Ownership Basis (57.5%) – Summary of Mineral Resources Exclusive of Mineral Reserves as of 30th June 2022 |
Table 1‑4: |
Escondida Property BHP Ownership Basis (57.5%) - Summary of Mineral Reserves as at 30th June 2022 |
Table 1‑5: |
Mineral Resources Price Assumptions |
Table 1‑6: |
Mineral Reserves Price Assumptions |
Table 2‑1: |
List of Qualified Persons |
Table 3‑1: |
MEL Mining Concessions |
Table 4‑1: |
Principal Strategic Raw Materials Used in the Operation |
Table 5‑1: |
Key MEL Milestones |
Table 5‑2: |
Drilling by Type and Year (Total Escondida and Escondida Norte combined) |
Table 7‑1: |
Summary of Metres Drilled, Escondida |
Table 7‑2: |
Summary of Metres Drilled, Escondida Norte |
Table 7‑3: |
Summary Piezometric Characteristics of the Escondida Pit |
Table 7‑4: |
Distribution of Historical Geotechnical Samples by Alteration, Lithology, and Geotechnical Zone, Escondida and Escondida Norte |
Table 7‑5: |
Distribution of 2020-2021 Geotechnical Samples by Alteration, Lithology and Geotechnical Zone, Escondida and Escondida Norte |
Table 7‑6: |
Strength Properties by Geotechnical Unit for the Escondida and Escondida Norte |
Table 8‑1: |
MEL Laboratories from Exploration to FY2022, by Service Type |
Table 8‑2: |
FY22 Chemical Analyses |
Table 8‑3: |
Partial Extraction Analysis (Ptxt) |
Table 8‑4: |
FY2021 Control Samples for RC and DDH |
Table 8‑5: |
QA/QC Results for TCu, 2008-2020, Escondida and Escondida Norte |
Table 8‑6: |
Number of Routine and Control Samples TCu, 2008-2021, Escondida and Escondida Norte |
Table 8‑7: |
FY2021 QA/QC Summary |
Table 9‑1: |
Mineral Resources Biannual External Audits |
Table 10‑1: |
Description of Key Testwork undertaken for Geometallurgical Characterisation |
Table 10‑2: |
Laboratories |
Table 10‑3: |
Hardness and Recovery Databases Supporting Long Term Plan, as Issued at May21 |
Table 10‑4: |
Geometallurgical Classification Definition for Hardness and Recovery |
Table 10‑5: |
Testwork for Geometallurgical Process |
Table 10‑6: |
Hardness Domain Definition (UG DUR) and Results for Escondida |
Table 10‑7: |
Hardness Domain Definition (UG DUR) for Escondida Norte |
Table 10‑8: |
Parameters for throughput Estimates |
Table 10‑9: |
Domains Definition for Copper Recovery (UG Rec) and Results for Escondida |
Table 10‑10: |
Domains Definition for Copper Recovery (UG Rec) and Results for Escondida Norte |
Table 10‑11: |
Ore Types Definition for Acid Leaching Process |
Table 10‑12: |
Ore Types Definition for Sulphides to Bioleaching Process |
Table 10‑13: |
Leaching as a Function of the Main Sulphide Mineralogy |
|
|
|
|
MEL_TRS_June 2022_Mike |
June 2022 |
|
|
SEC Technical Report Summary – Minera Escondida Limitada |
Page x |
|
|
Table 11‑1: |
Lithologies Included in the Geological Model for Escondida and Escondida Norte |
Table 11‑2: |
Alteration Included in the Geological Model for Escondida and Escondida Norte |
Table 11‑3: |
Mineralogical Zones Included in the Geological Model, Escondida and Escondida Norte |
Table 11‑4: |
Copper Sulphide Abundance (CSA) definition |
Table 11‑5: |
Variables Estimated in the Escondida and Escondida Norte Resource Model |
Table 11‑6: |
Estimation Domain for TCu for Escondida |
Table 11‑7: |
Estimation Domain for TCu for Escondida Norte |
Table 11‑8: |
TCu Statistics by Estimation Domain for Escondida |
Table 11‑9: |
TCu Statistics by Estimation Domain for Escondida Norte |
Table 11‑10: |
Contact Analysis TCu for Escondida |
Table 11‑11: |
Contact Analysis TCu, Escondida Norte |
Table 11‑12: |
Percentage of Capped Samples for Escondida |
Table 11‑13: |
Percentage of Capped Samples for Escondida Norte |
Table 11‑14: |
Variogram Parameters for TCu, Escondida |
Table 11‑15: |
Variogram Parameters for TCu, Escondida Norte |
Table 11‑16: |
Block Model Definition for Escondida |
Table 11‑17: |
Block Model Definition for Escondida Norte |
Table 11‑18: |
OK Plan Estimates Plan TCu, Escondida |
Table 11‑19: |
OK Plan Estimates TCu, Escondida Norte |
Table 11‑20: |
Global mean comparison for TCu, Escondida |
Table 11‑21: |
Global mean comparison for TCu, Escondida Norte |
Table 11‑22: |
Cut-off Economic Inputs for Mineral Resources |
Table 11‑23: |
Mineral Zone Definition Criteria |
Table 11‑24: |
Uncertainty Thresholds by Mineralisation |
Table 11‑25: |
Nominal Drilling Pattern |
Table 11‑26: |
Escondida Property BHP Ownership Basis (57.5%) – Summary of Mineral Resources Exclusive of Mineral Reserves as of 30th June 2022 |
Table 11‑27: |
Escondida Property BHP Ownership Basis (57.5%) – Summary of Mineral Resources Inclusive of Mineral Reserves as of 30th June 2022 |
Table 12‑1: |
Block Model Dimensions – Escondida Norte Pit |
Table 12‑2: |
Block Model Dimensions – Escondida Pit |
Table 12‑3: |
Principal Variables of the Block Model |
Table 12‑4: |
Copper Concentrator COG Parameters |
Table 12‑5: |
Sulphide Bioleaching COG Parameters |
Table 12‑6: |
Acid Leaching COG Parameters |
Table 12‑7: |
Pit Optimisation Economic Inputs |
Table 12‑8: |
Escondida Property BHP Ownership Basis (57.5%) - Summary of Mineral Reserves as at 30th June 2022 |
Table 13‑1: |
Mine Design Parameters |
Table 13‑2: |
Waste Dump Design Parameters |
Table 13‑3: |
Hydraulic Parameters UH |
Table 13‑4: |
Escondida System Water Balance |
Table 13‑5: |
Hydrogeological Units of Escondida Norte |
Table 13‑6: |
Escondida Norte System Water Balance |
Table 13‑7: |
Mine equipment distribution FY23 |
|
|
|
|
MEL_TRS_June 2022_Mike |
June 2022 |
|
|
SEC Technical Report Summary – Minera Escondida Limitada |
Page xi |
|
|
Table 14‑1: |
Primary Crushers Specifications |
Table 14‑2: |
Conveyor Belts and Equipment Specifications at Primary Crushing System |
Table 14‑3: |
Installed Capacity for Concentrators |
Table 14‑4: |
Main Equipment list for Concentrator Process |
Table 14‑5: |
Main Equipment List for Oxide Process |
Table 14‑6: |
Main Equipment List for Bioleaching Process |
Table 14‑7: |
Main Materials used at the Mine and Process |
Table 15‑1: |
Overview of Major Subsystems at MEL |
Table 15‑2: |
General Characteristics Laguna Seca Dam |
Table 15‑3: |
Design Features for the Sixth raise |
Table 15‑4: |
220-kV High Voltage Electrical Energy Transmission Systems with their Source and Destination Substations |
Table 15‑5: |
69-kV High Voltage Electrical Power Transmission Systems with their Origin and Destination Substations |
Table 16‑1: |
Historic Copper Price |
Table 17‑1: |
Cost Estimates - SEC SK 1300 Regulations |
Table 18‑1: |
Total Capital Cost by Area (Life of Mine) |
Table 18‑2: |
Major Components of Capital and Operating Costs (100% Basis) |
Table 19‑1: |
Mineral Reserves Physicals (100% MEL Terms) |
Table 19‑2: |
Long Term Product and Subproduct Prices |
Table 19‑3: |
Average Payable Metals |
Table 19‑4: |
Financial Metrics Summary |
Table 19‑5: |
Cash Flow Summary (five-year averages) Minera Escondida - BHP Share |
Table 19‑6: |
Results of Sensitivity Analysis |
Table 25‑1: |
Reliance on Information Provided by the Registrant |
|
|
|
|
MEL_TRS_June 2022_Mike |
June 2022 |
|
|
SEC Technical Report Summary – Minera Escondida Limitada |
Page xii |
List of Figures
|
|
Figure 1‑1: |
Location of MEL Mine with Road Access |
Figure 1‑2: |
Schematic of MEL Operations and Infrastructure |
Figure 3‑1: |
Escondida Location Map |
Figure 3‑2: |
Minera Escondida Ltda. Mining Concessions |
Figure 6‑1: |
A) Metallogenic Belts of the Andes and their Main Copper-bearing Porphyries, B) Regional Geology Escondida District |
Figure 6‑2: |
Local Geology Map |
Figure 6‑3: |
Stratigraphic Column for Escondida District |
Figure 6‑4: |
Pit Shell and Vertical Section for Lithology, Alteration, and Mineralogical Zone for Escondida |
Figure 6‑5: |
Pit shell and Vertical Section for Lithology, Alteration and Mineralogical Zone for Escondida Norte |
Figure 7‑1: |
Metres Drilled by Drilling Type and FY, Escondida |
Figure 7‑2: |
Metres Drilled by Drilling Type and FY, Escondida Norte |
Figure 7‑3: |
Distribution of Collars by Drill Hole Type, Escondida and Escondida Norte |
Figure 7‑4: |
Vertical Section 108,600N with Drill Hole per Type, Escondida |
Figure 7‑5: |
Vertical Section 114,000N with Drill Hole per Type, Escondida Norte |
Figure 7‑6: |
Lithology Model Plan View and Vertical Sections, Escondida |
Figure 7‑7: |
Lithology Model Plan View and Vertical Sections, Escondida Norte |
Figure 7‑8: |
Piezometric Monitoring Network in the Escondida Pit |
Figure 7‑9: |
Piezometric monitoring network in Escondida North pit |
Figure 7‑10: |
Geotechnical Unit and Uniaxial Compression Strength (UCS) Escondida Mine |
Figure 7‑11: |
Drill Hole (Samples) Location for Escondida and Escondida Norte Areas |
Figure 8‑1: |
RC Sampling; A) Sample Collection; B) Weight control; C) Sample Splitting; D) A and B Samples |
Figure 8‑2: |
DDH Sampling; A) Sample Collection; B) Sample Distribution in Metallic Trays |
Figure 8‑3: |
A) Core Photography. B) Photography Stored in Imago Software |
Figure 8‑4: |
Geological Logging |
Figure 8‑5: |
Hydraulic Guillotine for Core Cutting |
Figure 8‑6: |
MEL Sample Chain of Custody |
Figure 8‑7: |
Chemical Analysis in External Laboratory |
Figure 8‑8: |
Mechanical Preparation Schema, Bureau Veritas Laboratory |
Figure 8‑9: |
MEL Flow Chart Summarising Sampling and Analytical Protocol |
Figure 8‑10: |
QA/QC Samples Insertion; A) Label Printing from acQuire; B) Labelling of Pulp and Checking of Position of Controls According to scheme of analysis; C) Control Types |
Figure 8‑11: |
Results of Field, Coarse (10#), and Pulp Duplicates-TCu |
Figure 8‑12: |
Laboratory Results for TSEN59 and 62 of FY21 Campaign |
Figure 8‑13: |
Coarse and Fine Blanks Result for FY21 |
Figure 9‑1: |
Flowsheet of the MEL Data Verification Process |
Figure 10‑1: |
MEL Geometallurgical Modelling Flowsheet |
Figure 10‑2: |
Geometallurgical Testing Scheme |
Figure 10‑3: |
Spatial distribution of geometallurgical samples |
Figure 10‑4: |
Geometallurgical Classification Profile for Copper Recovery at Concentrators on Long Term Plan 22 |
Figure 10‑5: |
Throughput Model Reconciliation |
Figure 10‑6: |
Recovery Model Reconciliation |
|
|
|
|
MEL_TRS_June 2022_Mike |
June 2022 |
|
|
SEC Technical Report Summary – Minera Escondida Limitada |
Page xiii |
|
|
Figure 11‑1: |
Example Lithology Cross-Section for Escondida Section 108,260N (top) and Escondida Norte Section 114,000N (bottom) |
Figure 11‑2: |
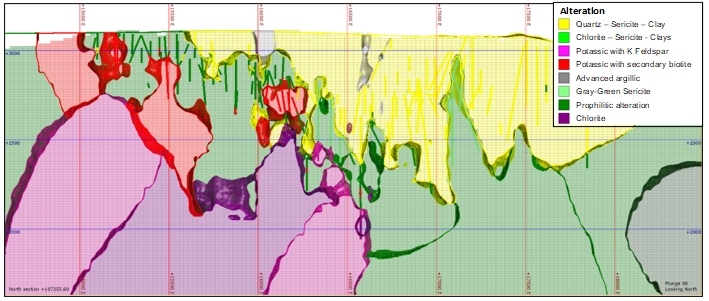
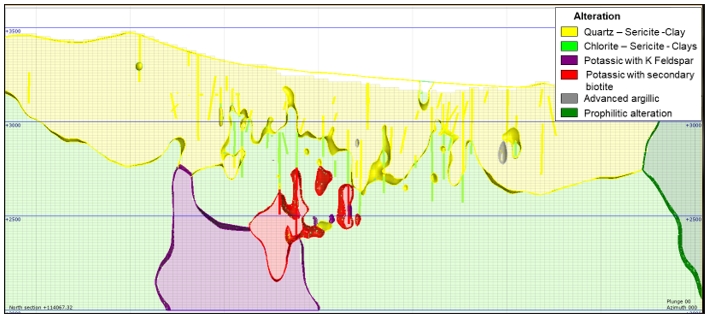
Example Alteration Cross-Sections for Escondida Section 107,255N (top) and Escondida Norte Section 114,100N (bottom) |
Figure 11‑3: |
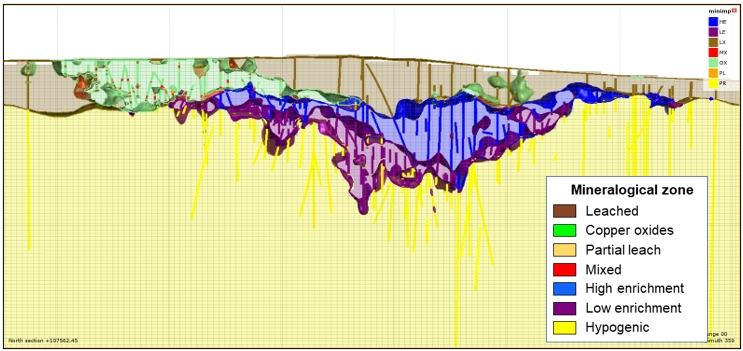
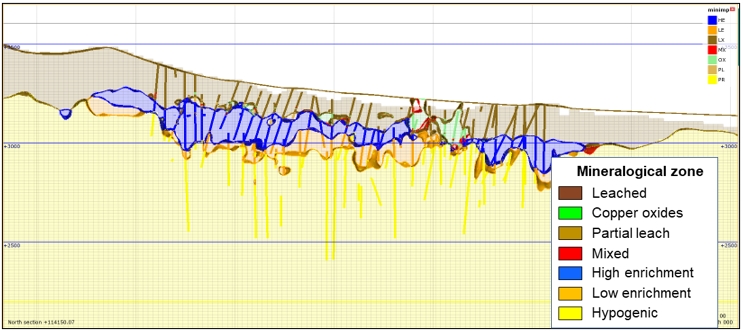
Examples of the Mineralogical Zones Cross-Sections for Escondida Section 107,550 (top) an Escondida Norte Section 114,150N (bottom) |
Figure 11‑4: |
Sulphide Examples of CSA Cross-Sections for Escondida Section 107,450N (above) and Escondida Norte Section 114,330N (below) |
Figure 11‑5: |
General View of the Pulse Variable, Escondida |
Figure 11‑6: |
Composite Length Distribution for Escondida (left) and Escondida Norte (right) |
Figure 11‑7: |
Box Plot for TCu Estimation Domain for Escondida |
Figure 11‑8: |
Box Plot for TCu Estimation Domain for Escondida Norte |
Figure 11‑9: |
Directional Variogram for TCu Estimation Domain 5 for Escondida |
Figure 11‑10: |
Directional Variogram for TCu Estimation Domain 6 for Escondida Norte |
Figure 11‑11: |
General View Escondida and Escondida Norte Block Model and Collar Distribution |
Figure 11‑12: |
Escondida 107,900N Copper Cross-section Looking North |
Figure 11‑13: |
Escondida Copper at 2770 RL |
Figure 11‑14: |
Escondida Norte 114,000N Copper Cross-section Looking North |
Figure 11‑15: |
Escondida Norte Copper at 2960 RL |
Figure 11‑16: |
Swath Plots Total Sulphide, Escondida |
Figure 11‑17: |
Swath Plots Total Sulphide, Escondida Norte |
Figure 11‑18: |
Tonnage Reconciliation, Sulphide Escondida |
Figure 11‑19: |
Total Copper Grade Reconciliation, Sulphide Escondida |
Figure 11‑20: |
Total Contained Copper Tonnes Reconciliation, Sulphide Escondida |
Figure 11‑21: |
Tonnage Reconciliation, Sulphide Escondida Norte |
Figure 11‑22: |
Total Copper Grade Reconciliation, Sulphide Escondida Norte |
Figure 11‑23: |
In-situ Metal Reconciliation, Sulphide Escondida Norte |
Figure 11‑24: |
Mineral Resources Classification and Data Density |
Figure 11‑25: |
Mined Sulphide Material by Mineral Resources Category, FY12 to FY22, Escondida |
Figure 11‑26: |
Mined Sulphide Material by Mineral Resources Category, FY12 to FY22, Escondida Norte |
Figure 11‑27: |
Escondida Sulphide Annual and Quarterly Deviations |
Figure 11‑28: |
Escondida Norte Annual and Quarterly Deviations |
Figure 11‑29: |
Mined Oxide and Mixed Material by Mineral Resources Category, FY12 to FY22, Escondida Norte |
Figure 12‑1: |
MEL Process for Mineral Reserves Estimation |
Figure 12‑2: |
Escondida Norte Pit and the Compañía Minera Zaldivar Lease Boundary |
Figure 12‑3: |
Sources and Actual Destination Flowsheet |
Figure 12‑4: |
Optimal Pit Selection for Escondida Pit |
Figure 12‑5: |
Optimal Pit Selection for Escondida Norte Pit |
Figure 12‑6: |
Feed by Reserve Category to Process |
Figure 13‑1: |
Geotechnical Estimate Flowsheet |
Figure 13‑2: |
Geotechnical Definitions |
Figure 13‑3: |
Escondida Pit Operational IRA (ToR 23) |
Figure 13‑4: |
Escondida Norte Pit Operational IRA (ToR 23) |
Figure 13‑5: |
Waste Dump Design Parameters |
Figure 13‑6: |
Factor of Safety Criteria for Pit Design |
Figure 13‑7: |
Escondida Hydrogeological Model |
Figure 13‑8: |
Escondida Norte Hydrogeological Model |
Figure 13‑9: |
Laguna Seca Tailing Storage Facility Hydrogeological Model |
Figure 13‑10: |
Escondida Sulphide Annual and Quarterly Deviations |
|
|
|
|
MEL_TRS_June 2022_Mike |
June 2022 |
|
|
SEC Technical Report Summary – Minera Escondida Limitada |
Page xiv |
|
|
Figure 13‑11: |
Escondida Norte Annual and Quarterly Deviations |
Figure 13‑12: |
Escondida Pit Pushbacks |
Figure 13‑13: |
Escondida Norte Pit Pushbacks |
Figure 13‑14: |
SEC Annual Production by Process (ktpa) |
Figure 13‑15: |
Total Material Movement (Mt) and Average Grade |
Figure 13‑16: |
Final Pit outlines of the MEL mining operations |
Figure 14‑1: |
Schematic of MEL Infrastructure |
Figure 14‑2: |
Primary Crusher System for Concentrators |
Figure 14‑3: |
Schematic of MEL Concentrator Process |
Figure 14‑4: |
Schematic of MEL Oxide Leach Process |
Figure 14‑5: |
Schematic of MEL Bioleach Process |
Figure 14‑6: |
Energy Consumption Distribution at MEL |
Figure 14‑7: |
Water Demand Distribution at MEL |
Figure 15‑1: |
Schematic of MEL Operations |
Figure 15‑2: |
MEL's Main Facilities |
Figure 15‑3: |
Regional Railway Scheme |
Figure 15‑4: |
Regional Roads Schema |
Figure 15‑5: |
Coloso Port |
Figure 15‑6: |
Coloso Port Process Schematic |
Figure 15‑7: |
Laguna Seca Tailing Storage Facility |
Figure 15‑8: |
Electric Transmission Lines Schematic |
Figure 15‑9: |
Water Lines Schematic |
Figure 15‑10: |
Infrastructure Layout Map |
Figure 16‑1: |
Global supply-demand balance |
Figure 16‑2: |
Historical LME copper price |
Figure 16‑3: |
Copper Supply Curve 2030 C3 Costs |
Figure 18‑1: |
Annual Capex Breakdown |
Figure 18‑2: |
Annual Opex Breakdown |
Figure 19‑1: |
SEC Production Schedule for MEL (100% MEL Terms) |
Figure 19‑2: |
Annual Cash Flow |
Figure 20‑1: |
CMZ Located Next to Escondida Norte Pit |
Figure 21‑1: |
In Plan vs Delayed vs Unplanned |
Figure 21‑2: |
Volumetric delay-recover per pushback, from July to March FY22 |
|
|
|
|
MEL_TRS_June 2022_Mike |
June 2022 |
|
|
SEC Technical Report Summary – Minera Escondida Limitada |
Page xv |
List of Abbreviations
The metric system has been used throughout this Report. Tonnes are metric of 1,000 kg, or 2,204.6 lb. All currency is in U.S. dollars (US$) unless otherwise stated.
|
|
Abbreviation |
Unit or Term |
# |
Mesh |
% |
percent |
° |
degree (degrees) |
°C |
degrees Centigrade |
°F |
degrees Fahrenheit |
µm |
micron or microns |
A |
ampere |
A/m2 |
amperes per square metre |
AAS |
atomic absorption |
Ag |
silver |
amsl |
above mean sea level |
ANFO |
ammonium nitrate fuel oil |
Ar / Ar |
Argon / Argo dating |
ARG |
Argillic |
As |
Arsenic |
ATV |
Acoustic Televiewer |
Au |
gold |
AuEq |
gold equivalent grade |
BHP |
BHP |
BIO |
Biotite |
BK_NN |
Nearest Neighbour block model |
BK_OK |
Ordinary kriging block model |
BWi |
Bond Work Index |
bwi |
Bond Work Index (Kwh/ton) |
CCD |
counter-current decantation |
CF |
Physical Composites |
cfm |
cubic feet per minute |
CIL |
carbon-in-leach |
cm |
centimetre |
cm2 |
square centimetre |
cm3 |
cubic centimetre |
CoG |
cut-off grade |
ConfC |
confidence code |
CRec |
core recovery |
CRM |
certified reference material |
CSA |
copper sulphide abundance |
cspcc |
Copper grade from Chalcocite (%) |
cspcpy |
Copper grade from Chalcopyrite (%) |
cspcv |
Copper grade from Covellite (%) |
CSS |
closed-side setting |
CTW |
calculated true width |
DDH |
diamond drill hole |
densidad |
Dry Density |
dia. |
diameter |
ED |
Estimation Domain |
EDXRF |
energy-dispersive X-ray fluorescence |
EIS |
Environmental Impact Statement |
EMP |
Environmental Management Plan |
FA |
fire assay |
FCAB |
Ferrocarril de Antofagasta a Bolivia |
Fe |
Iron |
|
|
|
|
MEL_TRS_June 2022_Mike |
June 2022 |
|
|
SEC Technical Report Summary – Minera Escondida Limitada |
Page xvi |
|
|
Abbreviation |
Unit or Term |
Ferronor |
Empresa de Ferrocarriles del Norte Grande |
FF |
Frequency Fracture |
ft |
foot (feet) |
ft2 |
square foot (feet) |
ft3 |
cubic foot (feet) |
FY |
fiscal year |
g |
gram |
g/L |
gram per litre |
g/t |
grams per tonne |
gal |
gallon |
g-mol |
gram-mole |
gpm |
gallons per minute |
ha |
hectares |
HDPE |
Height Density Polyethylene |
HE |
High Enrichment |
hp |
horsepower |
HTW |
horizontal true width |
ICP |
induced couple plasma |
ID2 |
inverse-distance squared |
ID3 |
inverse-distance cubed |
IFC |
International Finance Corporation |
ILS |
Intermediate Leach Solution |
IRS |
Intact Rock Strength |
IT |
Indirect Traction |
kA |
kiloamperes |
kg |
kilograms |
km |
kilometre |
km2 |
square kilometre |
koz |
thousand troy ounce |
kt |
thousand tonnes |
ktpd |
thousand tonnes per day |
kV |
kilovolt |
kW |
kilowatt |
kWh |
kilowatt-hour |
kWh/t |
kilowatt-hour per metric tonne |
L |
litre |
L/s |
litres per second |
L/s/m |
litres per second per metre |
lb |
pound |
LE |
Low Enrichment |
LHD |
Long-Haul Dump truck |
Lix |
Leach |
LLDDP |
Linear Low Density Polyethylene Plastic |
LOA |
Life of Asset |
LOI |
Loss On Ignition |
LOM |
Life-of-Mine |
m |
metre |
m.y. |
million years |
M1 |
ore type |
M2 |
ore type |
m2 |
square metre |
m3 |
cubic metre |
Ma |
Million years ago |
MARN |
Ministry of the Environment and Natural Resources |
MDA |
Mine Development Associates |
MEL |
Minera Escondida Ltda. |
|
|
|
|
MEL_TRS_June 2022_Mike |
June 2022 |
|
|
SEC Technical Report Summary – Minera Escondida Limitada |
Page xvii |
|
|
Abbreviation |
Unit or Term |
mg/L |
milligrams/litre |
mm |
millimetre |
mm2 |
square millimetre |
mm3 |
cubic millimetre |
MME |
Mine & Mill Engineering |
Mo |
Molybdenum |
Moz |
million troy ounces |
MRC |
moisture retention characteristics |
Mt |
million tonnes |
MTW |
measured true width |
MW |
million watts |
N |
North |
NGO |
non-governmental organisation |
NI 43-101 |
Canadian National Instrument 43-101 |
OC |
Open cut mining method |
OK |
Ordinary Kriging |
OSC |
Ontario Securities Commission |
oz |
troy ounce |
P80 |
Milling product size product size 150 microns |
PLC |
Programmable Logic Controller |
PLS |
Pregnant Leach Solution |
PMF |
probable maximum flood |
POT |
Potassic |
PPAs |
Power Purchase Agreements |
ppb |
parts per billion |
ppm |
parts per million |
PtXt |
Partial Extraction |
Py |
Pyrite (%) |
QA/QC |
Quality Assurance/Quality Control |
QP |
Qualified Person |
QSC |
Quartz sericite clay |
RC |
Reverse circulation drilling |
rec |
Recovery |
rec_flc |
Flotation recovery for Los Colorados concentrator (%) |
rec_fls |
Flotation recovery for Laguna Seca concentrator (%) |
rec_lixaci |
Acid leach recovery (%) |
rec_sl_350 |
Sulphide leach recovery (%) |
ROM |
Run-of-Mine |
RQD |
Rock Quality Description |
RRR&R |
Risk Review Resources and Reserves |
RS |
Oxidation Ratio |
s2 |
Sulphur (%) |
SAG |
Semi-autogenous grinding mills |
SCC |
Sericite chlorite clay |
SCu |
Soluble copper (%) |
SEC |
U.S. Securities & Exchange Commission |
sec |
second |
SG |
specific gravity |
SGV |
Green grey sericite |
SMU |
Selective Mine Unit |
SPI |
SAG Power Index |
spi |
Sag Power Index (min) |
SPT |
standard penetration testing |
st |
short ton (2,000 pounds) |
t |
tonne (metric ton) (2,204.6 pounds) |
TCS |
Triaxial Compression |
|
|
|
|
MEL_TRS_June 2022_Mike |
June 2022 |
|
|
SEC Technical Report Summary – Minera Escondida Limitada |
Page xviii |
|
|
Abbreviation |
Unit or Term |
TCu |
Total Copper |
TCu |
Total Copper (%) |
tpd |
tonnes per day |
tph |
tonnes per hour |
TPH |
Tonnes per hour |
TRS |
Technical Report Summary |
TSF |
tailings storage facility |
TSP |
total suspended particulates |
UCS |
Uniaxial Compression |
UG |
Underground mining method |
UG DUR |
Hardness estimation domain |
UG REC |
Recovery estimation domain |
U-Pb |
Uranium Lead dating |
US$ M |
United States Dollars (millions) |
UTM |
Universal Transverse Mercator coordinates |
U.T.M. |
Unidad Tributaria Mensual - a Chilean state tax unit being valued in Chilean Pesos (CLP) |
V |
volts |
VFD |
variable frequency drive |
W |
watt |
XRD |
x-ray diffraction |
y |
year |
|
|
|
|
MEL_TRS_June 2022_Mike |
June 2022 |
|
|
SEC Technical Report Summary – Minera Escondida Limitada |
Page 19 |
This report was prepared as a Pre-Feasibility Study-level Technical Report Summary (TRS) in accordance with the Securities and Exchange Commission (SEC) S-K regulations (Title 17, Part 229, Sections 601 and 1300 until 1305) for BHP Group Limited (BHP) on the Minera Escondida Ltda. property (MEL).
BHP Group Limited has a 57.5% ownership of MEL, a joint venture with Rio Tinto (30%) and Japan-based JECO Corp (12.5%). MEL is the operator of the Escondida property which comprises two open pits, three sulphide concentrator plants, two leaching plants and associated infrastructure. The Escondida property has been in operation continuously since production start-up in late 1990 and its capacity has since been increased through a number of phased expansions.
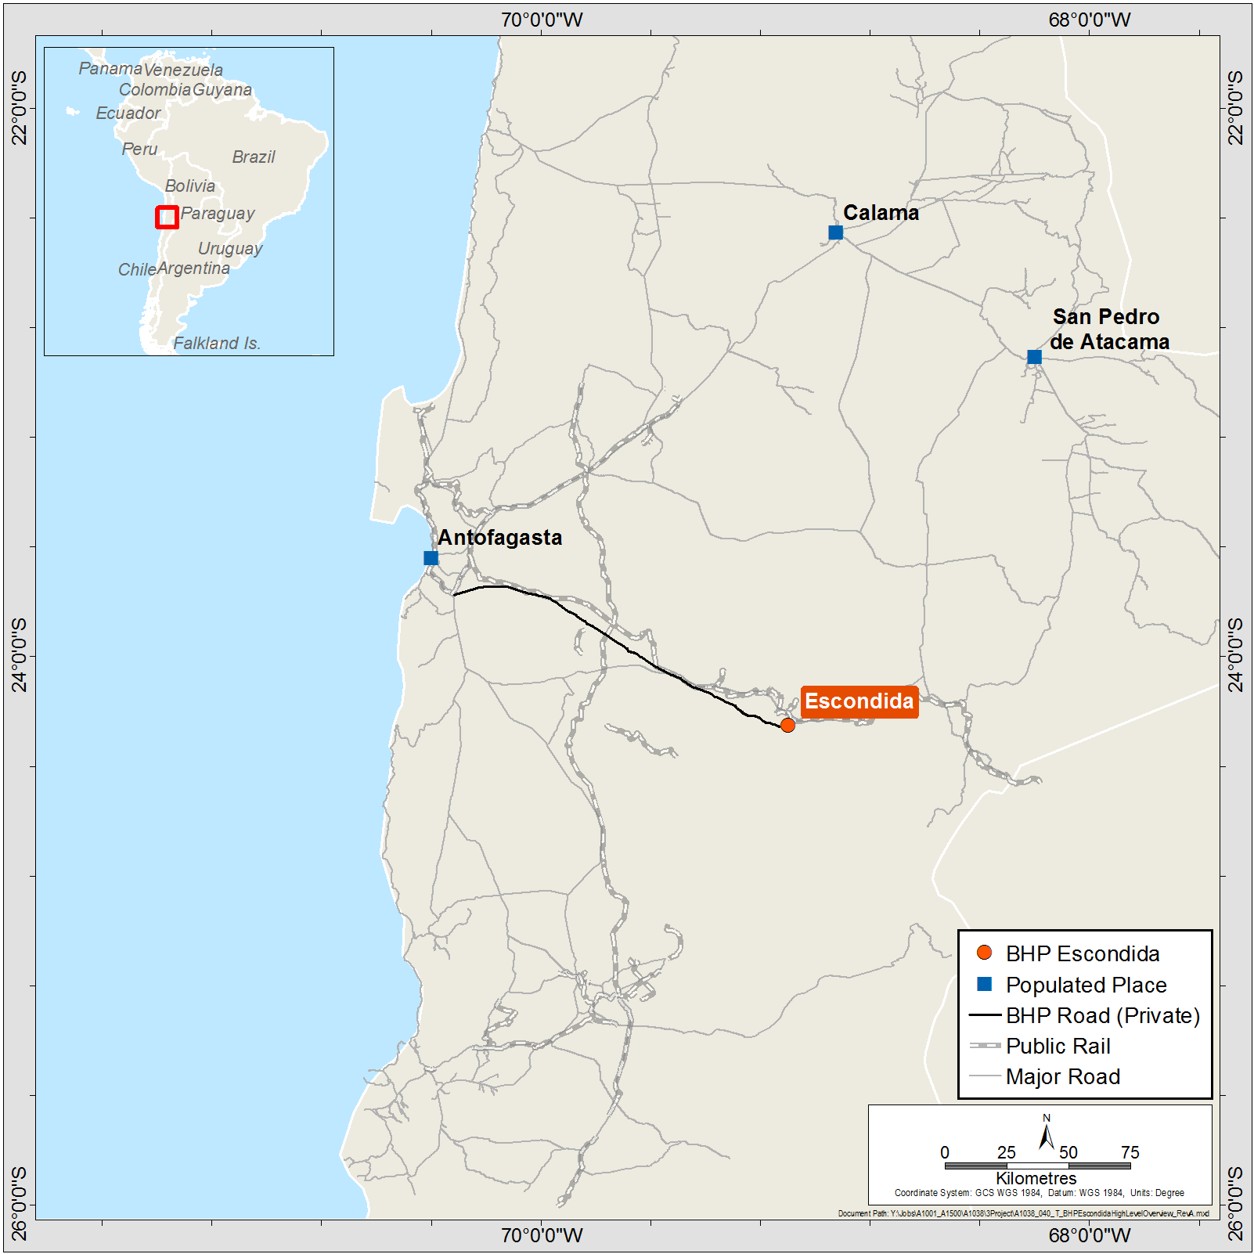
The Escondida property mine site is located in the Atacama Desert of northern Chile approximately 170 km south-east of Antofagasta at a general elevation of 3,100 m above mean sea level (amsl). The mine site and associated infrastructure is located within Chile’s II (Second) Region. Antofagasta is the regional capital city and an important port city for the mining industry located in the region.
The Escondida property currently mines two copper deposits of very similar characteristics, Escondida and Escondida Norte, being mined by open pit mining methods. Escondida is significantly larger than Escondida Norte and the two deposits are separated by less than 10 km: Escondida is located at approximately latitude 24°16’ south / longitude 69° 04’ west and Escondida Norte at approximately latitude 24°13’ south / longitude 69° 03’ west (Figure 1‑1).
1.2.Geology and Mineralization
Both Escondida and Escondida Norte are porphyry copper deposits, being the deposit type typical of the majority of Chilean/Andean copper deposits. The deposits lie in the Escondida-Sierra de Varas shear lens of the Domeyko Fault System. The deposits are supergene-enriched copper porphyries with primary mineralisation associated with multiple phase intrusions of monzonite to granodiorite composition into host volcanics. The deposits are related geographically and geologically to porphyry bodies intruded along a regional lineament which exerts strong control over the regional distribution of deposits of this age and type.
An important aspect of the MEL deposits is the “supergene enrichment” which has concentrated copper in the upper parts of the mineralised system as a result of natural uplift and weathering processes resulting from the geological evolution of the Atacama Desert region. This process both concentrated copper into certain zones (supergene enrichment), whilst also locally oxidising sulphide minerals to oxide minerals (oxidation) and resulted in the Escondida district presenting both elevated copper grades and a zone nature presenting a range of different copper mineralized zones. This resulting zonation presents a general layered nature with a localised discontinuous “secondary oxide” zone overlying a more continuous enriched or “supergene sulphide” zone which in turn overlies a thicker “hypogene sulphide” zone extending to depth. Pre-mining, the start of copper mineralisation was generally located at approximately 150 to 200 m depth below surface.
Copper oxide minerals are principally brochantite, antlerite, and chrysocolla along with iron oxides. Supergene zone minerals are dominated by the copper mineral chalcocite with lesser covellite and chalcopyrite occurring with the ubiquitous iron sulphide mineral pyrite. The hypogene sulphide zone is dominated by chalcopyrite and pyrite, with lesser bornite. The hypogene zone copper grades range between 0.2% and 1% copper. The enrichment zone presented copper grade of up to 4% as a result of the supergene enrichment.
|
|
|
|
MEL_TRS_June 2022_Mike |
June 2022 |
|
|
SEC Technical Report Summary – Minera Escondida Limitada |
Page 20 |
Source: MEL (2022)
|
|
Figure 1‑1: |
Location of MEL Mine with Road Access |
1.3.Existing Infrastructure
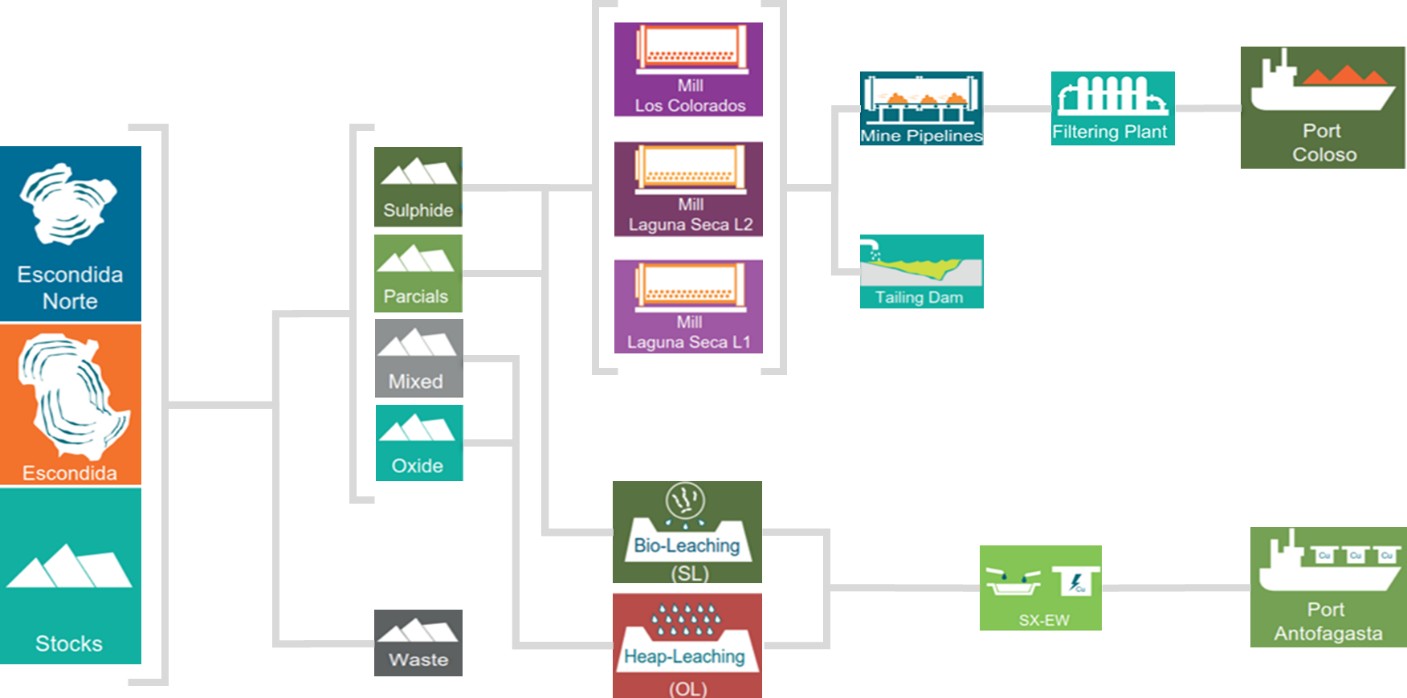
MEL has company-owned infrastructure distributed over a large area of the Antofagasta region reflecting the magnitude of its operational activities. This includes mineral extraction from two open pits, three sulphide concentrator plants, two leaching plant processes which feed a copper cathode production plant, two seawater desalination plants, a tailings storage facility, along with support and service facilities. These are summarised schematically in Figure 1‑2.
The concentrator plants are similar in terms of installed process technology and consist of primary grinding using semi autogenous mills (SAG), secondary milling using ball mills, rougher flotation circuits using conventional cells and cleaner flotation circuits using column cells. Details of the installed equipment can be found in Chapter 14.
|
|
|
|
MEL_TRS_June 2022_Mike |
June 2022 |
|
|
SEC Technical Report Summary – Minera Escondida Limitada |
Page 21 |
The leaching plants employ conventional solvent extraction-electrowinning (SX-EW) technology to produce cathode copper metal from copper bearing leach solutions from each of the sulphide leach and oxide leach operations. Oxide ore is crushed and graded for sulphuric acid heap leaching on a dynamic (“on-off”) leaching pad. Sulphide ore is hauled from the open pits and deposited as run of mine (ROM) for acid bioleaching on permanent leach pads.
Copper concentrates are pumped from the MEL operation via two pipelines each approximately 170 km length to Coloso port for filtering, stockpiling, and shipping.
The facilities at Coloso port are dedicated to dewatering using six pressurized filters, which reduce the moisture content to an average of 9% after arrival at the pipeline discharge. Effluent is treated and pumped to the mine site for reutilization. Copper cathode is transported by rail to public ports at Antofagasta.
Source: MEL (2022)
|
|
Figure 1‑2: |
Schematic of MEL Operations and Infrastructure |
MEL holds mining concessions in accordance with the current mining laws and national constitution of Chile. A mining concession allows the concession holder to mine the area indefinitely, dependent upon an annual payment of the corresponding license fees. All leases were obtained through the legally established process in which judicial requests are presented to the Chilean state. This legal framework gives MEL exclusive exploration and exploitation rights for all minerals in these concessions and therefore the ability to declare ownership of the mineral resources and mineral reserves reported herein.
MEL holds 764 mining concessions, covering a total area of 406,018 hectares (ha). There are 18 principal mining concessions that provide MEL with the right to explore and mine. These principal concessions, including both the Escondida and Escondida Norte deposits, are listed in Table 1‑1. The location and boundaries of these mining concessions are shown in Figure 3‑1 of Chapter 3.
In addition to mining concessions, Chilean law regulates the rights to use the land surface. These rights allow physical occupation and transit and are required in order to facilitate mining activity such as: the excavation of pits, accumulation of dumps, construction and use of leaching pads, deposition of tailings storage facilities and the construction of metallurgical processing plants, amongst others. MEL owns 155,000 ha of surface rights and these are also renewable on an annual basis which cover both current and foreseeable requirements for the operation. These rights are also obtained through legal process
|
|
|
|
MEL_TRS_June 2022_Mike |
June 2022 |
|
|
SEC Technical Report Summary – Minera Escondida Limitada |
Page 22 |
presented to the Chilean state and potentially to other third party owners, including the Chilean “Consejo de Defensa del Estado” as required. Surface rights are also renewed by the existing holder on an annual basis. The surface rights considered to be most significant to MEL’s operations are listed in Table 1‑2.
|
|
Table 1‑1: |
MEL Main Mining Concessions |
|
|
|
|
|
|
Number |
Lease Name |
Company Name |
Expiry Date |
Surface Area (hectares) |
Annual Rent and Rate1 (U.T.M.)2 |
1 |
Alexis 1/1424 |
Minera Escondida Ltda. |
Permanent |
7,059 |
705.9 |
2 |
Amelia 1/1049 |
Minera Escondida Ltda. |
Permanent |
5,235 |
523.5 |
3 |
Catita 1/376 |
Minera Escondida Ltda. |
Permanent |
1,732 |
173.2 |
4 |
Claudia 1/70 |
Minera Escondida Ltda. |
Permanent |
557 |
55.7 |
5 |
Colorado 501/977 |
Minera Escondida Ltda. |
Permanent |
2,385 |
238.5 |
6 |
Costa 1/1861 |
Minera Escondida Ltda. |
Permanent |
9,159 |
915.9 |
7 |
Donaldo 1/612 |
Minera Escondida Ltda. |
Permanent |
3,060 |
306.0 |
8 |
Ela 1/100 |
Minera Escondida Ltda. |
Permanent |
500 |
50.0 |
9 |
Gata 1 1/100 |
Minera Escondida Ltda. |
Permanent |
400 |
40.0 |
10 |
Gata 2 1/50 |
Minera Escondida Ltda. |
Permanent |
200 |
20.0 |
11 |
Guillermo 1/368 |
Minera Escondida Ltda. |
Permanent |
1,785 |
178.5 |
12 |
Hole 14 |
Minera Escondida Ltda. |
Permanent |
1 |
0.1 |
13 |
Naty 1/46 |
Minera Escondida Ltda. |
Permanent |
230 |
23.0 |
14 |
Paola 1/3000 |
Minera Escondida Ltda. |
Permanent |
15,000 |
1,500.0 |
15 |
Pista 1/22 |
Minera Escondida Ltda. |
Permanent |
22 |
2.2 |
16 |
Pistita 1/5 |
Minera Escondida Ltda. |
Permanent |
9 |
0.9 |
17 |
Ramón 1/640 |
Minera Escondida Ltda. |
Permanent |
3,200 |
320.0 |
18 |
Rola 1/1680 |
Minera Escondida Ltda. |
Permanent |
8,400 |
840.0 |
TOTAL |
58,934 |
5,893 |
1 The 2022 rate is 0.1 U.T.M. (Unidad Tributaria Mensual - which is a Chilean state tax unit being valued in Chilean Pesos (CLP) per ha.
2 Annual payments are made at end of the Chilean tax year (end March) for mining concession in U.T.M. The total annual payment for 2022 which supports this this group of concessions in March 2022 was equivalent to MCLP $327 (million Chilean Pesos) or approximately US$ 400,000 (U.T.M./CLP 55,537 and USD/CLP 787 as of 31st March 2022 (Source: Central Bank of Chile). This payment is that which confirms mining and extraction rights as of 30 June 2022.
|
|
Table 1‑2: |
MEL Main Surface Rights |
|
|
|
|
|
|
|
Infrastructure items covered |
Unique Surface Rights Identifier1 |
Area (hectares) |
Folio |
Number |
Year |
Register |
Regional Office |
Pits, Waste Dumps, Leach Pads, Plants |
619 V |
964 |
1984 |
Hipotecas y Gravámenes |
Bienes Raíces Antofagasta |
22,084 |
Energy Transmission Lines, Aqueducts, Mineral Pipelines, Roads |
1121 V |
1117 |
2018 |
Hipotecas y Gravámenes |
Bienes Raíces Antofagasta |
26,988 |
1 As defined by Chilean legal requirements
MEL also holds maritime concessions for the Coloso Port facilities. These concessions are requested through submission of the proposed project to the Chilean Ministry of Defence and are awarded by legal decree.
|
|
|
|
MEL_TRS_June 2022_Mike |
June 2022 |
|
|
SEC Technical Report Summary – Minera Escondida Limitada |
Page 23 |
BHP does not hold any royalty in the MEL property in addition to its economic interest of 57.5%. Likewise no royalty streams exist for any of the other shareholders.
1.6.Present Condition of the Property
The MEL property is a production stage property actively operating two open cut pits, Escondida and Escondida Norte. Surface mining is by drilling and blasting along with shovel/excavator loading and truck haulage from each of the two open pits. Extracted sulphide ore undergoes crushing prior to processing in one of three concentrators with concentrate piped to the Coloso Port for export. Lower grade sulphide ore is directly deposited onto run of mine (ROM) leach pads and is processed by acid bioleaching. Oxide and minor mixed ore are processed using acid heap leaching. Copper cathode from the leaching processes is transported by rail to third party operated ports.
Resource definition activities are continuous and ongoing to upgrade the geological characterisation that informs mineral resources estimation which in turns underpins the annual planning processes and mineral reserves estimation. The area around the current MEL operation has been extensively mapped, sampled, and drilled during over three decades of exploration work.
Construction commenced on the Escondida property in 1988 with first production in 1990. There then followed a number of expansion phases from 1993 onwards which included the development of additional infrastructure to increase production. Initially these were expansions to the single Los Colorados concentrator, but subsequently to other production infrastructure when in 1998 production of cathodes from the leaching of oxide ore was commenced. The Phase 4 concentrator and tailings storage facility were then inaugurated in 2002. Key milestones subsequent to first production in 1990 regarding the development of the operations were:
•1998 Acid heap leaching of oxides commenced
•2002 Second concentrator (Phase 4) inaugurated
•2005 Mining commenced at Escondida Norte
•2006 Dump bio-leaching of sulphides commenced
•2007 First desalination plant commenced pumping
•2016 Third concentrator (OGP1) inaugurated
•2017 Second desalination plant commenced pumping
•2020 Operation converted to 100% use of desalination water
The operations undertake planned maintenance programs and implement scheduled replacement of mine fleet and infrastructure components that is intended to maintain the continued reliable operation of equipment, facilities and infrastructure to meet operational requirements.
1.7.History of previous operations
Minera Escondida Limitada (MEL) operates the Escondida property. Current ownership, which has been stable since 2010 is BHP (57.5%), Rio Tinto (30%), JECO Corporation (10%) and JECO 2 Limited (2.5%).
Utah International Inc. (Utah) and Getty Oil Co. (Getty) commenced geochemical exploration in the region in 1978 which led to the discovery of Escondida deposit in 1981. In 1984 through corporate acquisitions, BHP acquired the Escondida property. Ownership changed in 1985 to a joint venture between BHP (57.5%), Rio Tinto Zinc (30%), JECO Corporation (10%) and World Bank (2.5%).
The current joint venture undertook all the subsequent exploration and development work to bring MEL into operation at the end of 1990.
|
|
|
|
MEL_TRS_June 2022_Mike |
June 2022 |
|
|
SEC Technical Report Summary – Minera Escondida Limitada |
Page 24 |
1.8.Significant Encumbrances to the Property
The QP is not aware of any significant encumbrances that would impact the current mineral resources or mineral reserves disclosure as presented herein in any material respect.
1.9.Summary of All Mineral Resources and Mineral Reserves
The mineral resources estimate has been prepared using industry accepted practice and conforms to the disclosure requirements of the SEC S-K 1300 Regulations. Although all the technical and economic issues likely to influence the prospect of economic extraction of the resource are anticipated to be resolved under the stated assumed conditions, no assurance can be given that the estimated mineral resources will become proven and probable mineral reserves. The mineral resources estimate includes both the Escondida and Escondida Norte deposits.
The mineral reserves estimates are based on a Life of Mine (LoM) plan that has been developed according to SEC S-K 1300 Regulations and has been developed using industry accepted strategic planning approaches which defined the life of the mines on the Escondida property. Inferred mineral resources have been treated as waste. The final reserves plan is the outcome of the application of appropriate modifying factors in order to establish an economically viable and operational mine plan. At the Escondida property a variable cut-off grade strategy is applied to develop the mine plan. The mineral reserves estimate includes both the Escondida and Escondida Norte deposits.
The details of the relevant modifying factors included in the estimation of mineral resources and mineral reserves are discussed in Chapter 11 and Chapter 12 respectively.
•Mineral resources estimates for MEL at the end of the Fiscal Year Ended 30 June 2022 are provided in Table 1‑3.
•Mineral reserves estimates for MEL at the end of the Fiscal Year Ended 30 June 2022 are provided in Table 1‑4.
|
|
Table 1‑3: |
Escondida Property BHP Ownership Basis (57.5%) – Summary of Mineral Resources Exclusive of Mineral Reserves as of 30th June 2022 |
|
|
|
|
|
|
|
|
|
|
Copper Chile Escondida |
Mining Method |
Measured Resources |
Indicated Resources |
Measured + Indicated Resources |
Inferred Resources |
Tonnage |
Quality |
Tonnage |
Quality |
Tonnage |
Quality |
Tonnage |
Quality |
Mt |
%Cu |
Mt |
%Cu |
Mt |
%Cu |
Mt |
%Cu |
Oxide |
OC |
4.0 |
0.48 |
5.0 |
0.47 |
9.0 |
0.48 |
2.0 |
0.75 |
Mixed |
OC |
4.0 |
0.53 |
9.0 |
0.44 |
13 |
0.47 |
11 |
0.49 |
Sulphide |
OC |
596 |
0.49 |
1,020 |
0.49 |
1,620 |
0.49 |
5,370 |
0.53 |
Escondida Total |
|
604 |
0.49 |
1,030 |
0.49 |
1,640 |
0.49 |
5,380 |
0.53 |
Notes:
1.The sole purpose of the presented information above is to demonstrate the economic viability of the mineral reserves for the purposes of reporting in accordance with S-K 1300 only and should not be used for other purposes. The annual cash flow data was prepared based upon Pre-Feasibility-level studies and three year historical prices and costs described in this Technical Report Summary; it is subject to change as assumptions and inputs are updated. The information presented does not guarantee future financial or operational performance. The presented information contains forward-looking statements. Please refer to "Note Regarding Forward Looking Statements" at the front of this Technical Report Summary.
2.Mineral resources are being first time reported in accordance with S-K 1300 and are presented for the portion attributable to BHP's economic interest. All tonnes and quality information have been rounded, small differences may be present in the totals.
3.Mineral resources are presented exclusive of mineral reserves.
4.Escondida, in which BHP has a 57.5% interest, is considered a material property for purposes of Item 1303 of S-K 1300.
5.Escondida point of reference for the mineral resources was mine gate.
6.Escondida mineral resources estimates were based on a copper price of US$3.04/lb.
7.Escondida mineral resources cut-off criteria used was Oxide ≥ 0.20% soluble Cu; Mixed ≥ 0.30% Cu; Sulphide ≥ 0.25% Cu for mineralisation assigned to be processed via leaching or ≥ 0.30% Cu for mineralisation assigned to be processed via the concentrator.
8.Escondida metallurgical recoveries for Oxide 62%; Mixed 42%; Sulphide 42% for material processed by leaching or 83% for material processed via the concentrator.
|
|
|
|
MEL_TRS_June 2022_Mike |
June 2022 |
|
|
SEC Technical Report Summary – Minera Escondida Limitada |
Page 25 |
|
|
Table 1‑4: |
Escondida Property BHP Ownership Basis (57.5%) - Summary of Mineral Reserves as at 30th June 2022 |
|
|
|
|
|
|
|
|
Copper Chile Escondida |
Mining Method |
Proven Reserves |
Probable Reserves |
Total Reserves |
Tonnage |
Quality |
Tonnage |
Quality |
Tonnage |
Quality |
Mt |
%Cu |
Mt |
%Cu |
Mt |
%Cu |
Oxide |
OC |
75 |
0.57 |
31 |
0.51 |
106 |
0.55 |
Sulphide |
OC |
1,560 |
0.70 |
939 |
0.56 |
2,500 |
0.65 |
Sulphide Leach |
OC |
755 |
0.46 |
197 |
0.40 |
952 |
0.45 |
Escondida Total |
|
2,390 |
0.62 |
1,170 |
0.53 |
3,560 |
0.59 |
Notes:
1.The sole purpose of the presented information above is to demonstrate the economic viability of the mineral reserves for the purposes of reporting in accordance with S-K 1300 only and should not be used for other purposes. The annual cash flow data was prepared based upon Pre-Feasibility-level studies and three year historical prices and costs described in this Technical Report Summary; it is subject to change as assumptions and inputs are updated. The information presented does not guarantee future financial or operational performance. The presented information contains forward-looking statements. Please refer to "Note Regarding Forward Looking Statements" at the front of this Technical Report Summary.
2.Mineral reserves are being first time reported in accordance with S-K 1300 and are presented for the portion attributable to BHP's economic interest. All tonnes and quality information have been rounded, small differences may be present in the totals.
3.Escondida, in which BHP has a 57.5% interest, is considered a material property for purposes of Item 1303 of S-K 1300.
4.Escondida point of reference for the mineral reserves was mine gate.
5.Escondida mineral reserves estimates were based on a copper price of US$2.79/lb.
6.Escondida mineral reserves cut-off criteria used was Oxide ≥ 0.20% soluble Cu. For Sulphide ≥ 0.30% Cu and where greater than the variable cut-off of the concentrator. Sulphide ore is processed in the concentrator plants as a result of an optimised mine plan with consideration of technical and economic parameters in order to maximise net present value. Sulphide Leach ≥ 0.25% Cu and 70% or less of copper contained in chalcopyrite and lower than the variable cut-off grade. Sulphide leach ore is processed in the leaching plant as an alternative to the concentrator process.
7.Escondida metallurgical recoveries for Oxide 62%; Sulphide Leach 42%; Sulphide 42% for material processed by leaching or 83% for material processed via the concentrator.
1.10.Changes to Mineral Resources and Reserves between 30 June 2021 and 2022
Mineral resources are being reported for the first time under the new S-K 1300 Regulation for the fiscal year ending 30 June 2022. There are no comparable estimates for the preceding year ending 30 June 2021.
Similarly, mineral reserves are also being reported for the first time under the new S-K 1300 Regulation for the fiscal year ending 30 June 2022. In the preceding year ending 30 June 2021 BHP had reported Ore Reserves for MEL in accordance with the US SEC Industry Guide 7 and are not directly comparable as the assumptions for the estimates are different.
With the aforementioned established, it may be commented that the S-K 1300 Regulation declaration as of 30 June 2022 is 3,570 Mt versus the preceding Guide 7 declaration which was 6,970 Mt. The primary driver of this reduction is the change in methodology under the S-K 1300 Regulations, which require mineral reserves to be reported on an ownership basis whereas previously under Guide 7 reporting was this was made based upon a 100% basis.
1.11.Material Assumptions and Criteria
Material assumptions in the estimation of mineral resources are the estimation methodology applied based on Ordinary Kriging, the sample data preparation including data capping and the pit optimisation to determine the resources that have reasonable prospects of economic extraction and associated commodity price. The monthly third quartile three-year historic prices for copper are used to define the mineral resources estimate, shown in Table 1‑5. Material assumptions are discussed in detail in Chapter 11.
Material assumptions in the estimation of mineral reserves are the classified resource model, variable cut-off grade strategy, mining dilution and mining recovery, processing plant throughput and yields, exchange rate, geotechnical parameters commodity prices, operating and capital costs. These are discussed in detail in Chapter 12.
|
|
|
|
MEL_TRS_June 2022_Mike |
June 2022 |
|
|
SEC Technical Report Summary – Minera Escondida Limitada |
Page 26 |
|
|
Table 1‑5: |
Mineral Resources Price Assumptions |
|
|
|
Assumption |
Value |
Unit |
COPPER - LME-Copper, Grade A Cash - A.M. OFFICIAL – Third Quartile |
3.04 |
US$/lb |
Note: The sole purpose of the presented information above is to demonstrate the economic viability of the mineral reserves for the purposes of reporting in accordance with S-K 1300 only and should not be used for other purposes. The annual cash flow data was prepared based upon Pre-Feasibility-level studies and three year historical prices and costs described in this Technical Report Summary; it is subject to change as assumptions and inputs are updated. The information presented does not guarantee future financial or operational performance. The presented information contains forward-looking statements. Please refer to "Note Regarding Forward Looking Statements" at the front of this Technical Report Summary.
The monthly median three-year historic prices for copper are used to define the Mineral reserves estimate, shown in Table 1‑6.
|
|
Table 1‑6: |
Mineral Reserves Price Assumptions |
|
|
|
Assumption |
Value |
Unit |
COPPER - LME-Copper, Grade A Cash - A.M. OFFICIAL - Median |
2.79 |
US$/lb |
Note: The sole purpose of the presented information above is to demonstrate the economic viability of the mineral reserves for the purposes of reporting in accordance with S-K 1300 only and should not be used for other purposes. The annual cash flow data was prepared based upon Pre-Feasibility-level studies and three year historical prices and costs described in this Technical Report Summary; it is subject to change as assumptions and inputs are updated. The information presented does not guarantee future financial or operational performance. The presented information contains forward-looking statements. Please refer to "Note Regarding Forward Looking Statements" at the front of this Technical Report Summary.
1.12.Qualified Person's Conclusions and Recommendations
MEL has mineral resources and mineral reserves supported by drilling programmes, all within the boundaries of MEL’s mining concessions and surface rights and close to existing infrastructure. The vertically integrated nature of the mining and processing facilities, located proximal to the ore body, provides the flexibility to add and optimise growth tonnes to existing infrastructure.
Mineral resources confidence is reflected in the applied classifications in accordance with the SEC S-K 1300 Regulations with factors influencing classification including but not limited to data density, data quality, geological continuity and/or complexity, estimation quality and weathering zones. Reconciliation data from the existing operation supports the confidence of resource estimates. There has been over 30 years of production history at the Escondida property that has been used to validate and calibrate the mineral resources estimate and modifying factors employed. The high proportion of indicated/measured mineral resources and the reconciliation history give high confidence in the estimation and reporting of the mineral resources.
Future work planned within the annual planning cycle is expected to continue to acquire data to both improve the local estimate within all mineral resources categories and extend this level of understanding to new volumes for the deposit as required.
Confidence in the mineral reserves is reflected in the applied mineral reserves classifications in accordance with the SEC S-K 1300 Regulations with factors influencing classification including but not limited to mining methods, processing methods, economic assessment and other life of asset and closure assessments. Reconciliation data from the existing operation supports the confidence of reserve estimates.
Uncertainties that affect the reliability or confidence in the mineral reserves estimate include but are not limited to:
•Future macro-economic environment, including metal prices and foreign exchange rate
•Revised capital estimates of major infrastructure projects as they move into definition phase studies, including two-stage smelter and materials handling system
|
|
|
|
MEL_TRS_June 2022_Mike |
June 2022 |
|
|
SEC Technical Report Summary – Minera Escondida Limitada |
Page 27 |
•Changes to operating cost assumptions, including labour costs
•Ability to continue sourcing water
•Changes to mining, hydrological, geotechnical parameters, and assumptions
•Ability to maintain environmental and social license to operate
The economic sensitivity analysis presented in Chapter 19 demonstrate that mineral reserves estimate is not materially sensitive to variations in the input assumptions. Economic value is most sensitive to the commodity price however still remains positively economic for the life of mineral reserves.
Based on the confidence in the modifying factors and the information presented in this TRS, the QP is of opinion that the mineral reserves estimate is supported by adequate technical data and assumptions.
2.1.Registrant for Whom the Technical Report Summary was Prepared
This Technical Report Summary (TRS) was prepared in accordance with the SEC S-K 1300 Regulations for BHP Group Limited to support its declaration of mineral resources and mineral reserves on the MEL property, comprising the Escondida and Escondida Norte deposits, for the fiscal year ended on 30 June 2022.
2.2.Terms of Reference and Purpose of the Report
This TRS was prepared to support the disclosure of mineral resources and mineral reserves for the Escondida Property (MEL), for the fiscal year ended on 30 June 2022 in compliance with the SEC S-K 1300 Regulations. This report does not include any exploration results that are not part of MEL’s mineral resources or mineral reserves.
Mineral resources and mineral reserves are reported herein at a Preliminary Feasibility Study-level. The effective date of this Technical Report Summary is 30 June 2022.
It should be noted that reference is made in this report to the BHP financial years using the prefix “FY”. For example FY22 means the BHP Fiscal year 2022 ending as of 30th June 2022.
2.3.Sources of Information
Most of the information and data used in the development of this TRS was provided by Minera Escondida Ltda. and associated MEL entities as well as sourced from publicly available information. Any key references are provided, where applicable, in Chapter 24, available at the time of writing this TRS.
Unless otherwise stated, all figures and images were prepared by MEL. Units of measurement referenced in this TRS are based on local convention in use at the property and currency is expressed in US dollars unless otherwise stated.
Maps and plans contained within the document are reported using different coordinate systems. The following are used in the document:
•UTM Projection PSAD56 (Provisional South American Datum 1956)
•UTM Projection WGS84 (World Geodetic System 1984)
Local mine coordinates. Local mine coordinates are based off UTM Projection PSAD56.
Reliance upon information provided by the registrant is listed in Chapter 25 when applicable.
|
|
|
|
MEL_TRS_June 2022_Mike |
June 2022 |
|
|
SEC Technical Report Summary – Minera Escondida Limitada |
Page 28 |
2.4.Details of Inspection
BHP has relied on the Qualified Persons listed in Table 2‑1 to prepare the information and this report supporting its disclosure of mineral resources and mineral reserves, with the sections noted for which each Qualified Person is responsible. All Qualified Persons are full time employees of MEL.
All Qualified Persons would normally undertake regular site visits to the MEL mine site on at least a monthly basis.
|
|
Table 2‑1: |
List of Qualified Persons |
|
|
|
|
|
|
QP Name |
Relation to Registrant and their Role |
Qualification |
Professional Organisation and Membership level |
Years of Relevant Experience |
Responsible for disclosure of |
Rodrigo Maureira |
Full-time employee / Senior Geologist |
Bachelor of Geology (Chile) |
AusIMM Member (#327820) |
22 years in copper projects and operations |
Mineral Resources – Chapter 8, 9 and 11 in full, Chapter 7 excluding Sections 7.3 and 7.4, and Chapter 1-5 and 20-25 jointly with Mineral Reserve QP |
Camila Bustos |
Full-time employee / Senior Planning Engineer |
Mining Engineer |
AusIMM Member (#3172488) |
11 years in copper projects and operations within the mining industry |
Mineral Reserves – Chapter 12, 15, 16, 18 and 19 in full, Chapter 13 excluding 13.3.1 and 13.3.2, and Chapter 1- 5 and 20-25 jointly with Mineral Resources QP |
Andrés Salazar |
Full-time employee / Senior Geologist |
Bachelor of Geology (Chile) |
AusIMM Member (#332364) |
19 years in copper projects and operations of total 25 years in the mining industry |
Geology – Chapter 6 in full |
Carlos Delgado |
Full-time employee / Superintendent Geometallurgy |
B. Sc. Chemical Engineering (Chile)
Degree Metallurgical Engineering (Chile) |
AusIMM Member (#3046359) |
24 years in copper projects and operations of total 24 years in mineral industry |
Mineral Processing and Metallurgical Testing – Chapter 10 in full
Processing and Recovery Methods - Chapter 14 in full |
Andres Naranjo |
Full-time employee / Superintendent Asset Resource Management |
Metallurgical Engineer; Master in Engineering Sciences (Chile) |
AusIMM Member (#3002271) |
24 years in copper projects and operations |
Infrastructure Chapter 15 in full
Environmental Studies, Permitting, Plans and Agreements – Chapter 17 excluding Section 17.2.1 |
|
|
|
|
MEL_TRS_June 2022_Mike |
June 2022 |
|
|
SEC Technical Report Summary – Minera Escondida Limitada |
Page 29 |
|
|
|
|
|
|
Pablo Vasquez |
Full-time employee / Superintendent Geotechnical Long Term |
Mining Engineer (Chile)
B. Sc. Geomechanics (Chile) |
AusIMM Member (#3125198) |
24 years in copper projects and operations |
Geotechnical & Hydrogeology (Sections 7.3 and 7.4), Hydrogeology (Section 13.3.2), Pit Geotechnical (Section 13.3.1 |
German Urrutia |
Full-time employee / Superintendent Tailings |
Civil Engineer (Chile) |
AusIMM Member (##3187911) |
5 years in tailings facilities and management |
Tailings Management (Section 17.2.1) |
2.5.Report Version Update
BHP has previously reported mineral reserves for Minera Escondida Ltda. under US SEC Guide 7, but has not previously filed a TRS with the SEC. This document is not an update of a previously filed TRS. BHP has not previously reported mineral resources for Minera Escondida Ltda. in a filing with the SEC.
This version reflects certain restatements solely for the purpose of updating certain biographical and related information concerning the qualified persons identified in this report. No other information has been modified from the version of this report most recently filed with the SEC.
Escondida and Escondida Norte are in the Atacama Desert in the eastern foothills of the Atacama Desert and the Domeyko Mountain Range, about 170 kilometres (km) southeast of the city of Antofagasta, Chile, which is the capital city of the II Region (Figure 3‑1).
The average elevation is 3,100 m above mean sea level (amsl). The geographical location of the Escondida and Escondida Norte mining district, using UTM coordinate system, is 7,314,270N and 7,317,667N, 490,284E and 494,281E for Escondida, and 7,320,665N and 7,322,663N, 493,281E and 496,279E for Escondida Norte.
|
|
|
|
MEL_TRS_June 2022_Mike |
June 2022 |
|
|
SEC Technical Report Summary – Minera Escondida Limitada |
Page 30 |
Maps presented in this chapter use UTM PSAD56 coordinates.
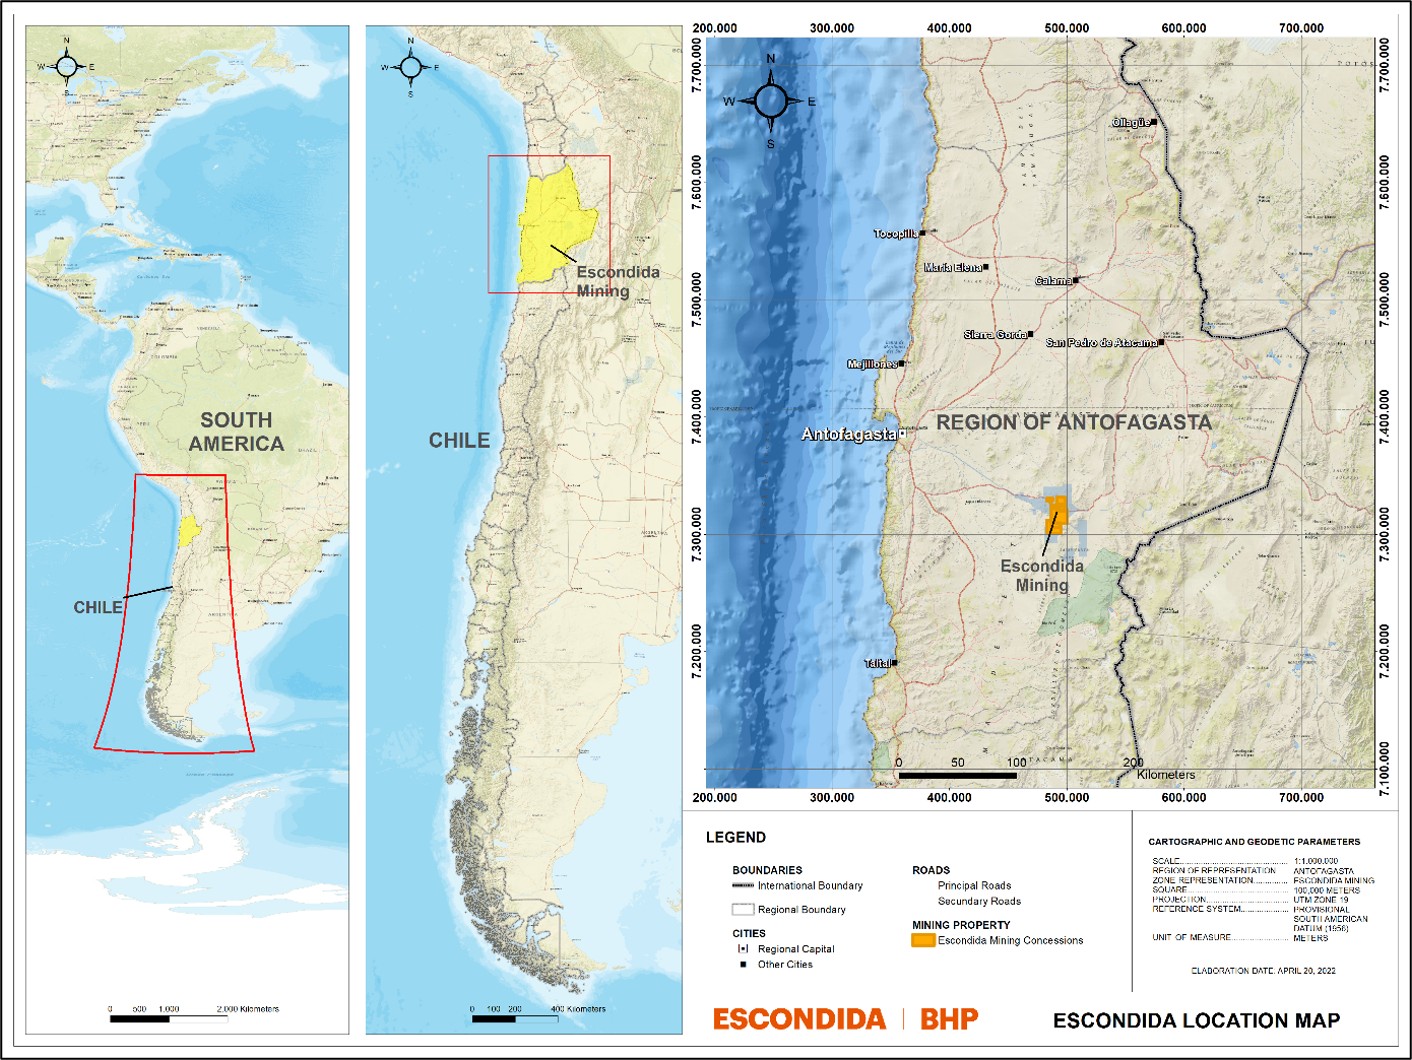
Source: MEL (2022)
|
|
Figure 3‑1: |
Escondida Location Map |
The total area with mineral rights held by MEL is approximately 178 km2 and is held under a mining lease. Areas of the active mining are located on various parcels of land within the local Municipality and leased or owned by MEL for operation support activities (e.g. industrial areas, accommodation villages, airport etc.). In addition to various freehold properties, MEL has other occupation licenses to operate.
MEL operations are fully covered by 764 mining concessions, totalling 406,018 ha. All concessions are in good legal standing.
Of this total, Table 3‑1 details the 18 principal mining concessions (Figure 3‑2) where the mineral resources and reserves are located with their corresponding surface area in hectares (ha) and the annual payment which was made as of 31st March 2022 (as per Chilean requirements). The annual payments are valued in “Unidad Tributaria Mensual” (U.T.M.) which is a Chilean state tax unit being valued in Chilean Pesos (CLP). As reported by MEL, the total annual payment for 2022 paid for this group of concessions in March 2022 with a surface area of 58,934 ha, was equivalent to MCLP$327 (million Chilean Pesos) or approximately US$400,0001 as of 30 June 2022.
1 U.T.M./CLP 55,537. USD/CLP 787. As of 31st March 2022 (Source: Central Bank of Chile)
|
|
|
|
MEL_TRS_June 2022_Mike |
June 2022 |
|
|
SEC Technical Report Summary – Minera Escondida Limitada |
Page 31 |
|
|
Table 3‑1: |
MEL Mining Concessions |
|
|
|
|
|
|
Lease
Number |
Lease Name |
Company Name /
Joint Venture |
Expiry
Date |
Surface Area
(hectares) |
Annual
Payment
(U.T.M.) |
1 |
Alexis 1/1424 |
Minera Escondida Ltda. |
Permanent |
7,059 |
705.9 |
2 |
Amelia 1/1049 |
Minera Escondida Ltda. |
Permanent |
5,235 |
523.5 |
3 |
Catita 1/376 |
Minera Escondida Ltda. |
Permanent |
1,732 |
173.2 |
4 |
Claudia 1/70 |
Minera Escondida Ltda. |
Permanent |
557 |
55.7 |
5 |
Colorado 501/977 |
Minera Escondida Ltda. |
Permanent |
2,385 |
238.5 |
6 |
Costa 1/1861 |
Minera Escondida Ltda. |
Permanent |
9,159 |
915.9 |
7 |
Donaldo 1/612 |
Minera Escondida Ltda. |
Permanent |
3,060 |
306.0 |
8 |
Ela 1/100 |
Minera Escondida Ltda. |
Permanent |
500 |
50.0 |
9 |
Gata 1 1/100 |
Minera Escondida Ltda. |
Permanent |
400 |
40.0 |
10 |
Gata 2 1/50 |
Minera Escondida Ltda. |
Permanent |
200 |
20.0 |
11 |
Guillermo 1/368 |
Minera Escondida Ltda. |
Permanent |
1,785 |
178.5 |
12 |
Hole 14 |
Minera Escondida Ltda. |
Permanent |
1 |
0.1 |
13 |
Naty 1/46 |
Minera Escondida Ltda. |
Permanent |
230 |
23.0 |
14 |
Paola 1/3000 |
Minera Escondida Ltda. |
Permanent |
15,000 |
1,500.0 |
15 |
Pista 1/22 |
Minera Escondida Ltda. |
Permanent |
22 |
2.2 |
16 |
Pistita 1/5 |
Minera Escondida Ltda. |
Permanent |
9 |
0.9 |
17 |
Ramón 1/640 |
Minera Escondida Ltda. |
Permanent |
3,200 |
320.0 |
18 |
Rola 1/1680 |
Minera Escondida Ltda. |
Permanent |
8,400 |
840.0 |
TOTAL |
58,934 |
5,893.0 |
Source: MEL (2022)
|
|
|
|
MEL_TRS_June 2022_Mike |
June 2022 |
|
|
SEC Technical Report Summary – Minera Escondida Limitada |
Page 32 |
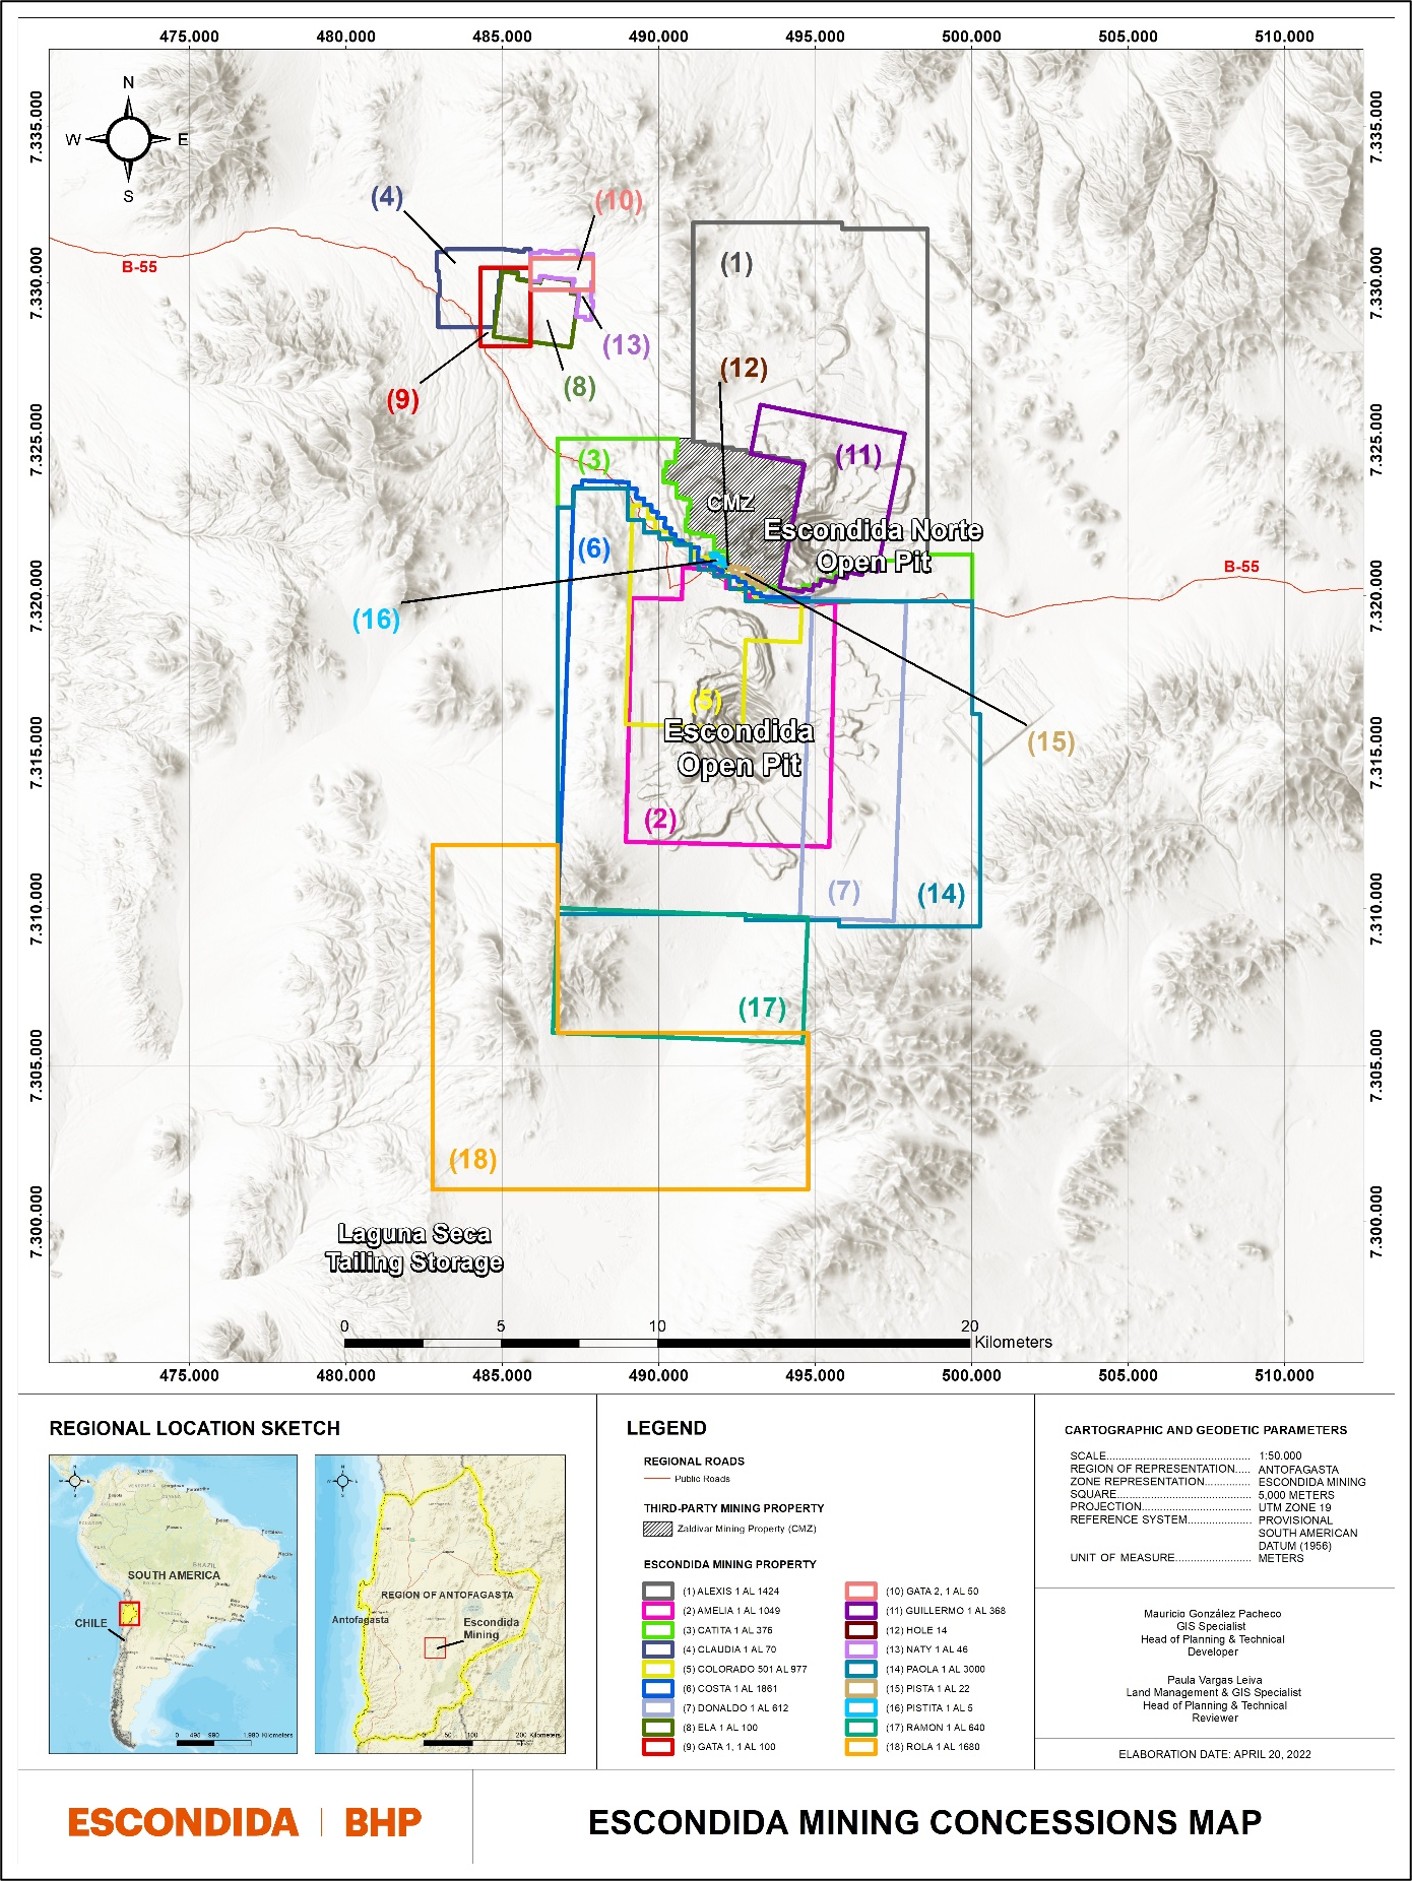
Source: MEL (2022)
|
|
Figure 3‑2: |
Minera Escondida Ltda. Mining Concessions |
|
|
|
|
MEL_TRS_June 2022_Mike |
June 2022 |
|
|
SEC Technical Report Summary – Minera Escondida Limitada |
Page 33 |
3.3.Mineral Rights Description and How They Were Obtained
All the mining leases are registered in the Antofagasta Mining Registry, and their current domain registers are held entirely (100%) in the name of Minera Escondida Ltda. These rights were acquired to a greater extent through a mining concession granted by the Government of Chile, and to a lesser extent, were purchased from other mining concessionaires.
Mining leases are granted for an indefinite duration; however, the mining legislation requires the annual payment of a mining patent in March, those that are paid to the Government of Chile, through the General Treasury of the Republic. In case of non-payment, the concession is subject to be auctioned at public auction. To avoid the loss of mining rights, the owner must pay the annual patent within the legal terms established by the Chilean Mining Code.
All significant permitting requirements that support the current mineral resources and mineral reserves estimates are either all in place or are expected to be renewed as required within the Chilean mining industry practice.
The QP is not aware of any material encumbrances that would impact the current mineral resources or mineral reserves disclosure as presented herein.
During calendar year 2022, an update of the Chilean Mining Code was published, in which the cost of mining patents is increased from 0.1 U.T.M. per hectare to 0.4 U.T.M. per hectare, applicable from 2023, which increases the annual payment for maintenance of the portfolio of mining concessions. Other Significant Factors and Risks
All permits and approvals required to extract mineral resources and mineral reserves on the BHP leases are currently in place, but in the QP’s opinion, should the plan be modified in the future, additional permits may be required.
There is a currently ongoing legal process against Minera Escondida Ltda. regarding a demand through the Chilean High Court concerning unplanned impacts upon ground water levels within the Salar de Atacama from historical operations. Since December 31, 2019, MEL has ceased water extraction from the Salar de Atacama, and currently operates on 100% desalinated water. MEL maintains that at no time did it exceed the limits set in the Resolucion de Claification Ambiental (Environmental Qualification Resolution). In the opinion of the QP this legal process does not impact the validity of this mineral resources and mineral reserves disclosure and is expected to be resolved through due legal process.
3.5.Royalties or Similar Interest
There are no royalties associated with MEL that are leased. BHP is majority owner of the property and does not hold any royalty other than its economic interest.
4.Accessibility, Climate, Local Resources, Infrastructure and Physiography
The Escondida and Escondida Norte mining district is located 170 km southeast of Antofagasta, Chile, in the Atacama Desert. The mine site is connected to the city by the Camino Escondida, a well maintained asphalted road, which is open year-round.
Antofagasta is the regional capital of Chile’s second region, with a population of approximately 362,000 inhabitants, according to the 2017 Census. Approximately 44.6% of MEL workforce lives in the Antofagasta Region (MEL, 2022).
|
|
|
|
MEL_TRS_June 2022_Mike |
June 2022 |
|
|
SEC Technical Report Summary – Minera Escondida Limitada |
Page 34 |
4.1.Topography, Elevation, and Vegetation
The Escondida district is in the Atacama Desert in the II Region of Antofagasta. The deposit lies at an altitude of 3,100 m amsl in the eastern foothills of the Atacama Desert and the Domeyko Mountain Range.
The area is characterised by its extreme aridity due to a general absence of rainfall, high solar radiation and elevated saline concentration in the soil. These environmental conditions cause an almost total absence of vegetation. The limited vegetation that exists tends to occur in limited areas of water accumulation, temporary surface run-off, and/or the presence of underground water bodies. No permanent surface flows in the area have been identified.
The soils correspond to depositional materials without a pedogenetic development. Given its characteristics, it does not present suitable conditions for the development of forestry and ranching activities.
The MEL mine site is connected to the city of Antofagasta by the paved road Camino Escondida, with a travel time of approximately four hours to by vehicle (car, lorry or bus) and is open year-round. This route also connects with Route 1 (main coastal route) and Route 5 (main route that connects Chile from north to south), as shown in Figure 3‑1. The city of Antofagasta hosts the Andres Sabella airport that handles local and occasional international flights. The airport is located 26 km north of Antofagasta.
The railway lines that connect the city of Antofagasta with the MEL mine site are owned by Empresa de Ferrocarriles del Norte Grande (Ferronor) and Ferrocarril de Antofagasta a Bolivia (FCAB). The railway lines connect the MEL mine site with the ports of Antofagasta and Mejillones and are primarily used for the transfer of supplies.
4.3.Climate and Length of Operating Season
The Escondida and Escondida Norte mine site is located in the Atacama Desert, in an Andean desert climate, presenting extreme weather conditions such as: high solar radiation, thermal oscillation, strong winds, and low atmospheric humidity. This climate has the highest amount of rainfall in the summer months, and receives on average between 20 and 60 millimetres (mm) per year. It has a large, thermal oscillation between day and night, which averages 10°C (50°F). During the summer months, the mean maximum temperature is close to 26°C (79°F); and during the winter months, the mean minimum temperature is -0.8°C (17°F). Relative humidity between July and October does not exceed 30%; while between November and March, the average is 60%.
The average wind speed fluctuates between 10 and 40 kilometres per hour (km/h), with maximum wind speed gusts exceeding 60 km/h. Winds typically present a predominant east-west orientation.
Despite these conditions, and with the exception of certain extreme weather events, operational continuity is not affected, and mining operations occur year-round.
Antofagasta is the regional capital and is a modern city with all regular services and a population of approximately 362,000 inhabitants as of 2017. Numerous mining-related companies are based in the city and operate in surrounding areas. Antofagasta has all the necessary services of an industrial port city, such as potable water, public transportation, and electric power. It also has numerous shopping centres and good electronic communications.
|
|
|
|
MEL_TRS_June 2022_Mike |
June 2022 |
|
|
SEC Technical Report Summary – Minera Escondida Limitada |
Page 35 |
4.5.Infrastructure and Availability
Currently, most of the industrial water supply for operational needs comes from seawater, which is desalinated in specially designed and purpose-built plants located on the Antofagasta coastline at the Punta Coloso site. There, there are two desalination plants, whose production is pumped to the mine 170 km away and at a difference in elevation of 3,000 m. The water is carried by three aqueducts, one with a 24-inch (61 cm) diameter and two with 42-inch (106.7 cm) diameter.
From FY23, all of MEL’s energy demand is expected to be supplied via Kayros renewable Power Purchase Agreements (PPAs), replacing Power Angamos coal-based PPA and Tamakaya, an energy mix from BHP’s Kelar Power Plant (Natural Gas) and the Spot Market for energy The Kayros renewable energy contract contributes to reduce MEL BHP's total Scope 2 emissions from FY23 and to achieve BHP's commitments by 2030. This contract has two providers, Enel Generation (60%) and Colbun (40%).
As at 30 June 2022, MEL had 3,800 employees within which the proportion of female representation was 26.5%. Approximately 1.5% of the MEL workforce was made up of employees with disabilities, about 8% of MEL's employees were members of indigenous communities, and 44.6% of its workforce lived in the Antofagasta Region in which MEL is located (excluding contractors). In addition, as at 30 June 2022, MEL had engaged nearly 14,000 contractors, distributed among nearly 350 collaborating companies.
The majority of supplies used at the MEL operation are sourced from within Chile. The principal strategic raw materials used in the operation, being those that without which the continuity of production could be affected, are shown in Table 4‑1.
|
|
Table 4‑1: |
Principal Strategic Raw Materials Used in the Operation |
|
|
Key Supplies |
Origin |
Diesel |
United States |
Acid |
Chile, Perú |
Lime |
Chile |
Grinding Balls |
Chile, Perú, China |
Mill Liners |
Chile |
Blasting Supplies |
Chile |
Tyres |
United States, Japan |
Source: MEL (2022)
|
|
|
|
MEL_TRS_June 2022_Mike |
June 2022 |
|
|
SEC Technical Report Summary – Minera Escondida Limitada |
Page 36 |
In 1978, Utah International Inc. and Getty Oil Co. formed a temporary partnership called the Atacama Project for the purpose of exploring porphyry copper deposits beneath the sedimentary and volcanic cover in northern Chile, between Calama and Copiapó. Between 1978 and 1981, an extensive surface geochemical exploration campaign was carried out that identified different exploration targets, including the Escondida area.
In 1981, a drilling campaign was carried out that led to the discovery of the Escondida deposit. Subsequently, a drilling campaign was carried out to delineate the deposit. Prior to its discovery, there was no evidence of significant mining activities in the area. Key steps in the history of the ownership of MEL are the following:
•In 1984, Utah and Getty were jointly acquired by BHP and Texaco, which subsequently sold its shares to BHP.
•In 1985, the ownership of MEL was formalised to be BHP (57.5%); Rio Tinto Zinc (30%); JECO (10%), and World Bank (2.5%).
•In 2001, BHP merged with Billiton to form BHP Billiton.
•In 2010, JECO ltd. acquired the part of the World Bank that belonged to BHP Billiton.
•In 2017, BHP Billiton was renamed BHP.
Currently, MEL’s owners are: BHP (57.5%), Rio Tinto (30%), JECO Corporation (10%), and JECO 2 Ltd. (2.5%).
In 1989, construction began on the first concentrator plant (Los Colorados) with an ore processing capacity of 35,000 tonnes per day (tpd). In mid-1993, MEL started its Phase 1 expansion, increasing the ore processing capacity from 35,000 to 37,500 tpd. In August 1994, Phase 2 began, increasing the processing capacity to 55,000 tpd. A year later, in August 1995, Phase 3 began, increasing processing capacity to 105,000 tpd. In 1997, Phase 3.5 increased from 105,000 to 127,500 tpd. Table 5‑1 shows the historical MEL milestones.
|
|
|
|
MEL_TRS_June 2022_Mike |
June 2022 |
|
|
SEC Technical Report Summary – Minera Escondida Limitada |
Page 37 |
|
|
Table 5‑1: |
Key MEL Milestones |
|
|
Milestone |
Year |
Escondida deposit discovery |
1981 |
BHP acquires Utah. |
1984 |
Official inauguration of Minera Escondida Ltda. |
1991 |
Start-up of Phase 1 Escondida expansion |
1993 |
Start-up of Phase 2 Escondida expansion |
1994 |
Start-up of Phase 3 Escondida expansion |
1996 |
Start-up of Phase 3.5 expansion add leaching of oxides at Escondida, |
1998 |
Start-up of Phase 4 Escondida expansion. Los Colorados plant and Laguna Seca
increase production to 236,000 kilotonnes per day (ktpd). |
2002 |
Start-up Escondida Norte mine |
2005 |
Sulphide leaching process are inaugurated |
2006 |
Desalination plant (P0) is completed – 500l/s capacity |
2007 |
Begin construction of the Organic Growth Project 1 (OGP1) and Oxide Leach Area
Project (OLAP) projects is announced |
2012 |
Escondida Ore Access starts production |
2012 |
Construction of MEL's second desalination plant is announced |
2013 |
BHP assigns the construction contract for the Kelar power plant |
2013 |
Start-up Oxide Leach Area Project (OLAP) |
2014 |
Construction of the Kelar power plant begins |
2014 |
Escondida's OGP1 project starts operation |
2015 |
Inauguration of OGP1, third copper concentrator, |
2016 |
The Kelar gas-fired power plant, built to supply Minera Escondida and other BHP mines |
2016 |
Completion of water extraction from Punta Negra |
2017 |
Second desalination plant, EWS, starts with a capacity 2,500 l/s |
2017 |
EWS expansion adding 833l/s |
2019 |
100% use of desalinated water for processes |
2020 |
Renewable power purchase agreements announced with 100% of MEL’s energy to come from renewable energy from FY23 |
2020 |
Source: MEL (2022)
5.2.Exploration and Development by Previous Owners or Operators
From 1981 to 2022, multiple exploration drilling programmes targeting copper mineralisation on the project have been undertaken. In recent years the overall drilling program has stabilised in terms of the total annual drilling required to support the ongoing annual mine planning cycle. All drilling has been completed by MEL either under its current holding, or via previous holdings (prior to 1984).
Several different drilling techniques have been implemented by MEL, including diamond core drilling (DDH), percussion drilling (DTH), reverse circulation drilling (RC), and minor conventional rotary drilling. From 1981 to 2022, 8,596 drill holes, totalling 2,691,948 m, were drilled across the combined Escondida and Escondida Norte deposits. Table 5‑2 summarizes the drilling by type and year of drilling. Rotary drill information is minimal and not material to geological evaluation and resource estimation.
MEL has not used data from early DTH drilling for resource modelling due to the low confidence in the sampling associated with this older drilling technique potentially resulting in downhole contamination and poor quality data. In the QP’s opinion this drilling technique is not appropriate for mineral resources estimation purposes. It is the QP’s opinion that the exclusion of DTH from the estimate is not material.
|
|
|
|
MEL_TRS_June 2022_Mike |
June 2022 |
|
|
SEC Technical Report Summary – Minera Escondida Limitada |
Page 38 |
Additional details on the exploration history can be found in Chapter 7.
|
|
Table 5‑2: |
Drilling by Type and Year (Total Escondida and Escondida Norte combined) |
|
|
|
|
|
Year |
DDH |
RC |
RC-DDH |
Total Metres |
EXP81-86 |
55,059 |
- |
61,527 |
116,587 |
FY90 |
- |
2,461 |
- |
2,461 |
FY91-92 |
1,339 |
2,962 |
5,168 |
9,469 |
FY93 |
- |
2,999 |
- |
2,999 |
FY93-94 |
8,106 |
14,815 |
28,098 |
51,018 |
FY95 |
1,323 |
250 |
30,565 |
32,138 |
FY96 |
- |
3,462 |
- |
3,462 |
FY97 |
11,152 |
4,012 |
600 |
15,763 |
FY98 |
805 |
2,570 |
7,975 |
11,350 |
FY99 |
4,513 |
9,554 |
5,104 |
19,171 |
FY00 |
18,197 |
42,388 |
40,792 |
101,377 |
FY01 |
33,169 |
103,572 |
95,956 |
232,697 |
FY02 |
16,015 |
60,708 |
16,925 |
93,648 |
FY03 |
22,727 |
39,366 |
15,008 |
77,100 |
FY04 |
23,933 |
30,368 |
27,277 |
81,578 |
FY05 |
27,375 |
55,135 |
24,886 |
107,396 |
FY06 |
21,092 |
33,056 |
47,255 |
101,403 |
FY07 |
9,315 |
36,138 |
45,625 |
91,078 |
FY08 |
20,340 |
60,800 |
72,996 |
154,137 |
FY09 |
46,251 |
54,358 |
70,880 |
171,490 |
FY10 |
55,621 |
40,390 |
262,791 |
358,802 |
FY11 |
62,121 |
36,844 |
165,807 |
264,773 |
FY12 |
83,492 |
24,596 |
102,921 |
211,009 |
FY13 |
33,566 |
11,564 |
45,042 |
90,172 |
FY14 |
24,462 |
12,158 |
32,231 |
68,851 |
FY15 |
38,683 |
12,652 |
18,138 |
69,473 |
FY16 |
20,335 |
6,676 |
8,489 |
35,499 |
FY17 |
27,030 |
4,746 |
2,900 |
34,676 |
FY18 |
24,841 |
2,594 |
3,654 |
31,089 |
FY19 |
14,529 |
3,194 |
4,580 |
22,303 |
FY20 |
14,141 |
3,756 |
760 |
18,657 |
FY21 |
6,712 |
3,610 |
― |
10,322 |
Total |
726,244 |
721,754 |
1,243,949 |
2,691,948 |
Note: This table excludes DTH drill holes.
|
|
|
|
MEL_TRS_June 2022_Mike |
June 2022 |
|
|
SEC Technical Report Summary – Minera Escondida Limitada |
Page 39 |
6.Geological Setting, Mineralisation, and Deposit
The Escondida district, which principally comprises the Escondida and Escondida Norte deposits, is located in northern Chile in the Antofagasta Region, forming part of the Upper Eocene - Oligocene age (43 - 31 million years (Ma)) copper porphyry belt that forms one of the most important regional copper districts in the world. Numerous Cu-Mo deposits and prospects have been identified within this belt, including the Chuquicamata and Escondida deposits (Figure 6‑1A).
The Upper Eocene-Oligocene porphyry belt extends for more than 1,400 km along the Domeyko Range from the Peruvian border (18°S) to latitude 31°S (Figure 6‑1A). The Domeyko Range is the result of compressional deformation processes that started at the beginning of the Upper Cretaceous and culminated during the Inca compressional phase in the Upper Eocene - Lower Oligocene. These events gave rise to the Domeyko Fault System (Mpodozis et al., 1993) that played a fundamental role in the emplacement of the porphyry systems.
The Escondida district can be defined as a north-south trending structural belt 70 km wide and 120 km long (Wong, C., 2013), composed of a series of structural elements developed under an east-west shortening regime, normal to the convergence zone and low evidence of north-south transcurrent deformation. In this deformational scenario, the copper deposits of the Escondida cluster are preferentially located on the eastern edge of the Escondida - Sierra de Varas shear lens of the Domeyko Fault System.
Figure 6‑1 shows a Regional Geologic Map (Mpodozis, C. and Cornejo, P., 2012), where the shear lenses delimited by the Sierra de Varas Fault to the west and La Escondida Fault to the east (locally correlated with the Portezuelo - Panadero Fault) are observed.
The lithological units present in the Escondida District correspond mainly to sedimentary, volcanic, and intrusive units, whose ages range from Upper Palaeozoic to Eocene (Figure 6‑1). These lithological units are described according to their ages discussed below.
Maps presented in this chapter use local mine coordinates unless otherwise stated
Palaeozoic rocks are characterised by a series of isolated basement blocks (300-270 Ma), which form the core of the Domeyko Cordillera (Mpodozis, C. and Cornejo, P., 2012) (Figure 6‑1). These blocks are limited to the west by the Escondida shear lens.
Mesozoic rocks are represented by continental sedimentary and intrusive rocks, which are located mainly in the Escondida-Sierra de Varas shear lens. The continental sedimentary rocks have been assigned to the Upper Triassic-Lower Cretaceous and are more than 9 km thick in the Salar de Atacama depression.
The intrusive rocks are pyroxene gabbro, diorites, and hornblende-pyroxene monzodiorites, which are related to a Late Cretaceous (81-71 Ma) intrusion. These units intruded continental sedimentary strata (Figure 6‑1).
|
|
|
|
MEL_TRS_June 2022_Mike |
June 2022 |
|
|
SEC Technical Report Summary – Minera Escondida Limitada |
Page 40 |
The Cenozoic rocks are mainly volcanic and intrusive rocks. The volcanic rocks have been assigned to the Palaeocene-Early Eocene (59-53 Ma) (Marinovic et al., 1995; Richards et al., 2001; Urzúa, 2009), and represent the localised and recurrent magmatic activity east of the frontal arc of the Andes (Figure 6‑1B) during the Late Cretaceous-Early Palaeocene (85-50 Ma).
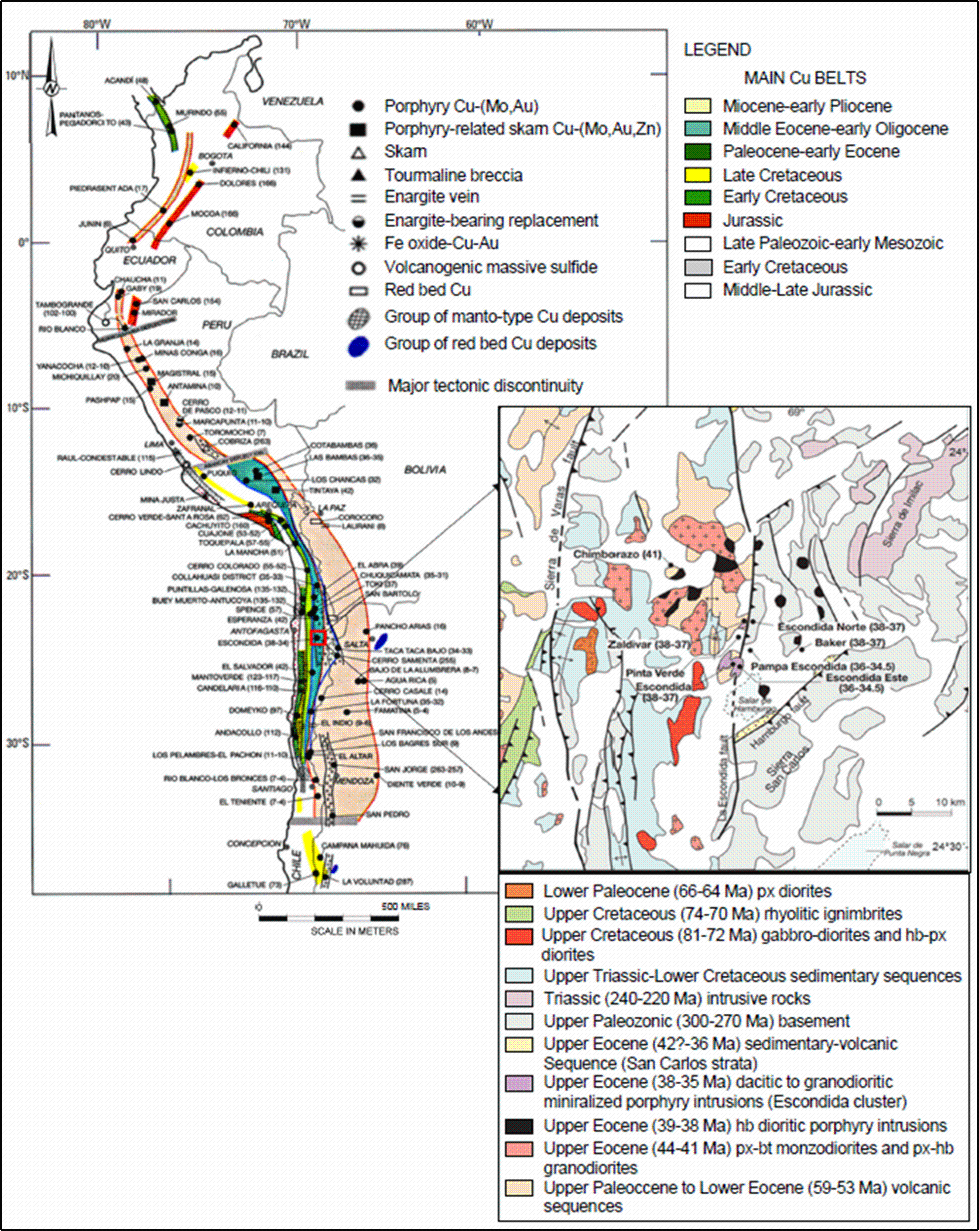
Source: A) Sillitoe and Perelló, 2005, B) Mpodozis and Cornejo, 2012.
Coordinate system: Latitude – Longitude
|
|
Figure 6‑1: |
A) Metallogenic Belts of the Andes and their Main Copper-bearing Porphyries,
B) Regional Geology Escondida District |
|
|
|
|
MEL_TRS_June 2022_Mike |
June 2022 |
|
|
SEC Technical Report Summary – Minera Escondida Limitada |
Page 41 |
The earliest Eocene magmatism event in the Escondida district is represented by Monzodiorites and Granodiorites (44-41 Ma) emplaced in the Escondida-Sierra de Varas shear lens north of Escondida (Marinovic et al., 1995; Richards et al., 2001; Urzúa, 2009) (Figure 6‑1).
The second episode of Eocene-Oligocene magmatism began with the intrusion of a group of small bodies along the Escondida Fault. These rocks correspond mainly to dioritic stocks with U-Pb ages of 39-38 Ma (Richards et al., 2001; Urzúa, 2009), which intruded the volcanic rocks of the Escondida-Sierra de Varas shear lens (late Palaeocene-Early Oligocene) and the Palaeozoic basement of the Imilac block (Figure 6‑1B) (Mpodozis, C. and Cornejo, P., 2012). The distribution of these bodies indicates that probably are apophyses of a larger pluton (Mpodozis, C. and Cornejo, P., 2012). A slightly younger group, 38-37 Ma, of NE to N-NE oriented porphyries were emplaced near the Escondida Fault. These porphyries are recognised at Zaldívar, Escondida, Escondida Norte, Pinta Verde and Baker (Richards et al., 2001; Urzúa, 2009; Hervé et al., 2012) (Figure 6‑1B).
The last magmatism in the Escondida district was related to the intrusion, immediately east of the Escondida fault, of the Escondida East and Pampa Escondida porphyries between 36-34.5 Ma, (Hervé et al., 2012) (Figure 6‑1).
The local geology comprises two major geological environments (Figure 6‑2); the first, located to the east, is characterised by basement rocks of the Palaeozoic La Tabla Formation. The second, located to the west, is characterised by the Mesozoic sedimentary sequence of El Profeta Formation, Santa Ana Formation and Augusta Victoria Formation, (Figure 6‑2).
The La Tabla Formation is formed by andesitic and rhyolitic volcanic rocks. Their intrusive contemporaneous rocks (Monzogranites, Tonalites, Quartz Diorites) have a calc-alkaline composition (Richards et al., 2001; Urzúa, 2009). Ages range from Late Carboniferous to Early Permian and represent the host rock of the Escondida Este, Escondida Norte-Zaldívar, and Pampa Escondida deposits.
El Profeta and Santa Ana Formations (Maksaev et al., 1991), are a marine carbonate and continental clastic sequence, with ages between the Upper Triassic and Lower Cretaceous. These units were accumulated in the back arc-basin upon the Palaeozoic-Triassic basement.
The Augusta Victoria Formation is characterised by calc-alkaline andesitic flows, dated by zircon U-Pb at ~ 58 to 53 Ma (Urzúa, 2009).
The oldest post-Palaeozoic intrusive rocks in the Escondida district are Alkaline Gabbro and Diorites, Monzodiorites, Monzonite and Granite of Late Cretaceous age (~ 77-72 Ma; U-Pb zircon). Two additional gabbro to granite complexes of Late Cretaceous to Early Palaeocene are also recognised along the western side of the Escondida district (Urzúa, 2009).
The next intrusive activity in the district resulted in epizonal complexes associated with the porphyry copper deposits (Hervé et al, 2012). It started with stocks of fine-grained hornblende diorite and hornblende monzodiorites, covering an area of 45 km2 in the north-western part of the district (Figure 6‑2). U-Pb zircon dates indicate ages ranging between ~ 43 to 41 Ma (Urzúa, 2009) and ~ 38-36 Ma Ar / Ar ages (Richards et al., 2001). The ore-related intrusions in the Escondida deposit are multiphase biotite granodiorite porphyries, with zircon U-Pb ages between ~ 38 and 34.5 Ma (Hervé et al 2012). The last intrusion was the rhyolite porphyry at Escondida Este dated at ~ 34 Ma (Hervé et al, 2012). Escondida Este is a deeper extension to the southeast of the Escondida deposit, overlapping each other in space, but distinguished by distinctly later intrusive pulses.
|
|
|
|
MEL_TRS_June 2022_Mike |
June 2022 |
|
|
SEC Technical Report Summary – Minera Escondida Limitada |
Page 42 |
Immediately east of Escondida and Escondida Norte, a thick sequence of sedimentary and andesitic rocks can be identified (Figure 6‑2). These rocks outcrop in the foothills immediately adjacent to the Hamburg reverse fault with NW convergence (Figure 6‑2), where they were identified as “San Carlos strata” by Urzúa, 2009. This unit has a maximum thickness of 1,200 m and includes greenish-grey and red sandstones and conglomerates, which in their upper parts are intercalated with a cumulative thickness of up to 500 m of andesitic laharic breccia, ignimbrite, and subsidiary flows, which reported two U-Pb zircon Ages of 38.0 ± 2.1 and 37.7 ± 0.6 Ma (Urzúa, 2009).
The final stratigraphic unit in the district is the Pampa de Mulas Formation, which corresponds to an extended, flat and stratified, poorly consolidated, piedmont gravel sequence of mass flow origin, which is up to 240 m thick. Near the deposits, the sequence contains abundant clasts of altered rocks, especially advanced argillic lithocaps. It is assigned to the Oligocene to middle Miocene interval by Marinovic et al. (1995) and Urzúa (2009), which agreed well with ages of 8.7 ± 0.4 to 4.2 ± 0.2 Ma for the overlying felsic air-fall tuff horizons at Escondida and Zaldívar (Alpers and Brimhall, 1988; Morales, 2009).
The major faults and associated fold axes in the Escondida district are parallel and N to NNE-trending structures (Mpodozis et al., 1993b; Marinovic et al., 1995; Richards et al., 2001; Urzúa, 2009; Figure 6-2). These faults constitute the eastern portion of a shear lens ~ 180 km long and up to 20 km wide (Mpodozis et al., 1993). In the Escondida district, the most prominent fault is Portezuelo-Panadero, this is a reverse structure with a dip of 65 ° E that contacts the La Tabla Formation over the Augusta Victoria Formation units (Navarro et al., 2009; Urzúa, 2009; Figure 6‑2).
Geological descriptions for each deposit (or group of deposits) are summarised below.
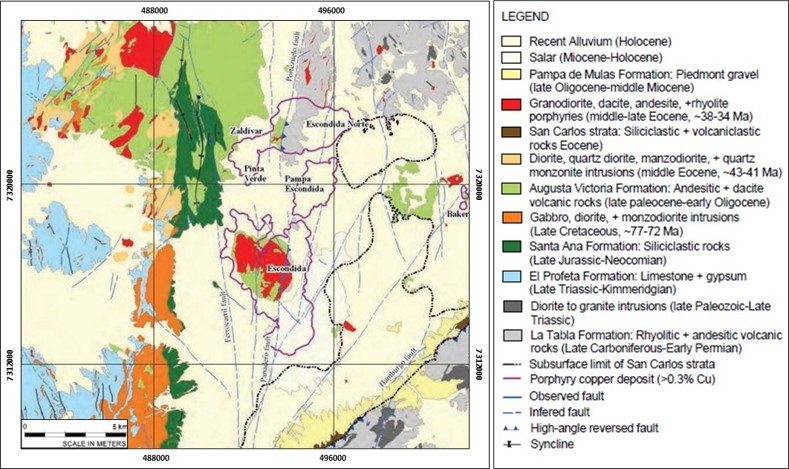
Source: Hervé et al, 2012)
Coordinate system: UTM WGS84
|
|
Figure 6‑2: |
Local Geology Map |
|
|
|
|
MEL_TRS_June 2022_Mike |
June 2022 |
|
|
SEC Technical Report Summary – Minera Escondida Limitada |
Page 43 |
Figure 6‑3 details the stratigraphic column and presents the relationships between the different units and their correlation with the formations and complexes described.
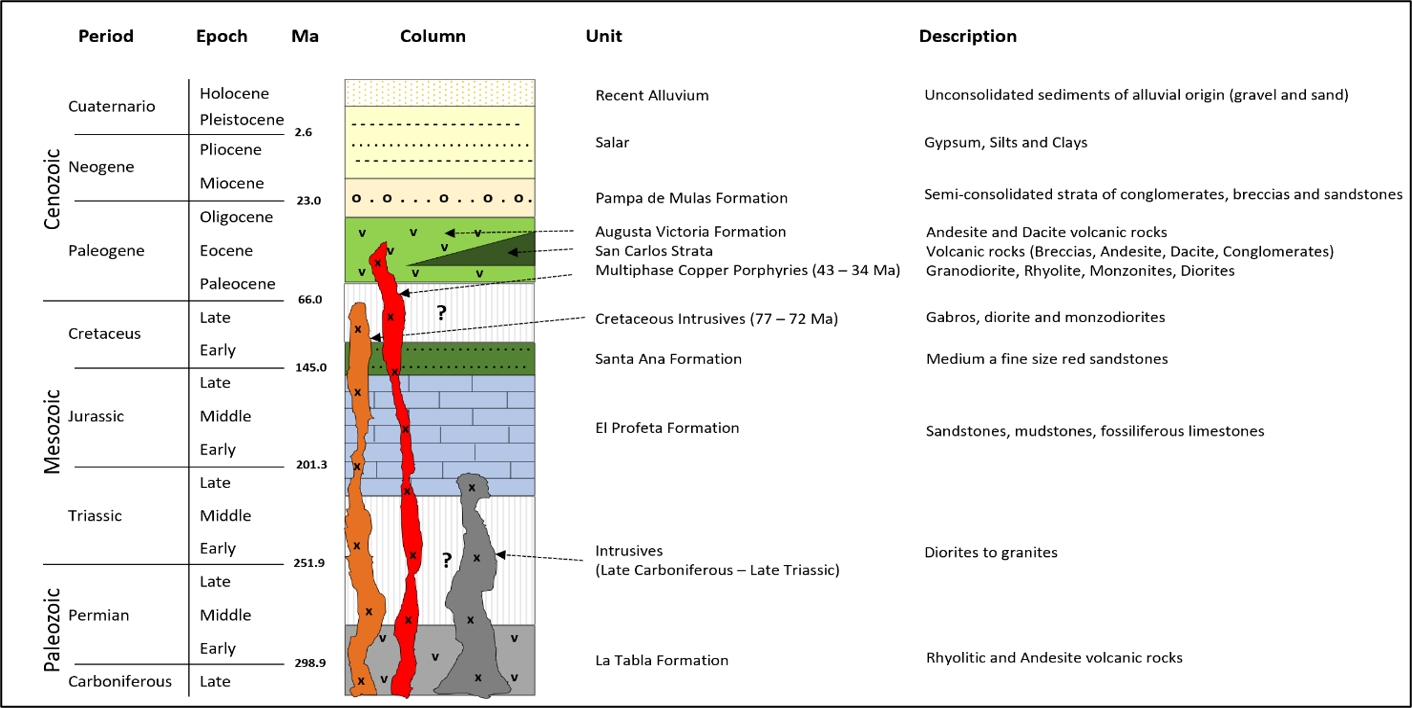
Source: MEL (2022)
|
|
Figure 6‑3: |
Stratigraphic Column for Escondida District |
All mineral deposits in the Escondida cluster are related to multiphase biotite Granodiorite Porphyry stocks, which were preceded by diorite to monzodiorite intrusives, closely associated with magmatic-hydrothermal breccias typically of high Cu grade (Hervé et al, 2012)..
The early porphyry phases consistently host the highest-grade Cu mineralisation. Alteration-mineralisation events at Escondida are distributed from a zone at depth with a potassic association and grey sericite alteration overlain by chalcopyrite and bornite. Then, more pyritic zones of chlorite-sericite and sericite are recognised at intermediate levels and superficially shallow advanced argillic shallow developments with remnants of old lithocap that may have reached a total extent of 200 square kilometres (km2), associated with high sulphidation copper sulphide mineralisation, much of it in enargite-rich massive sulphide veins.
Hervé et al, 2012, indicate that the Escondida and Escondida Norte deposits, formed between ~ 38 to 36 Ma, and have a deep telescoping process, while the earlier Chimborazo (~ 41 Ma), and later mineralised bodies, such as Escondida Este and Pampa Escondida (~ 36-34 Ma), show only minor telescoping, suggesting that uplift and erosion of the maximum Inca deformation, occurred between 38 and 36 Ma.
The Portezuelo-Panadero and subsidiary longitudinal faults in the district were subjected to sinistral transpression prior to the formation of the deposit (before 41 Ma), which resulted in clockwise block rotation that was responsible for the initial synorogenic generation and filling of the San Carlos depocenter. The Escondida district was then subjected to transient dextral transpression during the emplacement of NNE to NE oriented porphyry copper intrusions with associated alteration and mineralisation (~38 - 34.5 Ma). The dextral regime had disappeared by the time of emplacement of a late N-trending mineralised rhyolite porphyry at Escondida Este and was replaced by transient sinistral transpression during the final stage of formation of NW-trending high and intermediate sulphidation, massive sulphide veins and phreatic breccia
|
|
|
|
MEL_TRS_June 2022_Mike |
June 2022 |
|
|
SEC Technical Report Summary – Minera Escondida Limitada |
Page 44 |
dikes. Since 41 Ma, faults in the district have not undergone appreciable displacement, because none of the porphyry copper deposits show significant lateral, or vertical, displacement.
Uplift and erosion characterised the late Oligocene to early Miocene, during which the extensive earlier lithocap was largely stripped and incorporated as detritus into a sequence of coarse piedmont gravel (Wong, 2013). Development of leached hematitic horizons and chalcocite-enriched zones, along with subsidiary copper oxide ore, was active beneath the topographic highs at Escondida, Escondida Norte-Zaldívar, and to a lesser extent, Chimborazo from ~ 18 to 14 Ma. It is noted, however, that this supergene activity was much less important in the gravel-covered and topographically lower Pampa Escondida deposit. After ~ 14 Ma, supergene processes were restricted by the occurrence of hyper aridity in much of northern Chile.
The Escondida cluster is formed by the Escondida (including Escondida Este) and Escondida Norte - Zaldívar porphyry copper deposits (Figure 6‑2). The latter corresponds to the same ore body mined by two different companies and operations. Additionally, the porphyry copper deposits of Chimborazo and Pampa Escondida, as well as Pinta Verde, have been recognised.
Lithology
Escondida includes two porphyry copper mineralised centres. Escondida, which is hosted in andesitic flows and subordinate breccias of the Augusta Victoria Formation (Ojeda, 1986), and Escondida Este, which is hosted in andesitic volcanic rocks of the La Tabla Formation and coeval intrusions. The Escondida mineralisation is large, comprising an area 100s of metres wide and over 1km is length. It is one of the largest known porphyry systems in the world.
At Escondida, the Augusta Victoria volcanic sequence is cut by a biotite granodiorite porphyry, within which the early phases have a NE trend, known locally as Feldspathic Porphyry, dated at 37.9 ± 1.1, 37.7 ± 0.8 and 37.2 ± 0.8 Ma (Richards et al., 1999; Padilla-Garza et al., 2004). At Escondida, this unit measures 3.3 x 1.5 km with an average thickness of ~ 1.5 km and is recognize at least down to 1.8 km below the surface. To the west and south, early granodiorite porphyries are cut by many late intermineral porphyries; to the west a biotite granodiorite named as Granodiorite Verde dated to 35.4 ± 0.7 Ma (Hervé et al, 2012) is recognised and in the southern sector a lithological sequence ranging from diorite to quartz monzodiorite with different degrees of alteration, named Intermineral Porphyry, is recognised (Technical Note, SI Geology, 2021). The Feldspathic Porphyry stock and copper mineralisation are cut to the north by a biotite rhyolite dome with quartz phenocrysts > 10% by volume, known locally as Quartziferous Porphyry and has been dated at 37.5 ± 0.6 Ma.
Numerous bodies of Magmatic-Hydrothermal Breccias, which constitute approximately 5% of the Escondida deposit, host the highest grade hypogene and supergene copper mineralisation (Ojeda, 1986, 1990; Véliz, 2004). The breccia clasts, commonly polymictic in nature, are surrounded by varying proportions of sulphide and quartz cement with rock dust matrix (Ojeda, 1986, 1990; Véliz, 2004).
The Escondida deposit, is limited to the east by a late biotite rhyolite porphyry affected by a high sulphidation event, known locally as Quartziferous Porphyry dated at 34.7 ± 1.7 Ma (Richards et al. 1999). This unit measures 3 × 1.5 km at the surface and follows the direction of the North trending Portezuelo - Panadero fault.
|
|
|
|
MEL_TRS_June 2022_Mike |
June 2022 |
|
|
SEC Technical Report Summary – Minera Escondida Limitada |
Page 45 |
Alteration and Hypogene Mineralisation
Much of the feldspathic porphyry shows sericitic alteration in shallow levels already exploited an advanced argillic zone and at deeper only along fault zones. Quartz, pyrophyllite and subordinate alunite, diaspore, and svanbergite are reported (Brimhall et al., 1985; Alpers and Brimhall, 1988). At depth and as remnants in the sericitic zone, patches of chlorite-sericite alteration exist, which give way downward to biotite in andesitic volcanic rocks and k-feldspar > biotite in the porphyries (Padilla-Garza et al., 2001). The superimposed potassic and sericitic alteration contains abundant A and B type quartz veinlets. The Granodiorita Verde unit shows a weak potassic alteration in veinlets with a generalised chlorotic overprint within which the remaining hydrothermal k‑feldspar stands out. The Intermineral Porphyry unit presents diverse alteration associations with variable intensities and showing as a characteristic element, the truncation of veinlets. In some sectors of the pit, there is a marked superimposition of hydrothermal events that originate an intense obliteration on the primary texture, leaving only some quartz relics, which evidence the presence of the intermineral unit (Technical Note, SI Geology, 2021). This unit can be presented primarily with a Chlorite - Sericite - Illite association (Event 1) or affected by superimposition of hydrothermal events such as Sericite - Quartz (Event 2), Sericite (Event 3) and Pyrophyllite - Alunite or Pyrophyllite (Event 4).
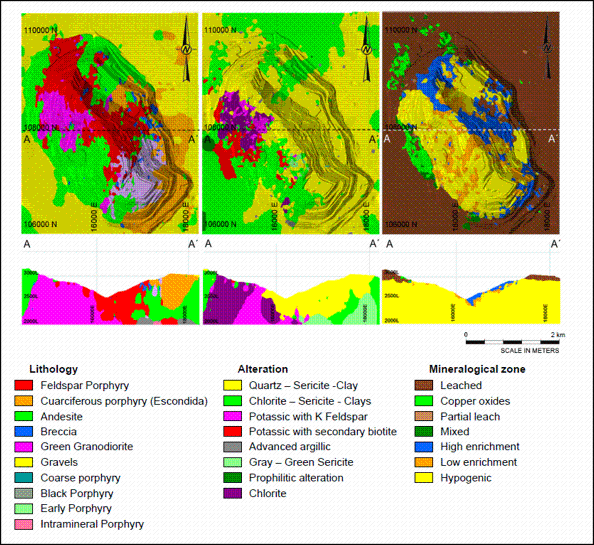
Source: MEL (2022)
|
|
Figure 6‑4: |
Pit Shell and Vertical Section for Lithology, Alteration, and Mineralogical Zone for
Escondida |
|
|
|
|
MEL_TRS_June 2022_Mike |
June 2022 |
|
|
SEC Technical Report Summary – Minera Escondida Limitada |
Page 46 |
The hypogene sulphide mineralisation at Escondida is obliterated by the effects of the supergene enrichment. However, chalcopyrite and bornite are identified in relict potassic zones along with chalcopyrite and pyrite from the overprinted chlorite-sericite and sericite zones. The high sulphidation mineralisation occur in the advanced argillic zone. In the underlying Green Granodiorite intrusion, pyrite dominates over chalcopyrite and copper grades are 0.05 to 0.25%, decreasing at depth.
Supergene Mineralisation
Escondida is characterised by a mature supergene profile with high kaolinite contents, which include a hematitic leaching layer, with an average thickness of ~ 200 m, but locally, can reach 400 m. This leaching zone is supported by a NW-trending enrichment zone that covers an area of 4.5 × 1.8 km with a maximum thickness of ~ 400 m. NW-trending faults, fractures, and veins intersecting the NW trend combined with higher hypogene copper contents appear to have been the main controls on both the shape and depth of the enrichment zone (Ojeda, 1986, 1990; Padilla-Garza et al., 2001). The zone is dominated by chalcocite-group minerals in its higher grade upper part with lower-grade covellite and hypogene sulphides remaining that become dominant at depth. The supergene event is dated between ~ 18 to 14 Ma (Alpers and Brimhall, 1988) in supergene alunite at the limit of the leaching and enrichment zone.
Copper oxide mineralisation at Escondida is mainly found in andesitic volcanic rocks altered with biotite and chlorite-sericite in which brochantite and antlerite are the main minerals along with minor chrysocolla, atacamite, various copper phosphate minerals, cuprite, and native copper with the last two being concentrated in the upper part of the enrichment zone (Ojeda, 1986; Véliz and Camacho, 2003).
6.4.2.Escondida Norte Deposit
Lithology
Escondida Norte is hosted by volcanic rocks of the La Tabla Formation and coeval intrusive phases. To the east and at depth, the La Tabla Formation include andesitic rocks, dated at 294.4 ± 4.6 Ma (Jara et al., 2009), which are overlain to the west by a rhyolitic sequence, mainly welded ignimbrites, known locally as Rhyolitic Porphyry, which has been dated at 290.0 ± 4.0, 294.2 ± 2.4 and 298.2 + 5.5 /-4.9 Ma (Richards et al., 1999; Jara et al., 2009).
The intrusives are coarse-grained monzogranites, Coarse Porphyry (298.8 ± 2.6, 293.0 ± 6.0, 291.1 ± 2.3, 289.9 ± 3.5 Ma; Morales, 2009), granodiorite porphyry (287.1 ± 4.4 Ma; Jara et al.; 2009) and diorite. The western part, west of the Portezuelo-Panadero reverse fault, is in contact with andesitic volcanic rocks of the Augusta Victoria Formation and at depth with andesites of the La Tabla Formation.
The units described above, are intruded by a series of NE oriented dikes and larger bodies of biotite granodiorite porphyry granodiorite, which include early phases locally referred to as Feldspathic Porphyry, intermineral and late phases referred to as Dacitic Porphyry (Figure 6‑5). At Escondida Norte, the Feldspathic Porphyry measures 1.7 x 1 km and is recognized at least down to 1.2 km below the surface (Figure 6‑5). The early and intermineral phases, are dated at 38.0 ± 0.5, and 37.5 ± 0.5 Ma (Hervé et al 2012), while the late mineral phase yielded ages of 36.0 ± 0.8, 35.7 ± 0.7, and 35.5 ± 0.8 Ma (Jara et al., 2009).
Limited bodies of polymictic magmatic-hydrothermal breccias are associated with early and intermineral porphyries. These breccias show sericitic alteration or sericite chlorite and are cemented by quartz, pyrite, and varying amounts of chalcopyrite at shallow depth, and by quartz-biotite-anhydrite ± feld-K ± magnetite together with chalcopyrite and bornite at depth.
It is one of the largest porphyry systems in the world.
|
|
|
|
MEL_TRS_June 2022_Mike |
June 2022 |
|
|
SEC Technical Report Summary – Minera Escondida Limitada |
Page 47 |
Alteration and Hypogene Mineralisation
Potassic alteration is present at depth throughout the deposit, with biotite-feldspar-K association in the felsic rocks and biotite and minor magnetite predominate in the andesitic volcanic rocks and diorites. The potassic alteration have biotite and magnetite veinlets and abundant feld-K and quartz-feldspar-K veinlets, the latter of A-type. Grey sericite veinlets overlie the potassic zone.
At shallower levels, the generalised alteration is chlorite-sericite, which is characterised by the occurrence of chlorite-sulphide veinlets overlaying and destroying the potassic association. This is covered by a sericitic zone, which is locally overlain by quartz-pyrophyllite ± alunite alteration, closely associated with the NW-directed high sulphidation vein zones. Most of the hypogene sulphide mineralisation at Escondida Norte consists of chalcopyrite and pyrite with the development of only localised centres of chalcopyrite - bornite ± chalcocite mineralisation in the potassic zone.
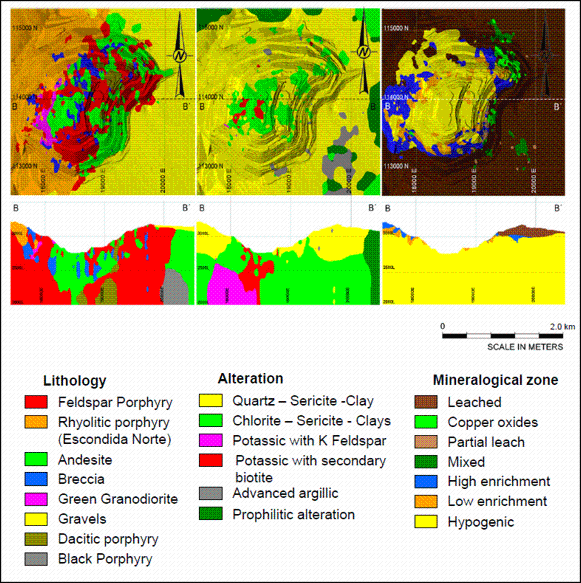
Source: Escondida (2022)
|
|
Figure 6‑5: |
Pit shell and Vertical Section for Lithology, Alteration and Mineralogical Zone for
Escondida Norte |
|
|
|
|
MEL_TRS_June 2022_Mike |
June 2022 |
|
|
SEC Technical Report Summary – Minera Escondida Limitada |
Page 48 |
Supergene Mineralisation
A well-developed supergene profile is present at Escondida Norte, which include a leached hematitic surface, averaging 100 to 200 m (up to 350 m) thick, and a 20 to 250 m thick enrichment zone. The enrichment zone has a surface of 2 × 1.5 km, trending NE; it is divided into a high-grade, chalcocite-dominated upper zone (High Enriched), and a lower-grade basal part with covellite and lower chalcocite (Low Enriched). Supergene kaolinite is present throughout the zone and supergene alunite is dated to be ~ 17 to 14 Ma (Morales, 2009).
Copper oxide mineralisation is irregularly developed above the enrichment zone, mainly with antlerite and brochantite in the higher-grade central parts (Maturana and Saric, 1991; Monroy, 2000; Williams, 2003), and chrysocolla and atacamite peripherally.
As presented in Chapter 5.2 of this TRS, the Project area has been the subject of various historical and recent exploration drilling campaigns, mainly targeting Cu mineralisation at the Project site.
In the 1980s, Utah Corporation generated a plan to explore for metal deposits in northern Chile. Using a methodology of geochemical exploration, an area of interest was identified, and a drilling campaign was carried out that led to the discovery of the Escondida deposit. These early exploration campaigns were carried out by different mining companies, and for the oldest campaigns, there is no detailed document available describing how the historical information was collected. A total of 2,691,948 m of exploration drilling has been completed (up until December 2021), distributed across 5,764 drill holes for Escondida and distributed across 2,832 drill holes for Escondida Norte.
The main objective of the exploration programmes implemented at MEL has been the exploration of new deposits, as well as to improve mineral resources classification to support the annual planning cycle. The results of these programmes serve as the basis to support planning and growth strategies as well as investment programmes for the modernisation of the mining unit.
Maps presented in this chapter use local mine coordinates derived from the PSAD-56 UTM projection.
7.1.Exploration Work (Other Than Drilling)
Limited non-drilling surface exploration work has been conducted at MEL. At the beginning of the exploration, surface geochemical and geophysical techniques were used. At present, given that this is an operating deposit with an adequate level of geological knowledge, no other non-drilling exploration work is being carried out within the mine's area of operation.
In the opinion of the QP, this information isn’t relevant as it only supported the initial planning of exploration.
7.2.1.Drilling Type and Extent
Since the 1980s, drilling has been the primary sampling method for estimating mineral resources and mineral reserves at MEL. Extensive drilling activities have been carried out at different scales and in multiple phases in line with business planning cycles
|
|
|
|
MEL_TRS_June 2022_Mike |
June 2022 |
|
|
SEC Technical Report Summary – Minera Escondida Limitada |
Page 49 |
Exploration drilling has been undertaken almost yearly at MEL since 2000. Total drilling available for resource estimate at Escondida and Escondida Norte is approximately 8,600 drill holes totalling approximately 2,690,000 m. Since the initial exploration drilling campaigns several different drilling techniques have been implemented, including:
•Conventional open rotary holes: 96 drill holes mainly from the early exploration of the deposit and were excluded from the mineral resources estimation process due to the low confidence in their sampling.
•RC drill holes: 5½ inch to 5¾ inch (139.7 mm to 146.05 mm) for geological sample recovery.
•DDH: Mainly HQ (63.5 mm diameter) with reduction to NQ (47.6 mm) and BQ (36.4 mm) as required. PQ holes (85 mm) for metallurgical purposes.
•Combination of RC and DDH: The combined drill holes (RC-DDH) have been used mainly to save cost by using RC to drill through barren overburden and switching to DDH method shortly above mineralised rock.
Table 7‑1 and Table 7‑2 shows the number of holes and cumulative length of drilling for each drilling method for Escondida and Escondida Norte. The differences between drilled and analysed metres are due to non-mineralised intervals that have not been assayed.
|
|
Table 7‑1: |
Summary of Metres Drilled, Escondida |
|
|
|
|
Type of Drilling |
Number of Drill Holes |
Metres Drilled |
Metres Assayed |
(#) |
(m) |
(m) |
DDH |
1,688 |
503,329 |
476,116 |
RC |
2,459 |
417,569 |
405,060 |
RC-DDH |
1,617 |
847,840 |
797,439 |
Total |
5,764 |
1,768,738 |
1,678,615 |
Source: MEL (2022)
|
|
Table 7‑2: |
Summary of Metres Drilled, Escondida Norte |
|
|
|
|
Type of Drilling |
Number of Drill Holes |
Metres Drilled |
Metres Assayed |
(#) |
(m) |
(m) |
DDH |
702 |
222,916 |
218,795 |
RC |
1,218 |
304,185 |
300,244 |
RC-DDH |
912 |
396,110 |
389,042 |
Total |
2,832 |
923,211 |
908,081 |
Source: MEL (2022)
The annual infill drilling campaigns were intended to confirm the mineral resources based on the mining plan. From FY2000 to FY2008, an average of 80,000 m were drilled annually, except in 2001, when the number of metres drilled was increased to support the then Escondida Norte Project.
Between FY2008 and FY2012, drilling was increased to support the estimates of mineral resources for MEL's growth projects. Since 2013, the guidelines for determining the metres to be drilled require a minimum of 90% measured mineral resource for the first two years of production and a minimum of 80% measured mineral resource to complete the 5-year plan.
Geotechnical and hydrogeological drill holes that have already been used in their corresponding models were released for use in the Resource models, going through all the QA/QC requirements of infill drill holes.
|
|
|
|
MEL_TRS_June 2022_Mike |
June 2022 |
|
|
SEC Technical Report Summary – Minera Escondida Limitada |
Page 50 |
Figure 7‑1 and Figure 7‑2 show the metres drilled per year since the start of the exploration phase for Escondida and Escondida Norte.
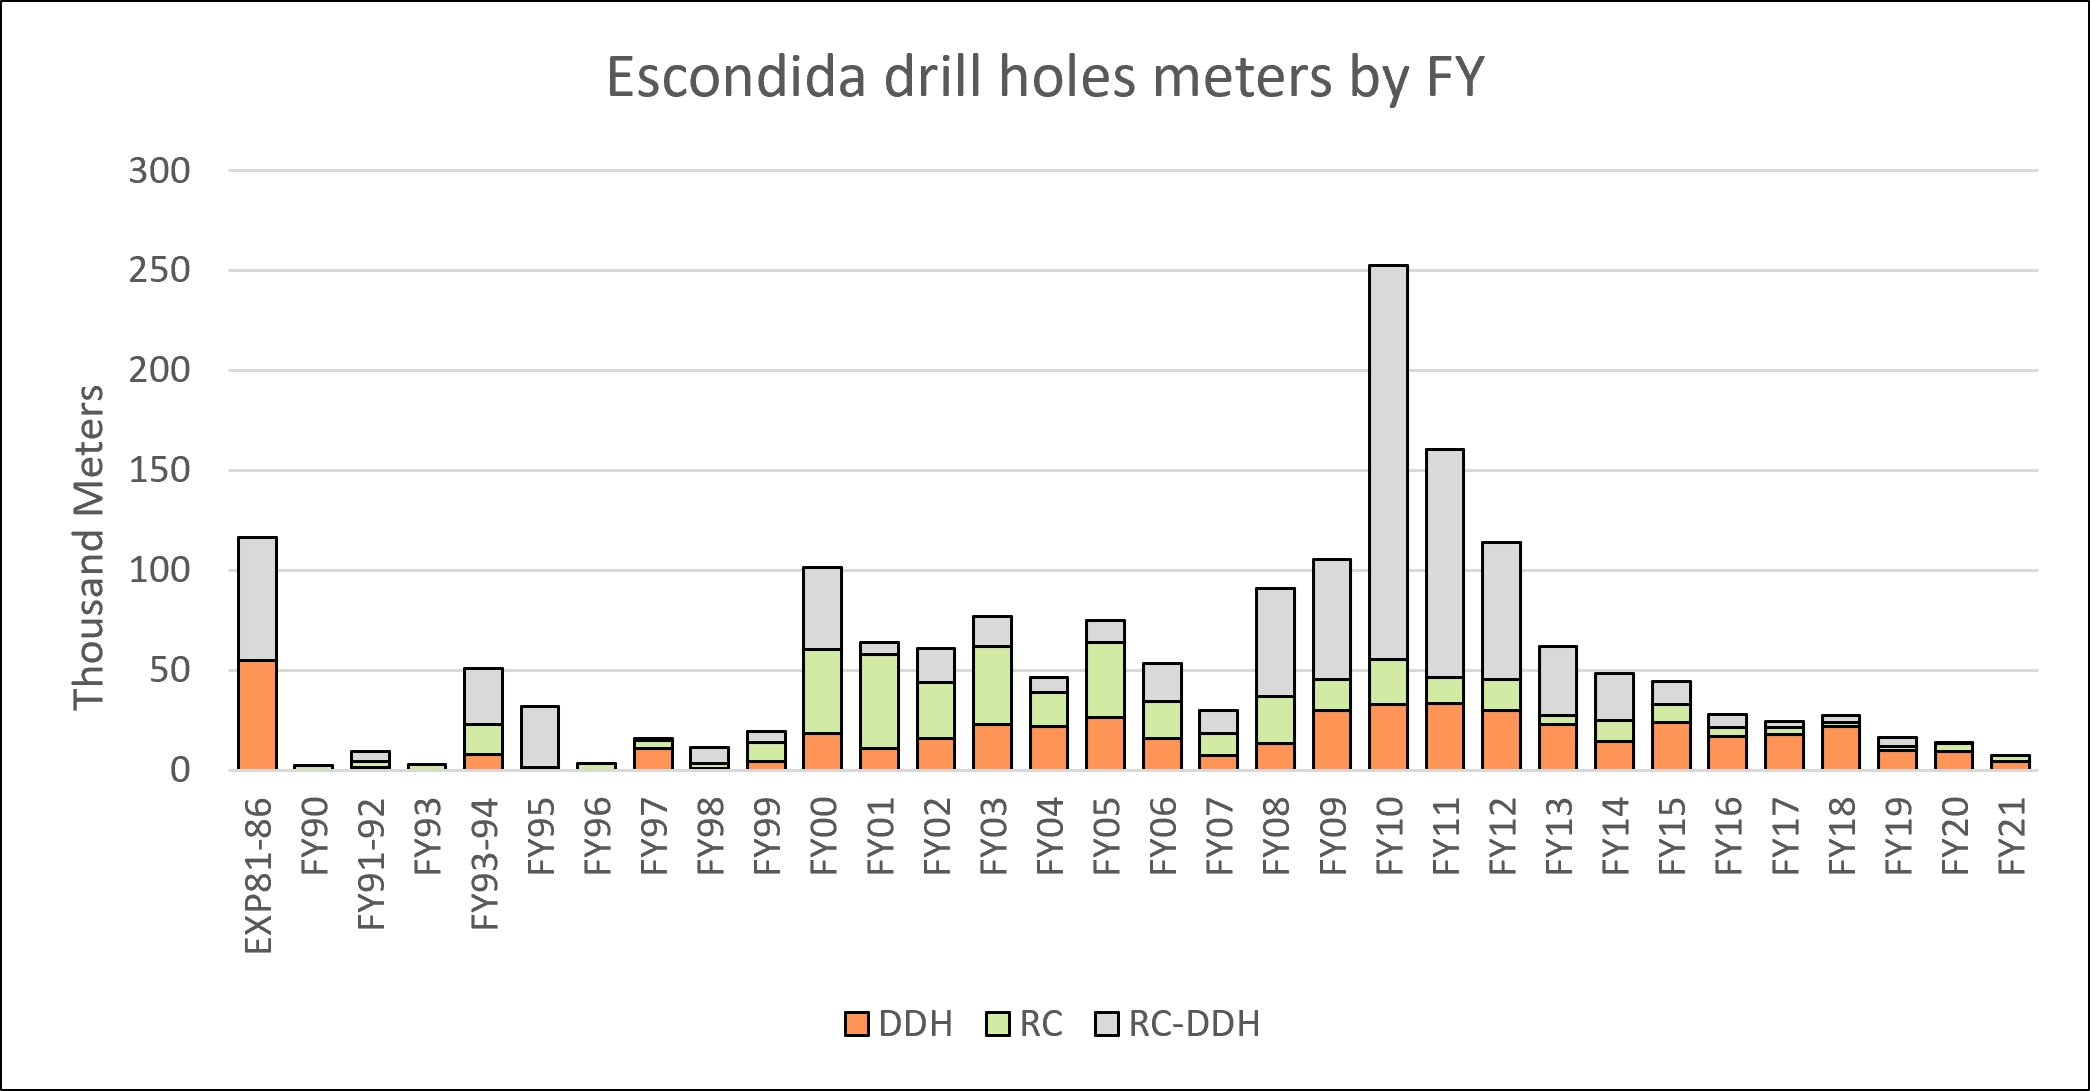
Source: MEL (2022)
|
|
Figure 7‑1: |
Metres Drilled by Drilling Type and FY, Escondida |
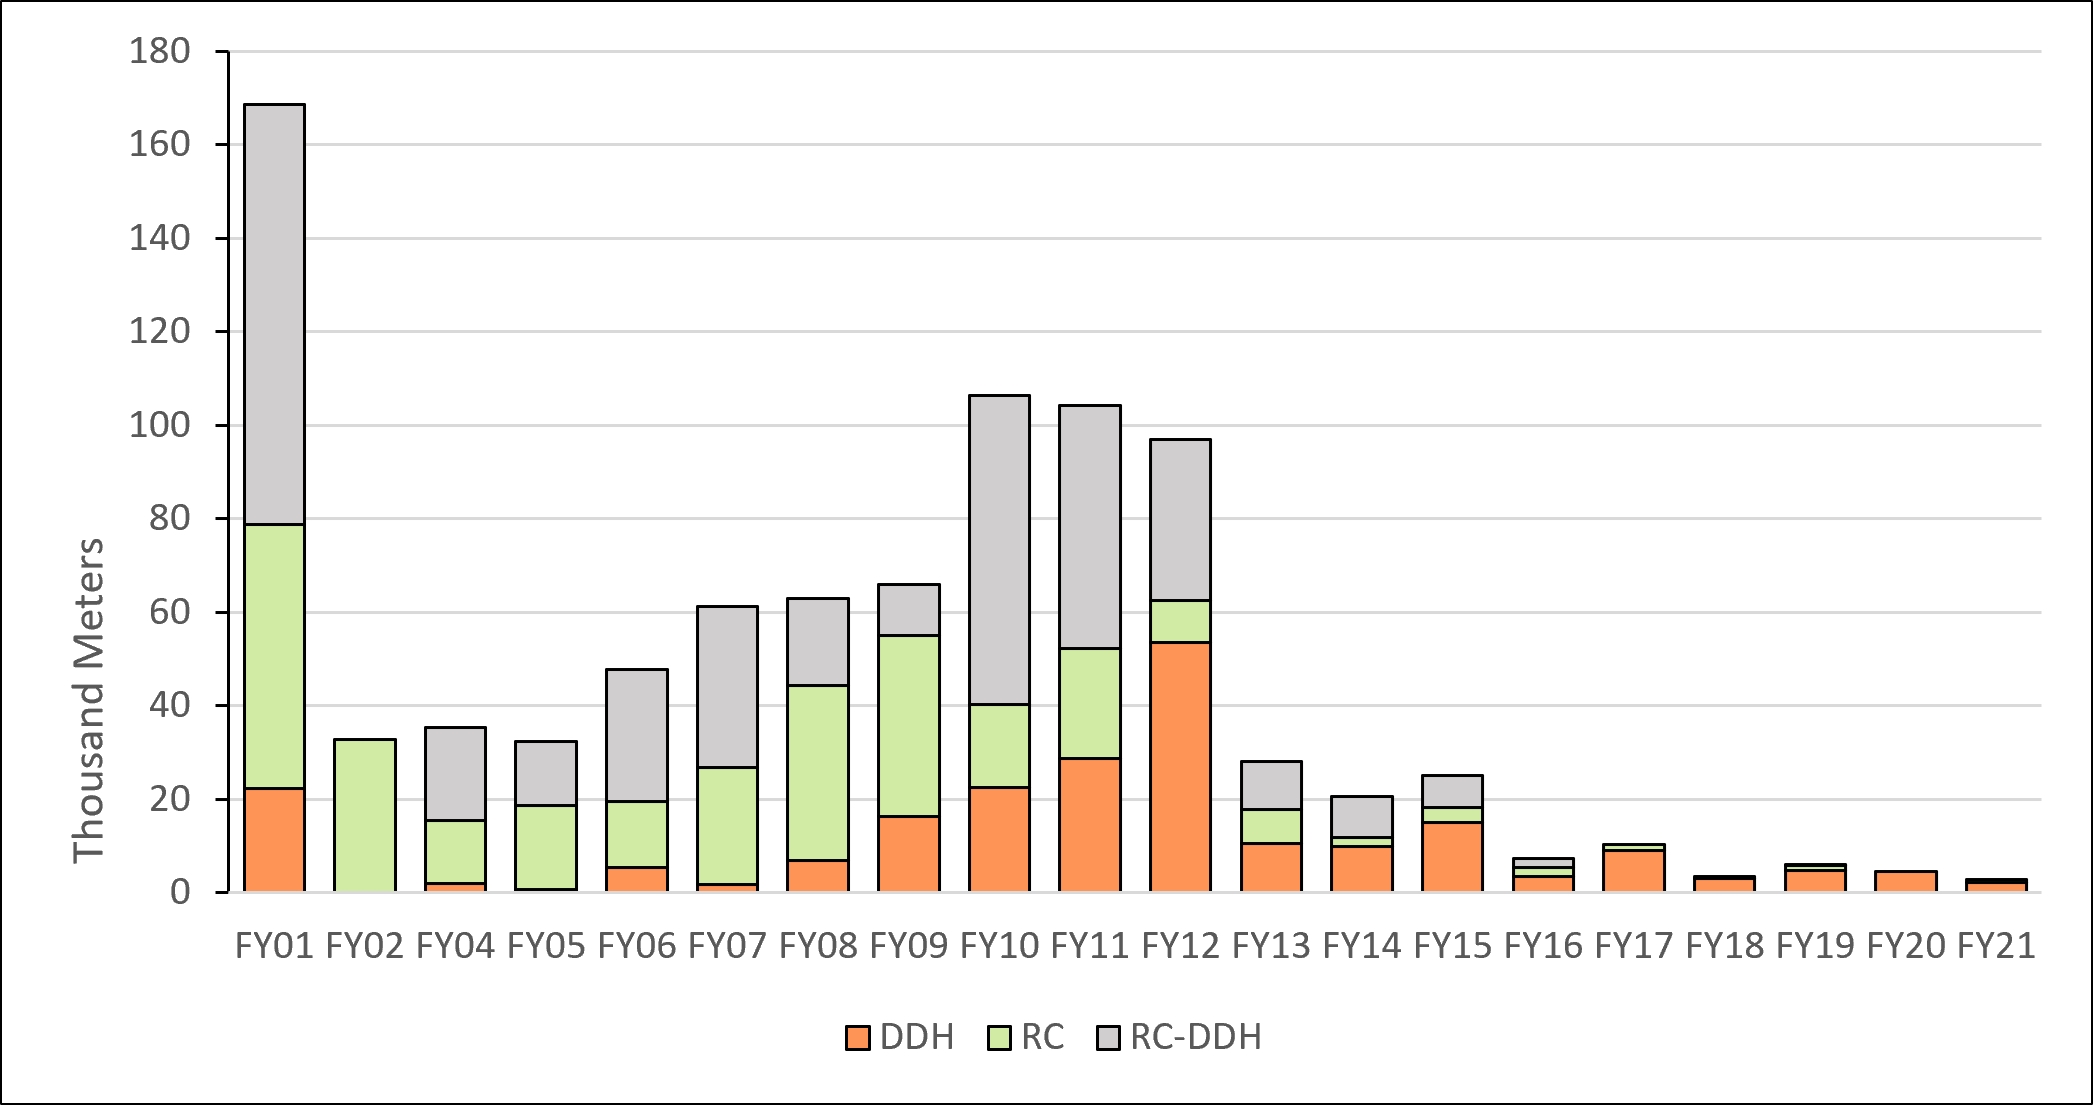
Source: MEL (2022)
|
|
Figure 7‑2: |
Metres Drilled by Drilling Type and FY, Escondida Norte |
|
|
|
|
MEL_TRS_June 2022_Mike |
June 2022 |
|
|
SEC Technical Report Summary – Minera Escondida Limitada |
Page 51 |
Figure 7‑3 shows drill hole collars by type used in the construction of the 2021 Resource model for Escondida and Escondida Norte. Figure 7‑4 and Figure 7‑5 show cross-sections of the drill holes included in the Resource Models of Escondida and Escondida Norte.
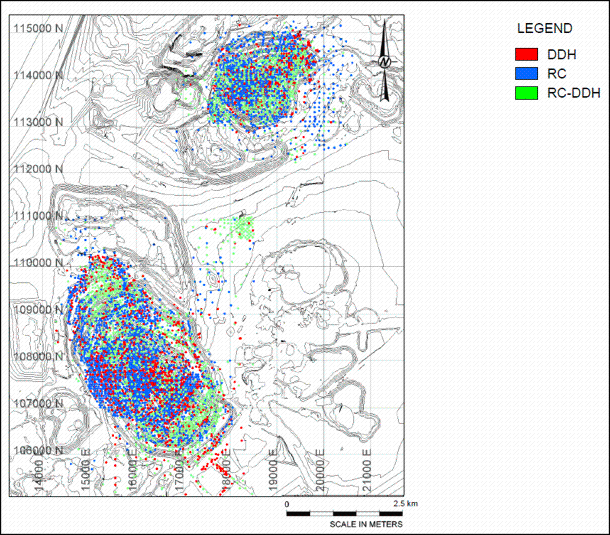
Source: MEL (2022)
|
|
Figure 7‑3: |
Distribution of Collars by Drill Hole Type, Escondida and Escondida Norte |
|
|
|
|
MEL_TRS_June 2022_Mike |
June 2022 |
|
|
SEC Technical Report Summary – Minera Escondida Limitada |
Page 52 |
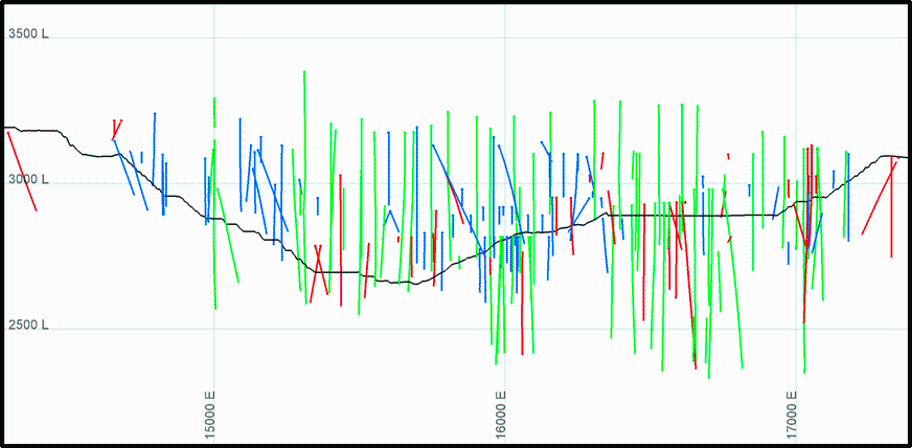
Note: Black line represents the December 31, 2021, topography.
Source: MEL (2022)
|
|
Figure 7‑4: |
Vertical Section 108,600N with Drill Hole per Type, Escondida |
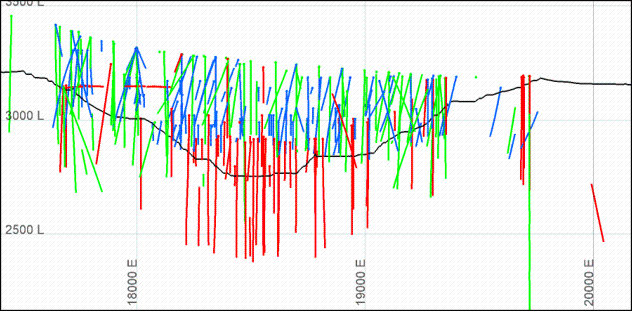
Note: Black line represents the December 31, 2021, topography.
Source: MEL (2022)
|
|
Figure 7‑5: |
Vertical Section 114,000N with Drill Hole per Type, Escondida Norte |
|
|
|
|
MEL_TRS_June 2022_Mike |
June 2022 |
|
|
SEC Technical Report Summary – Minera Escondida Limitada |
Page 53 |
7.2.2.Drilling, Sampling, and Recovery Factors
Recovery was calculated for all DDH holes completed to date, and except for the DDH in unconsolidated gravels, the average recovery (RC and DDH) for any given lithology exceeded 90%. The core recovery was determined by calculating the ratio of length of material returned in the core tube versus the total length drilled for the run and recorded as a percentage. Recovery for RC was calculated by comparing the sample weight recovery against the theoretical weight and recorded as a percentage.
Prior to June 2000, the collars were surveyed by conventional surveying techniques. Subsequently collar was measured using high-definition global positioning system (GPS). Prior to drilling the planned location of the drill hole (X, Y, Z coordinates) was surveyed with a high precision GPS. Location measurements were taken prior to the start of drilling and at the completion of drilling. In general, the differences between both measurements were minor than 30 cm. As a QA/QC procedure, approximately 10% of collar locations were checked by the same contractor but using a different surveyor. The differences reported for all the location checks were less than 10 cm. In instances where the drill hole was inclined and not vertical, the drill rig was oriented in the specified direction and inclination. Once the rig was positioned, the geologist responsible for the drilling campaign confirmed the orientation of the rig with a compass and the inclination with an inclinometer.
Deviation surveys were completed on all drill holes. The historical drill hole deviation was surveyed by several different techniques. Prior to 2000, single-shot cameras collected orientation measurements at intervals of approximately 50 m. From February 2000 to August 2003, the Maxibor instrument obtained orientations at 3 m intervals. From August 2003 through 2012, a multi-shot instrument that determined orientations at 6 m of separation.
The Continuous North Seeking Gyroscope was implemented in 2012 and is still in use today. For orientation surveying Acoustic Televiewer (ATV), with orientation measurements every 10 m and real-time gyroscope, measurements every 20 m, have also been used for a small number of drill holes, but mainly for historical drilling.
In general, the downhole deviation of drill holes was adequate, rarely exceeding a cumulative deviation of 1° per 100 m for both DDH and RC drilling. More significant cumulative deviations that average 2° per 100 m, have occasionally occurred, but limited to high pressure RC drilling. Deviation more than 5% was not accepted by the operation. Drill hole data was discharged and not used for mineral resources estimation.
Detail of sampling and chain security of samples can be found in Chapter 8.
7.2.3.Drilling Results and Interpretation
Of the 2,690,000 m drilled at Escondida and Escondida Norte, and included in the 2021 Resource Model, only 1,400,000 m are located below the current pit topography, and the remainder in mined out areas. Most of the holes are drilled sub vertical, which allows adequate capture of the mantle of supergene enrichment and the zone of hypogene mineralisation. Drill holes spacing of 50 m in the areas close to the open pit limits, increasing up to 300 m beyond this. Figure 7‑6 and Figure 7‑7 show the layout of the drill holes in plan and sections. In the opinion of this QP, the amount, orientation and spacing of drill hole information was sufficient for mineral resources estimation purpose, as discussed in Chapter 11 of this TRS.
|
|
|
|
MEL_TRS_June 2022_Mike |
June 2022 |
|
|
SEC Technical Report Summary – Minera Escondida Limitada |
Page 54 |
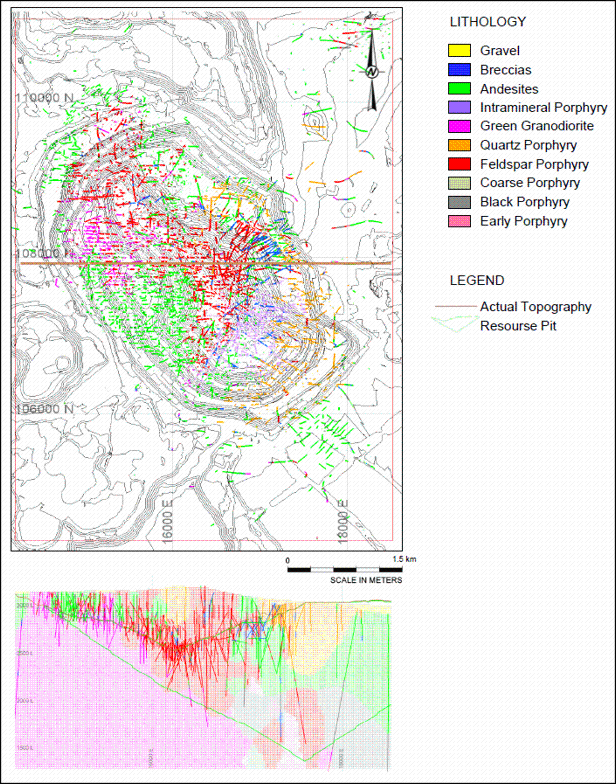
Source: MEL (2022)
|
|
Figure 7‑6: |
Lithology Model Plan View and Vertical Sections, Escondida |
|
|
|
|
MEL_TRS_June 2022_Mike |
June 2022 |
|
|
SEC Technical Report Summary – Minera Escondida Limitada |
Page 55 |
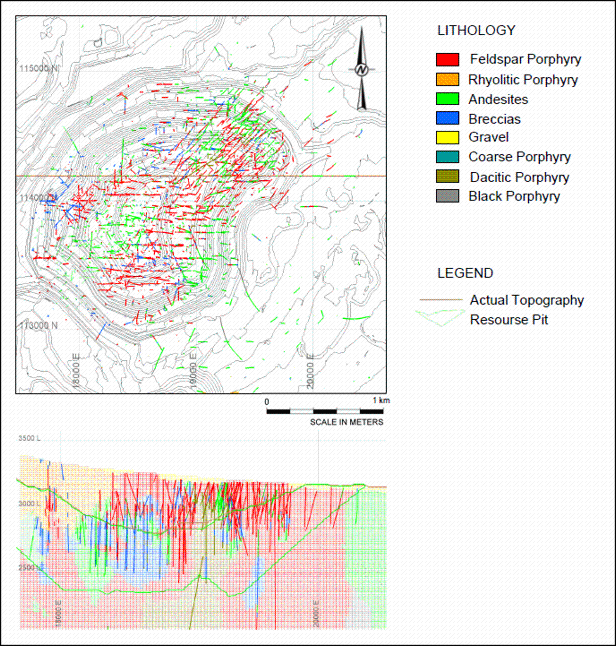
Source: MEL (2022)
|
|
Figure 7‑7: |
Lithology Model Plan View and Vertical Sections, Escondida Norte |
7.2.4.Qualified Person’s Statement on Exploration Drilling
The QP is not aware of any issues related to the drilling, sampling, or recovery factors that could materially affect the accuracy and reliability of the results of the historical drilling and sampling. The data was well documented, via original digital and hard copy records, and was collected using industry standard practices. All data was organised into a current and secure spatial relational database. The data has undergone internal data verification reviews, as described in Chapter 9 of this TRS.
|
|
|
|
MEL_TRS_June 2022_Mike |
June 2022 |
|
|
SEC Technical Report Summary – Minera Escondida Limitada |
Page 56 |
The hydrogeological studies are associated with the performance of hydraulic tests, flow records and piezometric level, generated mainly from the drilling as a continuous process of capture and updating of information, in addition to the data obtained from the monitoring network of the of Escondida and Escondida Norte pits.
The hydraulic tests carried out on the pits correspond to pumping tests, Packer or Lugeon tests, Slug tests and Airlift tests. With this information, hydrogeological properties such as permeability, hydraulic conductivity and others are determined and validated. The main values obtained from the analyses of the tests carried out in Escondida are summarised below.
•The highest permeability (K) values, and higher porosity (S) in the case of airlift tests were observed for all tests in at least one sector of the pit, in sections characterised by Rock Quality Designation (RQD) minimum values in their lower ranges (<50%), and maximum Frequency Fracture (FF) in their upper ranges (5-17 and 17-40 1/m). This was specifically observed on the East and South walls.
•An increase in K values was observed in those tests that presented intersection with major faults, especially in the East, South, and Los Colorados walls. In the East and South walls, the faults with NW orientation would be related to higher values of K; while in the wall Los Colorados, the orientation of faults associated with higher values of K would be NE. The airlift tests did not present structural influence.
•The packer and slug tests showed higher K values in the sections characterised in the supergene mineralisation for the East and Los Colorados walls.
The Escondida hydrogeology characteristics are presented in Table 7‑3.
The main hydrogeology properties values from the analysis of the evidence and data collected in the field in Escondida Norte are summarised below:
•The different magnitude of these responses would be related to the distribution of the fracturing of the rocky mass, represented by the RQD and FF, which would present a preferential orientation in the Northwest-Southeast direction.
•The greatest responses were associated with wells and monitoring piezometers located in an environment characterised by RQD values of 0-25% and FF 17-40 1/m, which align and connect with the pumping wells in a Northwest-Southeast direction. This connection could occur up to 200 m.
•The lowest responses were associated with wells and monitoring piezometers located in an environment characterised by RQD values greater than 50% and FF less than 5 1/m. For monitoring wells in this environment, stable levels were observed that did not respond to pumping, even if the well was 20 m away.
•The above observations are described as an anisotropy (compartmentalisation) in the rocky massif according to the Northwest-Southeast orientation of fracturing zones and their spatial relationship with the associated major faults that strengthens the observations carried out on the performance in terms of flow of the pumping wells.
|
|
|
|
MEL_TRS_June 2022_Mike |
June 2022 |
|
|
SEC Technical Report Summary – Minera Escondida Limitada |
Page 57 |
The methodology used by MEL operations regarding hydrogeology data collection has been clearly established in the BHP Hydrogeological Technical Characterisation guide and is captured for two main purposes: mine operation, and project support. In both cases, all the information was collected in the field and no laboratory testing were used. The quality control are established in the contracts of in-situ test and frequently validate for MEL teams and external consulting companies.
|
|
Table 7‑3: |
Summary Piezometric Characteristics of the Escondida Pit |
|
|
|
|
|
|
|
Wall |
Slope sector |
Elevation Level (m amsl) |
Gradient |
Main Stress |
Decrease Rate (m/month) |
Hydrogeological Control |
South |
Low |
2,557 - 2,565 |
Hydrostatic |
Bottom Pit PW-450 |
<0.1 a 0.4
2.9 a 39.3 |
FF 5-17 y 17-40 1/m
Major Faults NW Conductive
Structural domain 1 |
Middle |
S/I |
N/I |
N/I |
N/I |
FF 5-17 y 17-40 1/m
Major Faults NW Conductive
Structural domain 1 - AND |
Out Pit |
2,783 - 2,950 |
ascending |
Advance S3C, E6 y E7 |
<0.1 a 0.73 |
FF 5-17 y 17-40 1/m
Major Faults NW Conductive
Structural domain 1 - AND
Gravel saturated by anthropic refill |
East |
Low |
S/I |
N/I |
N/I |
N/I |
N/I |
Middle |
2,628 - 2,712 |
Hydrostatic |
horizontal drains and pushback E6 and E7 |
<0.1 a 10.7 |
FF 5-17 y 17-40 1/m
Major Faults NW Conductive
Structural domain 2 |
Middle High |
2,670 - 2,810 |
descending on anhydrite ceiling anhydrite ceiling rise |
horizontal drains and pushback E6 and E7 |
0.4 a 3.7 |
FF 5-17 y 17-40 1/m
Major Faults NW Conductive
Structural domain 2 |
Out Pit |
2,950 - 2,990 |
Hydrostatic - descending |
Pushback E6 y E7 |
0.1 a 1.0 |
FF 2-5 1/m
Major Faults NW Conductive
Mineralisation LIX
Structural domain 3 |
Los
Colorados |
Low |
2,615 – 2,653 |
ascending |
Deepening pit bottom, drains and bottom pumping wells |
0.7 - 1.6 |
FF 2-5 1/m
Major Faults NW Partial Barrier (450)
Mineralisation LIX, HE y LE |
Middle |
N/I |
N/I |
N/I |
N/I |
N/I |
High |
2,782 – 2,940 |
Hydrostatic to descending.
Ascendant in low sensors 2,650 m amsl |
Pit excavation, drainage tunnel and horizontal drains |
0.5 – 0.7 |
FF 17-40 1/m
Major Faults NE conductive
Mineralisation LIX, HE y LE |
Out Pit |
2,966 – 3,014 |
Hanging aquifer |
Anthropic refill |
level increase (0.5 m) |
Mineralisation LIX, HE y LE |
2,860 |
Deep aquifer |
Pit excavation, drainage tunnel and drains |
0.4 |
FF 17-40 1/m
Major Faults NE conductive |
Northeast |
Low |
2,608 – 2,714 |
Ascendant |
Deepening of the pit bottom, pumping wells and horizontal drains |
0.2 - 0.8 |
FF 2-5 1/m
Major Faults NW Partial Barrier (450)
Mineralisation LIX, HE y LE |
Middle
High |
2,758 - 2,852 |
Low sensor upstream
2,600 m amsl |
Pit excavation, drainage tunnel and horizontal drains |
0.2 - 0.6 |
FF 17-40 1/m
Anhydrite ceiling |
High |
2,780 |
Hydrostatic |
Pit excavation, drainage tunnel and horizontal drains |
0.3 |
FF 17-40 1/m |
Out Pit |
3,009 |
N/I |
Anthropic refill |
0.1 - 0.2 |
Mineralisation LIX, HE y LE |
2,855 – 2,940 |
Hydrostatic |
Excavation of the pit and
system D&D in pit |
0.2 - 0.5 |
FF 17-40 1/m
Anhydrite ceiling |
|
|
|
|
MEL_TRS_June 2022_Mike |
June 2022 |
|
|
SEC Technical Report Summary – Minera Escondida Limitada |
Page 58 |
|
|
|
|
|
|
|
Wall |
Slope sector |
Elevation Level (m amsl) |
Gradient |
Main Stress |
Decrease Rate (m/month) |
Hydrogeological Control |
Northwest |
Middle Low |
2,555 - 2,577 |
Hydrostatic |
Excavation and pumping pit bottom
Infiltrations pools area ex-Crushing |
0.13 a 5.03 |
Anhydrite ceiling |
High |
2,707 - 2,800 |
Hydrostatic |
0.2 |
Out Pit |
2,898 - 3,060 |
Ascending |
Pushback N16 |
<0.1 a 0.5 |
Bottom Pit |
- |
2,490 – 2,561 |
Ascending |
Excavation and pumping pit bottom |
0.1 – 8.1 |
FF 2-5 1/m
Major Faults NW Conductive |
Source: MEL (2022)
In the mining operation, the main activities are:
•Drilling of RC holes for water production and the installation of a monitoring network.
•Hydrogeological logging of drill holes, including definition of lithology, alteration and presence of faults or structures.
•Measurement of the piezometric elevation.
•Airlift tests each time a drill hole was added.
•Based on all this information it was estimated the optimum operating flow rate of the producing wells and thus define the hydrogeological transmissivity of the immediate environment.
As at 30 June 2022, the hydrogeology monitoring network for MEL includes 35 active monitoring points in order to detect variations of the water table and pore pressure as well as estimate the hydraulic properties in the rock mass (Figure 7‑8 and Figure 7‑9). During the ordinary course of the mine life new sensors are installed and other are lost due to the normal mining exploitation activity.
|
|
|
|
MEL_TRS_June 2022_Mike |
June 2022 |
|
|
SEC Technical Report Summary – Minera Escondida Limitada |
Page 59 |
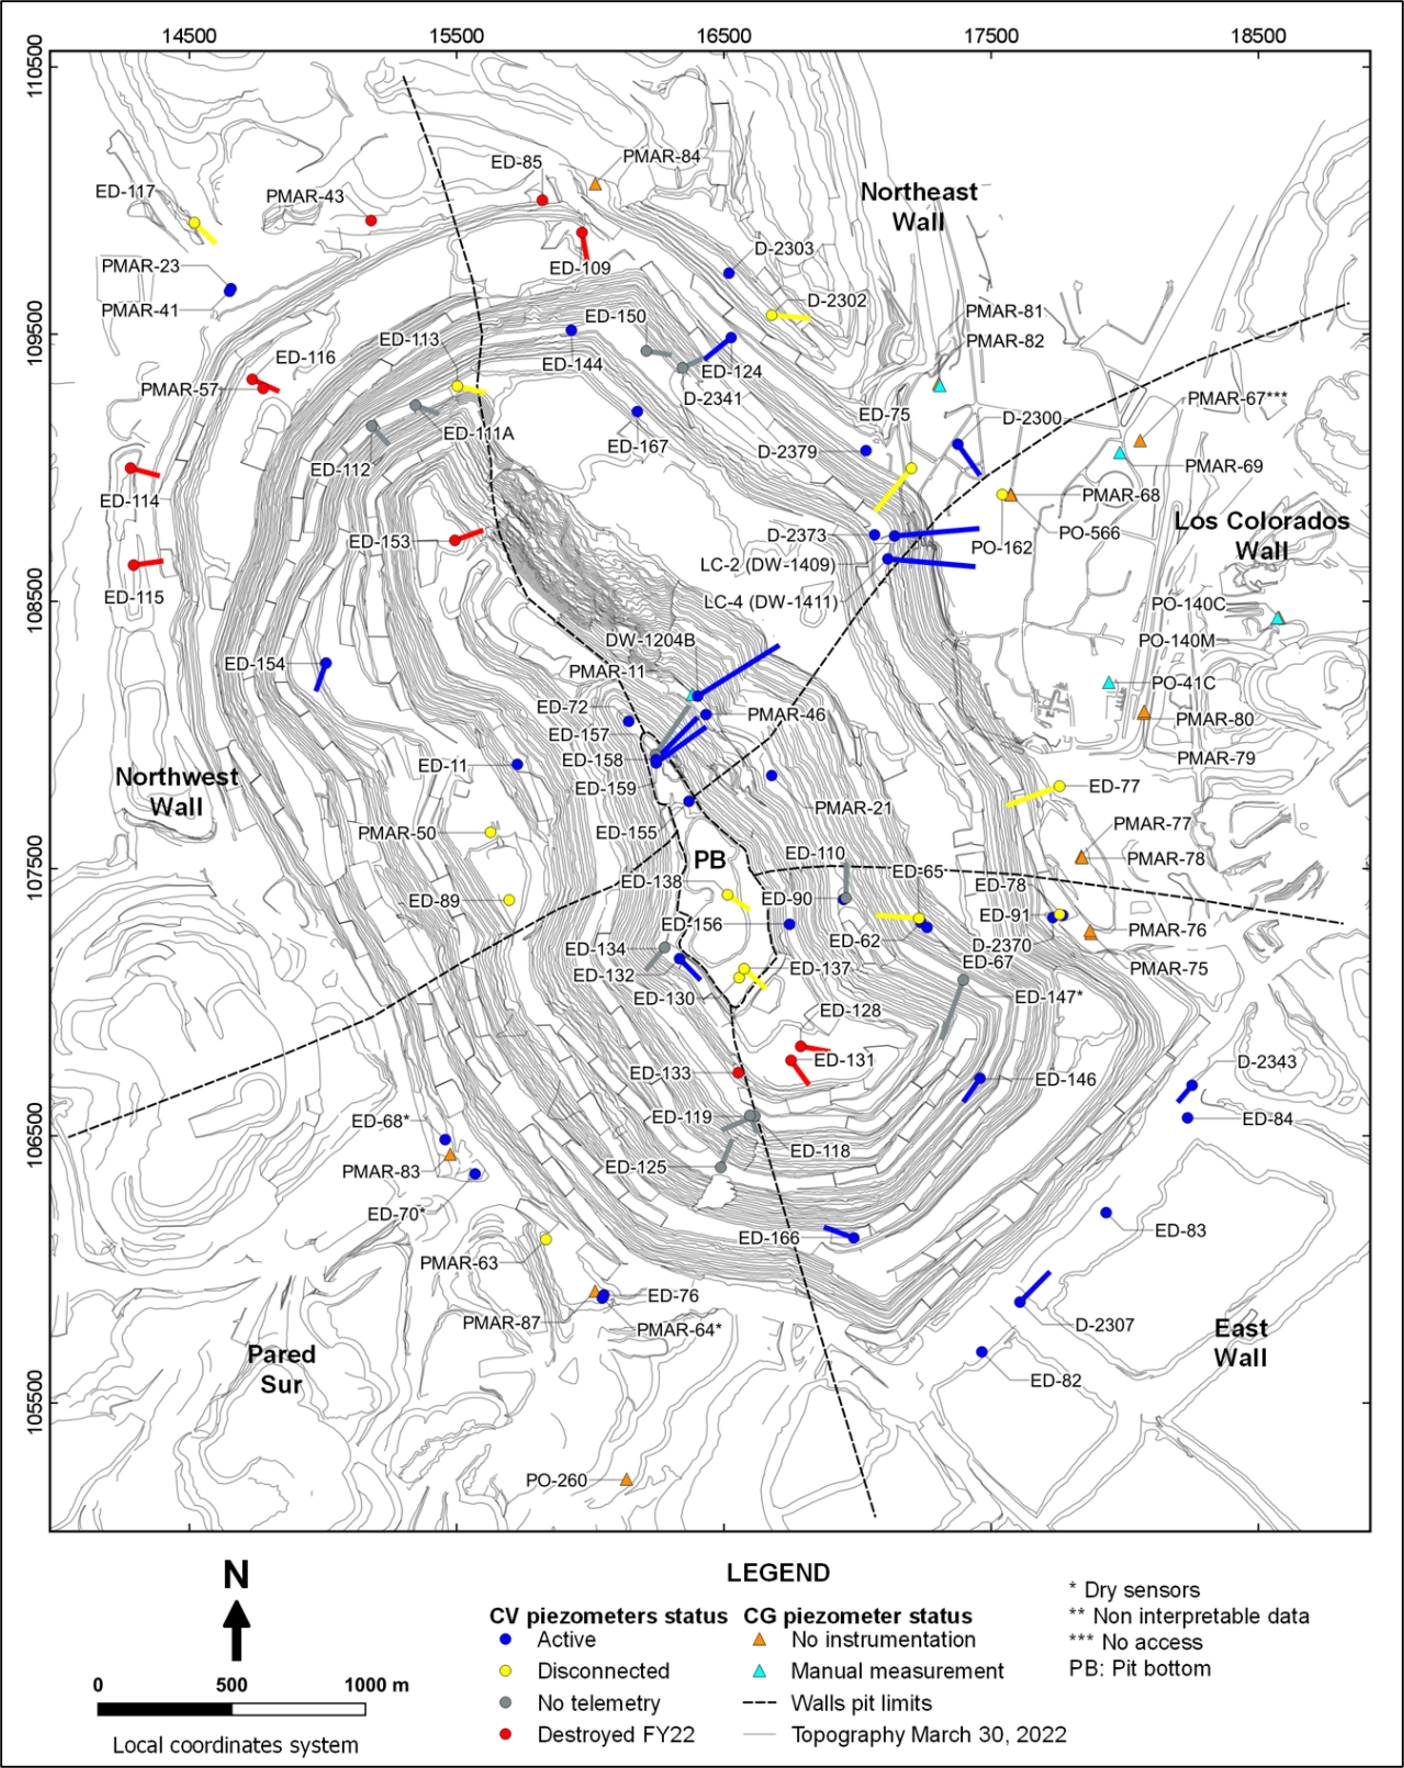
Source: MEL (2022)
|
|
Figure 7‑8: |
Piezometric Monitoring Network in the Escondida Pit |
|
|
|
|
MEL_TRS_June 2022_Mike |
June 2022 |
|
|
SEC Technical Report Summary – Minera Escondida Limitada |
Page 60 |
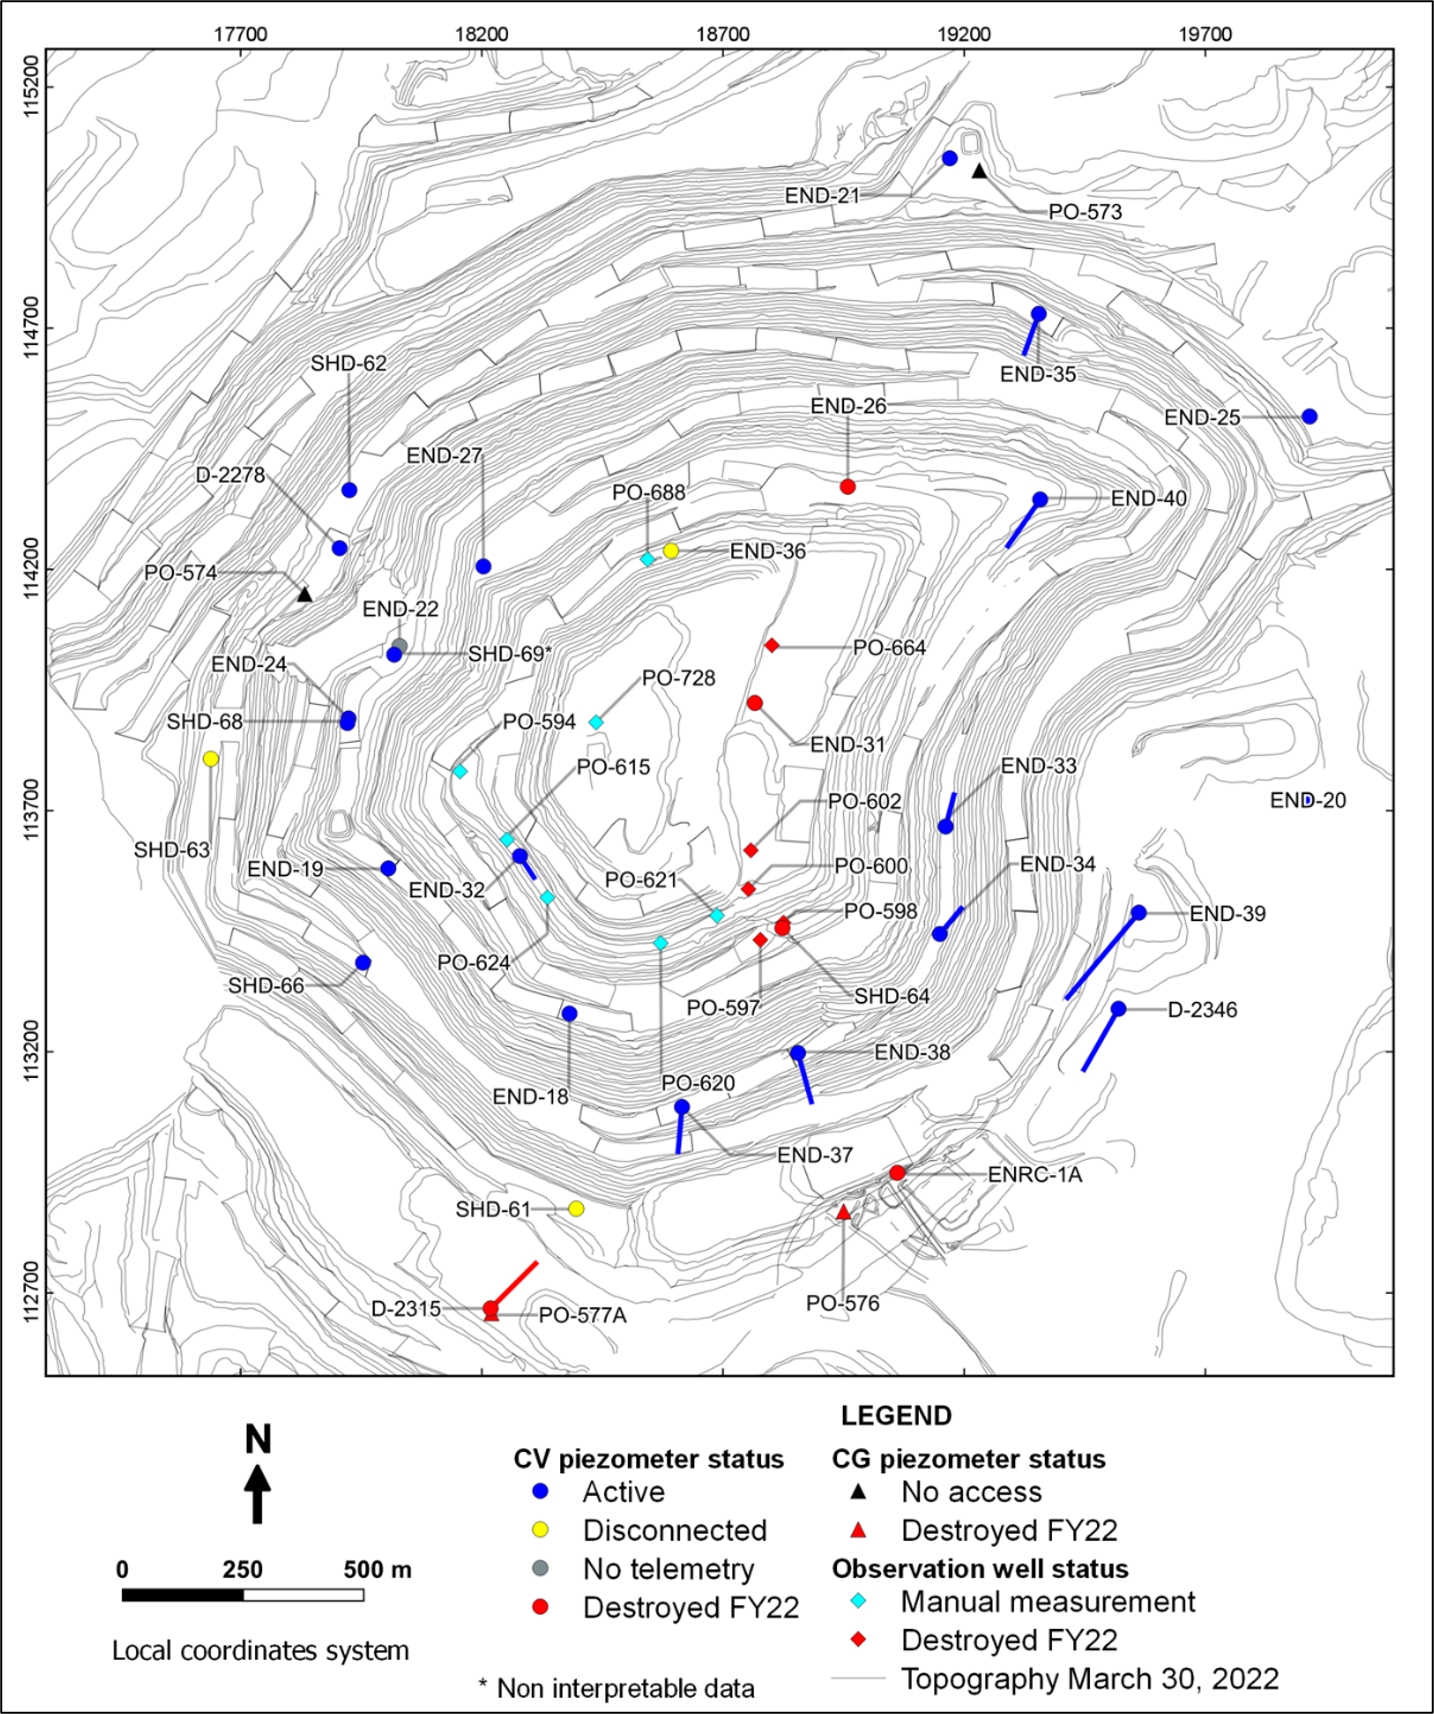
Source: MEL (2022)
|
|
Figure 7‑9: |
Piezometric monitoring network in Escondida North pit |
In the QP’s opinion, the type and appropriateness of laboratory techniques (such as Pumping tests, slug tests and packer tests) used to test for groundwater flow parameters, such as permeability, and QA/QC procedures, are reasonable. MEL gathers information on permeable zones and local aquifers, flow rates, in-situ saturation, recharge rates and water balance and with this information the MEL hydrogeology group generates ground water models used to characterize aquifers, including material assumptions used in the modelling. These groundwater models are used for geotechnical analysis of pit stability and other required activities.
|
|
|
|
MEL_TRS_June 2022_Mike |
June 2022 |
|
|
SEC Technical Report Summary – Minera Escondida Limitada |
Page 61 |
In addition to the continuous hydrogeological evaluation of the operating pits at the MEL operation hydrogeological evaluation is also undertaken for specific projects. These studies are generally outside of the regular production areas and include studies, such as, among others, new leaching areas, new tailing storage developments and the evaluation of potential future underground mining alternatives.
Hydrogeological characterisation campaigns are carried out according to the detail required by the project status, and generally includes DDH drilling with core recovery which was carried out to capture the following information:
•Geological logging and hydrogeological characterisation including definition of lithology, alteration, and presence of faults or structures.
•Piezometric level measurement.
•Execution of Lugeon permeability tests to establish the permeability of the hydrogeological units tested.
•Installation of vibrating string sensors at different depths to define the pore pressure distribution in the different hydrogeological units, hydrogeological gradients in the vertical and horizontal directions, location of the piezometric level at surface and the direction of underground flow.
•Ad hoc geochemical and/or hydrogeochemical evaluation may be also undertaken as required
The details of characterisation and monitoring network in hydrogeology models is included in Section 13.2.2.
7.4.Geotechnical Data, Testing, and Analysis
Every year geotechnical drilling campaign obtains samples from sectors with low information density or with more complex geological conditions. Figure 7‑10 presents an example of the UCS model associated with the described geological units. The methodology used by the MEL operation in the geotechnical data collection, laboratory tests and analysis of information is established in the BHP Geotechnical Characterisation guide associated to estimate the rock mass properties (Geotechnical Standard Version 3.0), in Table 7‑4 and Table 7‑5.
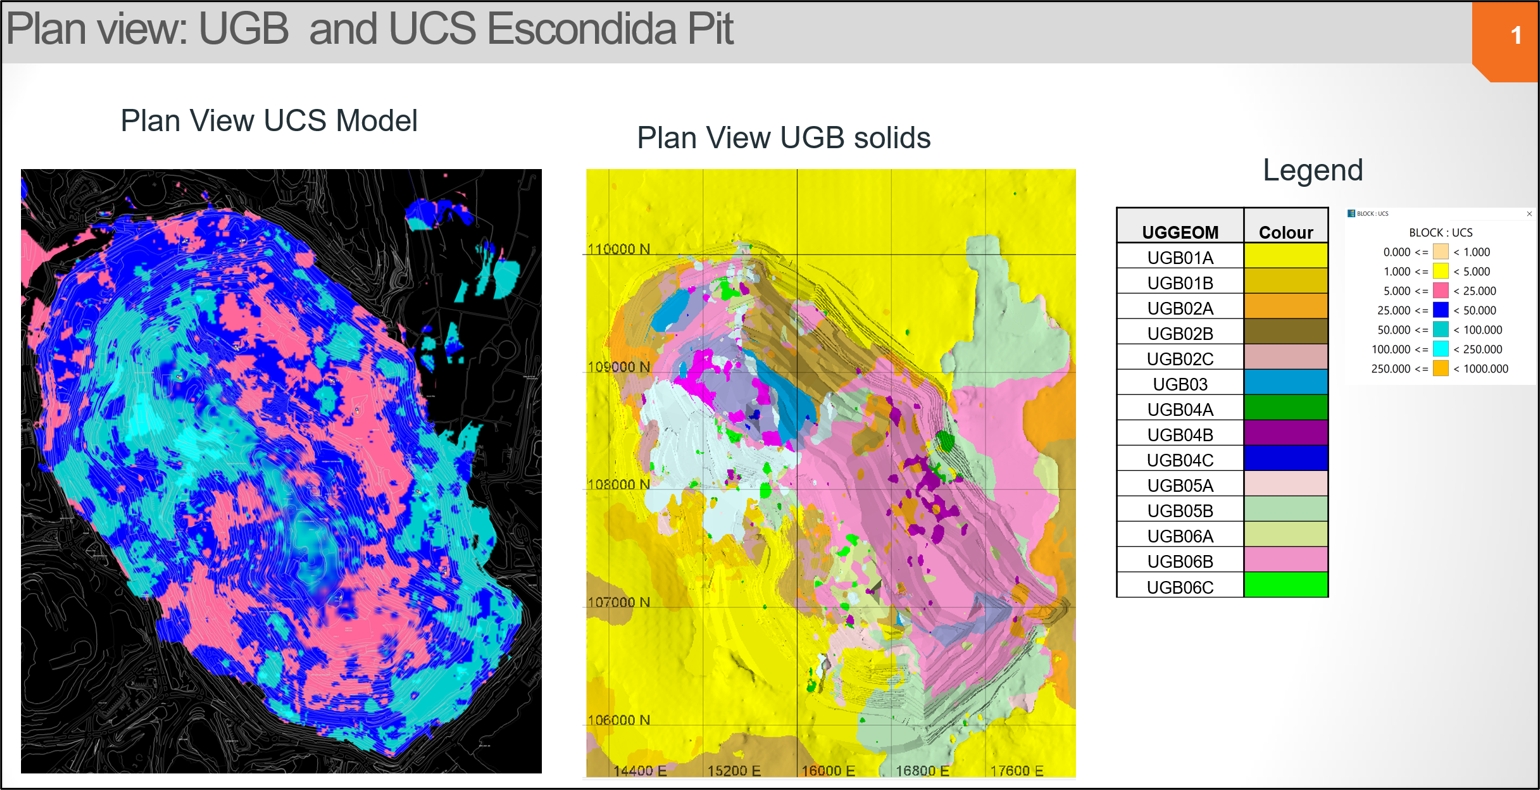
Source: MEL (2022)
|
|
Figure 7‑10: |
Geotechnical Unit and Uniaxial Compression Strength (UCS) Escondida Mine |
|
|
|
|
MEL_TRS_June 2022_Mike |
June 2022 |
|
|
SEC Technical Report Summary – Minera Escondida Limitada |
Page 62 |
7.4.1.Geotechnical Drilling
Geotechnical drilling and sampling are completed internally by MEL staff as part of the routine programme. The geotechnical drilling campaigns are completed with DDH drill holes with a core diameter of HQ3 gauge (63.5 mm). To enhance the adequacy of the drilling and geotechnical sampling, the process is led by trained personnel and follows established protocols.
From the probes there are samples of rocks which are identified with respect to their location, lithology, alteration and classified according to degree of resistance, including:
•Primary (1st) which are the most resistant rocks which have not been affected by leaching
•Secondary sensu strictu (2ss) which are the weakest rocks affected by surface leaching, and
•Secondary (2nd) transition that are rocks of intermediate resistance partially affected by surface leaching.
Table 7‑4 shows the number of trials of each type. This information is used in the stability calculations of the design to be able to know the safety factors of the slopes at different scales inter-ramp and global slope. These calculations can be of limit equilibrium or numeric.
|
|
Table 7‑4: |
Distribution of Historical Geotechnical Samples by Alteration, Lithology, and
Geotechnical Zone, Escondida and Escondida Norte |
|
|
|
|
|
|
|
|
|
Lithology |
Alteration |
1rio |
2ss |
2tr |
Total |
TCS |
UCS |
TCS |
UCS |
TCS |
UCS |
Andesite |
ARG |
|
|
31 |
25 |
29 |
21 |
106 |
BIO |
4 |
5 |
|
1 |
5 |
|
15 |
QSC |
1 |
10 |
174 |
71 |
124 |
34 |
414 |
SCC |
1 |
30 |
11 |
21 |
52 |
13 |
128 |
SGV |
1 |
1 |
|
|
2 |
|
4 |
Breccia |
ARG |
|
|
1 |
3 |
23 |
|
27 |
BIO |
1 |
3 |
|
|
|
|
4 |
POT |
|
|
1 |
|
|
|
1 |
QSC |
|
|
179 |
81 |
156 |
83 |
499 |
SCC |
|
2 |
4 |
6 |
21 |
13 |
46 |
SGV |
|
1 |
|
|
|
|
1 |
Feldspar Porphyry |
ARG |
|
|
3 |
5 |
18 |
3 |
29 |
POT |
4 |
|
|
|
7 |
1 |
12 |
QSC |
8 |
6 |
188 |
107 |
388 |
209 |
906 |
SCC |
2 |
22 |
|
1 |
25 |
6 |
56 |
SGV |
7 |
|
|
|
10 |
2 |
19 |
Quartziferous Porphyry |
ARG |
|
|
11 |
|
25 |
3 |
39 |
QSC |
|
|
118 |
51 |
98 |
57 |
324 |
SCC |
|
|
|
|
1 |
2 |
3 |
Late Porphyry |
CLO |
|
5 |
|
|
|
|
5 |
SGV |
2 |
4 |
|
|
1 |
1 |
8 |
BLANK |
|
|
|
4 |
1 |
21 |
1 |
27 |
Total |
|
|
|
|
|
|
|
2673 |
Source: MEL (2022)
To characterize and obtain the in-situ rock parameters, destructive and non-destructive tests were completed during the 2021 campaign. Destructive tests include Indirect Traction (IT), Uniaxial Compression (UCS), and Triaxial Compression (TCS). The QA/QC process include verification visit to Labs, use of international standards and checks of the process, tests and samples pre and post-test (the last process was with the SRK support).The detail of the total number of samples of for FY20 and FY21 campaigns are presented in Table 7‑5 and Table 7‑6.
|
|
|
|
MEL_TRS_June 2022_Mike |
June 2022 |
|
|
SEC Technical Report Summary – Minera Escondida Limitada |
Page 63 |
|
|
Table 7‑5: |
Distribution of 2020-2021 Geotechnical Samples by Alteration, Lithology and
Geotechnical Zone, Escondida and Escondida Norte |
|
|
|
|
|
|
|
|
|
Lithology |
Alteration |
1rio |
2ss |
2tr |
Total |
TCS |
UCS |
TCS |
UCS |
TCS |
UCS |
Andesite |
SCC |
|
|
1 |
|
|
|
1 |
QSC |
2 |
1 |
22 |
9 |
4 |
1 |
39 |
POT |
|
|
|
|
5 |
3 |
8 |
SGV |
|
|
|
|
25 |
11 |
36 |
QSC |
2 |
|
1 |
3 |
|
|
6 |
Breccia |
- |
2 |
|
|
3 |
|
|
5 |
Hydrothermal Breccia |
- |
|
1 |
|
1 |
|
|
2 |
Igneous Breccia |
QSC |
|
|
6 |
2 |
|
|
8 |
SCC |
|
|
1 |
2 |
2 |
1 |
6 |
QS |
|
|
|
1 |
|
|
1 |
QSA |
|
|
2 |
1 |
|
|
3 |
Quartziferous Porphyry |
QSC |
|
|
6 |
3 |
|
|
9 |
QS |
14 |
7 |
45 |
18 |
|
|
84 |
QSC |
2 |
1 |
7 |
3 |
|
|
13 |
Intermineral Porphyry |
CL |
|
|
|
|
1 |
1 |
2 |
QSC |
|
|
3 |
3 |
|
|
6 |
QS |
|
|
|
|
2 |
3 |
5 |
SCC |
|
|
6 |
|
27 |
9 |
42 |
QS-GV |
1 |
4 |
14 |
3 |
2 |
|
24 |
Feldspar Porphyry |
- |
7 |
1 |
2 |
1 |
1 |
2 |
14 |
Late Porphyry |
- |
|
|
2 |
1 |
|
|
3 |
Dacitic Tuff |
- |
4 |
2 |
7 |
3 |
|
|
16 |
Total |
|
34 |
17 |
51 |
182 |
69 |
31 |
333 |
Source: MEL (2022)
Table 7‑6 summarizes the strength properties by geotechnical unit for the Escondida and Escondida Norte pits, respectively.
|
|
Table 7‑6: |
Strength Properties by Geotechnical Unit for the Escondida and Escondida Norte |
|
|
|
|
|
|
|
|
|
UGB |
mi (-) |
ci (MPa) |
UGB |
mi (-) |
ci (MPa) |
UGB |
mi (-) |
ci (MPa) |
BGU01A |
13.5 |
33.8 |
BGU06B |
8.2 |
67.7 |
UGB01AN |
25.2 |
17.9 |
BGU01B |
8.2 |
62.5 |
BGU06C |
8.4 |
61.4 |
UGB02AN |
11.2 |
93.2 |
BGU02A |
10.7 |
38.9 |
BGU07A |
15.7 |
118.7 |
UGB02BN |
12.8 |
30.4 |
BGU02B |
13.7 |
58.3 |
BGU07B |
10.1 |
73.0 |
UGB02CN |
10.6 |
46.6 |
BGU02C |
19.9 |
27.8 |
BGU07C |
11.6 |
147.3 |
UGB02DN |
9.5 |
53.0 |
BGU03 |
10.7 |
117.0 |
BGU08A |
23.9 |
46.7 |
UGB03AN |
6.0 |
74.5 |
BGU04A |
9.9 |
41.3 |
BGU08B |
17.9 |
142.9 |
UGB03BN |
6.7 |
53.1 |
BGU04B |
7.6 |
47.0 |
BGU09A |
7.1 |
50.2 |
UGB04AN |
18.6 |
45.4 |
BGU05A |
11.1 |
52.7 |
BGU09B |
17.8 |
101.4 |
UGB04BN |
43.1 |
98.0 |
BGU05B |
6.8 |
60.5 |
BGU06B |
8.2 |
67.7 |
UGB05AN |
43.5 |
88.5 |
BGU06A |
10.2 |
47.4 |
|
|
|
UGB05BN |
19.3 |
64.0 |
|
|
|
|
|
|
UGB06N |
20.1 |
124.7 |
|
|
|
|
|
|
UGB08N |
35.4 |
23.6 |
Source: MEL (2022)
|
|
|
|
MEL_TRS_June 2022_Mike |
June 2022 |
|
|
SEC Technical Report Summary – Minera Escondida Limitada |
Page 64 |
Figure 7‑11 shows the location of all the drill holes used in the resource estimation. This figure presents the location of this information with respect to the block model volumes that support the mineral resources and mineral reserves estimates.
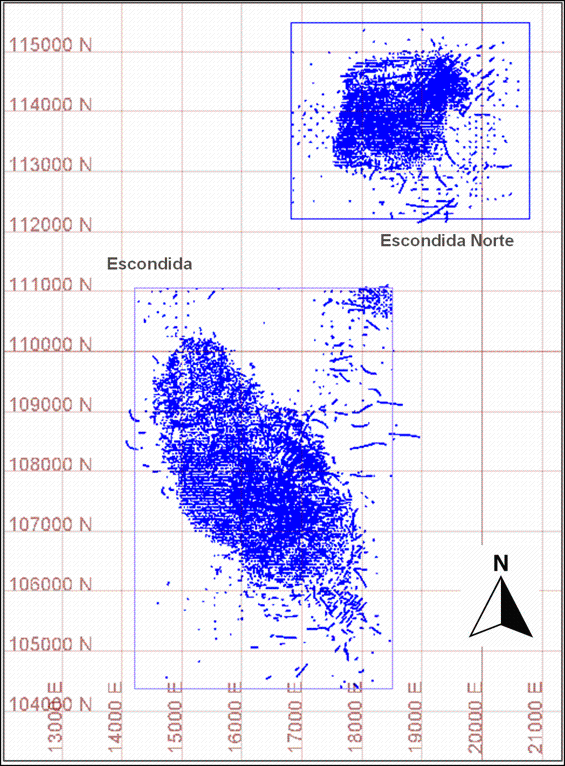
Source: MEL (2022)
|
|
Figure 7‑11: |
Drill Hole (Samples) Location for Escondida and Escondida Norte Areas |
|
|
|
|
MEL_TRS_June 2022_Mike |
June 2022 |
|
|
SEC Technical Report Summary – Minera Escondida Limitada |
Page 65 |
No exploration targets are reported in this TRS.
8.Sample Preparation, Analyses and Security
8.1.Sample Preparation Methods and Quality Control Measures
MEL employs mining industry standard methodologies to undertake sampling and sample preparation processes regarding drill hole samples of various types. These methodologies are governed by internal protocols and procedures developed specifically for MEL’s operational reality whilst also respecting BHPs internal company standards. Quality control of these processes are also required to adhere to both mining industry best practice and BHPs internal company standards.
Since the discovery of the Escondida deposit, the history of drilling at MEL has progressed from the initial use of conventional drilling during the discovery program to a balance of reverse circulation (RC) drilling and diamond drill hole (DDH). The approach, applied since the late 1980s, employs the different drilling techniques to balance the drillhole information and sample requirements with the cost and time elements for the acquisition of the required samples and data. This approach has generated variable amounts of drilling and sampling types throughout the history of MEL’s data acquisition. Discussion of sampling herein concerns the RC and DDH (core) samples that support the geological evaluation and modelling.
RC Drilling
The RC samples were retrieved from the drill-mounted cyclone and were collected at continuous intervals of 2 m. The original sample (approximately 80 kg) was then divided with a riffle (Jones) splitter obtaining two sub‑samples, each one representing 50% of the total. One of the portions was discharged (reject), while the second portion was quartered again to obtain two sub-samples (A and B), each corresponding to 25% of the total, of approximately 20 kilograms (Figure 8‑1). During each division of the sample, the weight was recorded in order to evaluate that the process was being carried out properly. If there was presence of water, the drilling changed to DDH.
The sample was then placed in plastic bag, labelled with a bar code and sealed prior to transfer to the mechanical preparation facility.
The drilling contractor was responsible for the transportation of the samples to the warehouse.
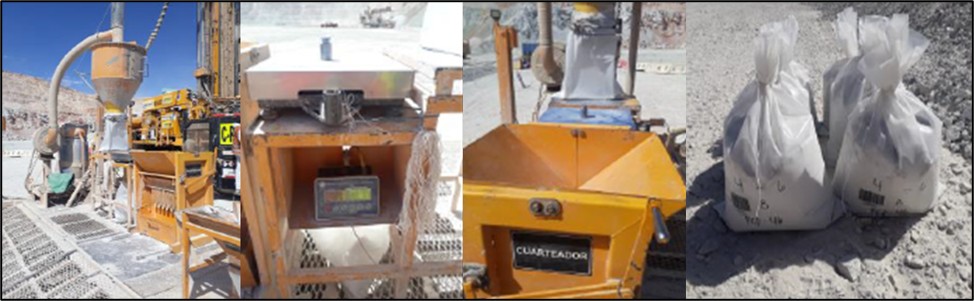
Source: MEL (2022)
|
|
Figure 8-1: |
RC Sampling; A) Sample Collection; B) Weight control; C) Sample Splitting; D) A and B Samples |
|
|
|
|
MEL_TRS_June 2022_Mike |
June 2022 |
|
|
SEC Technical Report Summary – Minera Escondida Limitada |
Page 66 |
Core Drilling
Diamond drill hole cores were carefully handled at all stages of transport by the contractors. The cores were packed sequentially in metallic core boxes as they were collected from top to bottom and left to right in the order in which it was retrieved from the core barrel. For each core run, a wooden block, was placed where the driller notes the depth of the hole indicating the interval drilled. The boxes were properly labelled with the drill hole name, box number, and interval (Figure 8‑2). The drilling contractor was responsible for the transportation of the samples to the warehouse.
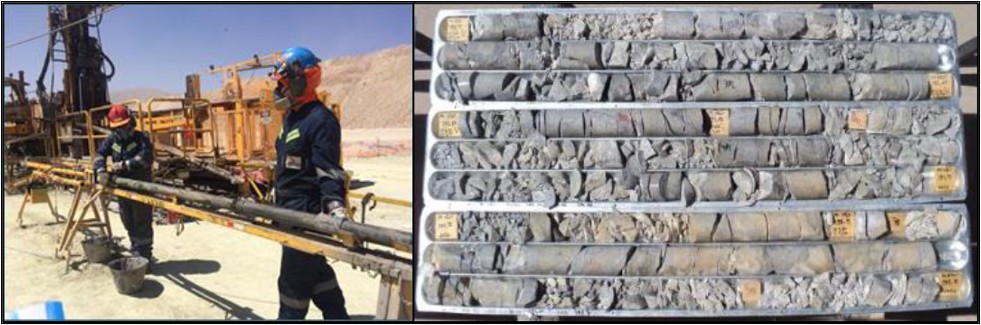
Source: MEL (2022)
|
|
Figure 8-2: |
DDH Sampling; A) Sample Collection; B) Sample Distribution in Metallic Trays |
Once metallic trays were received in the warehouse core length was measured and marked every 2 m to regularize the sample length. These measurements are compared with those obtained by the drilling contractor. In case of differences, the drilling contractor was requested to repeat the regularisation process. The core recovery was calculated and reported as a percentage. This process was completed digitally and automatically uploaded to acQuire. When needed, these measurements are compared with those obtained by the drilling contractor and. in case of differences, the drilling contractor is requested to repeat the regularisation process.
|
|
|
|
MEL_TRS_June 2022_Mike |
June 2022 |
|
|
SEC Technical Report Summary – Minera Escondida Limitada |
Page 67 |
Core Photography
Core photography with a digital camera was part of the standard procedures for core logging. Each drill hole tray was photographed from the top to show a view of the core in full screen using a device to maintain the same illumination in each section of the drill hole (Figure 8‑3 A). The start and end depths were marked on the open box lid. Typed sheets showing the drill hole ID and core box number were also displayed on the core. The photographs were stored online in Imago software (Figure 8‑3 B).
Source: MEL (2022)
|
|
Figure 8-3: |
A) Core Photography. B) Photography Stored in Imago Software |
Logging
Drill hole logging was performed by geologists at the MEL warehouse (Figure 8‑4) and supervised by senior MEL geologists. The logging process included preparing a detailed description of the lithology, as well as, the description of alteration, mineral zones and a visual grade estimation. Based on the geological description, codes were assigned to each geological unit. The logging process was carried out digitally on laptops and uploaded online into acQuire. The process included description of:
•Lithology: The description included textural parameters, associations, and mineralogical species.
•Alteration: Main and subordinate alteration were registered, the mineralogical species identified, and the intensity of the alteration were described.
•Mineralisation: Definition of mineral surfaces associated to the main zones of the deposit such as leached, oxide, mixed, secondary enrichment and primary were recorder. Description includes volume percentage of each sulphide species, oxidised and others. Also, occurrence such as disseminated or veinlets.
|
|
|
|
MEL_TRS_June 2022_Mike |
June 2022 |
|
|
SEC Technical Report Summary – Minera Escondida Limitada |
Page 68 |
Also, the geologist defined the cutting schemes for core and the assaying schemes.
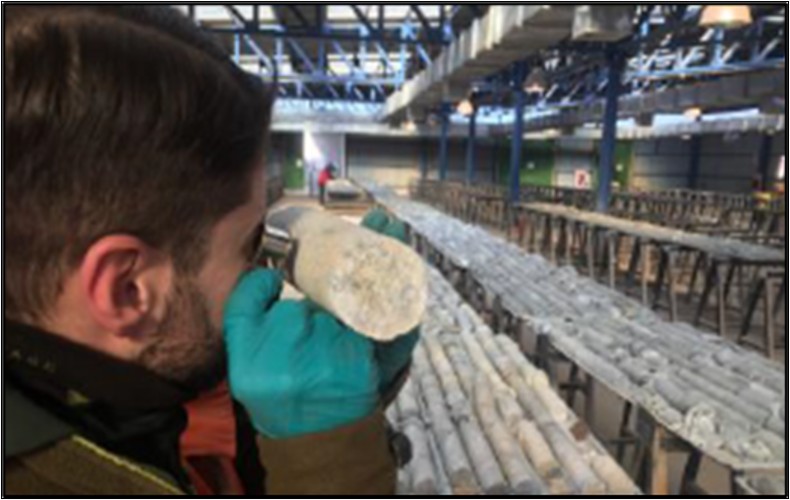
Source: MEL (2022)
|
|
Figure 8-4: |
Geological Logging |
The geological logging includes its own specific QA/QC procedures. Monthly, 100 m of a specific drill hole were randomly selected for cross logging and subsequent review by MEL's senior geologist. The result of this validation were reported along with corrective actions and action plans, if determined to be necessary
The senior geologist was responsible for defining and selecting the sampling intervals to be cut. The mine conducts sampling based on a standard 2-m intervals with lengths adjusted to reflect geological contacts. When needed, local changes in the length may be needed and the geologist makes this decision depending on the complexity of the mineralisation. The sampling intervals were recorded in the core recovery database as well as in the core box and were identified with unique sample numbers (bar code).
To prepare the core sample for submittal to the assay laboratory, 2-m intervals were split in half using a manual core cutter (Figure 8‑5). One half of the core was carefully retained in the core box and kept for future reference, or for other testing purposes. The other half was placed in a plastic bag, labelled using the unique barcode and sealed for shipment to the laboratory. The weight of the samples varied between 8 and 15 kg, depending on the diameter of the drill hole.
|
|
|
|
MEL_TRS_June 2022_Mike |
June 2022 |
|
|
SEC Technical Report Summary – Minera Escondida Limitada |
Page 69 |
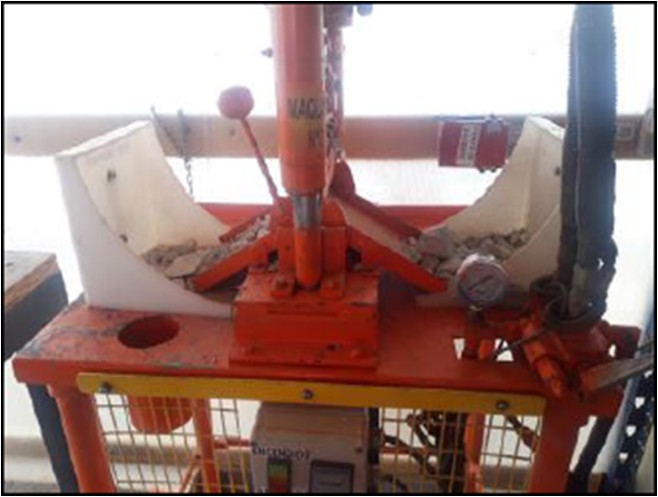
Source: MEL (2022)
|
|
Figure 8-5: |
Hydraulic Guillotine for Core Cutting |
At MEL, all information collected from drilling to chemical logs was entered electronically, online and stored in an acQuire database, allowing traceability and secure data storage (Figure 8‑6). Access to the acQuire database is controlled by internal company security systems and utilize Windows Authentication. Line Managers can request the addition of employees to existing Windows Active Directory groups that permit access to the database. Active directory groups are regularly monitored for removal of employees no longer requiring access. In addition the acQuire licensing model is used to limit user functionality within the software. The license type (Client) permits viewing of most data in the database and restricted write-access. Data Entry license holders have additional permissions to enable them to enter data. Manager licenses (of which there are only one) permit full access to the database and all acQuire functionality.
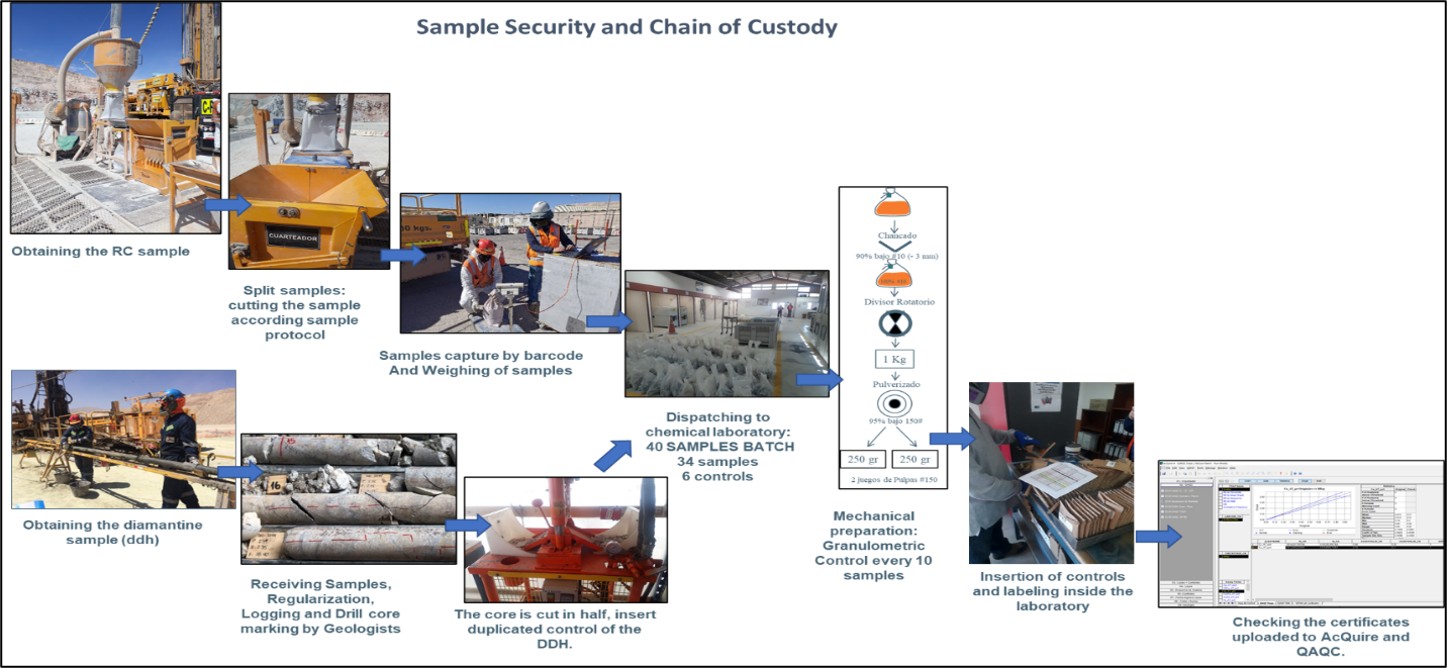
Source: MEL (2022)
|
|
|
|
MEL_TRS_June 2022_Mike |
June 2022 |
|
|
SEC Technical Report Summary – Minera Escondida Limitada |
Page 70 |
|
|
Figure 8-6: |
MEL Sample Chain of Custody |
In general, actions taken to ensure sample integrity and data security include:
•Use of barcoding, which facilitates the digital flow within the database, from drilling to chemical analysis.
•All data was stored in acQuire, where the information was validated before being released for further use. Permissions to enter, modify and read data in acQuire were regulated by user type, which prevents loss of information.
•Biannual external audits are conducted, with the last one completed during 2021 and included a detailed review of the consistency of the data. Historically there have been no significant findings with only minor observations and recommendations.
8.2.Sample Preparation, Assaying and Analytical Procedures
8.2.1.Name and Location of Laboratory, Relationship and Certification
Since 2017, an external commercial laboratory, Bureau Veritas Chile S.A., has been used for the mechanical preparation and chemical assays of MEL samples. The laboratory is located in the city of Antofagasta, Chile, where all services were performed (Figure 8‑7).
The Bureau Veritas Chile S.A. laboratory is independent of MEL and BHP and is certified by the National Accreditation System of the Instituto Nacional de Normalización (INN), as a testing laboratory, according to NCh-ISO/IEC 17025:2017.
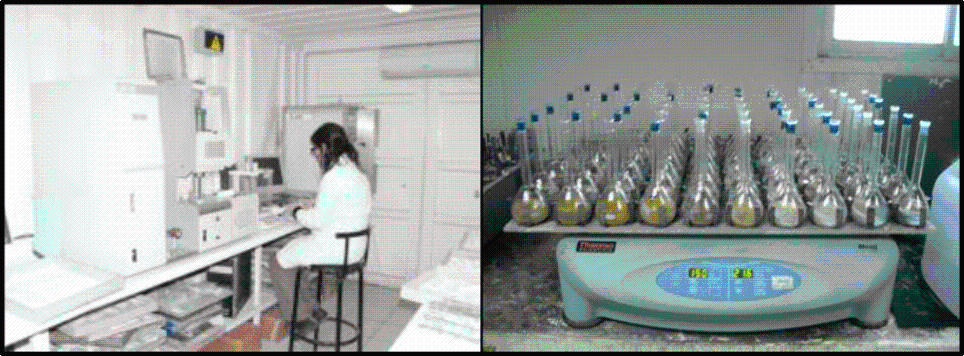
Source: MEL (2022)
|
|
Figure 8‑7: |
Chemical Analysis in External Laboratory |
8.2.2.Sample Preparation and Analysis Protocol at Laboratory
The procedure used by the laboratory for mechanical preparation and chemical assaying has been defined by MEL and includes the laboratory's own internal QA/QC, specifically, accuracy, precision, blanks, and granulometric controls, which is, in addition to the QA/QC protocols in place at MEL, facilitating the integrity of the reported results.
The procedure at the laboratory for both DDH and RC mechanical preparation of samples was as follows (Figure 8‑8):
•Samples weighted and dried.
•Primary crushing to 1/2 inch. (12.7 mm)
|
|
|
|
MEL_TRS_June 2022_Mike |
June 2022 |
|
|
SEC Technical Report Summary – Minera Escondida Limitada |
Page 71 |
•Secondary crushing 90% to -10# Tyler (150 microns).
•Particle sizes control every 10 samples.
•Rotary splitter to produce 1 kg of sample; pulverised and the rest of the sample treated as rejection.
•Drying 1,000 gr for 1 hour.
•Pulverised until 95% at - 150# Tyler.
•Samples were then homogenised, split and distributed into three labelled envelopes of 250 grams each. These samples were labelled with new bar codes.
•A granulometric control was performed every 10 samples.
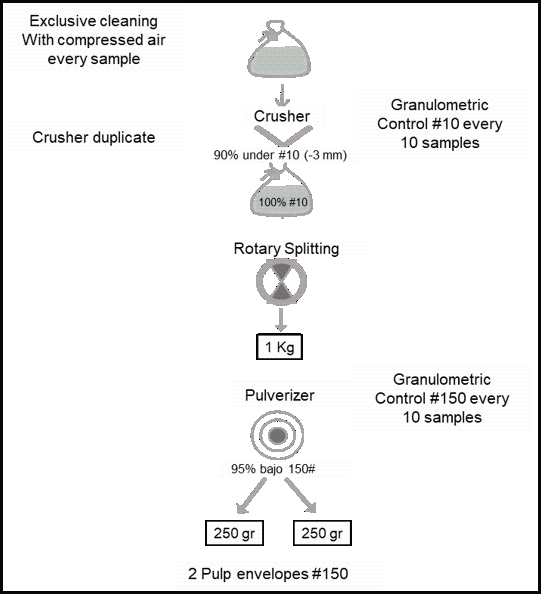
Source: MEL (2022)
|
|
Figure 8‑8: |
Mechanical Preparation Schema, Bureau Veritas Laboratory |
Samples have been assayed by different external laboratories throughout MEL’s history. From the exploration stages to the present, they have been performed according to the industry standards of each period in addition to incorporating different types of controls to ensure the quality of the results. Table 8‑1 details the laboratories and the type of service used in the different periods.
|
|
|
|
MEL_TRS_June 2022_Mike |
June 2022 |
|
|
SEC Technical Report Summary – Minera Escondida Limitada |
Page 72 |
|
|
Table 8‑1: |
MEL Laboratories from Exploration to FY2022, by Service Type |
|
|
|
|
Laboratory |
Period |
Chemical Analysis |
Location |
CIMM – Internal and Others
External laboratories |
Pre 2003 |
TCu, SCu, Fe, As, density |
Antofagasta |
CIMM |
2003 - 2009 |
TCu, SCu, Fe, As, Partial
Extraction (Ptxt), density |
Antofagasta |
CIMM - Geoanalítica |
2009 |
TCu, SCu, Fe, As, Ptxt density |
Antofagasta |
Verilab |
2009 - 2013 |
Ptxt |
Antofagasta |
ALS-Chemex |
2009 – 2016 |
ICP |
La Serena |
Geoanalítica -CIMM-SGS |
2011 - 2016 |
TCu, SCu, Fe, As, Ptxt, density |
Antofagasta |
Bureau Veritas Chile |
2017 - present |
TCu, SCu, Fe, As, Ptxt, ICP, density. |
Antofagasta/
ICP Canada |
Source: MEL (2022)
The analytical schemes used by MEL were divided into two groups. Grade Composite (CL) performed on samples every 2 m, and Physical Composites (CF) that are performed every 14 and 16 m. These CFs were constructed from original 2 m samples following a procedure that is considered to ensure representativity of the composited interval. This is applied below the upper sulphide ceiling (TS) as explained in Figure 8‑9.
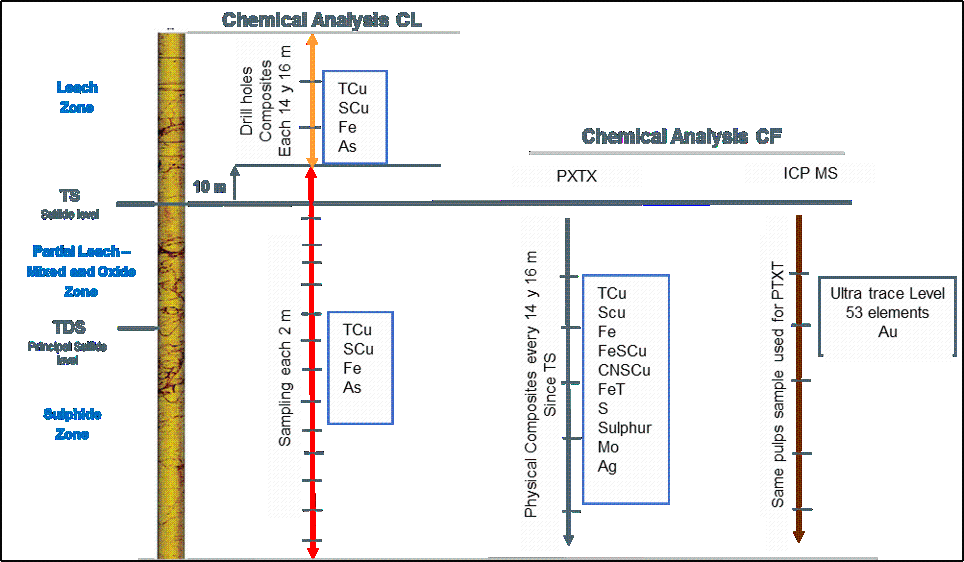
Source: MEL (2022)
|
|
Figure 8‑9: |
MEL Flow Chart Summarising Sampling and Analytical Protocol |
Once the samples were analysed, the results were sent electronically to the MEL database administrator and uploaded into acQuire. The suite of analyses performed from 2003 to present is shown in Table 8‑2.
|
|
|
|
MEL_TRS_June 2022_Mike |
June 2022 |
|
|
SEC Technical Report Summary – Minera Escondida Limitada |
Page 73 |
|
|
Table 8‑2: |
FY22 Chemical Analyses |
|
|
|
|
Element |
Method |
Digestion |
Detection Limit |
TCu + Fe |
Atomic Absorption
Spectrometry (AAS.) |
Acid digestion (Nitric acid - Perchloric and hydrochloric
acid) |
0.01% |
SCu |
AAS |
Acid Leaching (Sulphuric Ac - Citric Ac.) |
0.01% |
CNCu |
AAS |
Leaching (sodium cyanide - deionised water) |
0.01% |
SCuFe |
AAS |
Leaching (Sulphuric Acid - Distilled Water) |
0.01% |
TFe |
AAS |
Acid digestion (nitric acid - perchloric acid -
hydrofluoric acid) |
0.3% |
Sulphur |
LECO |
Sodium Carbonate Leaching |
0.1% |
S |
LECO |
Sample attack with oxygen to transform the sulphur
present as sulphide and sulphates to sulphur dioxide. |
0.1% |
Mo |
AAS |
Acid digestion (Nitric Acid - Aqua Regia), reading by
AAS |
3 ppm |
Ag |
AAS |
Acid digestion (Nitric Acid - Aqua Regia) |
0.2 ppm |
Source: MEL (2022)
Partial Extraction
Partial Extraction (Ptxt) is a technique that was implemented in 2003 (Preece, R., Williams, M.; 2003) which has been validated and audited during these years to date. Ptxt has been used in the different updates of the Resource model. This analytical technique determines the mineralogy and the volumetric contribution of copper and pyrite species in the sample based on a normative mineralogical matrix. The current suite of chemical analysis performed is presented in Table 8‑3.
|
|
Table 8‑3: |
Partial Extraction Analysis (Ptxt) |
|
|
|
|
Element |
Method |
Digestion |
Detection Limit |
TCu + Fe |
AAS |
Acid digestion (Nitric acid - Perchloric and hydrochloric acid) |
0.01% |
SCu |
AAS |
Acid Leaching (Sulphuric Ac - Citric Ac.) |
0.01% |
CNCu |
AAS |
Leaching (sodium cyanide - deionised water) |
0.01% |
CuSFe |
AAS |
Leaching (Sulphuric Acid - Distilled Water) |
0.01% |
TFe |
AAS |
Acid digestion (nitric acid - perchloric acid -
hydrofluoric acid) |
0.3% |
Sulphur |
LECO |
Sodium Carbonate Leaching |
0.1% |
S |
LECO |
Melting of the sample with an oxygen stream to
transform the sulphur present as sulphide and
sulphates to sulphur dioxide. |
0.1% |
Mo |
AAS |
Acid digestion (Nitric Acid - Aqua Regia), reading by
AAS |
3.0 ppm |
Ag |
AAS |
Acid digestion (Nitric Acid - Aqua Regia) |
0.2 ppm |
Source: MEL (2022)
Spectral Analysis for Mineralogical Gangue Information
The Mineralogical Gangue Information (NIR) technique, implemented since 2016, was used to semi-quantitatively define the intensity of alteration minerals, based on a spectrometer through which the spectral curves of the materials were captured in the Near Infrared spectrum (NIR: 1001-2500 nm). There were a 10 to 20% duplicate sample submitted for QC, which should not exceed a 10% deviation.
The model currently allows for identifying the group of clays (Kaolinite-Smectite and Pyrophyllite), Sericite, Muscovite-Illite, Chlorite, and Biotite. These are variables estimated in the block model and were later used
|
|
|
|
MEL_TRS_June 2022_Mike |
June 2022 |
|
|
SEC Technical Report Summary – Minera Escondida Limitada |
Page 74 |
for the calculation of the fines indicator (Chapter 10) which is used to define the types of oxides and mixed to be sent to the leaching process.
Density
Density tests were carried out in all core drilling. Dry density has been determined for 15 to 30 cm drill core samples collected at intervals of approximately 10 m. Density was calculated using a wax immersion method. Approximately 41,262 density samples have been collected and used for density modelling (31,081 for Escondida and 10,181 for Escondida Norte). As QC, 10% of the duplicate tests were carried out with another external laboratory (SGS) that should not exceed 1% deviation between pairs.
8.3.Quality Control Procedures/Quality Assurance
QA/QC programmes are used help to ensure the reliability of assay results from commercial laboratories and were performed to industry standard practice. Throughout MEL’s history, the QA/QC has changed according to the requirements of each drilling campaign. The main milestones were:
•Prior to 2003: QA/QC was performed using a secondary laboratory. Sample labelling was done with sequential numbers manually to ensure blind submission to the laboratory.
•2003: Implementation of a QA/QC programme with insertion of standardised reference controls (TSEN) from a round robin of field duplicates, analytical duplicates and blanks. Implementation of pre-printed and manually affixed barcodes on the bags are shown in Figure 8‑10.
•2005: Implementation of acQuire software as the official platform to store and manage the complete drill hole database. Originally Maskana and GVmapper software was used for the management of drilling and logging information online. During 2010 this software was eliminated, and all processes were migrated into acQuire. This also allowed the usage of rugged tablets for geological logging, sample reception, photography and DDH sampling. All data was consolidated in a single database.
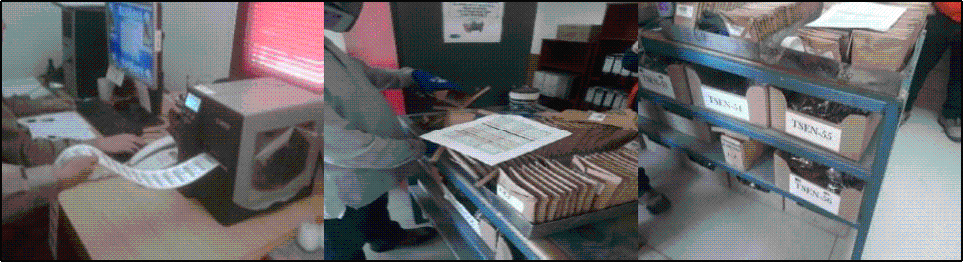
Source: MEL (2022)
|
|
Figure 8‑10: |
QA/QC Samples Insertion; A) Label Printing from acQuire; B) Labelling of Pulp and Checking of Position of Controls According to scheme of analysis; C) Control Types |
Major milestones were:
•2014: 100% online geological logging.
•2016: Online QA/QC monitoring.
•2017-2018: Use of acQuire for online analytical monitoring diagrams; diamond cutting and automatic random insertion of duplicates, standards and blanks. Online reporting used for sample weights.
•2020-2021: Geometallurgical sampling flow implemented within the acQuire platform
The QA/QC process include seven (7) types of control samples (Table 8‑4) that were inserted during the sample preparation and analysis process:
|
|
|
|
MEL_TRS_June 2022_Mike |
June 2022 |
|
|
SEC Technical Report Summary – Minera Escondida Limitada |
Page 75 |
•Pulp Replicates: Correspond to samples obtained after the pulverisation. Pulp duplicates are inserted at a rate of 1 every 25 samples, including half in the same shipment and the other half in another shipment or to the control laboratory.
•10# Duplicates: Corresponding to the samples obtained after crushing. Coarse duplicates are inserted at a rate of 1 every 25 samples, including half in the same shipment and the other half in another shipment, or to the control laboratory.
•Field Duplicates (RC and DDH): Consist of the second core quarter separated for analysis. Field duplicates are inserted at a rate of 1 every 25 samples.
•Coarse Blanks: Samples of barren rocks, or prepared with local barren rocks. Coarse blanks are inserted at a rate of 1 every 25 samples.
•Fine Blanks: Samples of barren rocks or grades below 0.05% TCu inserted to verify contamination in the chemical analysis process. This corresponds to pulverised quartz and inserted at a rate of 1 every 25 samples.
•Certified Reference Material (CRM): Samples are purchased from the commercial laboratory, ORE Research & Exploration Pty. Ltd. (OREAS), and include a corresponding certificate. CRMs are inserted at a rate of 1 every 20, or 25 samples, with the CRM chosen randomly. TSEN Reference Materials are MEL own matrix materials prepared by Geoassay laboratory. There are 8 standards, covering 0.35% to 2.6% copper grade.
|
|
|
|
MEL_TRS_June 2022_Mike |
June 2022 |
|
|
SEC Technical Report Summary – Minera Escondida Limitada |
Page 76 |
|
|
Table 8‑4: |
FY2021 Control Samples for RC and DDH |
|
|
|
|
|
|
Process |
Control |
Source |
Frequency |
Control |
Error |
Composites |
Field Duplicate
(RC) |
RC Sample B. |
1 per
batch |
Precision |
≤ 30% |
Field Duplicate
(DDH) |
DDH Half core |
Precision |
≤ 30% |
Duplicates 10# |
Post crushing
duplicates |
1 per
batch |
Precision.
Representativeness of
the sample post
mechanical preparation |
≤ 20% |
Pulp Replicates |
Duplicate from
the division of
the pulp into 2
envelopes of
250 g. |
Accuracy. Inserted post pulverisation stage |
≤ 10% |
Coarse Blanks |
Barren blast
holes TCU
<0.02% |
1 per
batch |
Contamination Inserted
before primary
crushing. |
Grade > 5 times
detection limit (x
>0.05% TCu) |
Fine Blanks |
Pulverised
quartz |
Contamination Inserted
before the pulverising. |
5% of samples analysed, > 3 times of detection limit (x >0.03% TCu). |
CRM
(standards -
TSEN) |
Samples
certified from a
Round Robin |
1 per
batch |
Accuracy |
±2 standard
deviations, bias < 5%
and coefficient of
variation < 5% |
Source: MEL (2022)
QA/QC data was routinely monitored both in the short term and long term:
•Short-term: Carried out daily and in all specific batches as they were reported by the laboratory.
•Long term: Carried out monthly to identify trends and biases. This review includes analysis of precision, accuracy, and contamination. An annual report of the QA/QC programme results from the drilling campaign was constructed.
•Re-assay: Should the quality control standard(s) and/or blanks fail, the batch may be wholly or partly re-assayed at the discretion of the geologist. Where re-assaying has occurred, the QA/QC standards and blanks are checked again, and if approved, the results are added to the database.
8.3.1.Sample Analysis Controls and Results
2008 – 2020
Table 8‑5 shows the overall accuracy and precision results of the QA/QC programme for TCu for twelve recent calendar years (2008 - 2020), for Field Duplicates (RC and DDH) and CRM. MEL uses a set of eight (CRM), which covers the range of TCu grades of the deposit. In general, the TCu CRMs present samples within the established 5% bias limits. Table 8‑6 details the routine samples inserted from FY08 (ending June 2008) to FY21 (ending June 2021) at Escondida and Escondida Norte by type of composite.
|
|
|
|
MEL_TRS_June 2022_Mike |
June 2022 |
|
|
SEC Technical Report Summary – Minera Escondida Limitada |
Page 77 |
|
|
Table 8‑5: |
QA/QC Results for TCu, 2008-2020, Escondida and Escondida Norte |
|
|
|
|
|
|
|
|
|
|
|
2008 |
2009 |
2010 |
2011 |
2012 |
2013 |
2014 |
Precision |
Field Duplicates |
98.5% |
97.3% |
98.4% |
98.5% |
97.0% |
94.6% |
98.4% |
Pulp Replicates |
98.4% |
98.8% |
98.8% |
98.7% |
96.1% |
95.4% |
99.0% |
Accuracy |
CRM (TSEN) |
98.2% |
98.5% |
98.3% |
98.6% |
98.4% |
98.1% |
99.4% |
|
|
2015 |
2016 |
2017 |
2018 |
2019 |
2020 |
|
Precision |
Field Duplicates |
99.7% |
100% |
100% |
99.5% |
97.7% |
99.5% |
|
Pulp Replicates |
98.9% |
99.2% |
99.7% |
100% |
100% |
99.5% |
|
Accuracy |
CRM (TSEN) |
98.8% |
98.8% |
99.4% |
99.2% |
100% |
97.5% |
|
Source: MEL (2022)
|
|
Table 8‑6: |
Number of Routine and Control Samples TCu, 2008-2021, Escondida and Escondida Norte |
|
|
|
|
|
|
|
|
|
|
MEL_DH_CL |
MEL_DH_CF |
MELEN_DH_CL |
MELEN_DH_CF |
N°
Samples |
N°
Control |
N°
Samples |
N°
Control |
N°
Samples |
N°
Control |
N°
Samples |
N°
Control |
FY08 |
23,127 |
1,373 |
4,112 |
296 |
66,111 |
3,781 |
7,099 |
412 |
FY09 |
37,119 |
2,028 |
6,876 |
372 |
82,115 |
4,513 |
6,902 |
383 |
FY10 |
100,495 |
5,594 |
16,961 |
1,190 |
47,185 |
2,647 |
9,516 |
553 |
FY11 |
74,454 |
4,663 |
11,457 |
1,077 |
57,931 |
3,717 |
7,975 |
1,007 |
FY12 |
54,635 |
7,403 |
5,440 |
1,307 |
42,851 |
5,351 |
4,323 |
987 |
FY13 |
26,796 |
4,078 |
2,745 |
636 |
12,616 |
1,877 |
1,189 |
291 |
FY14 |
22,201 |
4,118 |
2,091 |
488 |
9,783 |
1,796 |
1,161 |
287 |
FY15 |
17,257 |
3,134 |
1,550 |
340 |
12,118 |
2,255 |
1,474 |
321 |
FY16 |
13,211 |
2,372 |
1,506 |
284 |
3,644 |
650 |
447 |
83 |
FY17 |
10,199 |
1,742 |
1,083 |
181 |
4,840 |
862 |
587 |
104 |
FY18 |
10,419 |
1,805 |
935 |
153 |
1,623 |
284 |
179 |
28 |
FY19 |
7,906 |
1,393 |
884 |
151 |
2,974 |
521 |
305 |
51 |
FY20 |
6,434 |
1,056 |
742 |
140 |
2,314 |
394 |
312 |
48 |
FY21 |
7,758 |
1,125 |
746 |
125 |
1,664 |
230 |
225 |
36 |
Source: MEL (2022)
In terms of accuracy, TCu was analysed for six (6) types of duplicates (field, coarse and pulp samples). As a result, the accuracy for field, preparation, and pulp duplicates was adequate and within acceptable ranges.
2021
The number of controls for the year 2021, and their results are presented in Table 8‑7, with examples of some control charts in Figure 8‑6 to Figure 8‑8.
|
|
|
|
MEL_TRS_June 2022_Mike |
June 2022 |
|
|
SEC Technical Report Summary – Minera Escondida Limitada |
Page 78 |
|
|
Table 8‑7: |
FY2021 QA/QC Summary |
|
|
|
|
|
|
Control |
N° Samples |
Rate |
Error rate (%) |
Grade
Composites
(CL) y
Physical
Composites
(CF) |
Field Duplicate RC |
302 |
1 per batch |
TCu: 0
SCu: 0.3
Fe: 0.7
As: 0 |
Field Duplicate DDH |
13 |
1 per batch |
TCu: 0
SCu: 0
Fe: 7.7
As: 0 |
Duplicates 10# |
99 |
1 per batch |
TCu: 0
SCu: 0
Fe: 0
As: 0 |
Duplicates of pulp |
91 |
1 per batch |
TCu: 0
SCu: 3.3
Fe: 0
As: 0 |
Coarse Blanks |
21 |
1 per batch |
0.05% |
Fine Blanks |
21 |
1 per batch |
0.03% |
CRM (standards - TSEN) |
223 |
A random mix of 8 CRM inserted,
Grades between 0.35 to 2.71 TCu% |
3.55% Bias |
Source: MEL (2022)
Duplicates
As can be seen in Figure 8‑11 the accuracy for field, preparation, and pulp duplicates was adequate and within acceptable ranges.
|
|
|
|
MEL_TRS_June 2022_Mike |
June 2022 |
|
|
SEC Technical Report Summary – Minera Escondida Limitada |
Page 79 |
Source: MEL (2022)
|
|
Figure 8‑11: |
Results of Field, Coarse (10#), and Pulp Duplicates-TCu |
CRM
Standard sample results show acceptable precision, most samples have TCu values within acceptable tolerance limits (Figure 8‑12).
Blanks
Figure 8‑13 shows the results for coarse and fine blanks used in FY21 campaign.
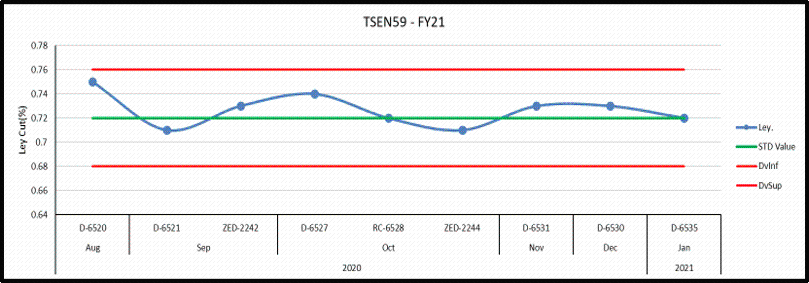
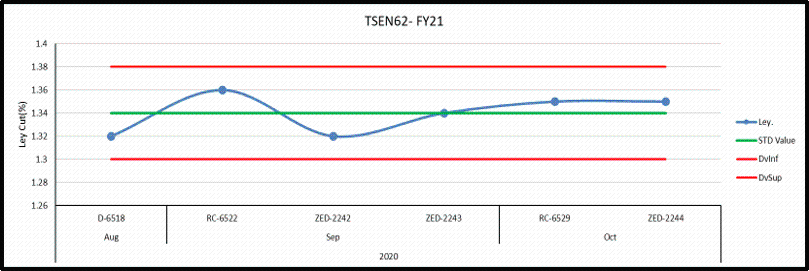
Source: MEL (2022)
|
|
|
|
MEL_TRS_June 2022_Mike |
June 2022 |
|
|
SEC Technical Report Summary – Minera Escondida Limitada |
Page 80 |
|
|
Figure 8‑12: |
Laboratory Results for TSEN59 and 62 of FY21 Campaign |
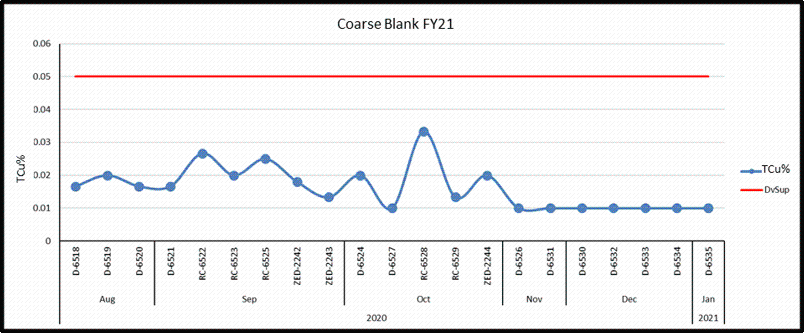
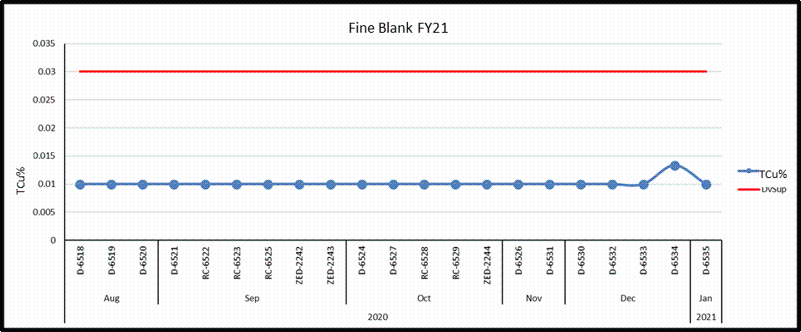
Source: MEL (2022)
|
|
Figure 8‑13: |
Coarse and Fine Blanks Result for FY21 |
In the opinion of the QP, at MEL, there were adequate controls in the sample preparation, analysis, and security processes for use in the estimation of mineral resources and mineral reserves.
It is the QP’s opinion that the sample preparation, security, and analytical procedures applied by MEL were appropriate and fit for the purpose of establishing an analytical database for use in grade modelling and preparation of mineral resources estimates, as summarised in this TRS.
During a site visit in August 2021, the QP reviewed the core and sampling techniques. The QP found that the sampling techniques were appropriate for collecting data for the purpose of preparing geological models and mineral resources estimates.
8.5.Non-Conventional Industry Practice
In the construction of the Resource model, no data was obtained using non-conventional industry procedures.
|
|
|
|
MEL_TRS_June 2022_Mike |
June 2022 |
|
|
SEC Technical Report Summary – Minera Escondida Limitada |
Page 81 |
The QP was provided with the compiled Escondida and Escondida Norte database, in Excel file format, which included survey information, downhole geological units, sample intervals and analytical results.
Drill hole data for Escondida includes 5,764 drill holes, totalling 1,768,738 m of drilling, and with 1,678,615 m of assays. The Escondida Norte programme consists of 2,832 holes with 923,211 m of drilling and 908,081 m of analytical samples. Compiled supporting documentation for the Escondida and Escondida Norte drilling data included descriptive logs with collar surveys, core photos, and assay information. No other sample type were used in the construction of the resource model.
At MEL, protocols have been defined in order to assure data verification and data storage of both physical and electronic records. These protocols were defined for each stage of data acquisition processes: drilling, geological logging, chemical analysis and database delivery to users. It is the role of the QP that these protocols ensure the quality of the data through periodic reviews of the information entered the database, review of database delivery reports and participation in the different audits carried out on the process
9.1.Data Verification Procedures
Under the plan, data is entered directly into acQuire where the data was first validated in its relational definition according to the data model, followed by verifications related to formulas and cross conditions. All validations were performed before permitting the export of data for geological modelling and resource estimation purposes. Validation in acQuire was applied to survey, geology, and assays (Figure 9‑1).
The QP was responsible for the review of the data used for resource estimate at different stages of the process:
oValidation of the drill hole coordinates by checking the data recorded at the rig installation.
oThe drill hole deviation was validated both by a second measurement of the deviation for a percentage of the drill holes, as well as by evaluating the result of the deviation of the drilling hole, which must be less than 5%.
oBarcoding was used at all stages of the process, allowing the process to be managed completely blind for the laboratories.
oAll stages of the sampling process were managed with acQuire without any external intervention.
oSpecifically, sample checks were carried out on the samples at specific points including, core recovery for RC and DDH, weight of the RC samples, and core recovery.
oAssays used in mineral resources estimation have a robust QA/QC process that continuously monitors accuracy, precision and contamination at different stages.
oAssay results reports from the laboratory were prepared digitally and the results were automatically uploaded to acQuire.
oGeological data entry was performed digitally and stored directly in the acQuire database with no manual intervention at any time.
oGeological logging was validated by cross-checking and validation by the MEL Senior Geologist.
An internal validation was performed periodically and includes approximately 5% of the data.
The database is located on the MEL server and backed up daily.
|
|
|
|
MEL_TRS_June 2022_Mike |
June 2022 |
|
|
SEC Technical Report Summary – Minera Escondida Limitada |
Page 82 |
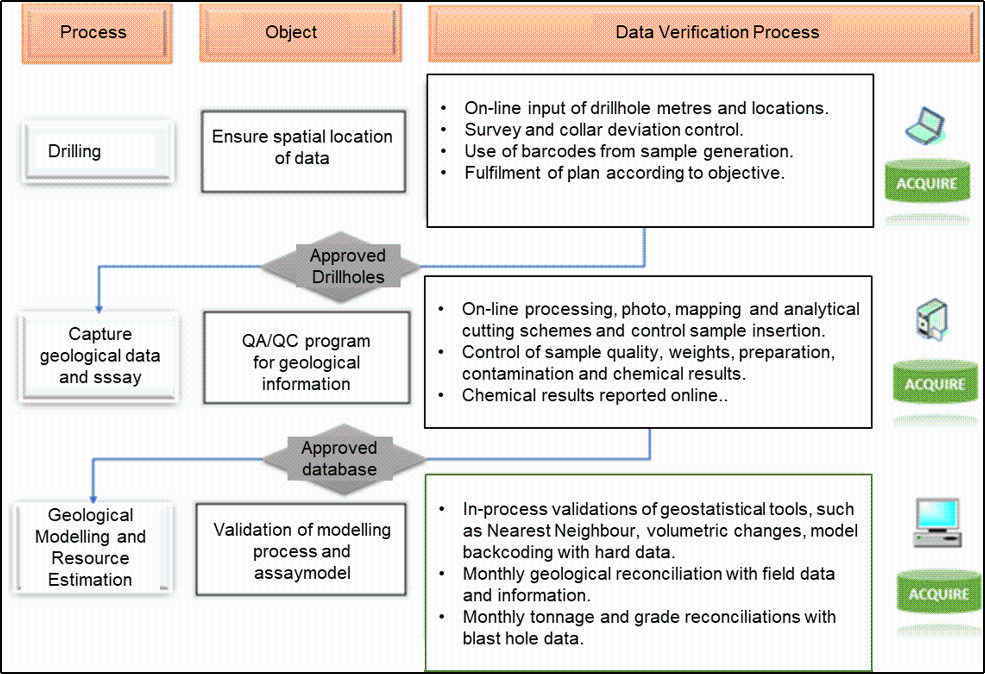
Source: MEL (2022)
|
|
Figure 9‑1: |
Flowsheet of the MEL Data Verification Process |
Data input validation procedures into AcQuire comprised automated import routines developed by MEL. These routines force the input data to abide by several data entry/import rules as well as enforcing internal validation tools to prevent erroneous data entry. Each time data relating to a drill hole is changed, the username, time, and type of alteration (insert, update or deletion) are recorded. Assays are never adjusted; however, samples may be re-assayed, if deemed necessary after examination of the accompanying QA/QC results.
Every two years, MEL performs an external audit to the Resource Models for the main estimated variables to include TCu, SCu, and density. This audit considers a detailed and independent expert review and validation of the procedures used to estimate the mineral resources via a detailed review of data capture and data management, interpretation and modelling of the geology, definition of estimation domains, grade estimate, and mineral resources classification. The historical audits performed are presented in Table 9‑1.
During these audits, the QP was responsible for defining the scope of the audit, as well as leading and coordinating the Escondida and Escondida Norte work teams. In addition, this QP was responsible for evaluating the implementation of the recommendations arising from these audits.
The latest audit was conducted in 2021, by Golder Associates S.A., on the 2021 Resource Model (LPMay21) which supports this mineral resources statement as of 30th June 2022 and is reported in Golder Associates S.A. 21460151 MEL Auditoria Recursos 2021 revB.
|
|
|
|
MEL_TRS_June 2022_Mike |
June 2022 |
|
|
SEC Technical Report Summary – Minera Escondida Limitada |
Page 83 |
|
|
Table 9‑1: |
Mineral Resources Biannual External Audits |
|
|
|
|
|
|
|
|
|
Calendar year |
Model |
Company |
Data Acquisition |
Model Interpret-ation |
Estimation TCu & SCu |
Density |
Mineralogy & Partial Extraction |
For Declaration Date |
2013 |
LPMay13 |
CRM - Jeff
Sullivan |
YES |
YES |
YES |
YES |
YES |
30th June
2014 |
2015 |
LPMay15 |
CRM - Jeff
Sullivan |
YES |
YES |
YES |
YES |
YES |
30th June
2016 |
2017 |
LPMay17 |
CRM - Jeff
Sullivan |
YES |
YES |
YES |
YES |
NO |
30th June
2018 |
2019 |
LPMay19 |
Golder |
YES |
YES |
YES |
YES |
YES |
30th June
2020 |
2021 |
LPMay21 |
Golder |
YES |
YES |
YES |
YES |
YES |
30th June
2022 |
Source: MEL (2022)
Internally, every year, the Resource Centre of Excellence (RCoE) of BHP conducts a Resources and Reserves Risk Review (RRR&R) upon Escondida and Escondida Norte deposits. This review seeks to ensure the reportability of mineral resources and mineral reserves under the international standards of the different stock exchanges where BHP makes declarations. The QP is present before the RCoE during the audit and is responsible for providing information and answering queries.
During this review, data management and the QA/QC programme for geological information is evaluated to include sample capture and preparation, chemical analysis, normative mineralogy (partial extraction), geological logging, spatial location of samples, and database management. No deficiencies were found in the handling and quality of the recorded data.
Since 2005, the QP has been involved in the mineral resources estimate and is not aware of any other limitations, nor failure to conduct appropriate data verification.
9.3.Opinion on Data Adequacy
This QP makes periodic visits to the facilities where data capture, management, and backup activities are performed. The QP has validated the data disclosed, including collar survey, downhole geological data and observations, sampling, analytical, and other test data underlying the information, or opinions contained in the written disclosure presented in this TRS. The QP, by way of the data verification process described in this section of the TRS, has used only that data, which was deemed by the QP to have been generated with proper industry standard procedures and was accurately transcribed from the original source. The QP is also of the opinion that the data being used for the estimation of mineral resources is adequate for the purposes used in this TRS. Data excluded from the estimation is minimal and is not expected to affect materially the end result of the estimation.
|
|
|
|
MEL_TRS_June 2022_Mike |
June 2022 |
|
|
SEC Technical Report Summary – Minera Escondida Limitada |
Page 84 |
10.Mineral Processing and Metallurgical Testing
The main mineralisation style in both Escondida and Escondida Norte consists of copper sulphides, such as chalcocite, covellite, and chalcopyrite. In addition, there are zones of oxide mineralisation where brochantite, chrysocolla, and antlerite are the main species.
Three processes were defined after extensive analysis and testwork in early stages of development. The understanding of geological characteristics, combined with the metallurgical response of the mineralisation, defined the following processing ways:
•Concentration of copper sulphides by froth flotation to produce a copper concentrate.
•Acid leaching, mostly copper oxides, to produce cathodes,
•Bioleaching of copper sulphides, below cutoff grade of concentration process, to produce cathodes.
These three processes were not all begun at start-up of the MEL operation, which was solely flotation of sulphides, but expansions and the addition of other processes were subsequently added. The addition of processing facilities, employing different metallurgical processes that depend upon different testwork for metallurgical evaluation, is the reason for which the collected data supporting production planning and growth projects is presented in the context of these processes.
In addition, the company obtains economic benefits from the gold and silver recovered as by-products of copper production that it markets in the form of metal contained in concentrate.
Maps presented in this chapter use local mine coordinates derived from the PSAD-56 UTM projection.
10.1.Testing and Procedures
Because of the overall dominance of copper concentrate as a product, the main activities for the updating of the geometallurgical models are focused on the flotation recovery of sulphides. However, the procedure for updating the geometallurgical variables includes acid leaching and bioleaching processes. In Figure 10‑1, the activities related with production forecasting for the sulphide concentrators have been coloured light blue, the activities associated with concentrate quality modelling are in orange; finally acid and bioleaching models are coloured in green.
10.1.2.Testing and Laboratories
The samples for geometallurgical testing come from the following sources:
•Infill diamond drilling holes are used mainly for concentration process testing. These drilling programmes provide physical composites 14-16 m length, which are collected in a systematic approach.
•Infill reverse circulation drilling and bulk samples extracted from open pit are the main sources of samples for leaching processes because of both geochemical characterisation and mass requirements.
The drilling campaigns are the main activity to support the planning process and it is focused within the volumes to be extracted in the long term mine plan. Figure 10‑2 shows the characterisation data collected from the drill holes.
|
|
|
|
MEL_TRS_June 2022_Mike |
June 2022 |
|
|
SEC Technical Report Summary – Minera Escondida Limitada |
Page 85 |
Table 10‑1 describes the nature of key metallurgical testwork procedures undertaken for geometallurgical characterisation to support both flotation and leaching process routes. Many laboratories and testwork facilities have been employed for metallurgical analysis and testing to support the geometallurgical evaluation of MEL during its operational life to date. These laboratories have been all independent external laboratories to MEL, and apply their own Quality assurance processes and/or external certifications. The most significant laboratories for MEL are listed in Table 10‑2.
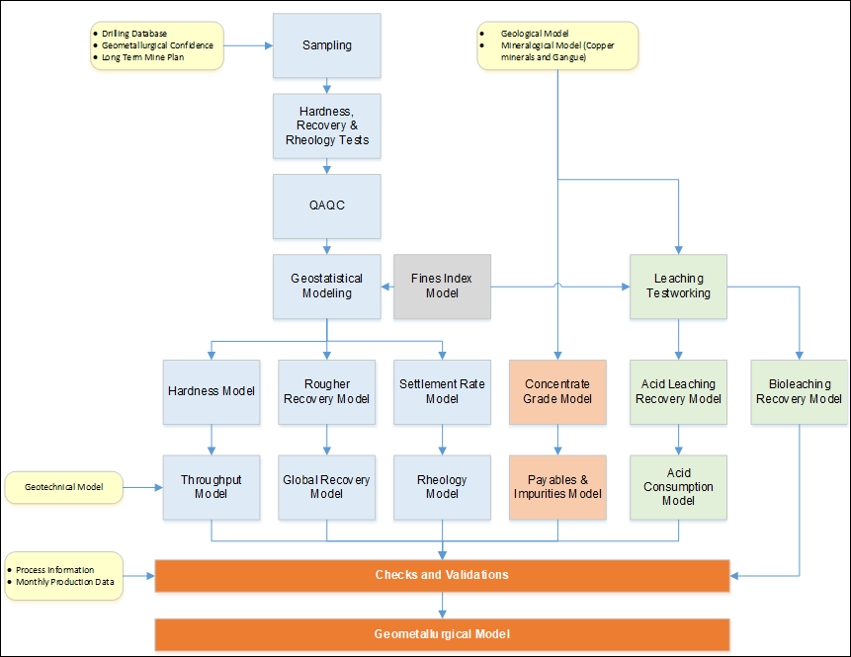
Source: MEL (2022)
|
|
Figure 10‑1: |
MEL Geometallurgical Modelling Flowsheet |
|
|
|
|
MEL_TRS_June 2022_Mike |
June 2022 |
|
|
SEC Technical Report Summary – Minera Escondida Limitada |
Page 86 |
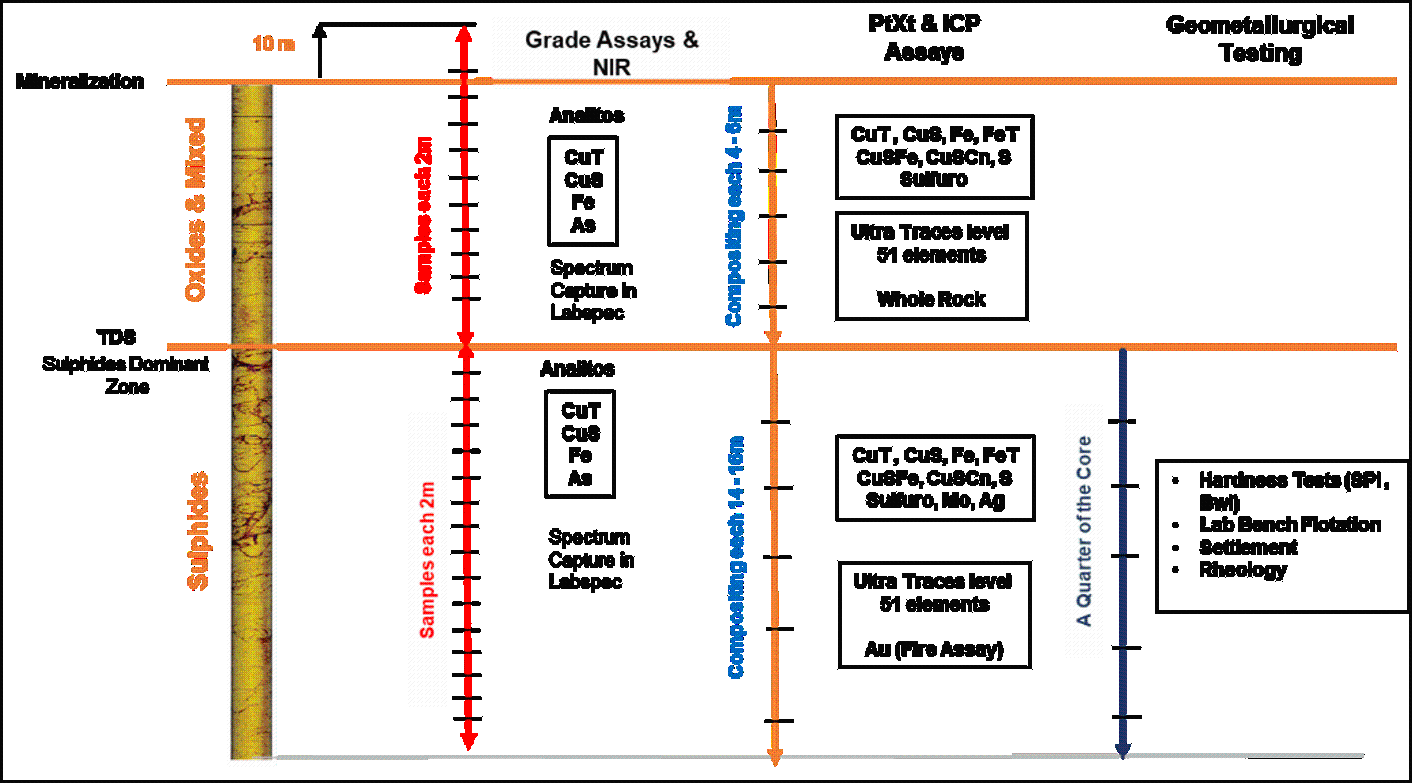
Source: MEL (2022)
|
|
Figure 10‑2: |
Geometallurgical Testing Scheme |
|
|
|
|
MEL_TRS_June 2022_Mike |
June 2022 |
|
|
SEC Technical Report Summary – Minera Escondida Limitada |
Page 87 |
Table 10‑1: Description of Key Testwork undertaken for Geometallurgical Characterisation
|
|
|
Process |
Test / Assay |
Notes |
Concentration |
SAG Power Index (SPI) |
The SPI test is a well-established industry test for estimating specific energy consumption for the crushing and milling of rock in grinding mills. The result of the SPI Test is expressed in minutes, and is defined as the time required to reduce a mineral sample from a characteristic feed size of ½” to a characteristic product size of 1.7 mm. A longer grinding time, with respect to the mean of the distribution of data captured from the deposit, indicates greater resistance to grinding. SPI has the advantage of requiring little mass (~ 2 kg) and is therefore suitable for the geometallurgical characterisation of deposits by being able to provide many data points due to the relative ease of sampling and testwork through diamond drilling. |
Bond Work Index (BWi) |
The BWi test is undertaken to estimate the energy required to grind previously milled rock to a fine size to prepare it for flotation. The test result is expressed in kWh / t. The test uses 10 kg of ore and the objective is to reach a steady state grinding of the sample. This is to emulate the replacement ratio of fresh ore to a grinding mill in continuous function. The parameter is equivalent to the mass passing through specific opening per revolution. This is repeated for a specific number of grinding cycles. Each cycle has 100 revolutions, wherein a sieve with a given opening is used to define the defined mesh (grain) size of the product in each cycle. It is a globally accepted test, in terms of its reliability, repeatability and reproducibility for the design and analysis of ball milling circuits. |
Rougher Flotation |
The test uses one kilogram of ore, which is ground to a product size (P80) of 150 microns, which means that 80% of the mass passes through a 150-micron opening sieve. The mineral is deposited in a 3.1 litres laboratory cell and is floated under standard conditions for 12 minutes. Flotation kinetics can be determined by collecting 4 different concentrates, in cumulative quantities and in separate trays. In addition, at the end of the test, the copper analyses in all the products allow to calculate the recovery at different times and the maximum recovery. The test outputs the potential recovery of a determined ore and their kinetic curve. It is designed to be executed in standard conditions, using a target of primary grind size of 150 microns. |
Acid and Bioleaching |
Unit Leaching Columns |
Numerous metallurgical programmes have been carried out supporting traditional crushed ore (heap) leaching using acid solutions. These tests are undertaken in plastic columns of various lengths and diameters to observe and analyse the response of mineralisation to acid bearing fluids (leach solutions). The process emulates the actual processes within a heap leaching pad. Standard test conditions for oxide leaching columns are established to ensure that comparison between different test conditions and ore types may be undertaken. Standard conditions for MEL are applied for testing. |
Acid Consumption Test |
The test reports the sulphuric acid consumption of a previously ground sample of mineralisation to understand how much acid is consumed by the leaching of both copper minerals and other acid reactive minerals in a mineralisation type. |
Permeability Tests |
Samples were crushed to < 0.5” diameter (crusher set to 25 mm) and prior to testing, the 0.5” crushed ore samples were agglomerated. Physical and hydraulic property laboratory screening tests are conducted to assess the ore hydraulic properties under a range of proposed heap heights, irrigation rates, and aeration rates. Screening tests and methods included specific gravity, particle size distribution (PSD) of pre-test and post-test ore samples using the sieve/ hydrometer and laser diffraction methods, Atterberg limits, dual wall saturated conductivity, dual wall unsaturated hydraulic conductivity, dual wall air permeability tests, energy-dispersive X-ray fluorescence (EDXRF), X-ray diffraction (XRD), and moisture retention characteristics (MRC). |
Agglomeration- Sulphation tests |
The tests define the optimal acid and moisture dosage for different mineralisation zones. The approach is to run an experimental matrix using standard conditions defined by MEL. |
Source: MEL (2022)
|
|
|
|
MEL_TRS_June 2022_Mike |
June 2022 |
|
|
SEC Technical Report Summary – Minera Escondida Limitada |
Page 88 |
Table 10‑2: Laboratories
|
|
|
|
Laboratory |
Location |
Testing & Assaying |
Certifications |
SGS Minerals |
Chile |
Hardness (SAG Power Index, Bond Work Index, Low Energy Index Test; Abrasion Index ), Rougher Copper Recovery, Rougher Molybdenum Recovery, Rougher Copper Recovery, Rougher Copper Kinetic, Tailings rheology (Yield Stress, viscosity), Settlement Rate, Microtrack Automated Mineralogy QEMScan / TIMA, X-Ray Diffraction; Whole Rock and Clays Density Separation and FRX Particle Size Distribution Tests, Preparation of Irrigation Solution (Artificial Refining), Real Density (Pycnometre), Agglomerate of Samples; Operation, Control, Loading and Unloading of Crib, Minicribs and Columns; Gravel Drying, Disaggregation and Preparation, Treatment and Disposal of Solutions, Iso-pH bottle leaching tests, Hydraulic conductivity, Bioactivity Test, Bacterial Amenability, Agglomerate Quality Test, Sulphation test, ISO-Eh Test, Impact Test Routine Assaying (copper, iron, arsenic) |
ISO 9001 ISO14001 ISO 45 |
Aminpro |
Chile |
Hardness (SAG Power Index, Bond Work Index), Pilot Testwork |
|
MEL Internal Metallurgical Laboratory |
Chile |
Focused on production samples. Rougher Flotation test, Chemical assaying from both concentrator and leaching operations streams. |
|
CISEM |
Chile |
Automated Mineralogy QEMScan, X-Ray Diffraction; Whole Rock |
|
GeoSystems Analysis, Inc. |
USA |
Permeability Testing |
|
ALS Chemex |
Canada |
Inductive Conductive Plasma (ICP) for 54 Elements assaying |
ISO 9001 ISO14001 |
Bureau Veritas |
Chile |
Routine Assaying (total copper, Soluble copper, iron, arsenic) |
ISO 9001 ISO14001 |
Chile |
Partial Extraction assaying (Soluble copper at cyanide, ferric sulphate, sulphuric+citric acid) |
ISO 9001 ISO14001 |
Source: MEL (2022)
10.2.Sample Representativeness
Sampling for MEL metallurgical testwork has been sourced during the operation to date from:
•Samples from drill holes employed to characterize the deposit geologically and chemically.
•Dedicated drill holes to recover larger sample mass for testwork.
•Bulk samples extracted from tunnels or the open pit.
Due to the maturity of the geometallurgical modelling, most new samples in the annual model updates are taken from regular diamond core drilling (DDH) to save cost and provide easy access to existing drill core. This new information is gathered continually and included into the geometallurgical modelling to predict metallurgical process response, as an ongoing part of the annual planning cycle. The geochemical characterisation, as with the geological characterisation, from drill holes is also employed in geometallurgical characterisation and modelling.
10.2.1.Sulphide Concentrator Sampling
The sampling process for concentrator testwork, for both hardness and copper recovery, is based on systematic sampling of DDH composites generated from alternating 14 m, or 16 m length intervals from diamond drill holes. These intervals are chosen to emulate the MEL mining bench height of 15 m, while being composited from the routine 2-m long sampling interval. These samples are chosen from diamond drill holes throughout the mineral deposit that are selected to characterize feed volumes considered in the long term production plan. The selection is prioritised according with both geometallurgical confidence criteria and the sequence of exploitation.
|
|
|
|
MEL_TRS_June 2022_Mike |
June 2022 |
|
|
SEC Technical Report Summary – Minera Escondida Limitada |
Page 89 |
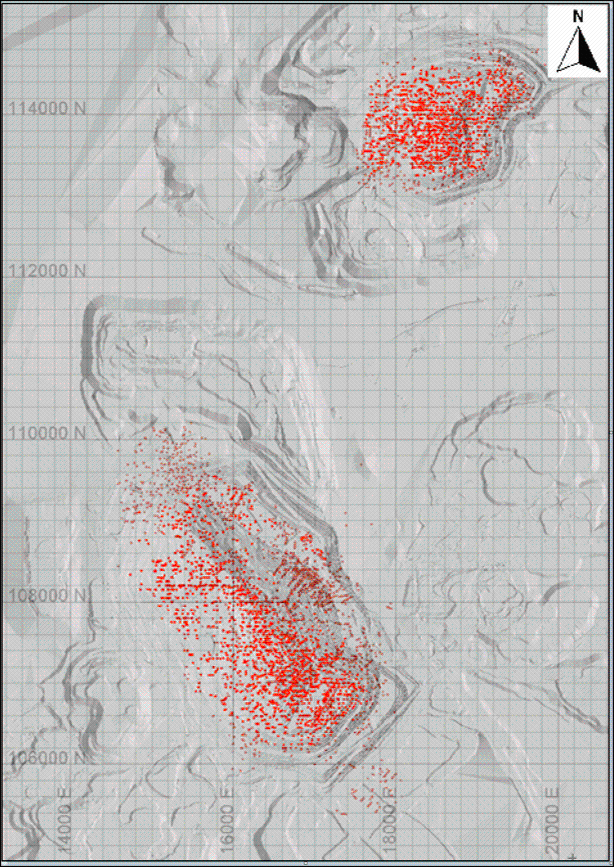
Source: MEL (2022)
Figure 10‑3: Spatial distribution of geometallurgical samples
|
|
|
|
MEL_TRS_June 2022_Mike |
June 2022 |
|
|
SEC Technical Report Summary – Minera Escondida Limitada |
Page 90 |
Table 10‑3: Hardness and Recovery Databases Supporting Long Term Plan, as Issued at May21
|
|
|
Mine |
Test |
Database May21 |
Escondida |
Hardness |
9,126 |
Recovery |
9,120 |
Escondida Norte |
Hardness |
5,996 |
Recovery |
6,161 |
TOTAL |
Hardness |
15,122 |
Recovery |
15,281 |
To support the sampling criteria, focused on the long and short term planning process, a geometallurgical classification system has been developed to incorporate a quantitative measurement of risk and uncertainty in mining plans for metallurgical parameters. The geometallurgical classification system is applied to the hardness and copper recovery data for concentrators and it works similar to resource categorisation.
In this case the terminology for geometallurgical variables has been defined as Local, Global and Assigned confidence depending on the holes, samples and distance that have been used to interpolate a single block. The “Assigned” classification it is related with blocks that are valued by means of global averages from the database where the input of fundamental information on grades and geology is always available, and this significantly decreases uncertainty expectations. The definition of this classification is shown in the Table 10‑4, with the results shown in Figure 10‑4.
Table 10‑4: Geometallurgical Classification Definition for Hardness and Recovery
|
|
Classification |
Definition |
Local Confidence |
Interpolated Blocks. Sample Distance ≤100 m. Samples used for Interpolation ≥5. Drill Holes used ≥4 |
Global Confidence |
Interpolated Blocks. Sample Distance >100 m. Samples used for Interpolation <5. Drill Holes used <4 |
Assigned |
Global averages from the database using grades, geology combinations where no geometallurgical samples are available. |
Source: MEL (2022)
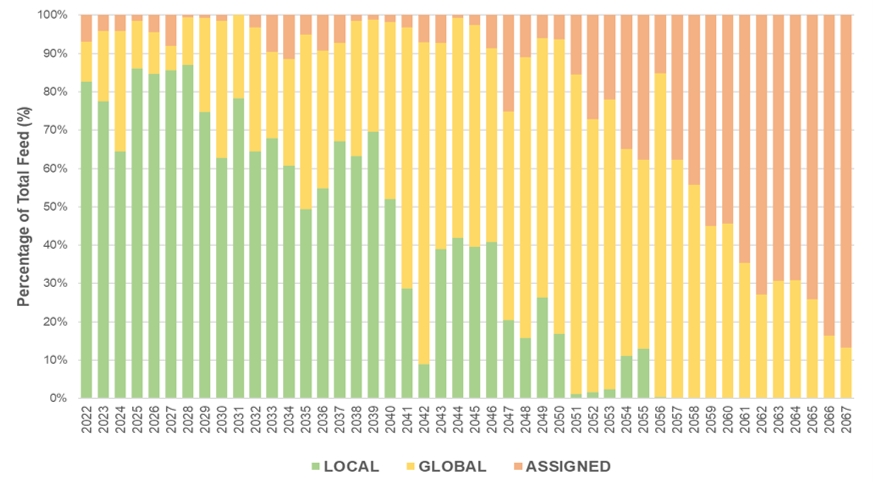
Source: MEL (2022)
Figure 10‑4: Geometallurgical Classification Profile for Copper Recovery at Concentrators on Long Term Plan 22
|
|
|
|
MEL_TRS_June 2022_Mike |
June 2022 |
|
|
SEC Technical Report Summary – Minera Escondida Limitada |
Page 91 |
The system provides information by which volumes with higher uncertainty, or risk to the metallurgical estimate, are identified so that drilling plans and/or sampling from existing drill holes, can be directed reduce uncertainty.
10.2.2.Acid Leach (Oxide and Mixed) and Acid Bio Leach (Sulphide) Sampling
Sampling for metallurgical testwork for these processes is no longer undertaken. During the early phases of these processes, bulk samples were obtained from large diameter DDH, sampling tunnels, and bulk samples taken from the operating pits. This was required to generate the large mass of sample required for testwork.
Based on that historical testwork, the process models for oxide leaching were developed and validated and these has been in use to date. The process models for oxide leaching continuously updated, because of the new data collected. The process models for leaching is fully linked with the geological and mineralogical data collected from routine characterisation.
In early stages of bioleaching for the sulphides, the project tested successfully a 500,000 t demonstration leach pad. It was constructed with ore extracted from the Escondida pit in 1999. Details of these sampling programmes are not presented in this TRS, since their importance has been displaced by the empirical use of the geometallurgical models that were thusly derived.
The maturity of the metallurgical parameters are now gathered from both regular 2 m geochemical and 14 m‑16 m characterisation from infill drilling programme. This is an ongoing process that updates the geometallurgical models.
The model has information concerning the different types of geology present in both the reserves plan and the mineral resources volume to include principal alteration types, predominant lithologies, and mineralogical zones. This information informs the definition of ore types that are employed in ongoing characterisation and planning. The acquisition of information, and consequently the data density, reflects the difference in the geometallurgical complexity (variability) of the deposit. MEL undertakes a continuous process of data acquisition to support both long term planning and mining operations.
In the opinion of the QP, the data coverage provides sufficient representativity of the volume of the deposit to support the life of the mineral reserves. The maturity of the operation gives additional support for calibration and reconciliation process to improve both modelling and forecasting.
The process established for the interpretation of collected analytical and testwork data and the transfer into the block model is through two ways to include when data density is higher enough, because of systematic sampling then a geostatistical interpolation is applied, or for variables that have either lower density of data points, or less inherent geological variability and the parameters are included in the block model by the allocation of global averages determined by the geological characteristics.
This process is underpinned by statistical analysis that has established discrete volumes of the deposit (estimation domains) that have been demonstrated as being populations with similar statistical characteristics. Finally, process models are applied based on the installed capacity to forecast mill throughput, flotation recovery, concentrate quality, and leach recovery for both long term and short term mine planning. Table 10‑5 summarizes the methodology applied for each parameter to transfer into the block model.
|
|
|
|
MEL_TRS_June 2022_Mike |
June 2022 |
|
|
SEC Technical Report Summary – Minera Escondida Limitada |
Page 92 |
Table 10‑5: Testwork for Geometallurgical Process
|
|
|
Parameter |
Modelling Method |
Input |
Concentrator Process (Sulphides) |
|
Hardness Model |
Geostatistical interpolation and global averages, conditioned by the geological characterisation |
Database of SAG Power Index (SPI) and Bond Work Index (BWI) testing. |
Throughput |
Specific-by-plant algorithm which calculates processing rates at resources block model using SPI and BWI inputs. A power-based model using installed capacity
for the concentrators. |
Hardness Model |
Copper Recovery |
Geostatistical interpolation and global averages, based on geological controls. |
Database of rougher flotation test results employing scale-up factors to reflect the physical nature of each concentrator |
Concentrate Grade |
Algorithm which calculates expected grade at concentrate at the resources block model |
Copper minerals and Pyrite content from mineralogical model. |
Impurities and Payable elements |
Algorithm which calculates expected content at the concentrate at the resources block model using an expected recovery at the process. |
Recovery factors come from operational evidence. |
Acid Leaching Process (Oxide and Mixed ore) |
|
Leach Recovery |
Assigned to the block model conditioned by the geological characterisation and oxidation ratio |
Principally derived from column test work recoveries |
Acid Consumption |
Assigned to the block model conditioned by the mineralogical characterisation of gangue minerals |
Derived from testwork. |
Bioleaching Process (Sulphides and Mixed ore) |
|
Leach Recovery |
Algorithm which calculates expected copper recovery at the resources block
model based on copper mineralogy. It is calculated at fixed leaching time. |
Principally derived from large scale test working, test pad leaching work and empirical operational evidence. The fundamental is that each copper mineral species has specific recovery. |
Source: MEL (2022)
|
|
|
|
MEL_TRS_June 2022_Mike |
June 2022 |
|
|
SEC Technical Report Summary – Minera Escondida Limitada |
Page 93 |
As result of the previous methodology, the key metallurgical processing parameters are included in the long term geological (resource) block model that is used for long term planning that underpins mineral reserves. The procedures for estimation and/or assignment of these parameters have been developed during the ongoing operation of MEL that has included the addition of new metallurgical processing alternatives (oxide leaching and sulphide leaching) as well as successive expansion of the principal process (sulphide flotation and concentration). The modelling techniques and procedures are considered to be mature and are an appropriate reflection of the variability presented within the deposit given the nature of the current processing facilities. While the approach is identical for the two deposits that are currently being mined, namely Escondida and Escondida Norte, the outcomes are distinctive, due to the distribution of geological characteristics.
In the QP’s opinion, the data support is adequate for forecasting purposes of both copper recovery and acid consumption over the life of the operation.
The hardness is evaluated on the basis of the geological characteristics and is different between Escondida and Escondida Norte. The hardness estimate of SPI and BWi values is the fundamental input for the calculation of concentrator throughput. The following geological units (domains) have been established on the basis of statistical analysis, and mean SPI and BWi testwork results and are presented for each deposit. The evaluation of these domains is updated annually as additional testwork data is acquired.
In the QP’s opinion, the historical data and future forecast shows strong correlation of harness modelling. For this reason, the QP feels that no additional data is currently needed.
Escondida Deposit
The results of database analysis of SPI and BWi results generates a hardness domain definition (UG DUR) that presents 7 geological units. These basic domains, based upon lithology combined with alteration, are refined by consideration of the vertical distance from the highest elevation of the mineral Anhydrite. The occurrence of the mineral Anhydrite has been identified as a geological control for ore hardness. The greater the depth from the anhydrite level, the greater the hardness of the rock. The definition of domains for hardness is presented in Table 10‑6. Table 10‑6 also presents a summary of the number of sample data and the mean results from database analysis.
Table 10‑6: Hardness Domain Definition (UG DUR) and Results for Escondida
|
|
|
|
|
|
|
UG DUR
CODE |
Distance from
Anhydrite Level |
Alteration |
Lithology |
Samples |
SPI
(min) |
BWi
(kWh/t) |
1 |
Greater than
150 m above |
Quartz-Sericite-
Clays |
Quartz Porphyry-Andesites-
Breccias-Intrusive Porphyry |
2893 |
42 |
11.1 |
2 |
Others |
2184 |
51 |
13.1 |
3 |
Others |
All |
1277 |
66 |
13.0 |
4 |
Less than
150 m above |
Quartz-Sericite-
Clays |
1223 |
57 |
13.0 |
5 |
Others |
820 |
80 |
13.2 |
6 |
Below |
Quartz-Sericite-
Clays |
101 |
89 |
14.0 |
7 |
Others |
602 |
138 |
15.7 |
Source: MEL (2022)
In the QP’s opinion, the historical data and future forecast shows strong correlation of harness modelling. For this reason, the QP considers that no additional data is currently needed.
|
|
|
|
MEL_TRS_June 2022_Mike |
June 2022 |
|
|
SEC Technical Report Summary – Minera Escondida Limitada |
Page 94 |
Escondida Norte Deposit
The results of database analysis for SPI and BWi results generates a hardness domain definition (UG DUR) that presents four geological units. For the 2020 Resource model update, the structural model was included as an additional geological control for hardness. The definition of domains for hardness is presented in Table 10‑7 that also provides the numbers of samples and results from the database analysis.
Table 10‑7: Hardness Domain Definition (UG DUR) for Escondida Norte
|
|
|
|
|
|
|
UG DUR
CODE |
Structural
Domain |
Alteration |
Lithology |
Samples |
SPI (min) |
BWi (kWh/t) |
1 |
1 |
Quartz-Sericite-Clays |
- |
503 |
35 |
10.3 |
2 |
Others |
Biotite |
259 |
129 |
13.3 |
3 |
Others |
Rhyolitic Porphyry |
1,024 |
77 |
14.9 |
4 |
Others |
3,844 |
62 |
12.2 |
Source: MEL (2022)
In the QP’s opinion, the historical data and future forecast shows strong correlation of harness modelling. For this reason, the QP feels that no additional data is currently needed.
10.3.2.Throughput in Milling Plants
The expected throughput for the overall milling circuits of each of MEL’s concentrators is calculated using two power-based models, one for each of the stages in the overall milling circuit. These are the Semi-Autogenous Grinding (SAG) mills and the ball mills.
For the throughput for SAG milling the algorithm uses the estimated SPI value (the Hardness Model) as a single variable, the rest of the parameters are constant. The algorithm is the following:
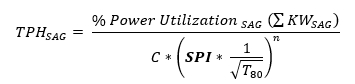
For the ball milling stage, the algorithm uses the estimated BWi value (the Hardness Model) as the only variable, the rest of the parameters remain constant, and thus the throughput estimate is as follows:
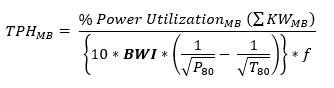
The plant parameters for the different milling circuits in MEL’s two flotation plants used for the throughput estimates are presented in Table 10‑8.
|
|
|
|
MEL_TRS_June 2022_Mike |
June 2022 |
|
|
SEC Technical Report Summary – Minera Escondida Limitada |
Page 95 |
Table 10‑8: Parameters for throughput Estimates
|
|
|
|
|
|
Parameter |
LOS COLORADOS |
LAGUNA SECA |
L1 |
L2 |
L3 |
L1 |
L2 |
Installed Power SAG (kW) |
4.100 |
4.100 |
15.700 |
19.400 |
24.000 |
Installed Power MB (kW) |
2 x 4.100 |
2 x 4.100 |
2 x 6.700 1 x 10.400 |
3 x 13.430 1 x 15.666 |
4 x 15.700 |
% Power Utilisation SAG |
90 |
90 |
90 |
90 |
90 |
% Power Utilisation Ball Mills |
95 |
95 |
95 |
95 |
95 |
Transfer Size T80 (microns) |
6.000 |
6.000 |
6.000 |
8.500 |
8.500 |
Milling Product Size P80 (microns) |
145 |
145 |
145 |
145 |
145 |
Source: MEL (2022)
In the QP’s opinion, the historical data and future forecast shows strong correlation of throughput modelling. For this reason, the QP feels that no additional data is currently needed.
10.3.3.Copper Recovery in Flotation Plants
The recovery estimates is based upon the rougher recovery tests acquired from the sampling and testing of diamond drill core samples. These results are scaled-up, in accordance with normal industry practice, for each concentrator using the following equation to obtain a final recovery estimate as a function of rougher recovery:
RecFinal = RecRougher * fCleaner
fCleaner: Recovery factor for cleaner stage
The cleaner recovery factors used for each of the concentrators are: 96.5% for Los Colorados and 97% for Laguna Seca Line 1 and Line 2. These numbers are derived from design criteria of the cleaner circuit.
As with the hardness model the analysis of the input test data is undertaken on the two deposits independently in recognition of the geological differences between them.
In the QP’s opinion, the historical data and future forecast shows strong correlation of copper recovery in flotation plants modelling. For this reason, the QP feels that no additional data is currently needed.
Escondida Deposit
Statistical data analysis carried out for rougher recovery data has to evaluate flotation domains (UG Rec). These basic domains, based upon mineral zone, lithology and alteration. The definition of the flotation estimation domains for the Escondida deposit comprises seven domains and is presented in Table 10‑9. Table 10‑9 also presents a summary of the number of sample data and the mean results from database analysis.
|
|
|
|
MEL_TRS_June 2022_Mike |
June 2022 |
|
|
SEC Technical Report Summary – Minera Escondida Limitada |
Page 96 |
Table 10‑9: Domains Definition for Copper Recovery (UG Rec) and Results for Escondida
|
|
|
|
|
|
UG Rec |
Lithology |
Alteration |
Mineral Zone |
Samples |
Recovery
(%) |
0 |
All |
All |
Oxides |
191 |
79.8 |
1 |
Non-Andesites |
Quartz-Sericite-Clays /
Potassic |
High Enrichment Sulphides |
2,277 |
88.8 |
2 |
Low Enrichment Sulphides |
1,254 |
89.1 |
3 |
Primary Sulphides |
2,770 |
86.4 |
4 |
Non (Andesites or Intrusive) |
Sericite-Chlorite-Clays |
All Sulphides |
465 |
85.0 |
5 |
Andesites |
Quartz-Sericite-Clays /
Potassic |
778 |
82.3 |
6 |
Andesites or Intrusive |
Sericite-Chlorite-Clays |
1,385 |
76.6 |
Source: MEL (2022)
Escondida Norte Deposit
Evaluation of Escondida Norte has been undertaken in the same fashion as Escondida. This has also generated seven estimation domains. Whilst there are certain common elements between the resulting domains there are differences that reflect the geological differences between the deposits. Table 10‑10 presents a summary of the number of sample data and the mean results from the samples at the database.
The TPH model presents low levels of deviation in terms of reconciliation where a relative error on plant results of 2.2% is obtained for the total of the FY18-FY21 period, as shown in Figure 10‑5.
Table 10‑10: Domains Definition for Copper Recovery (UG Rec) and Results for Escondida Norte
|
|
|
|
|
|
UG Rec |
Lithology |
Alteration |
Mineral Zone |
Samples |
Recovery (%) |
0 |
All |
All |
Oxides |
90 |
81.1 |
1 |
Feldspar Porphyry / Breccias |
QSC |
High Enrichment / Low
Enrichment Sulphides |
1,138 |
89.3 |
2 |
Feldspar Porphyry / Breccias |
QSC |
Primary Sulphides |
915 |
85.6 |
3 |
Rhyolitic Porphyry / Coarse Porphyry |
QSC |
All Sulphides |
1,180 |
89.9 |
4 |
No Andesites |
SCC/ K |
1,197 |
82.2 |
5 |
Andesites |
QSC |
503 |
83.0 |
6 |
Andesites |
SCC/K |
1,138 |
79.0 |
Source: MEL (2022)
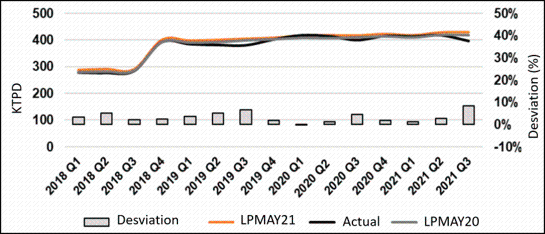
Source: MEL (2022)
Figure 10‑5: Throughput Model Reconciliation
|
|
|
|
MEL_TRS_June 2022_Mike |
June 2022 |
|
|
SEC Technical Report Summary – Minera Escondida Limitada |
Page 97 |
In the case of the Rougher Copper Recovery model, a difference of approximately 0.1% over plant results is observed in the FY18-FY21 period, on a quarterly basis (Figure 10‑6). In FY21, this difference is approximately 1% below the plant result also evaluated on a quarterly basis.
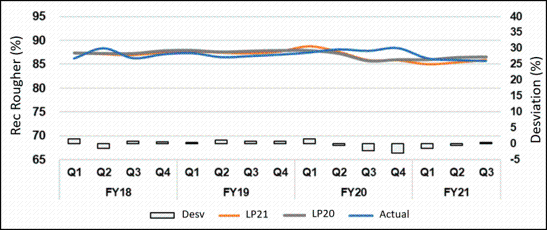
Source: MEL (2022)
Figure 10‑6: Recovery Model Reconciliation
10.3.4.Acid Leaching of Oxides and Mixed Mineralisation
The metallurgical support for oxide leach was developed in 1997 for Escondida ore. It was based on testwork of large composites representative of the main oxides groups which were defined as a function of the oxidation ratio and the clays content. The testwork included a set of leaching columns and pilot testing for solutions treatment with the objective of determined expected recovery and acid consumption of the oxide ore. Further testwork were carried out in 2001 for Escondida Norte ore which updated metallurgical results and recommended to maintain the defined oxide groups.
Recent work in 2020 differentiated extraction curves at leaching for oxides and mixed ore, in order to enable mixed ore to the acid leaching process because of lower availability of oxides at the mine plans.
In addition to geometallurgical characterisation for processing based up of geological variables, an important criteria for classifying ore-types employed in MEL is the Solubility Ratio (RS) (also referred to as the Oxidation Ratio). This parameter is obtained from chemical analysis of copper minerals and corresponds to the percentage of copper soluble in sulphuric acid (SCu) with respect to the total copper content (TCu).
To define the ore-types for oxides and mixed, a sub-classification based on; i), the RS, which accounts for the potential copper recovery in leaching processes; and ii), the potential for the generation of fine particulate material (fines), which is a consequence of the proportions and characteristics of gangue minerals. The definition of fines in the process corresponds to the particle size less than 150 microns (−100 Mesh). Fines are important to leaching processes, because they may impact the permeability of the leach pads thereby impeding fluid flow and copper recovery.
The resulting acid leaching sub-classification system uses routine chemical analysis, geological mapping information, and gangue mineralogy determinations using the near infrared (NIR) technique. These groups were correlated with fines measurements from process feed samples. Table 10‑11 shows the ore-types definition for Escondida and Escondida Norte for acid leaching process.
|
|
|
|
MEL_TRS_June 2022_Mike |
June 2022 |
|
|
SEC Technical Report Summary – Minera Escondida Limitada |
Page 98 |
Table 10‑11: Ore Types Definition for Acid Leaching Process
|
|
|
|
Ore-Type |
Solubility Ratio
(SCu/TCu) |
Soluble Copper content
(SCu (%)) |
(*) Fines Index |
Oxide A |
0.5 ≤ SCu/TCu ≤ 1 |
SCu ≥ 0.8 |
0 |
Oxide B |
0.2 ≤ SCu < 0.8 |
0 |
Oxide C |
SCu ≥ 0.8 |
1 |
Oxide D |
0.2 ≤ SCu < 0.8 |
1 |
Mixed A |
0.15 ≤ SCu/TCu < 0.5 |
- |
0 |
Mixed C |
1 |
Note: (*) Index Interpretation: 0 = Low Fines Probability; 1= High Fines Probability.
Source: MEL (2021)
The recovery results are discrete by solubility ratio, fines content, and the content of mineral species with higher acid consumption. The general algorithms that allow to estimate copper recovery at the oxide and mixed groups are based on the solubility ratio as follows:
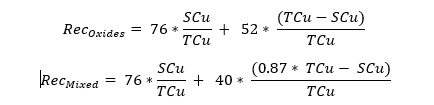
The geometallurgical characterisation for leaching processes (bulk samples for column testwork) requires a higher mass requirement for concentrator processes (drill hole composites) which places a constraint upon regular, high density sampling through the deposit. Sample numbers and density are therefore generally lower for leaching characteristics. In response to this a global average allocation on the basis of oretypes is currently used to assign both copper recovery and acid consumption. Operational experience demonstrates that this is an acceptable predictor of metallurgical processes outcomes for leaching processes.
10.3.5.Acid Bioleaching of Sulphide Mineralisation
The original concept of the sulphide leaching operations was to process, through a bioleaching process, all the low grade minerals that were not considered within the planning of the existing processes at MEL to include; (i), sulphides under the cut-off grade to the concentrator; (ii), untreated mixed in the acid leaching process; and (iii), unplanned oxides. The feasibility definitions for this operation account for the following assumptions:
•The process is designed to leach minerals in heaps under the Run-of-Mine (ROM) concept, that is, without prior crushing, using an acid solution and bacterial inoculation as leaching agents. The leaching cycle is at least 450 days for each ore strip.
•The expected global recovery of the process is 36% for the sulphide ore.
The process is fed with minerals from the Escondida and Escondida Norte pits. The deposits are enriched supergene copper porphyries with significant presence of sulphide copper minerals. The main copper sulphides are chalcocite, covellite, and chalcopyrite with a smaller amount of bornite and enargite. Some copper oxide minerals are also present, such as brochantite and chrysocolla. In general, the deposits have a very similar geology, with quartz-sericitic and chloritic alteration associated with the main mineralisation zones. The feed has been categorised consistently with existing geological modelling and resource
|
|
|
|
MEL_TRS_June 2022_Mike |
June 2022 |
|
|
SEC Technical Report Summary – Minera Escondida Limitada |
Page 99 |
evaluation of the deposits. Such categories consist of three groups of low grade sulphides, discretised by their geological combinations, which are expected to have different acid consumptions. Table 10‑12 specifies the definitions of the types of sulphides under the concentrator cut-off grade, which are fed to the process.
Table 10‑12: Ore Types Definition for Sulphides to Bioleaching Process
|
|
|
Sulphide Leach Oretype |
Lithology & Alteration |
Geological Description |
M1 |
Porphyries Quartz-Sericite-Clay |
Escondida Porphyry, Rhyolite Porphyry or Breccia.
Granodiorite Porphyry Complex, Rhyolite Porphyry |
Quartz-sericite-clay alteration |
M2 |
Andesite Chlorite-Clay |
Andesite volcanics |
Sericite-chlorite-clay alteration |
M3 |
Andesite Potassic |
Andesite volcanics |
Potassic alteration |
Andesite Quartz-Sericite-Clay |
Andesite volcanics |
Quartz-sericite-clay alteration |
Porphyries Chlorite-Clay |
Escondida Porphyry, Rhyolite Porphyry or Breccia.
Granodiorite Porphyry Complex, Rhyolite Porphyry |
Sericite-chlorite-clay alteration |
Porphyries Potassic |
Escondida Porphyry, Rhyolite Porphyry or Breccia |
Potassic alteration |
Source: MEL (2022)
The metallurgical response of the minerals was determined through a series of tests whose objective was to establish the copper recovery and acid consumption expected in the bioleaching process of ROM minerals as well as to establish the key operational factors for control and leaching performance.
In order to validate the preliminary results, a demonstrative pad was built where the main ore-types M1 and M2 were tested, using ROM materials from the Escondida pit. About 200,000 t of ore was deposited on a specially prepared field. Prior to leaching, the ore feed was drilled, analysed, and modelled for grade and mineralogy. Once the leaching cycle was completed, the heap was drilled and the cuttings samples analysed, and the information collected was used to build a post-leaching block model. Both metallurgical tests carried out at 6-t crib and the demonstration pad used mostly ROM ore.
The predictions of leaching rates and copper recoveries require a quantitative estimate of the copper-iron-sulphur mineralogy. The determination of these parameters is conducted within the framework of the mineralogical block model. The sulphide mineral assemblage identified within and below the chalcocite enrichment blanket is well suited for a suite of copper, iron, and sulphur analyses to quantitatively determine chalcopyrite, chalcocite, covellite, and pyrite mineral contents in the ore. On the basis of the mineralogical identification, the chemical method of partial extraction (PtXt) is applied to samples from the Escondida and Escondida Norte deposits with the objective of generate a sulphide mineralogy model. The technique employs three different lixiviants that are run on different aliquots of the same sample, as opposed to sequential leaching, where the same aliquot is sequentially attacked with different chemical digestions.
Mineralogy calculations use the following chemical digestions of copper on separate samples:
•Copper Soluble in (Citric Acid + Sulphuric Acid)
•Soluble Copper in Ferric Sulphate
•Soluble Copper in Sodium Cyanide
|
|
|
|
MEL_TRS_June 2022_Mike |
June 2022 |
|
|
SEC Technical Report Summary – Minera Escondida Limitada |
Page 100 |
In addition, the following specific chemical assays are used to include total iron, total sulphur, sulphur from sulphides (not soluble in Na2CO3), and total arsenic. By comparing the extractions of the pure species (chalcocite, covellite and chalcopyrite) with the analytical results of a given sample, the technique provides a quantitative determination of copper sulphides. For each sample, it is possible to determine a copper source ratio (CSR) that is the proportion of total copper contributed by each of the copper minerals in the sample and copper source percentage (CSP) that represents the absolute percentage of copper in the compound sample for each of the minerals. In other words, for CSRs and CSPs, the following is true:
•Sum of CSP = Total Copper Grade
Thus, CSR and CSP represent two different ways of expressing the copper contained in the minerals present in the sample. The mineralogical composition can be calculated from the CSP values, weighting the proportions of copper in the constituent minerals. The weight percentage is the total weighted percentage of the mineral in the sample and is determined based on the stoichiometry, which is determined experimentally, based on the composition of the minerals found in the deposit. Normative mineralogy is now routinely interpolated and is part of MEL's resource models.
The expected recovery at 450 days of leaching is presented as a function of the main sulphide mineralogy (chalcocite, covellite, and chalcopyrite), as shown Table 10‑13.
Table 10-13: Leaching as a Function of the Main Sulphide Mineralogy
|
|
|
|
|
Chalcocite |
Covellite |
Chalcopyrite |
Recovery (%) |
54 |
39 |
19 |
Source: MEL (2010)
Thus, the expected recovery for the copper sulphides fed to the sulphide leaching process is determined as:

The recovery of mixes was established as 30% of the insoluble copper and 60% of the soluble copper while the recovery of copper from oxides was established at 60%.
10.4.Payables and Deleterious Elements
The trace elements considered in the resource model at MEL include gold, silver, molybdenum, arsenic, cadmium, lead, zinc, bismuth, and antimony. All of these elements are reported because of their natural occurrence in the copper concentrate. However, there is currently no designed and installed process in the resource model at MEL to recover these elements. Only gold and silver add value to the copper concentrate in terms of sale price, since the commercial price reached by the copper concentrate increases if its content is greater than any of these.
The elements arsenic, cadmium, lead, zinc, bismuth, and antimony are considered impurities in the copper concentrate for which it receives penalties if it exceeds the permitted limit values. For this reason, the estimation of the content of these elements is relevant in order to not affect the sale price of the copper concentrates.
|
|
|
|
MEL_TRS_June 2022_Mike |
June 2022 |
|
|
SEC Technical Report Summary – Minera Escondida Limitada |
Page 101 |
To obtain the content of a given element at the concentrate, the following algorithm is used, where the fundamental input is the in-situ content of the element in each block, as follows:

The recovery factors for the elements are calculated based on different groups assigned according to the lithology, mineralogical zone and alteration, and the associated tonnages for each mine.
There is no significant content of deleterious elements in the mineralised zones of sulphides. Only arsenic occurs at the deposit in the form of enargite. Arsenic is associated with polymetallic veins and structures with only limited impact upon long term concentrate quality. Payable metals as gold and silver are present in concentrations that are locally sufficient to contribute to overall revenue from the sale of copper concentrate product, but are insufficient to be considered as drivers of the overall mine and business planning process. Gold and silver as sub-products are analysed within the copper concentrate product and through established contracts revenue is received according to the level of these contents within the copper concentrate product.
10.5.Adequacy of Data and Non-Conventional Industry Practice
It is the QP’s opinion that the geometallurgical data being used for the estimation and characterisation of product types is adequate for the purposes used in this TRS. The current testing, modelling, and analytical practices for geometallurgical variables are considered conventional. Reconciliation information on key geometallurgical parameters adequately supports the long term plan; and therefore, in the opinion of the QP, there is limited risk in using the results for throughput and metallurgical performance within Resource model.
11.Mineral Resources Estimate
The mineral resources estimate for the MEL property is reported in accordance with the SEC S-K 1300 Regulations. For estimating the mineral resources of Escondida and Escondida Norte, the following definition as set forth in the S-K 1300 Definition Standards adopted December 26, 2018, was applied.
The mineral resources presented in this section are not mineral reserves and do not reflect demonstrated economic viability. The reported Inferred mineral resources are considered too speculative geologically to have the economic considerations applied to them that would enable them to be categorised as mineral reserves. There is no certainty that all or any part of these mineral resources will be converted into Mineral Reserve. All figures are rounded to reflect the relative accuracy of the estimates and totals may not add correctly.
The effective date of the mineral resources estimate is June 30, 2022.
Maps presented in this chapter use local mine coordinates derived from the PSAD-56 UTM projection.
The mineral resources estimate was reported from within a constrained pit shell, using Whittle software, based on economics described later in this section. The MEL resource estimate contains both the Escondida and Escondida Norte deposits in separate block models. Escondida and Escondida Norte have been extensively drilled, with approximately 2,690,000 m of drilling forming the base of the LP2021 resource model, based in part on geological knowledge acquired over the past 30 years of exploration and operation. It is the opinion of the QP that the drilling grid is considered to be sufficiently spaced to confidently define the geological domains for modelling purposes.
|
|
|
|
MEL_TRS_June 2022_Mike |
June 2022 |
|
|
SEC Technical Report Summary – Minera Escondida Limitada |
Page 102 |
The mineral resources qualified person visits sites regularly for program planning and reviews, gaining further understanding of exploration programs and interpreted geological framework.
The key elements of the geological modelling and resource estimation process are described below.
11.1.Key Assumptions, Parameters, and Methods Used
This mineral resources estimate was determined using a block model methodology based on the Ordinary Kriging (OK) interpolation method. Drill hole sample data was capped locally to control outlier values and then composited for each estimation domain with the distributive method. Mineral resources categories were assigned to the model based on uncertainty from simulation of geology and grade. Mineral resources estimates were constrained by an open pit shell based on economic criteria outlined in Chapter 12.
11.2.Geological Modelling
The geological modelling utilizes a dynamic 3D methodology using Vulcan software. This methodology allows on-screen geological interpretation and updating of the mineral resource model with new drill hole data through implicit methodology. The advantage of this methodology is the high level of traceability and accountability in the construction of models, allowing the handling large amounts of information and optimising the time involved.
Four variables: lithology, alteration, mineralogical zone and copper sulphide abundance, were modelled for Escondida and Escondida Norte. Also, at Escondida, the Porphyry Intrusive Pulse variable, which describes the different pulses of mineralisation, was modelled.
There are 12 units built into the lithological model. The lithological model included the following units, as described in Table 11‑1. Figure 11‑1 shows vertical sections for the Escondida and Escondida Norte deposits for lithology, including the model and drill hole.
Table 11‑1: Lithologies Included in the Geological Model for Escondida and Escondida Norte
|
|
|
Comment |
Lithology |
Modelling code |
Pre mineral |
Black Porphyry |
12 |
Early Porphyry |
13 |
Coarse porphyry |
7 |
Rhyolitic Porphyry (Escondida Norte) |
2 |
Mineralised |
Feldspar Porphyry |
1 |
Inter mineral |
Intermineral Porphyry |
18 |
Cuarciferous porphyry (Escondida) |
2 |
Post mineral |
Green Granodiorite |
5 |
Dacitic porphyry |
9 |
Others |
Andesite |
3 |
Breccia |
4 |
Gravels |
6 |
Source: MEL (2022)
|
|
|
|
MEL_TRS_June 2022_Mike |
June 2022 |
|
|
SEC Technical Report Summary – Minera Escondida Limitada |
Page 103 |
Source: MEL (2022)
Figure 11‑1: Example Lithology Cross-Section for Escondida Section 108,260N (top) and Escondida Norte Section 114,000N (bottom)
Four units were built into the alteration model, identifying the different hydrothermal alteration events for copper porphyry. The alteration model considered the lithological units described in Table 11‑2. The alteration model is an important way to ensure minimal effect during the processing recovery. For this reason, MEL ensures that the alteration model is part of the mineral resources estimation and any high clay areas are flagged as potential issue for plant recovery. Figure 11‑2 shows vertical sections for both Escondida and Escondida Norte deposits for alteration, showing the model and drill holes code consistency.
|
|
|
|
MEL_TRS_June 2022_Mike |
June 2022 |
|
|
SEC Technical Report Summary – Minera Escondida Limitada |
Page 104 |
Table 11‑2: Alteration Included in the Geological Model for Escondida and Escondida Norte
|
|
|
Section |
Alteration |
Modelling code |
Early Hydrothermal |
Potassic with K Feldspar |
3 |
Potassic with secondary biotite |
4 |
Grey-Green Sericite |
6 |
Transitional Hydrothermal |
Chlorite – Sericite - Clays |
2 |
Main Hydrothermal |
Quartz – Sericite – Clay |
1 |
Advanced argillic |
5 |
Late Hydrothermal |
Propylitic |
7 |
Chlorite |
8 |
Source: MEL (2022)
Source: MEL (2022)
Figure11‑2: Example Alteration Cross-Sections for Escondida Section 107,255N (top) and Escondida Norte Section 114,100N (bottom)
11.2.3.Mineralogical Zone
Seven units were built in the mineralised zone model (MINZONE), as shown in (Table 11‑3). These units are defined based on the different copper minerals existing in the deposit and are the basis for the estimation of grades and the recovery of the different MEL production processes. The coding of the units was performed using the geological logging information in addition to the assay results. The MINZONE assignment methodology assists in the estimation process by ensuring that no cross boundaries estimation
|
|
|
|
MEL_TRS_June 2022_Mike |
June 2022 |
|
|
SEC Technical Report Summary – Minera Escondida Limitada |
Page 105 |
occurs. This methodology is used by most large copper deposits and the historical reconciliation shows the methodology should continue to be used. Figure 11‑3 depicts the vertical sections for both Escondida and Escondida Norte deposits for mineral zones that show the model and drill hole code consistency.
Table 11‑3: Mineralogical Zones Included in the Geological Model, Escondida and Escondida Norte
|
|
|
Copper Oxides/Sulphides |
Mineralogical Zone |
Modelling Code |
Iron Oxide, barren |
Leached |
0 |
Brochantite, antlerite |
Copper oxides |
1 |
Copper sulphide and iron oxide |
Partial leach |
4 |
Copper oxides and copper sulphide |
Mixed |
5 |
Chalcocite – covellite - chalcopyrite <10 % |
High enrichment |
6 |
Chalcocite – covellite – chalcopyrite >10% |
Low enrichment |
7 |
Bornite – chalcopyrite |
Hypogenic |
8 |
Source: MEL (2022)
11.2.4.Copper Sulphide Abundance
Copper sulphide abundance (CSA) is calculated for each sample from the normative mineralogy available in the drill hole databases:
Normative mineralogy is calculated from PtXt analysis. This analysis provides the proportion of total copper (CSP) contributed by each copper sulphide species (chalcocite, covellite, chalcopyrite, and bornite). At MEL, these analyses were performed as regular practice for all drill holes in the sulphide mineralised portion. Using copper stoichiometry ratios, CSA is obtained from the CSP. The CSA is derived from the sum of the abundance of each individual sulphide species.
Two thresholds were defined from the CSA distribution (Table 11‑4). The first to define the High CSA volume and the second to differentiate Low and Medium CSA volumes.
Figure 11‑4 shows sections for both Escondida and Escondida Norte deposits for copper sulphide presenting the modelling coding for copper sulphide abundance volume.
Table 11‑4: Copper Sulphide Abundance (CSA) definition
|
|
|
Zone |
Copper Abundance Mineralisation
Sulphide Supergene |
Copper Abundance Mineralisation
Sulphide Hypogene |
Low |
CSA < 0.4 |
CSA < 0.6 |
Mid |
0.4 <= CSA < 1.5 |
0.6 <= CSA < 1.7 |
High |
CSA >= 1.5 |
CSA >= 1.7 |
Source: MEL (2022)
|
|
|
|
MEL_TRS_June 2022_Mike |
June 2022 |
|
|
SEC Technical Report Summary – Minera Escondida Limitada |
Page 106 |
Source: MEL (2022)
Figure 11‑3: Examples of the Mineralogical Zones Cross-Sections for Escondida Section 107,550 (top) an Escondida Norte Section 114,150N (bottom)
|
|
|
|
MEL_TRS_June 2022_Mike |
June 2022 |
|
|
SEC Technical Report Summary – Minera Escondida Limitada |
Page 107 |
Source: MEL internal geology document. (2022)
Figure 11‑4: Sulphide Examples of CSA Cross-Sections for Escondida Section 107,450N (above) and Escondida Norte Section 114,330N (below)
11.2.5.Porphyry Intrusive Pulse
Specifically, for the Escondida deposit, an additional “Pulse” variable was defined. This is undertaken to separate mineralisation events that are interpreted to occur in the Escondida deposit and are bounded by structural blocks. These mineralization events are considered to be associated with different intrusive pulses of the mineralizing porphyry intrusive event and the supergene enrichment event. Three blocks, each representing a mineralisation event, were defined to include west pulse (only enrichment event), central pulse (Escondida mineralization event), and east pulse (Escondida Este mineralization event). Whilst these structural blocks do not strictly comprise the transitional and overlapping boundary of each pulse the overall distribution of the mineralization types are honoured.
|
|
|
|
MEL_TRS_June 2022_Mike |
June 2022 |
|
|
SEC Technical Report Summary – Minera Escondida Limitada |
Page 108 |
The boundary between these pulses corresponds to two north-northeast directional structures. Figure 11‑5 depicts the geometry of these pulses, or blocks. Based on the 3D geological wireframes, a 6.25 x 6.25 x 7.5 m block model was constructed that includes the lithology, alteration, mineralisation zones, pulse, and CSA models for Escondida, and the lithology, alteration, mineralisation zones, and CSA models for Escondida Norte.
Source: MEL internal geology document. (2022)
Figure 11‑5: General View of the Pulse Variable, Escondida
A mineral inventory (block model) was estimated using established geostatistical techniques following comprehensive statistical and exploratory data analysis. Grade variables, density, and metallurgical variables were estimated. Table 11‑5 shows the variables estimated in the block model.
|
|
|
|
MEL_TRS_June 2022_Mike |
June 2022 |
|
|
SEC Technical Report Summary – Minera Escondida Limitada |
Page 109 |
Table 11‑5: Variables Estimated in the Escondida and Escondida Norte Resource Model
|
|
Variable |
Description |
TCu |
Total copper (%) |
SCu |
Soluble copper (%) |
Py |
Pyrite (%) |
S2 |
Sulphur (%) |
cspcc |
Copper grade from Chalcocite (%) |
cspcv |
Copper grade from Covellite (%) |
cspcpy |
Copper grade from Chalcopyrite (%) |
densidad |
Dry Density |
bwi |
Bond Work Index (Kwh/ton) |
spi |
Sag Power Index (min) |
rec_flc |
Flotation recovery for Los Colorados concentrator (%) |
rec_fls |
Flotation recovery for Laguna Seca concentrator (%) |
rec_lixaci |
Acid leach recovery (%) |
rec_sl_350 |
Sulphide leach recovery (%) |
Source: MEL (2022)
For estimation purposes, the drill hole database was composited on 5 m intervals. A detailed contact analysis has been carried out between the estimation units in order to define the type of contact. Grade capping used a local approach to identify outlier samples. Experimental pair‑wise variograms models were generated and theoretical models were adjusted using three rotation axes and three structures. The estimate was completed using OK in three nested passes with increasing search dimensions from 50 m up to 600 m. Each pass adjusts the interpolation criteria based on geostatistical analysis and level of data support for elements by estimation domain.
There are a variety of sample lengths in the drill hole database, although the most common sample lengths were 2.0 m. The drill hole data base was composited to 5 m length, a multiple of the block height, to better define the outliers in the deposit. Composites used breaks in the compositing process when there is a change in the underlying estimation domain, therefore, only samples from the same domain are composited together. Any remaining samples lengths were merged into the last composite. The minimum length used to estimate a block is 2 m, which represents less than 0.001% of the database. The means of
|
|
|
|
MEL_TRS_June 2022_Mike |
June 2022 |
|
|
SEC Technical Report Summary – Minera Escondida Limitada |
Page 110 |
the domains are not altered, since they are weighted by the lengths of the samples Figure 11‑6 shows the distribution of the resulting composite lengths for each of the Escondida and Escondida Norte deposits.
Source: MEL (2022)
Figure 11‑6: Composite Length Distribution for Escondida (left) and Escondida Norte (right)
The exploratory data analysis (EDA) aims to find distributional similarities between samples and to determine possible groupings of geological units in the estimation domains. The EDA also seeks to identify possible drifts that may affect the estimation result. The statistical adequacy of the domain definitions was reviewed through the application of statistical and geostatistical tools. Analyses included basic statistics, box plots, distribution charts and continuity analysis. All statistical analyses were developed using the sample database. Maptek’s Vulcan was employed as the main software tool for the mineral resources estimation.
For Escondida the copper estimation domains have been defined by mineralisation zones, pulse zones and CSA models
Oxidised minerals, namely, leached, oxides, mixed and partially leached are treated as independent units due to their spatial arrangement and mineralisation style. Sulphide minerals are separated into secondary enrichment and hypogene mineralisation. The central event of mineralisation (central block) has a higher grade than the other blocks. Finally, the CSA makes it possible to separate different zones associated with the intensity of mineralisation, due to the superimposition of mineralising events.
Table 11‑6 shows the estimation domain definition for Escondida. Figure 11‑7 shows a box plot of estimation domain for Escondida.
|
|
|
|
MEL_TRS_June 2022_Mike |
June 2022 |
|
|
SEC Technical Report Summary – Minera Escondida Limitada |
Page 111 |
Table 11‑6: Estimation Domain for TCu for Escondida
|
|
|
|
Domain |
Mineralisation Zone |
Pulse zone |
CSA |
0 |
Leached |
All |
All |
1 |
Oxide |
All |
All |
2 |
Partial Leach |
All |
All |
3 |
Mixed |
All |
All |
4 |
High Enrichment |
West |
High |
5 |
High Enrichment |
Center |
High |
6 |
High Enrichment |
East |
High |
7 |
High Enrichment |
All |
Medium - Low |
8 |
Low Enrichment |
West |
High |
9 |
Low Enrichment |
Center |
High |
10 |
Low Enrichment |
All |
Medium |
11 |
High Enrichment - Hypogene |
East |
High |
12 |
Low Enrichment - Hypogene |
West |
High - Medium |
13 |
Low Enrichment - Hypogene |
Center - East |
Medium - Low |
14 |
Hypogene |
All |
Low |
Source: MEL (2022)
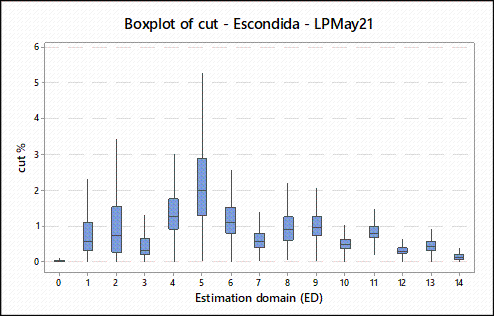
Source: MEL (2022)
Figure 11‑7: Box Plot for TCu Estimation Domain for Escondida
For Escondida Norte the copper estimation domains have been defined by mineralisation zones and CSA models. Oxidised minerals, including, leached, oxides, mixed and partially leached are treated as independent units due to their spatial arrangement and mineralisation style. Sulphide minerals are separated into secondary enrichment and hypogene mineralisation. The central event of mineralisation (central block) has a higher grade than the other blocks. Finally, the CSA makes it possible to separate different zones associated with the intensity of mineralisation, due to the superimposition of mineralising events.
The mineralisation zone is the most important control on copper grade, followed by the CSA. Table 11‑7 shows the estimation domain definition for Escondida Norte. Figure 11‑8 shows a box plot of estimation domain for Escondida Norte.
|
|
|
|
MEL_TRS_June 2022_Mike |
June 2022 |
|
|
SEC Technical Report Summary – Minera Escondida Limitada |
Page 112 |
Table 11‑7: Estimation Domain for TCu for Escondida Norte
|
|
|
Domain |
Mineralisation Zone |
CSA |
0 |
Leached |
All |
1 |
Oxide |
All |
2 |
Partial Leach |
All |
3 |
Mixed |
All |
4 |
High Enrichment |
High |
5 |
High Enrichment |
Medium |
6 |
Low Enrichment |
High |
7 |
Low Enrichment |
Medium |
8 |
Hypogene |
High |
9 |
Low Enrichment – Hypogene |
Medium - Low |
10 |
Hypogene |
Low |
Source: MEL (2022)
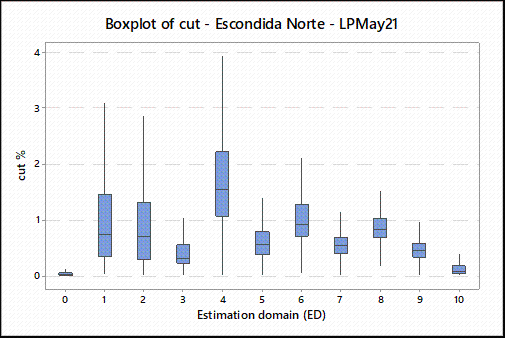
Source: MEL (2022)
Table 11‑8: Box Plot for TCu Estimation Domain for Escondida Norte
Table 11‑8 and Table 11‑9 show the general statistics of the estimation domains for Escondida and Escondida Norte, respectively.
|
|
|
|
MEL_TRS_June 2022_Mike |
June 2022 |
|
|
SEC Technical Report Summary – Minera Escondida Limitada |
Page 113 |
Table 11‑8: TCu Statistics by Estimation Domain for Escondida
|
|
|
|
|
|
|
Domain |
# Composite |
Minimum
% |
Maximum
% |
Average
% |
Std. Dev. |
Variance |
0 |
67,196 |
0.001 |
7.58 |
0.06 |
0.14 |
0.02 |
1 |
14,640 |
0.010 |
12.75 |
0.87 |
0.92 |
0.85 |
2 |
3,814 |
0.004 |
15.08 |
1.11 |
1.21 |
1.46 |
3 |
7,734 |
0.010 |
14.55 |
0.58 |
0.75 |
0.56 |
4 |
13,870 |
0.010 |
22.01 |
1.46 |
0.93 |
0.86 |
5 |
14,432 |
0.008 |
12.17 |
2.20 |
1.22 |
1.49 |
6 |
3,264 |
0.010 |
19.53 |
1.28 |
0.89 |
0.79 |
7 |
16,511 |
0.005 |
10.10 |
0.67 |
0.47 |
0.22 |
8 |
1,782 |
0.057 |
4.55 |
1.02 |
0.60 |
0.36 |
9 |
10,373 |
0.021 |
5.84 |
1.14 |
0.65 |
0.42 |
10 |
22,374 |
0.007 |
12.74 |
0.54 |
0.30 |
0.09 |
11 |
16,653 |
0.011 |
5.51 |
0.86 |
0.32 |
0.10 |
12 |
8,948 |
0.010 |
5.40 |
0.35 |
0.20 |
0.04 |
13 |
45,486 |
0.010 |
6.41 |
0.46 |
0.21 |
0.04 |
14 |
61,176 |
0.002 |
3.21 |
0.16 |
0.12 |
0.01 |
Source: MEL (2022)
Table 11‑9: TCu Statistics by Estimation Domain for Escondida Norte
|
|
|
|
|
|
|
Domain |
# Composite |
Minimum
% |
Maximum
% |
Average
% |
Std. Dev. |
Variance |
0 |
47,081 |
0.00 |
11.62 |
0.06 |
0.19 |
0.04 |
1 |
9,620 |
0.02 |
22.74 |
1.14 |
1.37 |
1.88 |
2 |
1,990 |
0.01 |
12.14 |
0.93 |
0.94 |
0.88 |
3 |
3,956 |
0.01 |
22.37 |
0.55 |
0.94 |
0.88 |
4 |
17,641 |
0.01 |
27.43 |
1.83 |
1.30 |
1.69 |
5 |
6,558 |
0.01 |
63.77 |
0.66 |
1.06 |
1.12 |
6 |
5,254 |
0.03 |
13.77 |
1.10 |
0.72 |
0.52 |
7 |
12,615 |
0.01 |
19.55 |
0.59 |
0.38 |
0.14 |
8 |
4,088 |
0.05 |
7.15 |
0.89 |
0.42 |
0.18 |
9 |
37,905 |
0.00 |
25.33 |
0.48 |
0.26 |
0.07 |
10 |
29,382 |
0.00 |
4.59 |
0.14 |
0.18 |
0.03 |
Source: MEL (2022)
To determine the type of contact (soft or hard) between different estimation domains, a contact analysis was conducted. Contact analysis is a mathematical method to define the grade behaviour among samples from different estimation domains as they approach a contact. The type of contact is important during the process of grade estimation. Hard boundaries (non-sharing of composites between estimation domains) have been used for non-sulphide domains, and, in general, soft boundary (allow of sharing composites between estimation domains) strategy has been used for sulphide mineralogical zones.
Table 11‑10 and Table 11‑11 show the maximum distance (m) to share composites between estimation domains for TCu in Escondida and Escondida Norte, respectively.
|
|
|
|
MEL_TRS_June 2022_Mike |
June 2022 |
|
|
SEC Technical Report Summary – Minera Escondida Limitada |
Page 114 |
Table 11‑10: Contact Analysis TCu for Escondida
|
|
|
|
|
|
|
|
|
|
|
|
|
|
|
|
|
|
|
|
Estimation Domain for TCu, Escondida |

|
ED |
0 |
1 |
2 |
3 |
4 |
5 |
6 |
7 |
8 |
9 |
10 |
11 |
12 |
13 |
14 |
15 |
16 |
0 |
- |
|
|
|
|
|
|
|
|
|
|
|
|
|
|
|
|
1 |
|
- |
|
|
|
|
|
|
|
|
|
|
|
|
|
|
|
2 |
|
|
- |
|
|
|
|
|
|
|
|
|
|
|
|
|
|
3 |
|
|
|
- |
|
|
|
|
|
|
|
|
|
|
|
|
|
4 |
|
|
|
|
- |
50 |
|
30 |
|
|
|
|
|
|
|
|
|
5 |
|
|
|
|
30 |
- |
30 |
50 |
|
|
|
|
|
|
|
|
|
6 |
|
|
|
|
|
30 |
- |
30 |
|
|
|
|
|
|
|
|
|
7 |
|
|
|
|
50 |
50 |
30 |
- |
50 |
|
|
|
|
|
|
|
|
8 |
|
|
|
|
|
|
|
30 |
- |
30 |
|
|
|
|
|
|
|
9 |
|
|
|
|
|
|
|
|
30 |
- |
30 |
|
|
|
|
|
|
10 |
|
|
|
|
|
|
|
|
|
50 |
- |
|
|
|
|
|
|
11 |
|
|
|
|
|
|
|
|
|
|
|
- |
|
30 |
|
|
|
12 |
|
|
|
|
|
|
|
|
|
|
|
|
- |
30 |
30 |
|
|
13 |
|
|
|
|
|
|
|
|
|
|
|
30 |
30 |
- |
30 |
|
|
14 |
|
|
|
|
|
|
|
|
|
|
|
|
30 |
30 |
- |
|
|
15 |
|
|
|
|
|
|
|
|
|
|
|
|
|
|
50 |
- |
|
16 |
|
|
|
|
|
|
|
|
|
|
|
|
|
|
|
|
- |
Source: MEL (2022)
Table 11‑11: Contact Analysis TCu, Escondida Norte
|
|
|
|
|
|
|
|
|
|
|
|
|
|
Estimation Domain for TCu, Escondida Norte |

|
ED |
0 |
1 |
2 |
3 |
4 |
5 |
6 |
7 |
8 |
9 |
10 |
0 |
- |
|
|
|
|
|
|
|
|
|
|
1 |
|
- |
|
|
|
|
|
|
|
|
|
2 |
|
|
- |
|
|
|
|
|
|
|
|
3 |
|
|
|
- |
|
|
|
|
|
|
|
4 |
|
|
|
|
- |
30 |
|
|
|
|
|
5 |
|
|
|
|
30 |
- |
30 |
|
|
|
|
6 |
|
|
|
|
|
30 |
- |
|
|
|
|
7 |
|
|
|
|
|
|
|
- |
|
|
|
8 |
|
|
|
|
|
|
|
|
- |
30 |
|
9 |
|
|
|
|
|
|
|
|
30 |
- |
30 |
10 |
|
|
|
|
|
|
|
|
|
30 |
- |
Source: MEL (2022)
Definition and control of outliers is a common industry practice that is necessary and useful to prevent potential overestimation of volumes and grades. Values defined as outliers have been controlled in the estimation using capping to avoid local estimation of high grades that are not representative of the grades within the estimation domain. The outlier values were defined at sample support with a local approach to identify outlier samples, by comparing the sample grade vs. mean grade of the neighbourhood, considering a minimum of 9 and a maximum of the 30 closest samples. The ratio between the sample and the averages is used to define the outlier if this value is greater than the limit of the domain.
|
|
|
|
MEL_TRS_June 2022_Mike |
June 2022 |
|
|
SEC Technical Report Summary – Minera Escondida Limitada |
Page 115 |
No more than 2% of the data was capped for each estimation domain, and no additional grade control were applied during the estimate, for either Escondida or Escondida Norte. The variation of the average is less than 2% for Escondida and 3% for Escondida Norte, affecting the second decimal. Table 11‑12 and Table 11‑13 show the outlier grade by estimation domain in Escondida and Escondida Norte, respectively.
Table 11‑12: Percentage of Capped Samples for Escondida
|
|
|
|
|
|
Domain |
Limit Sample
grade /
neighbourhood
grade |
Samples
capped % of
total samples |
Average %
with capping |
Average %
without
capping |
Difference
average |
0 |
4.0 |
1.68 |
0.06 |
0.07 |
14.29% |
1 |
5.0 |
0.44 |
0.87 |
0.88 |
1.14% |
2 |
6.0 |
0.18 |
1.11 |
1.11 |
0.00% |
3 |
6.0 |
0.25 |
0.58 |
0.59 |
1.69% |
4 |
5.0 |
0.15 |
1.46 |
1.47 |
0.68% |
5 |
2.5 |
1.03 |
2.20 |
2.21 |
0.45% |
6 |
3.5 |
0.77 |
1.28 |
1.29 |
0.78% |
7 |
5.0 |
0.20 |
0.67 |
0.67 |
0.00% |
8 |
3.5 |
0.73 |
1.02 |
1.03 |
0.97% |
9 |
3.0 |
1.01 |
1.14 |
1.15 |
0.87% |
10 |
3.0 |
0.64 |
0.54 |
0.55 |
1.82% |
11 |
3.0 |
0.27 |
0.86 |
0.86 |
0.00% |
12 |
3.0 |
0.84 |
0.35 |
0.35 |
0.00% |
13 |
3.0 |
0.33 |
0.46 |
0.47 |
2.13% |
14 |
2.5 |
1.79 |
0.16 |
0.16 |
0.00% |
Source: MEL (2022)
Table 11‑13: Percentage of Capped Samples for Escondida Norte
|
|
|
|
|
|
Domain |
Limit Sample
grade /
neighbourhood
grade |
Samples
capped % of
total samples |
Average %
with capping |
Average %
without
capping |
Difference
average |
0 |
7.0 |
0.79 |
0.06 |
0.06 |
0.00% |
1 |
7.0 |
0.25 |
1.14 |
1.14 |
0.00% |
2 |
7.0 |
0.20 |
0.93 |
0.93 |
0.00% |
3 |
8.0 |
0.15 |
0.55 |
0.55 |
0.00% |
4 |
2.5 |
1.90 |
1.79 |
1.83 |
2.19% |
5 |
3.5 |
0.81 |
0.64 |
0.66 |
3.03% |
6 |
3.5 |
0.65 |
1.09 |
1.10 |
0.91% |
7 |
4.0 |
0.33 |
0.59 |
0.59 |
0.00% |
8 |
4.0 |
0.22 |
0.89 |
0.89 |
0.00% |
9 |
4.0 |
0.13 |
0.48 |
0.48 |
0.00% |
10 |
7.0 |
0.45 |
0.14 |
0.14 |
0.00% |
Source: MEL (2022)
A variogram is a description of the spatial continuity of the data. The experimental variogram is a discrete function calculated using a measure of variability between pairs of points at various distances. To complete the analysis the QP first has to calculate experimental variograms using the existing data, and then model theoretical model variograms which will account for any given spacing for the deposit. The traditional experimental variogram is often unstable due to sparse data with outliers and clustered data with a proportional effect. The pairwise relative variogram is a more robust variogram, whereby the experimental traditional variogram is standardised with locally changing variance of the data. Experimental pairwise variograms were calculated using Supervisor software and modelled for each of the elements to be estimated. The orientation of the variograms is defined by the directions of major and minor continuity as
|
|
|
|
MEL_TRS_June 2022_Mike |
June 2022 |
|
|
SEC Technical Report Summary – Minera Escondida Limitada |
Page 116 |
derived from variogram maps in the horizontal and vertical directions for each of the domains. The nugget effect was obtained from the down-the-hole (DTH) variogram.
Figure 11‑9 provides an example for directional variogram for TCu estimation domain 5 for Escondida: High enrichment, central block and High CSA and Figure 11‑10 provides an example for directional variogram for TCu estimation domain 6 for Escondida Norte: Low enrichment and High CSA. Table 11‑14 presents variogram parameters for TCu for Escondida and Table 11‑15 shows variogram parameters for TCu for Escondida Norte.
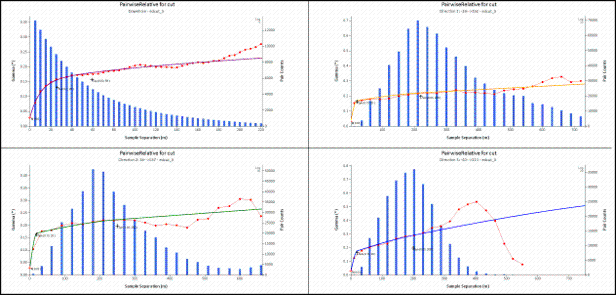
Source: MEL (2022)
Figure 11‑9: Directional Variogram for TCu Estimation Domain 5 for Escondida
Table 11‑14: Variogram Parameters for TCu, Escondida
|
|
|
|
|
|
|
|
|
|
|
TCu
DOMAIN |
C0 |
C1 |
Rotation
Θ1/ Θ2/
Θ3 |
Range
Mj/Sm/Mn |
C2 |
Rotation
Θ1/ Θ2/
Θ3 |
Range
Mj/Sm/Mn |
C3 |
Rotation
Θ1/ Θ2/
Θ3 |
Range
Mj/Sm/Mn |
0 |
0.03 |
0.108 |
0/0/0 |
10/10/15 |
0.158 |
0/0/0 |
100/90/100 |
0.394 |
0/0/0 |
1900/1450/1200 |
1 |
0.04 |
0.16 |
250/20/0 |
10/10/10 |
0.18 |
250/20/0 |
75/75/60 |
0.07 |
250/20/0 |
1200/1200/250 |
2 |
0.13 |
0.19 |
160/0/10 |
100/100/5 |
0.22 |
160/0/10 |
110/140/500 |
0.14 |
160/0/10 |
1250/1300/1500 |
3 |
0.04 |
0.143 |
0/90/-120 |
5/5/5 |
0.078 |
0/90/-120 |
40/40/40 |
0.269 |
0/90/-120 |
1600/1300/850 |
4 |
0.03 |
0.09 |
30/0/10 |
20/20/20 |
0.05 |
30/0/10 |
90/90/170 |
0.12 |
30/0/10 |
2500/1750/450 |
5 |
0.02 |
0.14 |
1/-29/-137 |
20/20/20 |
0.05 |
1/-29/-137 |
400/300/250 |
0.38 |
1/-29/-137 |
5500/5500/1150 |
6 |
0.04 |
0.11 |
290/0/0 |
20/20/20 |
0.076 |
290/0/0 |
100/100/40 |
0.064 |
290/0/0 |
3900/2000/800 |
7 |
0.03 |
0.14 |
250/-10/0 |
30/30/15 |
0.08 |
250/-10/0 |
200/200/120 |
0.07 |
250/-10/0 |
3000/2500/1800 |
8 |
0.02 |
0.177 |
310/0/-120 |
40/40/40 |
0.096 |
310/0/-120 |
150/90/140 |
0.057 |
310/0/-120 |
1600/1500/1500 |
9 |
0.02 |
0.095 |
20/0/0 |
20/20/20 |
0.024 |
20/0/0 |
300/200/250 |
0.091 |
20/0/0 |
1900/1200/1500 |
10 |
0.04 |
0.05 |
201/28/67 |
10/10/10 |
0.033 |
201/28/67 |
50/50/50 |
0.115 |
201/28/674 |
3000/2200/1250 |
11 |
0.03 |
0.041 |
0/90/-80 |
35/35/35 |
0.025 |
0/90/-80 |
170/130/80 |
0.04 |
0/90/-80 |
1500/1100/350 |
12 |
0.03 |
0.087 |
270/0/0 |
35/35/15 |
0.031 |
270/0/0 |
220/220/150 |
0.062 |
270/0/0 |
3000/4000/2000 |
13 |
0.02 |
0.06 |
270/50/0 |
40/10/10 |
0.033 |
270/50/0 |
220/220/150 |
0.059 |
270/50/0 |
2200/2200/1000 |
14 |
0.08 |
0.09 |
240/20/0 |
30/30/30 |
0.07 |
240/20/0 |
200/200/150 |
0.41 |
240/20/0 |
5000/6000/1550 |
Source: MEL (2022)
|
|
|
|
MEL_TRS_June 2022_Mike |
June 2022 |
|
|
SEC Technical Report Summary – Minera Escondida Limitada |
Page 117 |
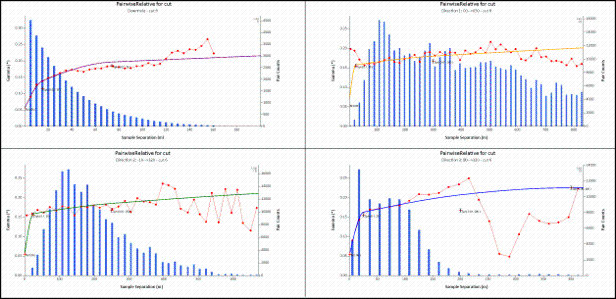
Source: MEL (2022)
Figure 11‑10: Directional Variogram for TCu Estimation Domain 6 for Escondida Norte
Table 11‑15: Variogram Parameters for TCu, Escondida Norte
|
|
|
|
|
|
|
|
|
|
|
TCu
DOMAIN |
C0 |
C1 |
Rotation
Θ1/ Θ2/
Θ3 |
Range
Mj/Sm/Mn |
C2 |
Rotation
Θ1/ Θ2/
Θ3 |
Range
Mj/Sm/Mn |
C3 |
Rotation
Θ1/ Θ2/
Θ3 |
Range
Mj/Sm/Mn |
0 |
0.068 |
0.16 |
20/0/0 |
20/20/20 |
0.179 |
20/0/0 |
200/210/210 |
0.219 |
20/0/0 |
4513/2000/2500 |
1 |
0.094 |
0.261 |
20/0/0 |
10/10/20 |
0.14 |
20/0/0 |
90/90/130 |
0.068 |
20/0/0 |
400/500/1000 |
2 |
0.134 |
0.348 |
20/0/0 |
30/15/30 |
0.032 |
20/0/0 |
350/300/250 |
0.164 |
20/0/0 |
1800/600/1000 |
3 |
0.07 |
0.12 |
330/0/0 |
15/20/15 |
0.107 |
330/0/0 |
500/350/700 |
0.112 |
330/0/0 |
2500/900/3000 |
4 |
0.07 |
0.11 |
40/0/0 |
15/15/15 |
0.065 |
40/0/0 |
160/170/200 |
0.11 |
40/0/0 |
2100/1200/500 |
5 |
0.099 |
0.11 |
310/0/0 |
20/20/20 |
0.066 |
310/0/0 |
370/360/170 |
0.043 |
310/0/0 |
1500/3000/700 |
6 |
0.055 |
0.1 |
50/0/10 |
25/25/25 |
0.012 |
50/0/10 |
300/250/200 |
0.058 |
50/0/10 |
2000/1200/400 |
7 |
0.053 |
0.065 |
50/0/10 |
35/35/15 |
0.025 |
50/0/10 |
200/180/50 |
0.016 |
50/0/10 |
800/500/200 |
8 |
0.026 |
0.055 |
50/0/0 |
40/40/10 |
0.02 |
50/0/0 |
250/220/130 |
0.03 |
50/0/0 |
1000/800/500 |
9 |
0.055 |
0.05 |
70/0/-90 |
15/20/30 |
0.02 |
70/0/-90 |
100/110/110 |
0.05 |
70/0/-90 |
2500/1100/1000 |
10 |
0.151 |
0.199 |
0/90/-20 |
50/30/20 |
0.115 |
0/90/-20 |
300/170/160 |
0.076 |
0/90/-20 |
8000/900/500 |
Source: MEL (2022)
Note: Mj (Major axis), Sm (Semi Major axis) and Mn (Minor Axis)
The estimation was carried out by Ordinary Kriging (OK), which is standard practice for the industry. OK provides the best linear unbiased estimates. In the QP’s experience this is an appropriate method for estimation. The block model includes sub blocks of 6.25 x 6.25 x 7.5 m and parent blocks of 25 x 25 x15 m. The use of sub-blocks allows the geological dilution associated with geological contacts to be included. Table 11‑16 and Table 11‑17 show the dimension of Escondida and Escondida Norte block model. Figure 11‑11 shows a general view of the block models and collar distribution.
|
|
|
|
MEL_TRS_June 2022_Mike |
June 2022 |
|
|
SEC Technical Report Summary – Minera Escondida Limitada |
Page 118 |
Table 11‑16: Block Model Definition for Escondida
|
|
|
|
Orientation |
East |
North |
Elevation |
Origin |
14,212.37 |
104,364.2 |
1,300 |
Block Size |
25 m |
25 m |
15 m |
Number of Blocks |
172 |
268 |
144 |
Source: MEL (2022)
Table 11‑17: Block Model Definition for Escondida Norte
|
|
|
|
Orientation |
East |
North |
Elevation |
Origin |
16,812.5 |
112,212.5 |
2,000 |
Block Size |
25 m |
25 m |
15 m |
Number of Blocks |
159 |
131 |
107 |
Source: MEL (2022)
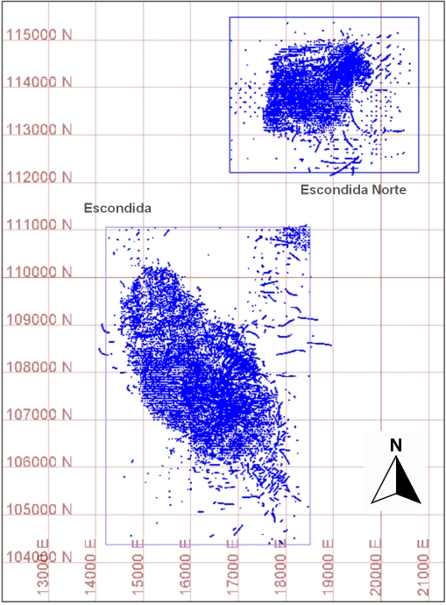
Source: MEL (2022)
Figure 11‑11: General View Escondida and Escondida Norte Block Model and Collar Distribution
|
|
|
|
MEL_TRS_June 2022_Mike |
June 2022 |
|
|
SEC Technical Report Summary – Minera Escondida Limitada |
Page 119 |
A three-pass search strategy was used in which the search radii were increased from 50 m to 600 m. For each pass, the interpolation criteria were adjusted for each estimation domain based on the geostatistical analysis and the quantity and distribution of the data. Pass 1 and pass 2 request a minimum of 6 and 5 octants with samples, respectively. Pass 3 estimates the edges of domains with low sample density and has no octant restrictions. The search radii were defined based on the drilling density of each estimation domain and the continuity defined in its respective variogram, increasing with each pass. Table 11‑18 and Table 11‑19 detail the estimation plan by domain for TCu in Escondida and Escondida Norte, respectively. The QP explored the use of a different number of samples and octants in the estimation to establish an appropriate correlation of results to historical reconciliation. The minimum and maximum samples used in this process are presented in Table 11‑18 and Table 11‑19.
Table 11‑18: OK Plan Estimates Plan TCu, Escondida
|
|
|
|
|
|
|
|
|
|
|
|
|
|
|
Domain |
Pass |
Search Radii |
Comps.
Number |
N°
Oct |
Comps. per Oct |
Comps.
per drill |
Rotation |
Comps. |
Mj. |
Sm. |
Mn. |
Min. |
Max. |
Min. |
Min. |
Max. |
Mj. |
Sm. |
Mn. |
Min. |
0 |
1 |
100 |
90 |
80 |
12 |
32 |
6 |
1 |
4 |
5 |
0 |
0 |
0 |
0 |
2 |
250 |
200 |
180 |
12 |
24 |
5 |
1 |
4 |
5 |
0 |
0 |
0 |
0 |
3 |
650 |
600 |
450 |
6 |
20 |
NA |
NA |
NA |
5 |
0 |
0 |
0 |
0 |
4 |
600 |
600 |
600 |
1 |
1 |
NA |
NA |
NA |
10 |
0 |
0 |
0 |
0 |
1 |
1 |
80 |
80 |
50 |
12 |
32 |
6 |
1 |
4 |
5 |
250 |
20 |
-20 |
1 |
2 |
150 |
150 |
100 |
12 |
24 |
5 |
1 |
4 |
5 |
250 |
20 |
-20 |
1 |
3 |
300 |
300 |
200 |
6 |
20 |
NA |
NA |
NA |
5 |
250 |
20 |
-20 |
1 |
4 |
600 |
600 |
600 |
1 |
1 |
NA |
NA |
NA |
10 |
250 |
20 |
-20 |
1 |
2 |
1 |
70 |
80 |
120 |
12 |
32 |
6 |
1 |
4 |
5 |
160 |
0 |
10 |
2 |
2 |
150 |
150 |
200 |
12 |
24 |
5 |
1 |
4 |
5 |
160 |
0 |
10 |
2 |
3 |
300 |
300 |
400 |
6 |
20 |
NA |
NA |
NA |
5 |
160 |
0 |
10 |
2 |
4 |
600 |
600 |
600 |
1 |
1 |
NA |
NA |
NA |
10 |
160 |
0 |
10 |
2 |
3 |
1 |
80 |
70 |
50 |
12 |
32 |
6 |
1 |
4 |
5 |
0 |
90 |
-120 |
3 |
2 |
250 |
230 |
200 |
12 |
24 |
5 |
1 |
4 |
5 |
0 |
90 |
-120 |
3 |
3 |
400 |
350 |
300 |
6 |
20 |
NA |
NA |
NA |
5 |
0 |
90 |
-120 |
3 |
4 |
600 |
600 |
600 |
1 |
1 |
NA |
NA |
NA |
10 |
0 |
90 |
-120 |
3 |
4 |
1 |
70 |
60 |
50 |
12 |
32 |
6 |
1 |
4 |
5 |
30 |
0 |
10 |
4,5,7 |
2 |
200 |
180 |
100 |
12 |
24 |
5 |
1 |
4 |
5 |
30 |
0 |
10 |
4,5,7 |
3 |
400 |
350 |
200 |
6 |
20 |
NA |
NA |
NA |
5 |
30 |
0 |
10 |
4,5,7 |
5 |
1 |
100 |
100 |
70 |
12 |
32 |
6 |
1 |
4 |
5 |
2 |
-30 |
-138 |
4,5,6,7 |
2 |
200 |
200 |
140 |
12 |
24 |
5 |
1 |
4 |
5 |
2 |
-30 |
-138 |
4,5,6,7 |
3 |
400 |
400 |
280 |
6 |
20 |
NA |
NA |
NA |
5 |
2 |
-30 |
-138 |
4,5,6,7 |
6 |
1 |
90 |
80 |
50 |
12 |
32 |
6 |
1 |
4 |
5 |
290 |
0 |
0 |
5,6,7 |
2 |
200 |
180 |
100 |
12 |
24 |
5 |
1 |
4 |
5 |
290 |
0 |
0 |
5,6,7 |
3 |
400 |
350 |
200 |
6 |
20 |
NA |
NA |
NA |
5 |
290 |
0 |
0 |
5,6,7 |
7 |
1 |
80 |
80 |
50 |
12 |
32 |
6 |
1 |
4 |
5 |
250 |
-10 |
0 |
4,5,6,7,8 |
2 |
160 |
160 |
120 |
12 |
24 |
5 |
1 |
4 |
5 |
250 |
-10 |
0 |
4,5,6,7,8 |
3 |
400 |
380 |
320 |
6 |
20 |
NA |
NA |
NA |
5 |
250 |
-10 |
0 |
4,5,6,7,8 |
8 |
1 |
90 |
60 |
80 |
12 |
32 |
6 |
1 |
4 |
5 |
310 |
0 |
-130 |
7,8,9 |
2 |
180 |
160 |
180 |
12 |
24 |
5 |
1 |
4 |
5 |
310 |
0 |
-130 |
7,8,9 |
3 |
400 |
380 |
380 |
6 |
20 |
NA |
NA |
NA |
5 |
310 |
0 |
-130 |
7,8,9 |
9 |
1 |
100 |
80 |
90 |
12 |
32 |
6 |
1 |
4 |
5 |
20 |
0 |
0 |
8,9,10 |
2 |
200 |
160 |
180 |
12 |
24 |
5 |
1 |
4 |
5 |
20 |
0 |
0 |
8,9,10 |
3 |
400 |
300 |
350 |
6 |
20 |
NA |
NA |
NA |
5 |
20 |
0 |
0 |
8,9,10 |
10 |
1 |
100 |
90 |
80 |
12 |
32 |
6 |
1 |
4 |
5 |
206 |
37 |
64 |
9,10 |
2 |
200 |
160 |
120 |
12 |
24 |
5 |
1 |
4 |
5 |
206 |
37 |
64 |
9,10 |
3 |
400 |
300 |
350 |
6 |
20 |
NA |
NA |
NA |
5 |
206 |
37 |
64 |
9,10 |
11 |
1 |
90 |
80 |
60 |
12 |
32 |
6 |
1 |
4 |
5 |
0 |
90 |
-80 |
11,13 |
2 |
180 |
160 |
140 |
12 |
24 |
5 |
1 |
4 |
5 |
0 |
90 |
-80 |
11,13 |
3 |
650 |
600 |
500 |
6 |
20 |
NA |
NA |
NA |
5 |
0 |
90 |
-80 |
11,13 |
12 |
1 |
90 |
100 |
70 |
12 |
32 |
6 |
1 |
4 |
5 |
270 |
0 |
0 |
12,13,14 |
2 |
180 |
200 |
140 |
12 |
24 |
5 |
1 |
4 |
5 |
270 |
0 |
0 |
12,13,14 |
3 |
650 |
750 |
550 |
6 |
20 |
NA |
NA |
NA |
5 |
270 |
0 |
0 |
12,13,14 |
13 |
1 |
100 |
100 |
60 |
12 |
32 |
6 |
1 |
4 |
5 |
208 |
29 |
42 |
11,12,13,14 |
2 |
300 |
300 |
200 |
12 |
24 |
5 |
1 |
4 |
5 |
208 |
29 |
42 |
11,12,13,14 |
3 |
700 |
700 |
500 |
6 |
20 |
NA |
NA |
NA |
5 |
208 |
29 |
42 |
11,12,13,14 |
14 |
1 |
100 |
100 |
80 |
12 |
32 |
6 |
1 |
4 |
5 |
240 |
20 |
0 |
14,12,13 |
2 |
280 |
300 |
200 |
12 |
24 |
5 |
1 |
4 |
5 |
240 |
20 |
0 |
14,12,13 |
3 |
650 |
700 |
500 |
6 |
20 |
NA |
NA |
NA |
5 |
240 |
20 |
0 |
14,12,13 |
Source: MEL (2022)
|
|
|
|
MEL_TRS_June 2022_Mike |
June 2022 |
|
|
SEC Technical Report Summary – Minera Escondida Limitada |
Page 120 |
Table 11‑19: OK Plan Estimates TCu, Escondida Norte
|
|
|
|
|
|
|
|
|
|
|
|
|
|
|
Domain |
Pass |
Search Radii |
Comps.
Number |
N°
Oct |
Comps. per Oct |
Comps.
per drill |
Rotation |
Comps. |
Mj. |
Sm. |
Mn. |
Min. |
Max. |
Min. |
Min. |
Max. |
Mj. |
Sm. |
Mn. |
Min. |
1 |
1 |
100 |
70 |
80 |
12 |
32 |
6 |
1 |
4 |
5 |
20 |
0 |
0 |
0 |
2 |
200 |
100 |
150 |
12 |
24 |
5 |
1 |
4 |
5 |
20 |
0 |
0 |
0 |
3 |
800 |
400 |
500 |
6 |
20 |
NA |
NA |
NA |
5 |
20 |
0 |
0 |
0 |
2 |
1 |
60 |
60 |
110 |
12 |
32 |
6 |
1 |
4 |
5 |
20 |
0 |
0 |
1 |
2 |
110 |
110 |
200 |
12 |
24 |
5 |
1 |
4 |
5 |
20 |
0 |
0 |
1 |
3 |
200 |
200 |
350 |
6 |
20 |
NA |
NA |
NA |
5 |
20 |
0 |
0 |
1 |
3 |
1 |
110 |
60 |
80 |
12 |
32 |
6 |
1 |
4 |
5 |
20 |
0 |
0 |
2 |
2 |
220 |
120 |
160 |
12 |
24 |
5 |
1 |
4 |
5 |
20 |
0 |
0 |
2 |
3 |
350 |
150 |
250 |
6 |
20 |
NA |
NA |
NA |
5 |
20 |
0 |
0 |
2 |
4 |
1 |
90 |
70 |
50 |
12 |
32 |
6 |
1 |
4 |
5 |
330 |
0 |
0 |
3 |
2 |
180 |
160 |
110 |
12 |
24 |
5 |
1 |
4 |
5 |
330 |
0 |
0 |
3 |
3 |
300 |
250 |
190 |
6 |
20 |
NA |
NA |
NA |
5 |
330 |
0 |
0 |
3 |
5 |
1 |
100 |
70 |
50 |
12 |
32 |
6 |
1 |
4 |
5 |
40 |
0 |
0 |
4,5 |
2 |
200 |
140 |
110 |
12 |
24 |
5 |
1 |
4 |
5 |
40 |
0 |
0 |
4,5 |
3 |
350 |
250 |
200 |
6 |
20 |
NA |
NA |
NA |
5 |
40 |
0 |
0 |
4,5 |
6 |
1 |
75 |
120 |
50 |
12 |
32 |
6 |
1 |
4 |
5 |
310 |
0 |
0 |
4,5 |
2 |
150 |
200 |
100 |
12 |
24 |
5 |
1 |
4 |
5 |
310 |
0 |
0 |
4,5 |
3 |
280 |
370 |
200 |
6 |
20 |
NA |
NA |
NA |
5 |
310 |
0 |
0 |
4,5 |
7 |
1 |
100 |
70 |
50 |
12 |
32 |
6 |
1 |
4 |
5 |
50 |
0 |
10 |
6,7 |
2 |
220 |
170 |
120 |
12 |
24 |
5 |
1 |
4 |
5 |
50 |
0 |
10 |
6,7 |
3 |
350 |
250 |
200 |
6 |
20 |
NA |
NA |
NA |
5 |
50 |
0 |
10 |
6,7 |
8 |
1 |
85 |
80 |
50 |
12 |
32 |
6 |
1 |
4 |
5 |
50 |
0 |
10 |
6,7,8 |
2 |
170 |
160 |
130 |
12 |
24 |
5 |
1 |
4 |
5 |
50 |
0 |
10 |
6,7,8 |
3 |
300 |
250 |
200 |
6 |
20 |
NA |
NA |
NA |
5 |
50 |
0 |
10 |
6,7,8 |
9 |
1 |
85 |
60 |
40 |
12 |
32 |
6 |
1 |
4 |
5 |
50 |
0 |
0 |
7,8,9 |
2 |
160 |
120 |
90 |
12 |
24 |
5 |
1 |
4 |
5 |
50 |
0 |
0 |
7,8,9 |
3 |
500 |
400 |
300 |
6 |
20 |
NA |
NA |
NA |
5 |
50 |
0 |
0 |
7,8,9 |
10 |
1 |
85 |
70 |
65 |
12 |
32 |
6 |
1 |
4 |
5 |
70 |
0 |
-90 |
8,9,10 |
2 |
200 |
180 |
150 |
12 |
24 |
5 |
1 |
4 |
5 |
70 |
0 |
-90 |
8,9,10 |
3 |
600 |
530 |
450 |
6 |
20 |
NA |
NA |
NA |
5 |
70 |
0 |
-90 |
8,9,10 |
Source: MEL (2022)
The copper grade in the regularised block model was calculated by the weighted average for each estimation domain within the block.
Cspcc, cspcv, and cspcpy were estimated by OK with the same copper estimation domains and normalised to the copper value, only for sulphide mineralisation.
Dry density was estimated using OK. The methodology adopted for the interpolation uses mineralogical units (Minzone) as controls for the spatial distribution of the variable in each deposit. An average density, by geological grouping, is assigned to the blocks with no interpolated value.
In order to validate the Resource model, a validation of the block model was carried out to assess the performance of the OK and the conformity of input values. The validation was carried out on estimated blocks and up to the third pass, considering composites used in the estimates, and included:
•Visual Comparison of OK model vs. composites
•Global statistics by estimation domain
•OK vs. Blasthole model reconciliation
•Swath plots to compare mean grade between declustered composites and block model
|
|
|
|
MEL_TRS_June 2022_Mike |
June 2022 |
|
|
SEC Technical Report Summary – Minera Escondida Limitada |
Page 121 |
To visually validate the TCu estimation, the QP completed a review of a set of cross-sectional and plan views. The validation shows a reasonable representation of samples in blocks. Locally, the blocks match the estimation composites both in cross-section and plant views. In general, there is a reasonable match between composite data and block model data for Cu grades. High grade areas were suitably represented, and high-grade samples exhibit suitable control, which validates the treatment of outliers used. Smoothing increases at the boundaries and deep areas of the deposit due to the reduction in number of available composites.
There are some deep mineralised areas where the drill hole spacing reaches a maximum of 400 m (mean 330 m). Considering the large continuity of the hypogene mineralisation and the grades clean process beyond of the last drill hole line, this portion of the Inferred Resource is considered interpolated.
Figure 11‑12 shows an east-west cross-section and Figure 11‑13 shows a plan section for the Escondida copper grade model, it is possible to observe a good spatial reproduction of the composites grades in both cross-sections without smearing of high-grade composites and minimum over extrapolation of grades.
Figure 11‑14 and Figure 11‑15 show the block and composites grade comparison for plan view and east-west cross-sections in Escondida Norte. Like Escondida it is possible to observe good sample coverage for the deposit and spatial reproduction of grades. Lateral extension of the ore body is well limited by samples and the deposit remains open at depth at low copper grade less than 0.5%.
No high-grade smearing and minimum grade extrapolation were observed. The Inferred Resource is considered 100% “interpolated”. This limit is updated as new drill holes are drilled in the periphery of the deposits.
|
|
|
|
MEL_TRS_June 2022_Mike |
June 2022 |
|
|
SEC Technical Report Summary – Minera Escondida Limitada |
Page 122 |
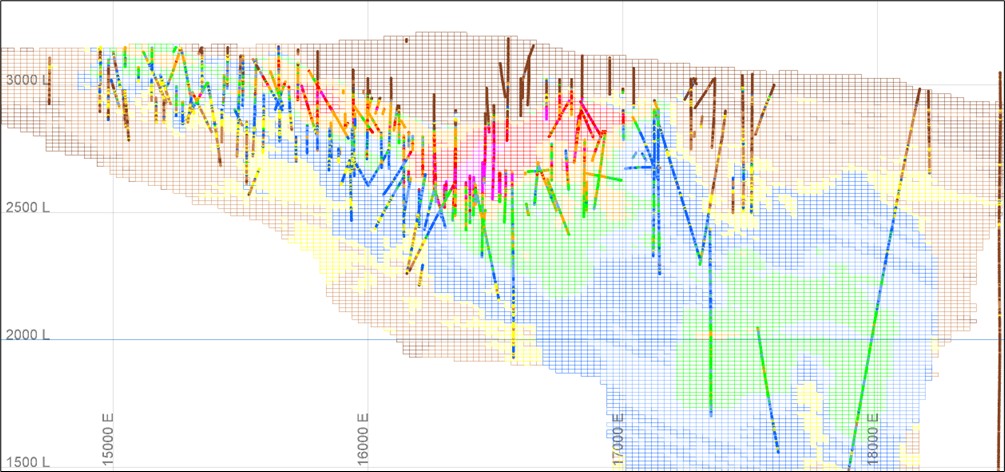
Source: MEL (2022)
Figure 11‑12: Escondida 107,900N Copper Cross-section Looking North
|
|
|
|
MEL_TRS_June 2022_Mike |
June 2022 |
|
|
SEC Technical Report Summary – Minera Escondida Limitada |
Page 123 |
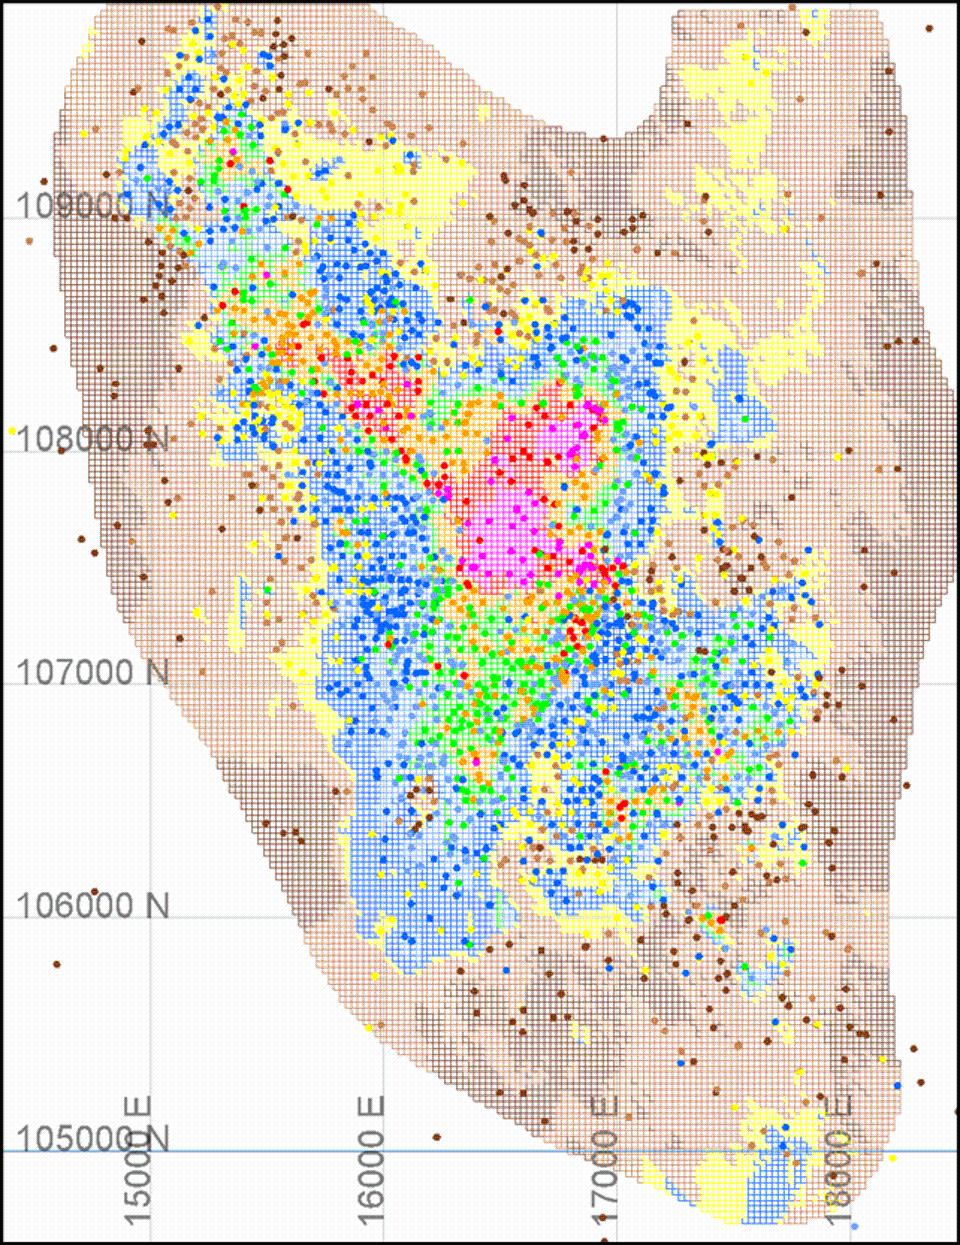
Source: MEL (2022)
Figure 11‑13: Escondida Copper at 2770 RL
|
|
|
|
MEL_TRS_June 2022_Mike |
June 2022 |
|
|
SEC Technical Report Summary – Minera Escondida Limitada |
Page 124 |
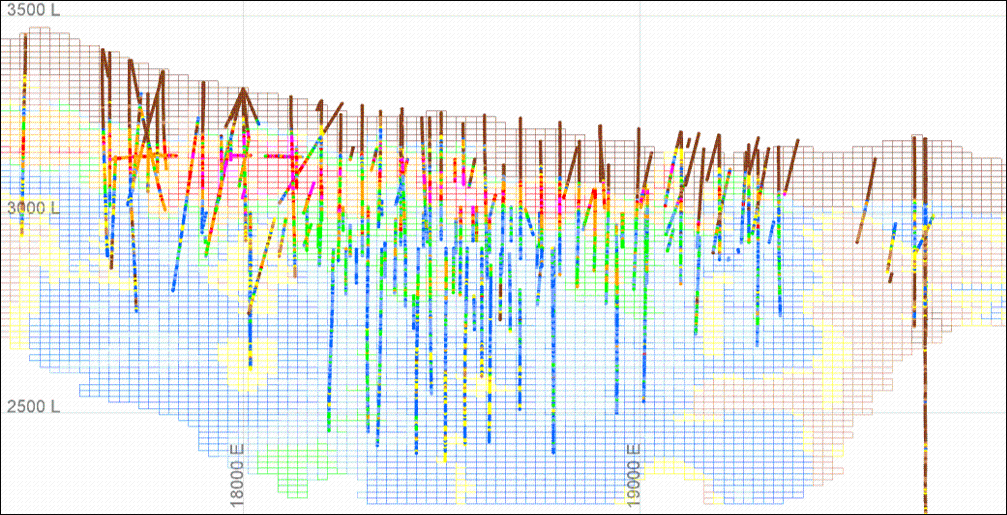
Source: MEL (2022)
Figure 11‑14: Escondida Norte 114,000N Copper Cross-section Looking North
|
|
|
|
MEL_TRS_June 2022_Mike |
June 2022 |
|
|
SEC Technical Report Summary – Minera Escondida Limitada |
Page 125 |
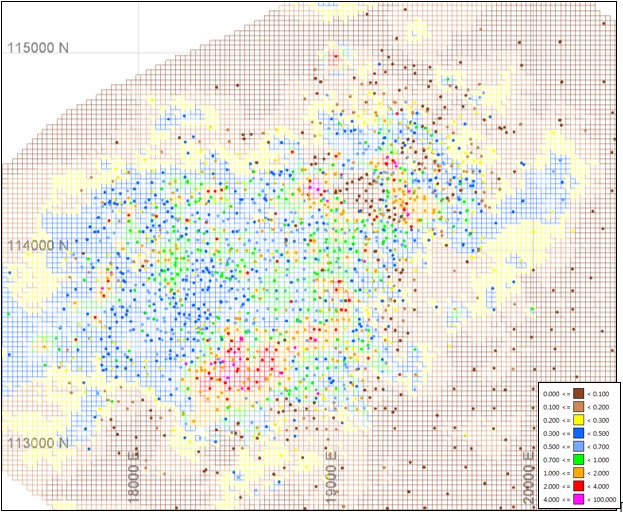
Source: MEL (2022)
|
|
Figure 11‑15: |
Escondida Norte Copper at 2960 RL |
In order to evaluate how robust block grades were in relation to data, a semi-local comparison using swath plots was completed. Generating swath plots entail averaging blocks and samples separately in regular 100 m (east) x 100 m (north) x 50 m (elevation) panels and then comparing the mean grade in each sample and block panel through each axis.
To calculate the average grade in the database, a nearest neighbour (NN) model was established. The block model must reproduce in an acceptable way the mean shown by the composites for each estimation domain. Figure 11‑16 show the mean grade comparison for Escondida and Figure 11‑17 for Escondida Norte for sulphide mineralisation. It is opinion of this QP that results indicate that estimates reasonably follow trends found in the deposit’s grades at a local and global scale without observing an excessive degree of smoothing.
|
|
|
|
MEL_TRS_June 2022_Mike |
June 2022 |
|
|
SEC Technical Report Summary – Minera Escondida Limitada |
Page 126 |
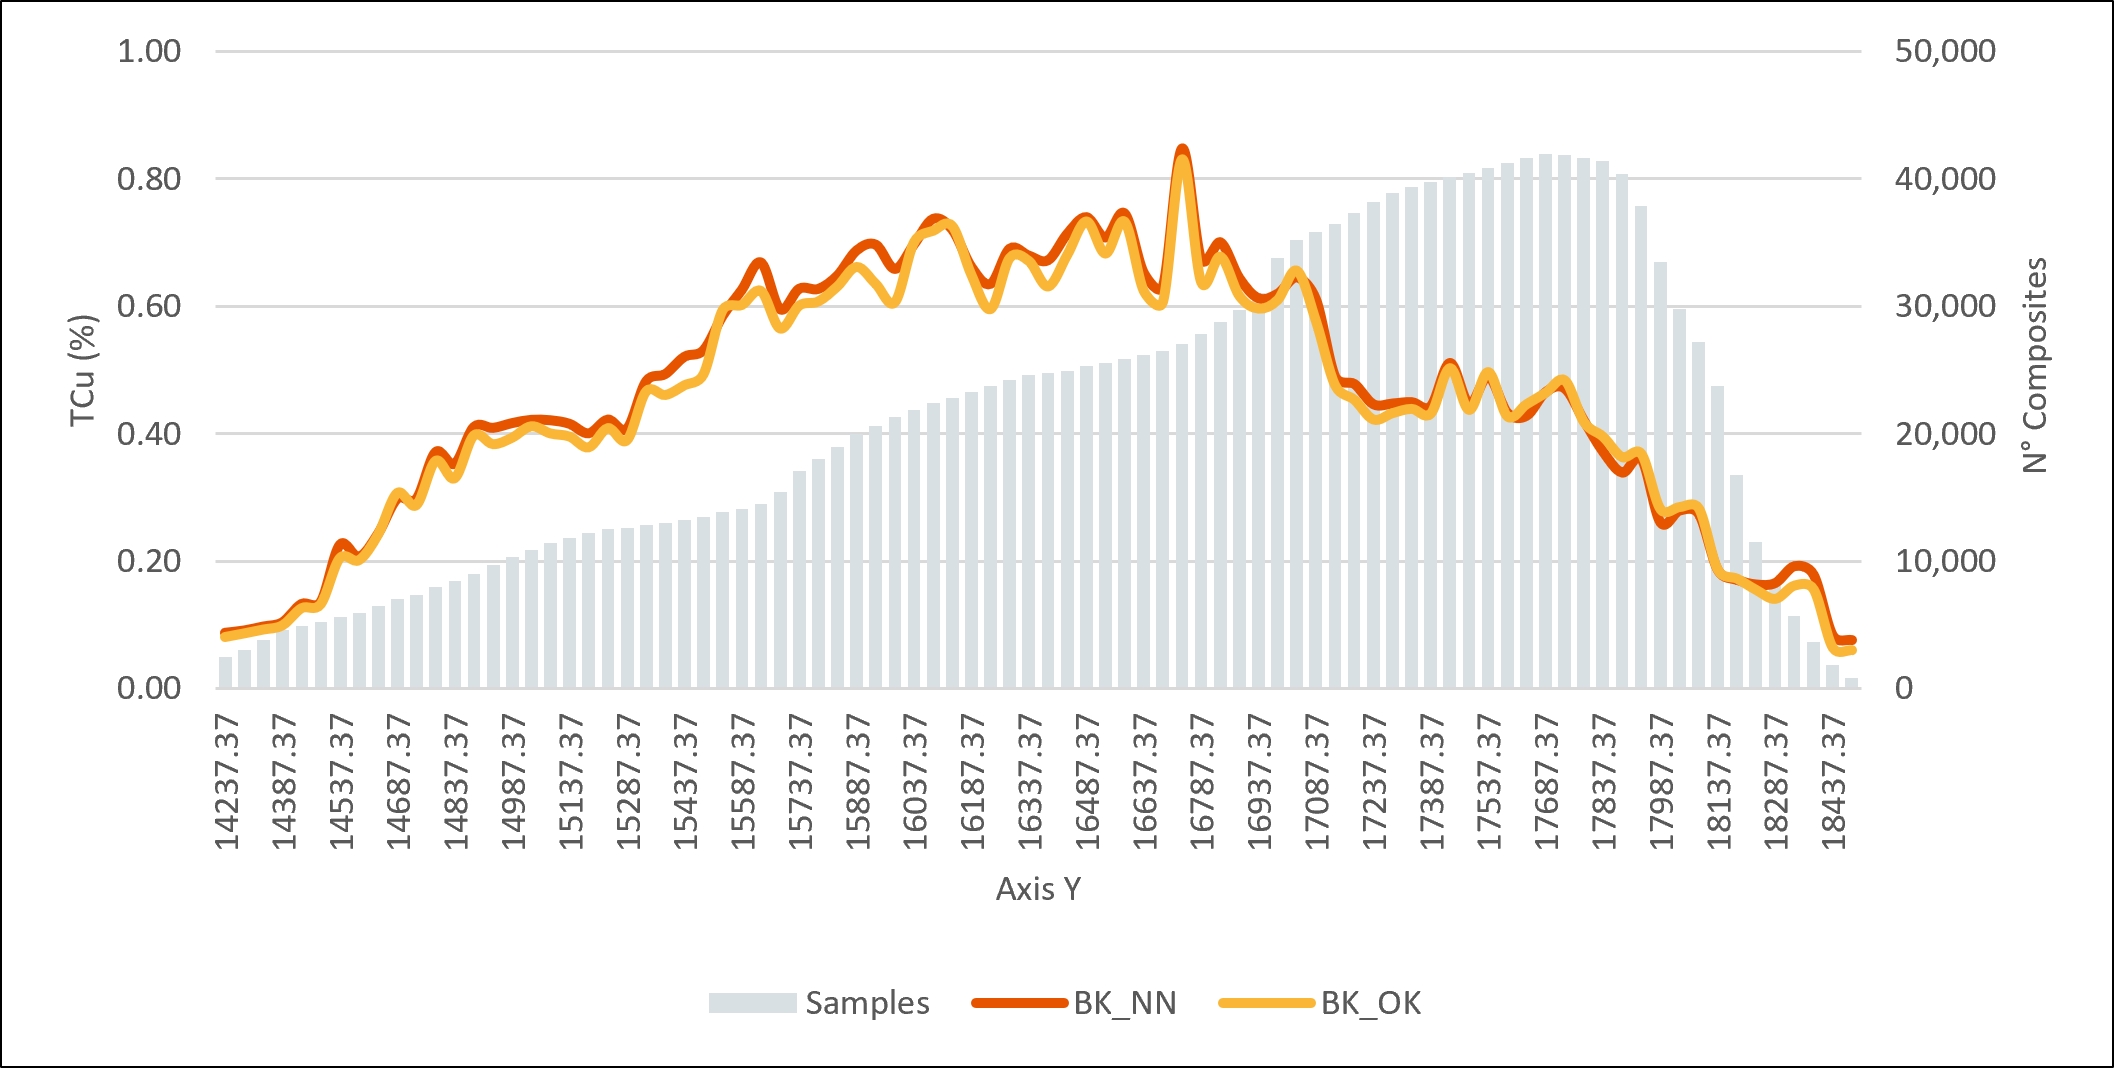
Source: MEL (2022)
|
|
Figure 11‑16: |
Swath Plots Total Sulphide, Escondida |
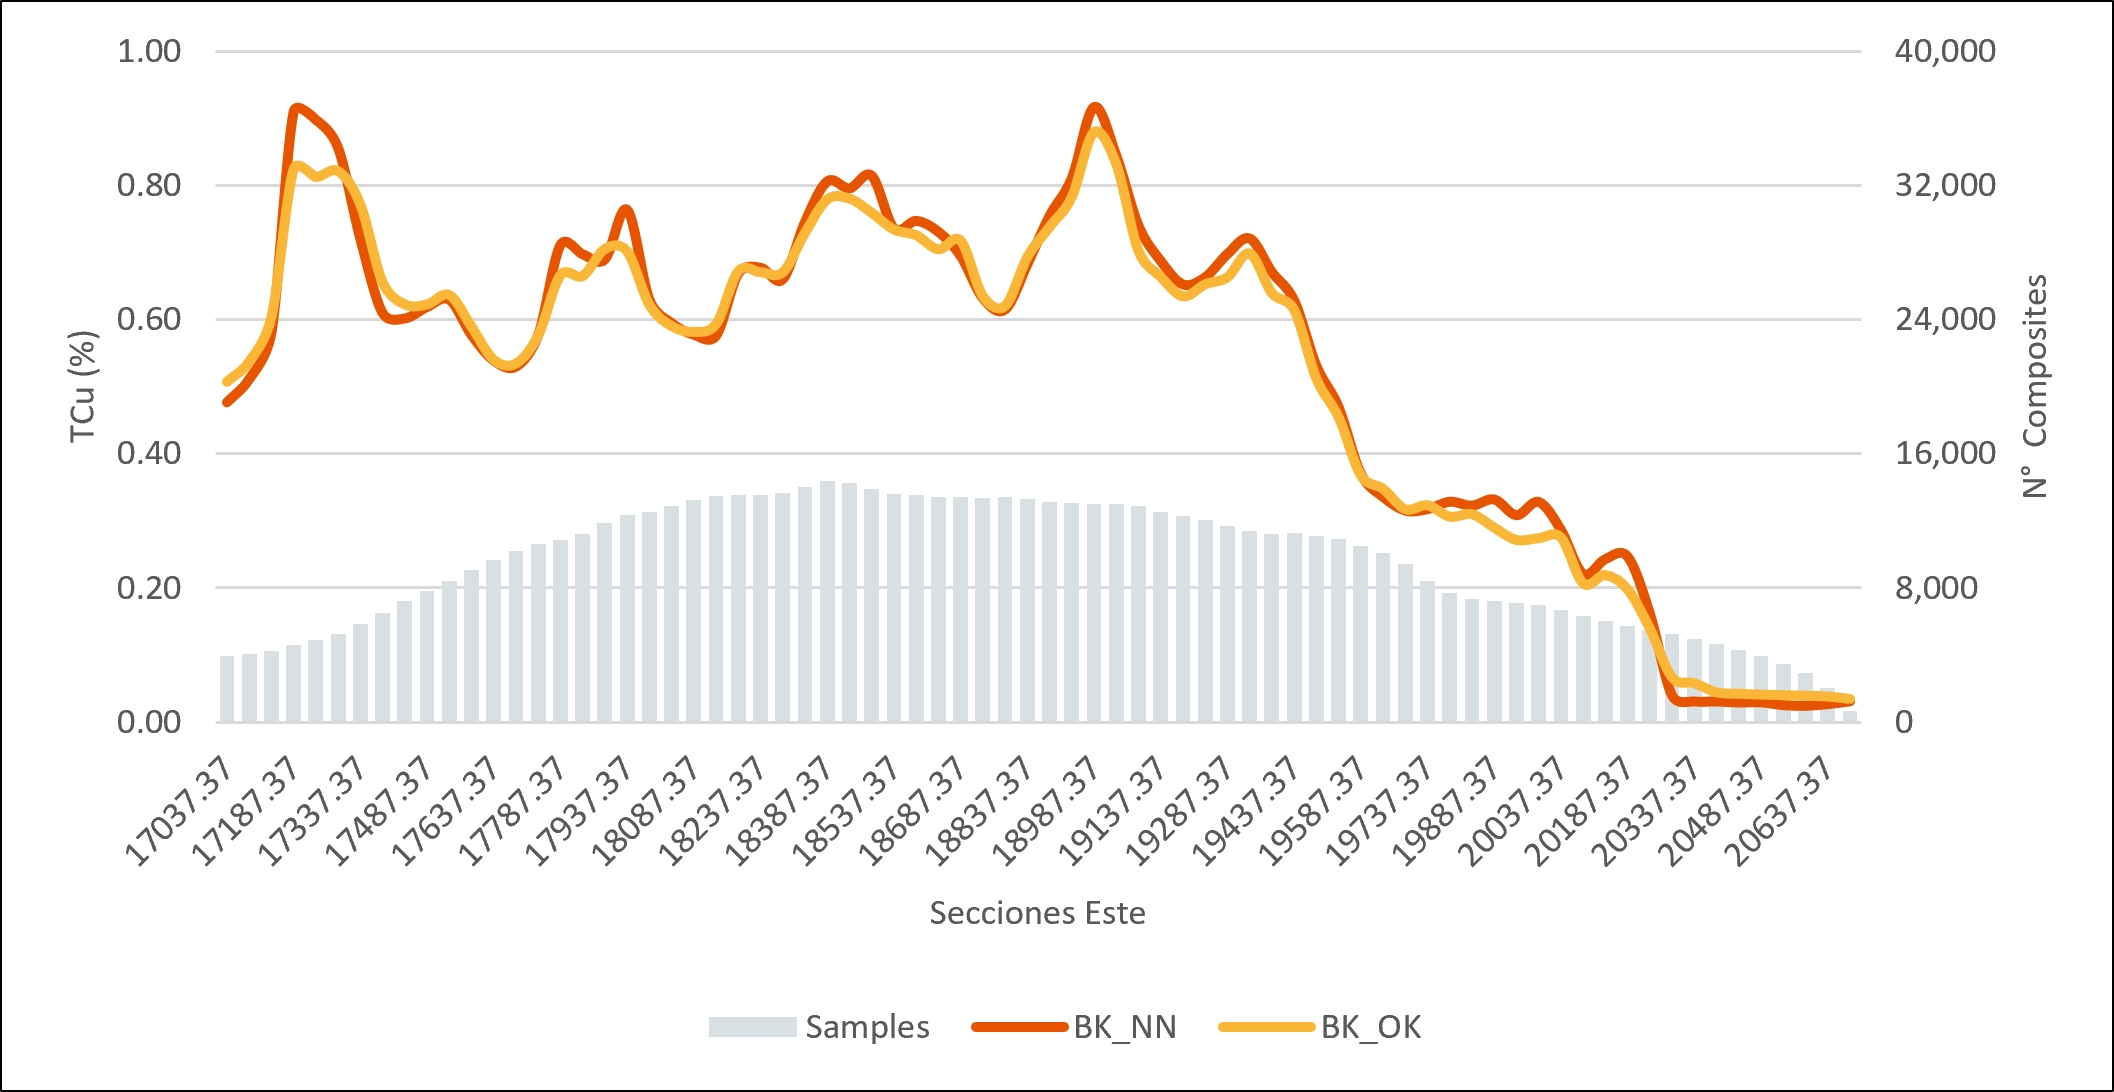
Source: MEL (2022)
|
|
Figure 11‑17: |
Swath Plots Total Sulphide, Escondida Norte |
Statistical comparison was carried out in order to detect global bias in the interpolated model compared with drill holes grade. Global statistics of declustered composites were calculated using the NN method with search ranges equating to those used in the estimation and were compared with OK grades for each domain (ED_TCu).
|
|
|
|
MEL_TRS_June 2022_Mike |
June 2022 |
|
|
SEC Technical Report Summary – Minera Escondida Limitada |
Page 127 |
Table 11‑20 and Table 11‑21 show the comparison with grade capping. The results show an acceptable reproduction of the global mean for total copper grade. Domains located in the leach-oxide zone shows larger differences: ED 0 corresponds to leached material with low copper grade and high-grade variability between 0.001 and 0.1 % TCu, which explains the relative differences observed. These lower copper grades are waste and this variation is not material. ED 3 corresponds to the mixed zone, with high variability in copper grades. The QP noticed that, where the larger variances exist, they are in low grades below COG or in domain with low spatial continuity, and therefore, considered to be not material.
In the opinion of this QP the result of the estimate shows that relative differences for the main estimation domains were found within acceptable limits. Only estimation domains with less samples and poor geological continuity and low tonnage show results above the expected threshold.
|
|
Table 11‑20: |
Global mean comparison for TCu, Escondida |
|
|
|
|
|
Domain |
# Composite |
Composite average % |
Model average % |
Relative Difference (%) |
0 |
67,196 |
0.06 |
0.08 |
24.02% |
1 |
14,640 |
0.87 |
0.83 |
-5.57% |
2 |
3,814 |
1.11 |
1.15 |
3.80% |
3 |
7,734 |
0.58 |
0.53 |
-10.72% |
4 |
13,870 |
1.46 |
1.41 |
-4.03% |
5 |
14,432 |
2.20 |
2.25 |
2.00% |
6 |
3,264 |
1.28 |
1.17 |
-9.13% |
7 |
16,511 |
0.67 |
0.66 |
-0.60% |
8 |
1,782 |
1.02 |
1.03 |
1.28% |
9 |
10,373 |
1.14 |
1.16 |
1.24% |
10 |
22,374 |
0.54 |
0.57 |
4.96% |
11 |
16,653 |
0.86 |
0.82 |
-4.64% |
12 |
8,948 |
0.35 |
0.36 |
4.20% |
13 |
45,486 |
0.46 |
0.45 |
-3.69% |
14 |
61,176 |
0.16 |
0.15 |
-1.97% |
Source: MEL (2022)
|
|
Table 11‑21: |
Global mean comparison for TCu, Escondida Norte |
|
|
|
|
|
Domain |
# Composite |
Composite average % |
Model average % |
Relative Difference (%) |
0 |
47,081 |
0.06 |
0.07 |
5.16% |
1 |
9,620 |
1.06 |
1.06 |
0.17% |
2 |
1,990 |
0.90 |
0.88 |
-2.38% |
3 |
3,956 |
0.59 |
0.47 |
-26.88% |
4 |
17,641 |
1.69 |
1.66 |
-1.59% |
5 |
6,558 |
0.65 |
0.61 |
-5.81% |
6 |
5,254 |
1.05 |
1.07 |
1.52% |
7 |
12,615 |
0.56 |
0.58 |
2.85% |
8 |
4,088 |
0.86 |
0.83 |
-2.80% |
9 |
37,905 |
0.41 |
0.44 |
7.97% |
10 |
29,382 |
0.10 |
0.12 |
14.76% |
Source: MEL (2022)
|
|
|
|
MEL_TRS_June 2022_Mike |
June 2022 |
|
|
SEC Technical Report Summary – Minera Escondida Limitada |
Page 128 |
11.4.4.Comparison Against Blasthole Grade
As part of the Resource model validation process, a reconciliation of tonnage, grade and metal against the blasthole model (short term model) was completed. The reconciliation was performed at 0.25% total copper cut-off grade within the monthly mined volumes of the last FY10. Year by year reconciliation has been done to ensure no local bias.
Escondida Sulphide
The Escondida deposit shows a good performance, the in-situ tonnage deviations show an unbiased behaviour with periods of underestimation and overestimation within a range of ±7% (see Figure 11‑18). Three quarters showed deviations closer to 10% underestimation .This deviation is related to zones with contact between leached and sulphide mineralisation due to low continuity ore bodies not recognised by drilling. Copper grades show an unbiased performance with periods of under and over estimation within a range of ±7% on average (see Figure 11‑19). Figure 11‑20 shows the result for the in‑situ metal.
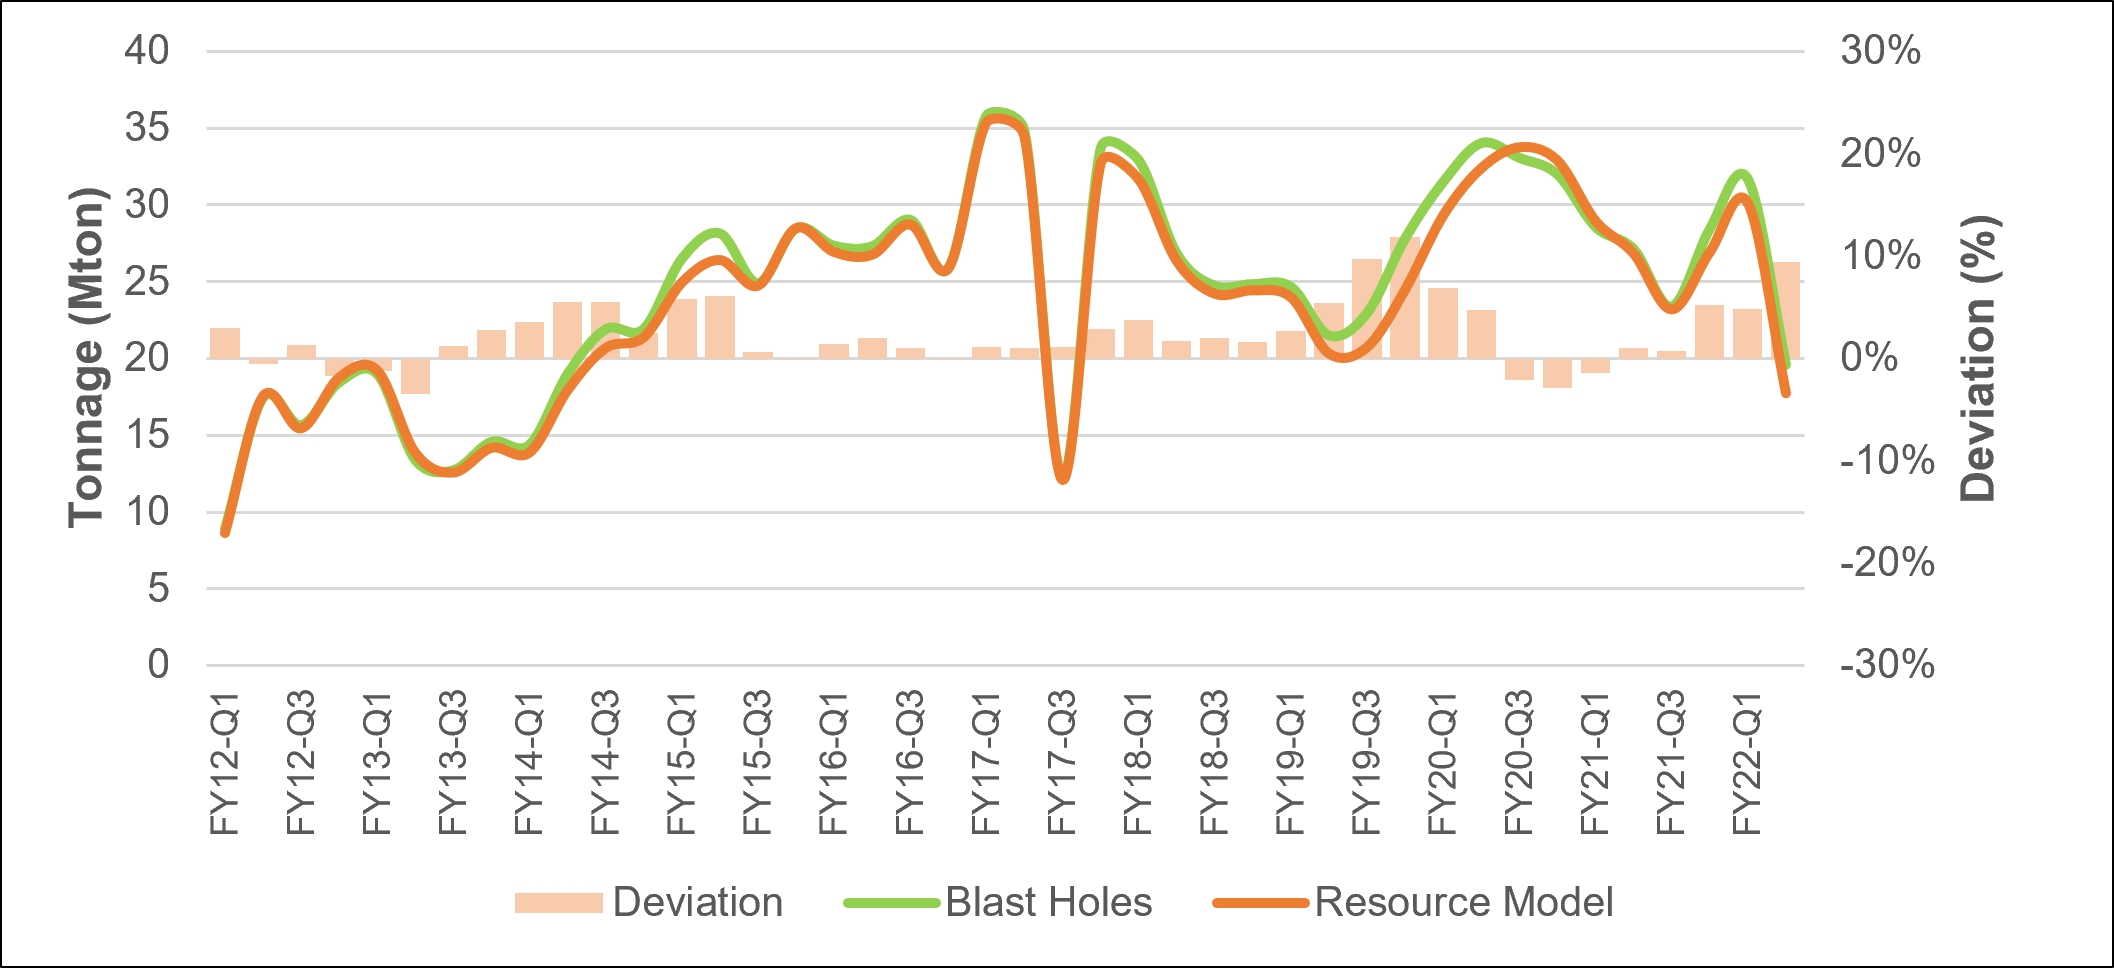
Source: MEL (2022)
|
|
Figure 11-18: |
Tonnage Reconciliation, Sulphide Escondida |
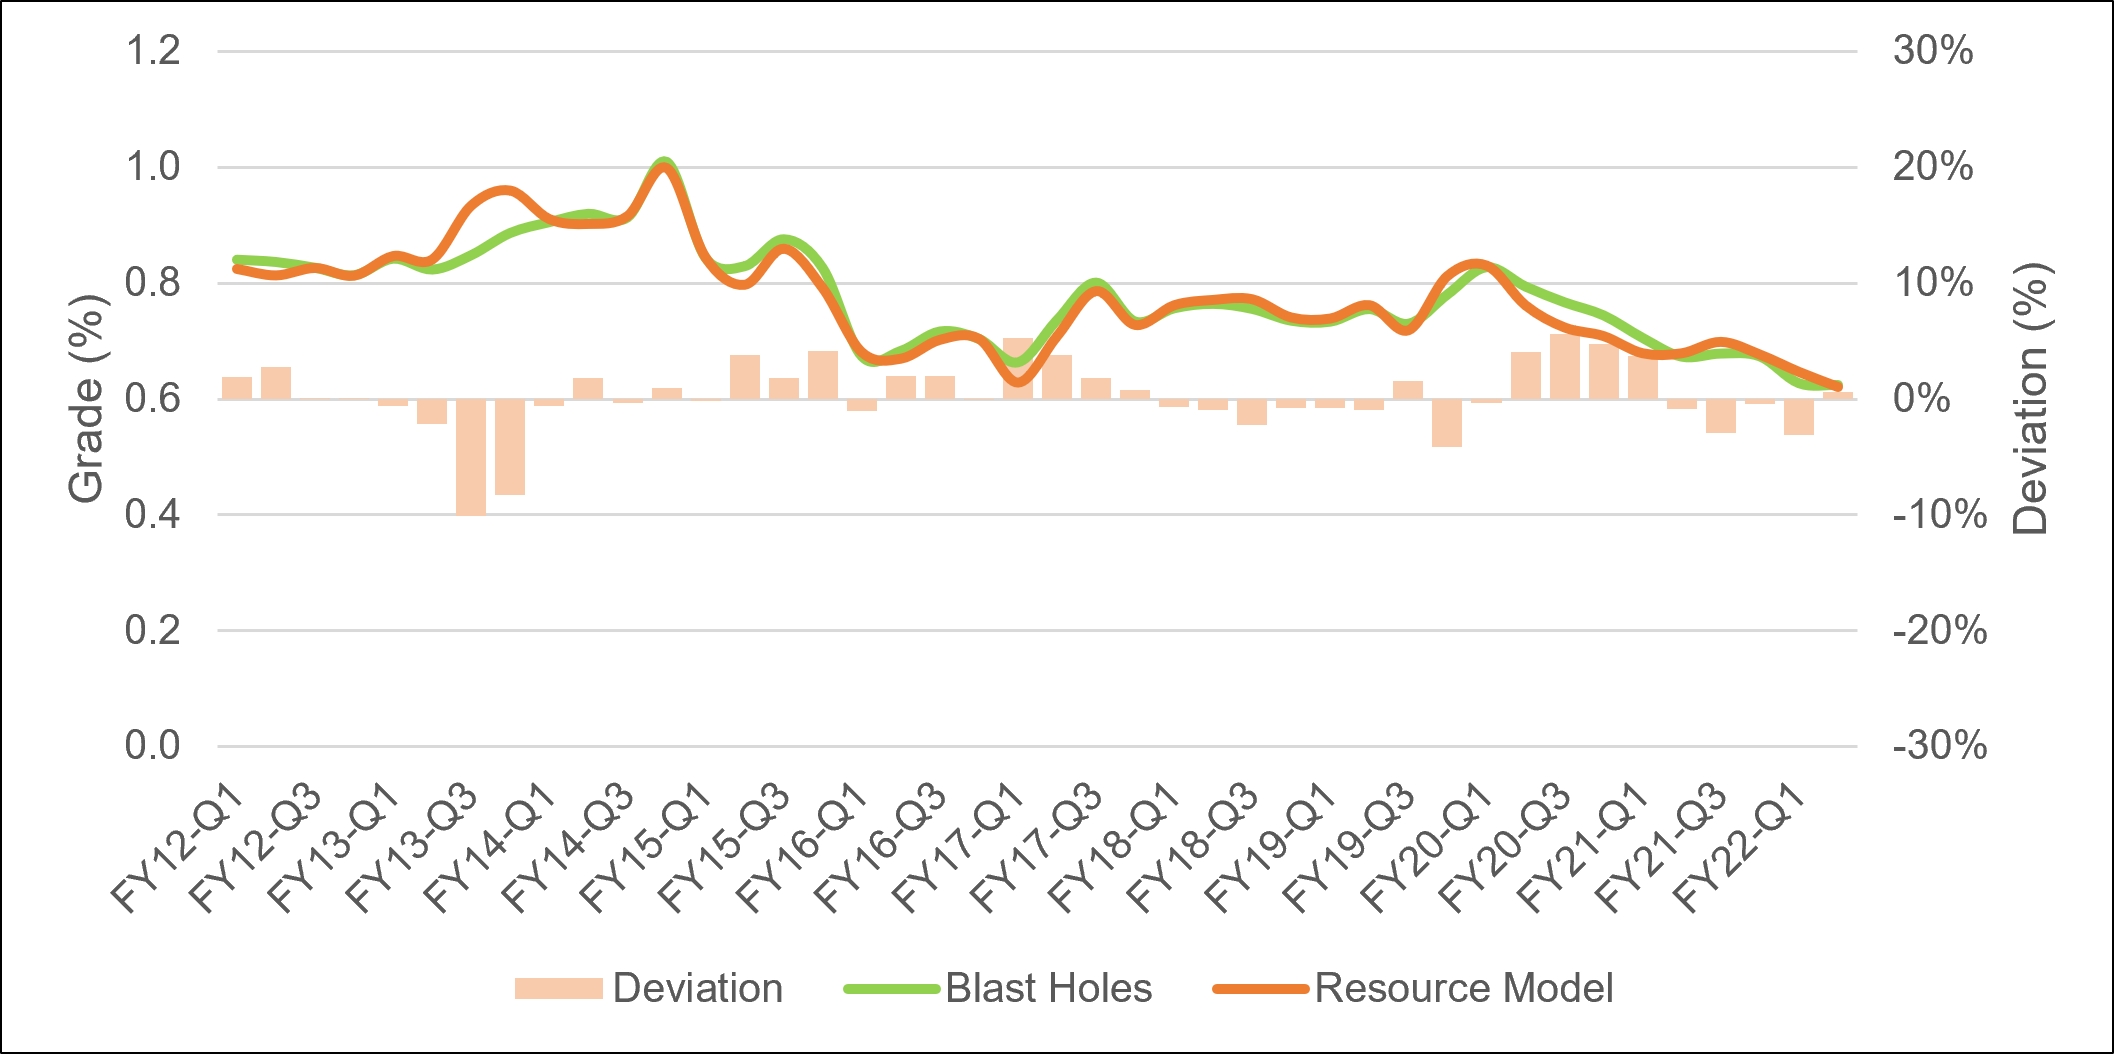
Source: MEL (2022)
|
|
Figure 11-19: |
Total Copper Grade Reconciliation, Sulphide Escondida |
|
|
|
|
MEL_TRS_June 2022_Mike |
June 2022 |
|
|
SEC Technical Report Summary – Minera Escondida Limitada |
Page 129 |
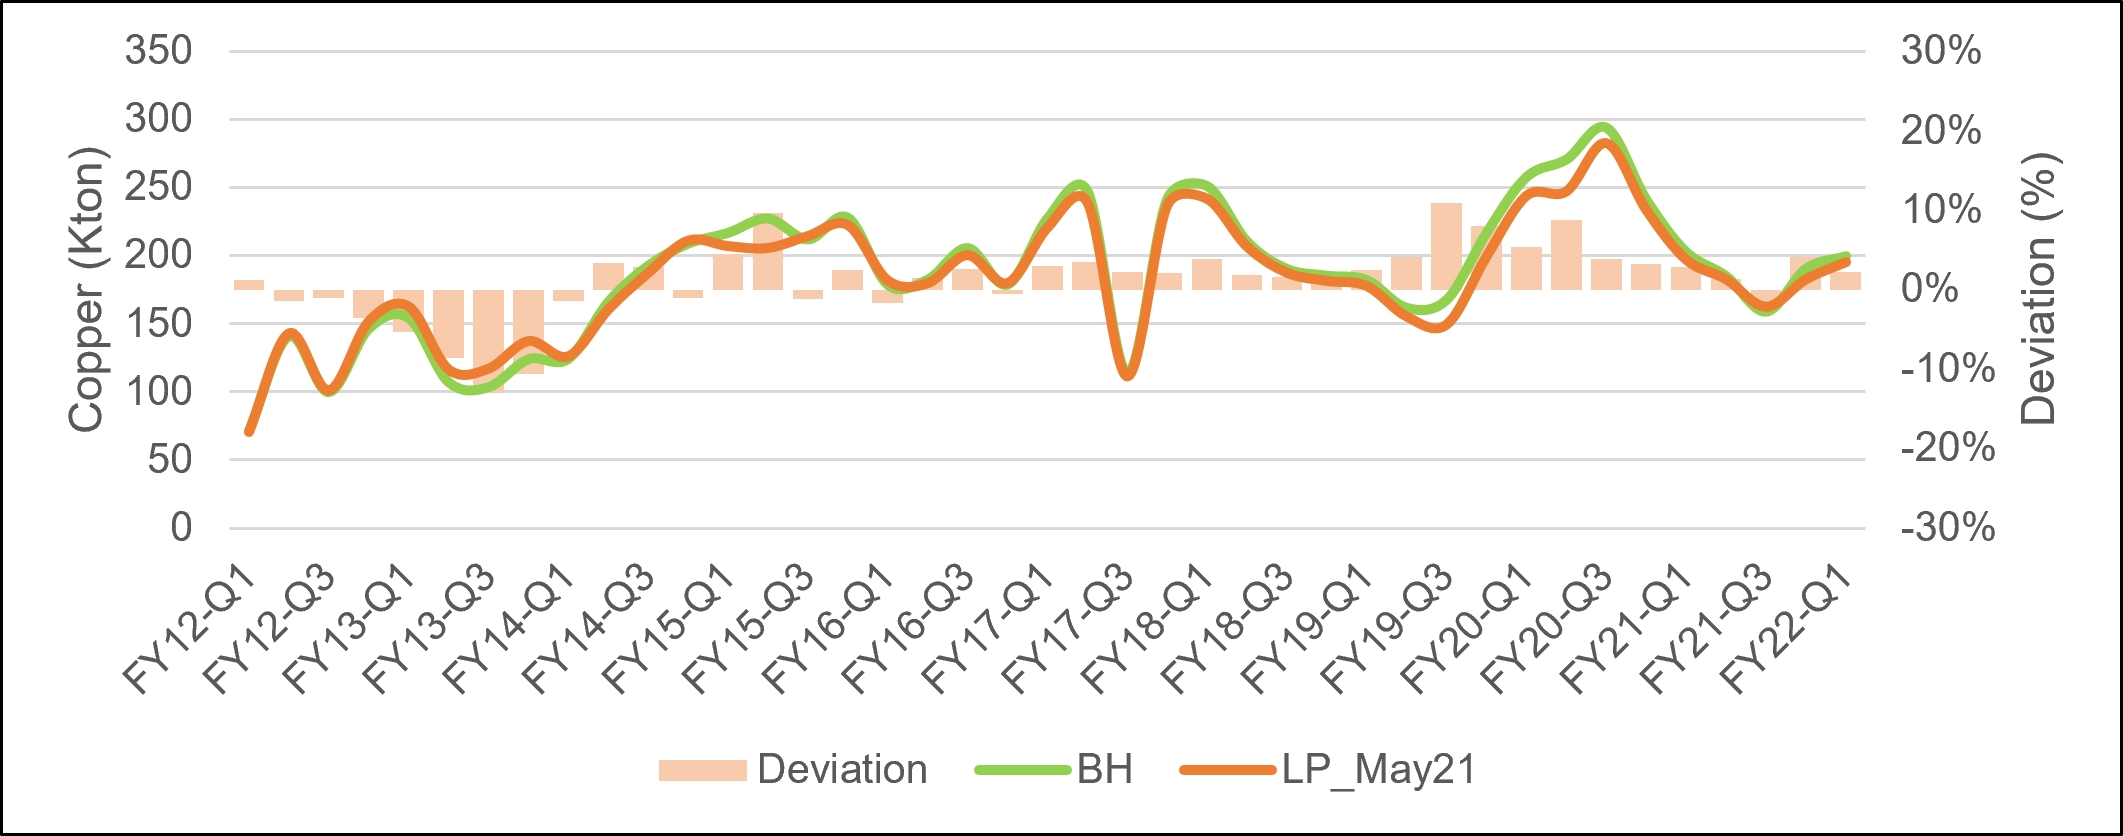
Source: MEL (2022)
|
|
Figure 11-20: |
Total Contained Copper Tonnes Reconciliation, Sulphide Escondida |
Escondida Norte Sulphide
The Escondida Norte deposit shows a non-biased performance with the in-situ tonnage deviations showing an unbiased behaviour with periods of underestimation and overestimation within a range of ±5%, as shown in Figure 11‑25. Copper grades show an unbiased performance with periods of under and over estimation within a range of ±7% on average (see Figure 11‑22). There is a period of overestimation closer to -10% (FY13-Q2 to FY14-Q2), which is related to a high variability and low continuity of high-grade zones at the periphery of the deposit that were not identified by the drilling pattern. Figure 11‑23 shows the result for in-situ metal.
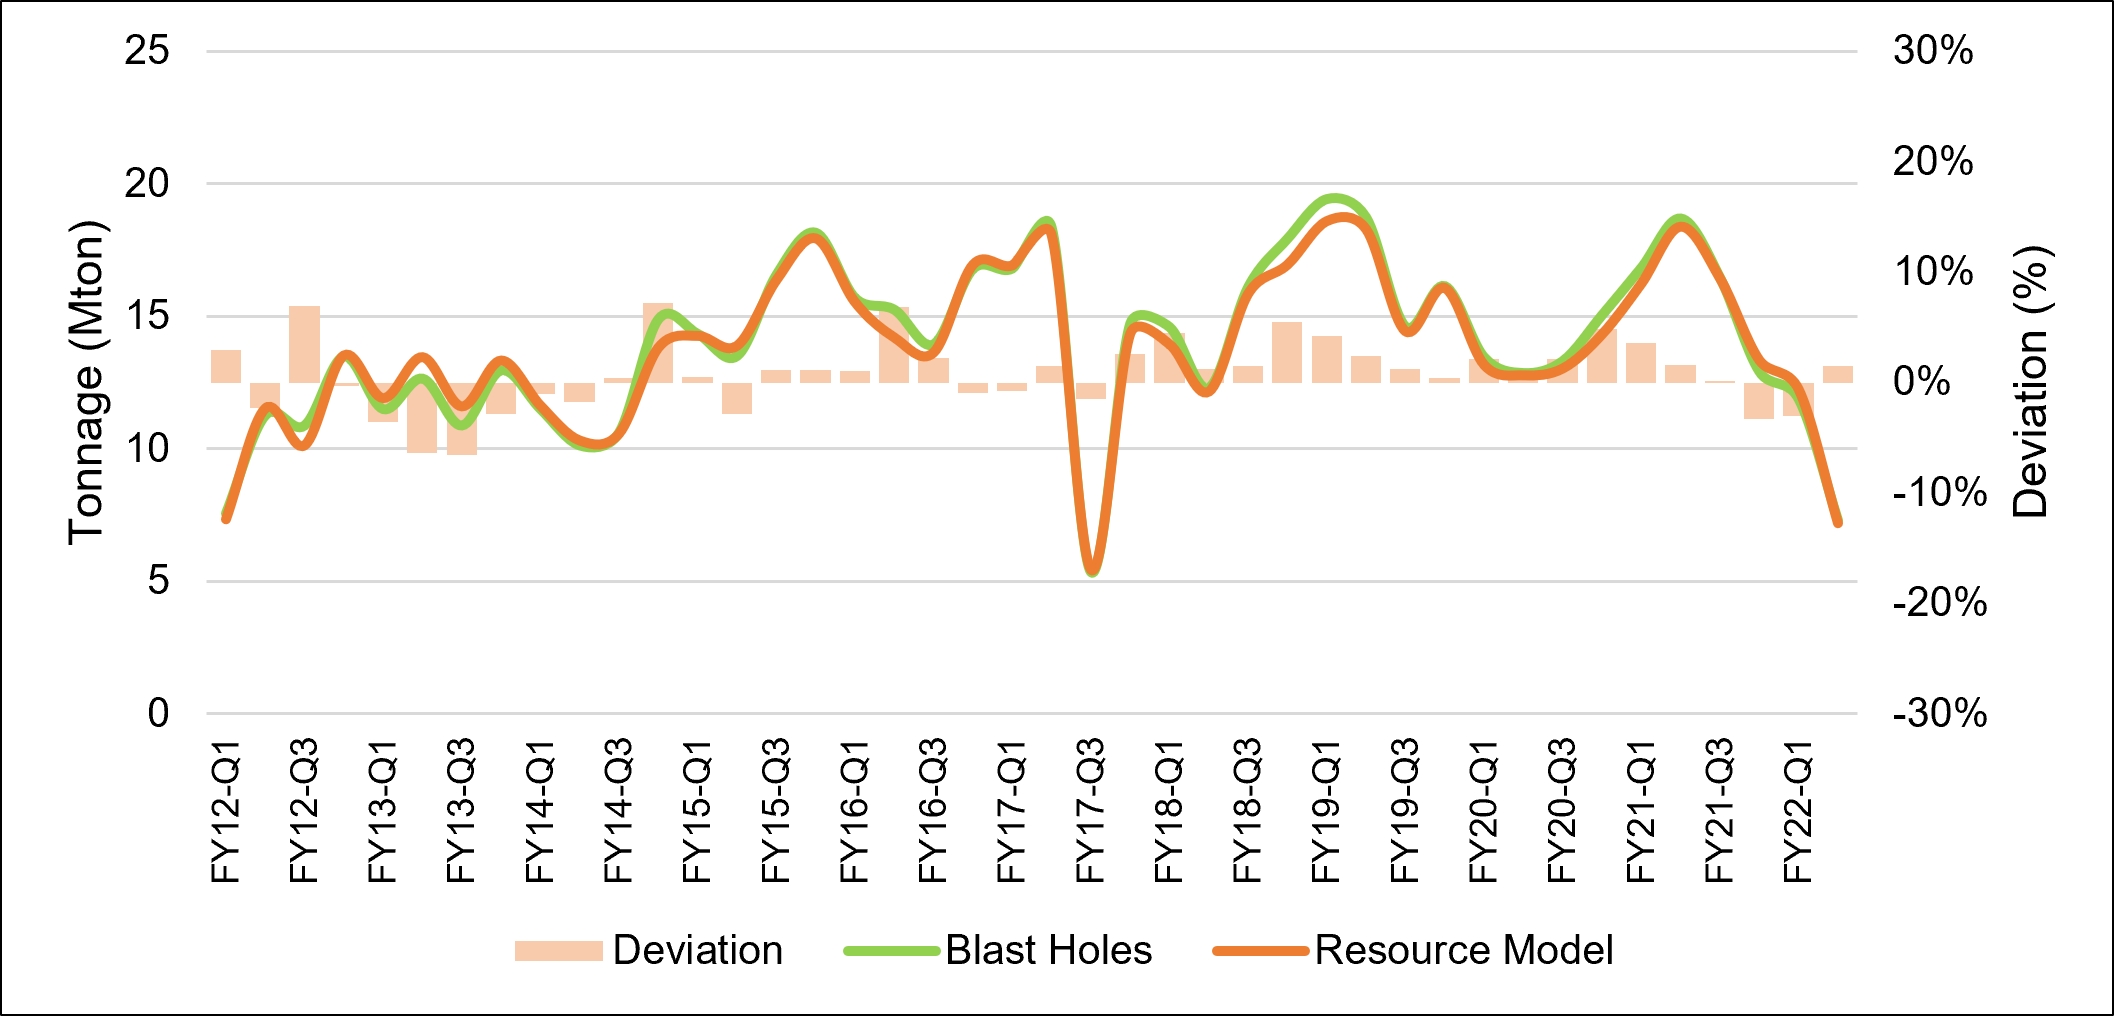
Source: MEL (2022)
|
|
Figure 11-21: |
Tonnage Reconciliation, Sulphide Escondida Norte |
|
|
|
|
MEL_TRS_June 2022_Mike |
June 2022 |
|
|
SEC Technical Report Summary – Minera Escondida Limitada |
Page 130 |
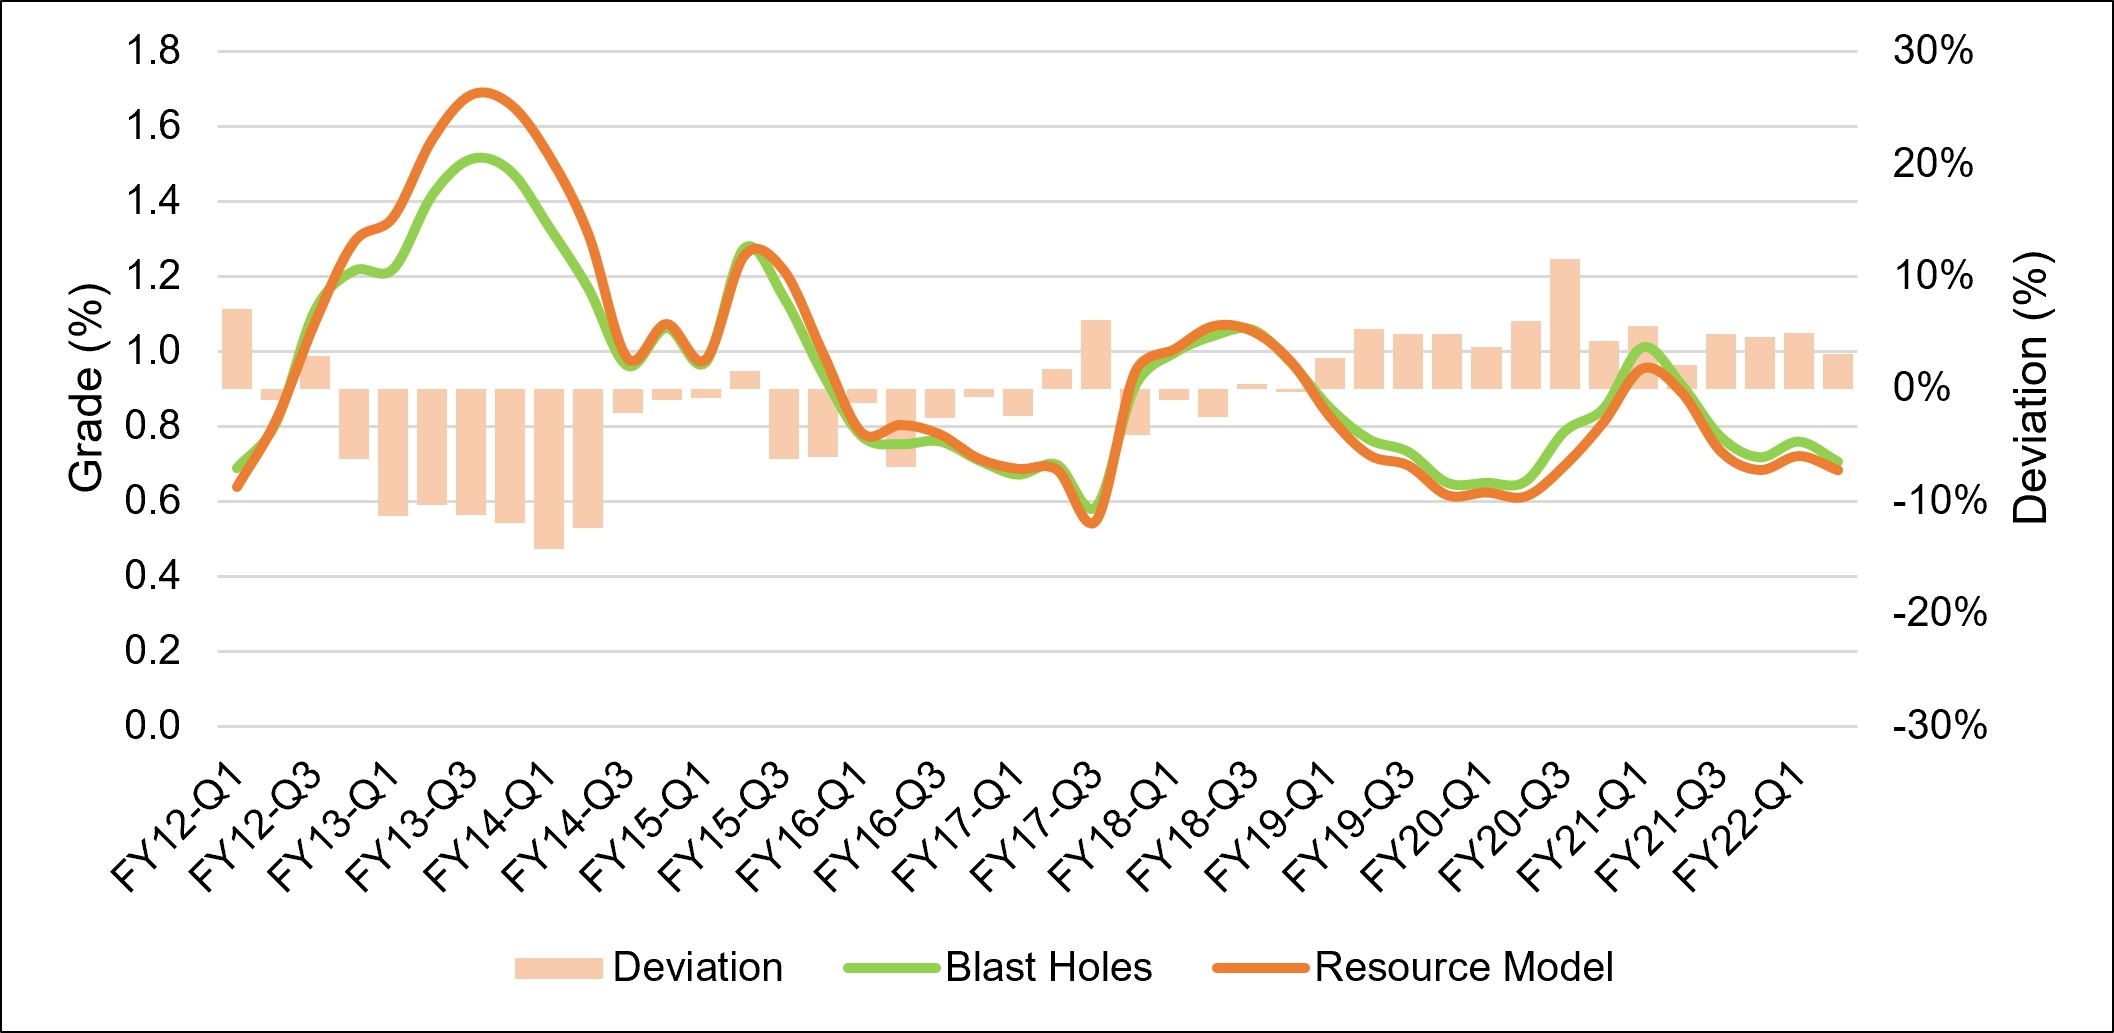
Source: MEL (2022)
|
|
Figure 11-22: |
Total Copper Grade Reconciliation, Sulphide Escondida Norte |
Figure 11‑23 shows in-situ copper for quarterly periods with an unbiased performance with periods of underestimation and overestimation within a range of ±7%.
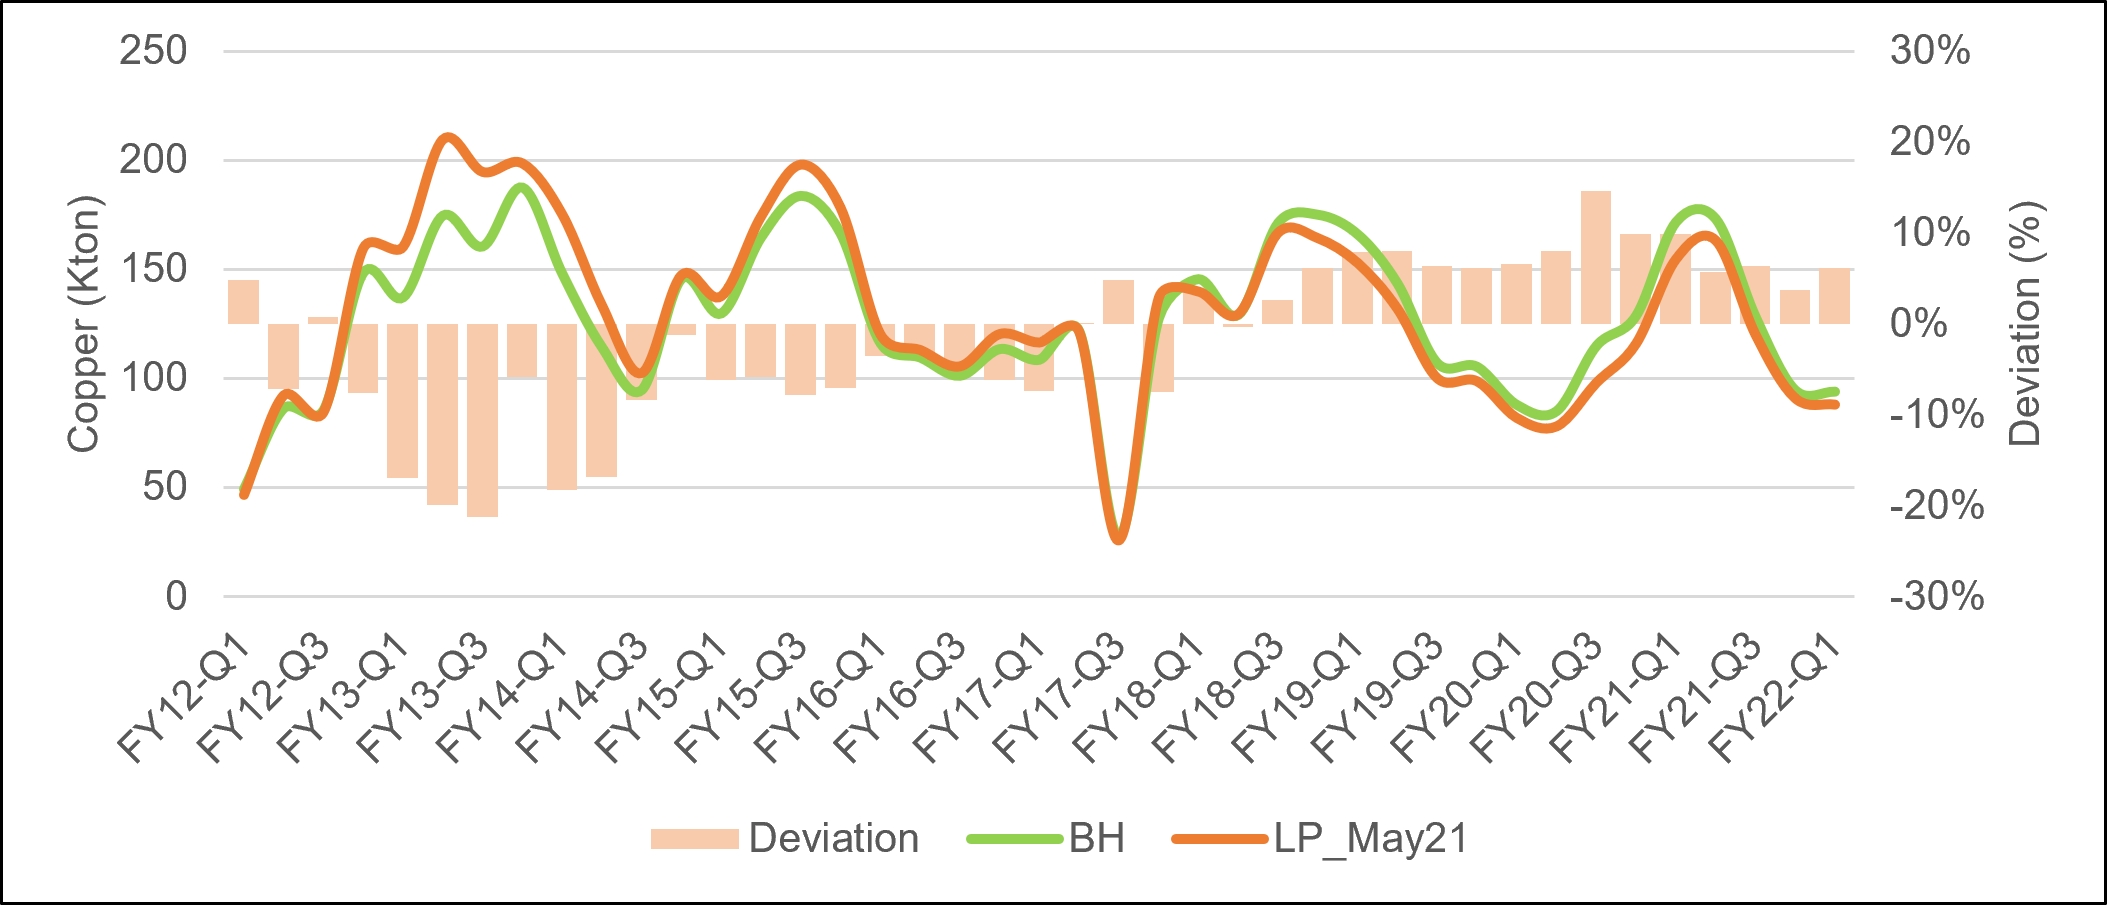
Source: MEL (2022)
|
|
Figure 11-23: |
In-situ Metal Reconciliation, Sulphide Escondida Norte |
It is the opinion of the QP that the results of the reconciliation with deviations of less than 10% per quarter for tonnage, grade and in-situ metal, are acceptable for a model designed on an annual basis.
|
|
|
|
MEL_TRS_June 2022_Mike |
June 2022 |
|
|
SEC Technical Report Summary – Minera Escondida Limitada |
Page 131 |
11.5.Cut-Off Grades Estimates
The 2022 mineral resources statement is based on the determination of mineable mineralisation suitable for processing under the assumptions that provide the framework for the Escondida life of asset plan (LoA) completed in November 2021 for June 2022 reporting (LoA23). The statement combines mineral resources from the Escondida and Escondida Norte deposits and is tabulated from volumes contained in the unsmoothed and optimised pit using the Learch Grossman algorithm determined using the May21 Resource models, LOA23 mining and processing costs. The price was calculated for 3-year historic monthly third quartile: high-price: 3.04 US$/lb.
Chapter 16 contains the full analysis of the copper commodity price in which discussion of the validity of the commodity prices employed is presented. In the opinion of the QP for resources the selected price for resources is considered reasonable. The QP is of the opinion that the use of three calendar year mean of historic monthly third quartile to define mineral resources is considered appropriate as they are factual, objective, and transparent to the market.
|
|
Table 11-22: |
Cut-off Economic Inputs for Mineral Resources |
|
|
|
Description |
Units |
Value |
Mining - Base Cost |
$/t material moved |
0.87 |
Mining - Haulage Cost |
|
Variable |
Mining Loss |
% |
0 |
Mining Dilution |
% |
0 |
Ore Processing Cost - Milled Ore |
$/t Ore Processed |
7.10 |
Ore Processing Cost - Sulphide Bio Leach Ore |
$/t Ore Processed |
1.31 |
Ore Processing Cost - Acid Leached Oxide Ore |
$/t Ore Processed |
7.98 |
Metallurgical Recovery - Milled Ore |
% |
83 |
Metallurgical Recovery - Sulphide Bio Leach Ore |
% |
42 |
Metallurgical Recovery - Acid Leached Oxide Ore |
% |
62 |
Payable Cu - Milled Ore |
% |
96.65 |
Payable Cu - Sulphide Bio Leach Ore |
% |
100 |
Payable Cu - Acid Leached Oxide Ore |
% |
100 |
Cu Price |
US$ / lb |
3.04 |
Note: The sole purpose of the presented information above is to demonstrate the economic viability of the mineral reserves for the purposes of reporting in accordance with S-K 1300 only and should not be used for other purposes. The annual cash flow data was prepared based upon Pre-Feasibility-level studies and three year historical prices and costs described in this Technical Report Summary; it is subject to change as assumptions and inputs are updated. The information presented does not guarantee future financial or operational performance. The presented information contains forward-looking statements. Please refer to "Note Regarding Forward Looking Statements" at the front of this Technical Report Summary.
Source: MEL (2022)
The cut-off for mineral resources estimation is based on applying all applicable costs as summarised in Table 11‑22. .
The cut-off grade for Escondida and Escondida Norte was defined based on the material type and all applied costs and recovery:
•Sulphides: Cut-off grade is 0.25% TCu if chalcopyrite is less than 70% and 0.3% TCu if chalcopyrite is greater than 70%.
•Mixed: Cut-off grade was 0.30% TCu.
•Oxides: Cut-off grade is 0.20% SCu.
Table 11‑23 shows the different cut-off grades for mineral type at Escondida and Escondida Norte.
|
|
|
|
MEL_TRS_June 2022_Mike |
June 2022 |
|
|
SEC Technical Report Summary – Minera Escondida Limitada |
Page 132 |
|
|
Table 11-23: |
Mineral Zone Definition Criteria |
|
|
Mineralisation Zone |
Cut-off |
Oxide |
SCu >= 0.2% |
Mixed |
TCu <= 0.3% |
Sulphide |
TCu >= 0.25% & chalcopyrite < 70% |
Sulphide |
TCu >= 0.30% & chalcopyrite >= 70% |
Source: MEL (2022)
These cut-off grades were based on a break-even economic analysis, considering a low degree of confidence in the metallurgical test work of the low-grade material. Cost assumptions are determined as part of an annual planning cycle that is used to estimate the asset life production plan and subsequently the published ore reserves. These assumptions are described in Section 12.3.
11.6.Reasonable Prospects for Economic Extraction
Mineral resource estimates may be materially affected by the metallurgical recovery and the accuracy of the economic assumptions supporting Reasonable Prospects for Economic Extraction (RPEE) including metal prices, and mining and processing costs. The mineral resources presented are contained in a pit optimisation definition.
A nested pit analysis was performed on the geologic model using the three processing routes and the economic cut-offs described in Section 11.5. Additional optimisation parameters are shown in Table 12‑5. The assumptions used for mineral resources and mineral reserves are the same, only the price change to the high-price: 3.04 US$/lb for mineral resources.
BHP constrained the statement of mineral resources to within an optimised pit shell produced in Whittle using the internal LG algorithm calculations. The optimised pit is designed to consider the ability of the “ore” tonnes to pay for the “waste” tonnes based on the input economics. The result is a surface or volume which constrains the resource but provides the RPEE at the mineral resources pricing revenue factor while utilising the current mineral reserves pricing for overall inputs. Pit optimisation inputs are noted as follows:
•Reserve based copper price of US$3.04/lb (delivered to client smelter)
•Revenue Factor of 1.00 = US$3.04/lb Cu pricing (delivered to client smelter)
•10% premium to mineral reserves price and comparable with US$3.04/lb mineral resources price (delivered to client smelter).
•Variable metallurgical recovery by different rock type and processing route (see Chapter 14)
•Pit slope (variable pit wall angles)
•0% mining dilution, 100% mining recovery
•Operating cost structure as seen in Table 11‑22
The resource pit is then used as a reporting limit to exclude all tonnes from reporting which sit external to this pit shape. MEL notes that the mineral reserves (Section 12.2) is constrained by a reserve pit. This reserve pit generally sits within the resource pit, although it locally extends beyond the limits of the resource pit due to design constraints such as ramps. MEL also notes that the optimised pit for resource reporting is not limited by boundaries for mining infrastructure, and that no capital costs for movement or replacement of this infrastructure are assumed.
|
|
|
|
MEL_TRS_June 2022_Mike |
June 2022 |
|
|
SEC Technical Report Summary – Minera Escondida Limitada |
Page 133 |
11.7.Resource Classification and Criteria
MEL has used conditional simulation models since 2007 as part of the mineral resources classification process. This methodology allows the inclusion of the following elements in the classification of mineral resources:
•Density and spatial location of the information (conditional data)
•Geological continuity (geological features that have been simulated)
•Grade continuity (grade distribution that has been simulated)
The uncertainty associated with drilling, sampling, chemical analysis, and geological mapping is controlled in the QA/QC plan explained in chapter 8, and the resulting database used as input for the resources classification, complies with this procedure. Conditional simulation allows the development of an uncertainty model to quantify the copper grade estimation uncertainty for monthly production volumes. The process used can be summarised as:
•Perform conditional simulation models, for Geology and copper grade in a fine grid (5 x 5 x15 m).
•Re-block simulation models at SMU size (25 x 25 x15 m).
•Post process simulated grades to account for change of support, from a single SMU to monthly panel
•Uncertainty model calculation
•Threshold definition to produce preliminary resource classification
•Classification adjusted according to the local drilling pattern
•Mathematical smoothing using MAPS algorithm from CCG Alberta
•Final review, checks, and validations
For the FY21 Resource models, which are internally known as MLP22 and being those employed for the June 2022 declarations, the mineral resources categories are defined as follows:
•Measured Resource: Material which provides a prediction of the tonnes of recovered or saleable copper and grade with an accuracy of ± 10% on an annual basis and ± 15% on a quarterly basis with 95% confidence (for the mining method used at the planned capacity and at the planned cut-off grade).
•Indicated Resource: Material which provides a prediction of the tonnes of recovered or saleable copper and grade with an accuracy of ± 15% on an annual basis with 95% confidence (for the mining method used at the planned capacity and at the planned cut-off grade).
•Inferred Resource: Material which provides a prediction of the tonnes of recovered or saleable copper and grade with an accuracy of ± 25% on an annual basis with 95% confidence (for the mining method used at the planned capacity and at the planned cut-off grade).
Scaling factors for change of support between Quarterly and Monthly deviations were defined to adjust mineral resources classification criteria in order to comply with internal guidelines. These factors were applied to define measured and indicated categories. The reduction factor in deviations was applied as the uncertainty reduction factor and in this way the guideline was directly used to define thresholds in the uncertainty model to produce different resource categories. The uncertainty model was updated to 95% of probability instead of 90% used in previous version; Table 11‑24 shows the uncertainty threshold for each kind of mineralisation.
|
|
|
|
MEL_TRS_June 2022_Mike |
June 2022 |
|
|
SEC Technical Report Summary – Minera Escondida Limitada |
Page 134 |
Table 11-24: Uncertainty Thresholds by Mineralisation
|
|
|
|
Category |
Internal threshold |
Uncertainty threshold for Sulphide |
Uncertainty threshold for Oxide |
Measured |
±15% Quarterly @ 95% confidence ±10% Annually @ 95% confidence |
Uncertainty (95%) ≤ 20% |
Uncertainty (95%) ≤ 30% |
Indicated |
±15% Annually @ 95% confidence |
20% < Uncertainty (95%) ≤ 30% |
30% < Uncertainty (95%) ≤ 45% |
Inferred |
±25% Annually @ 95% confidence |
Uncertainty (95%) > 30% (Interpolated) |
Uncertainty (95%) > 45% (Interpolated) |
Source: MEL (2022)
The thresholds were validated with historical reconciliations of the feed materials presented in figures 11-27 and 11-28. In the opinion of the QP, uncertainty thresholds used for mineral resources classification are adequate for a porphyry copper deposit, given the level of information and the extraction volume defined. Figure 11‑24 shows the spatial configuration and drill hole arrangement for Escondida (left) and Escondida Norte (right).
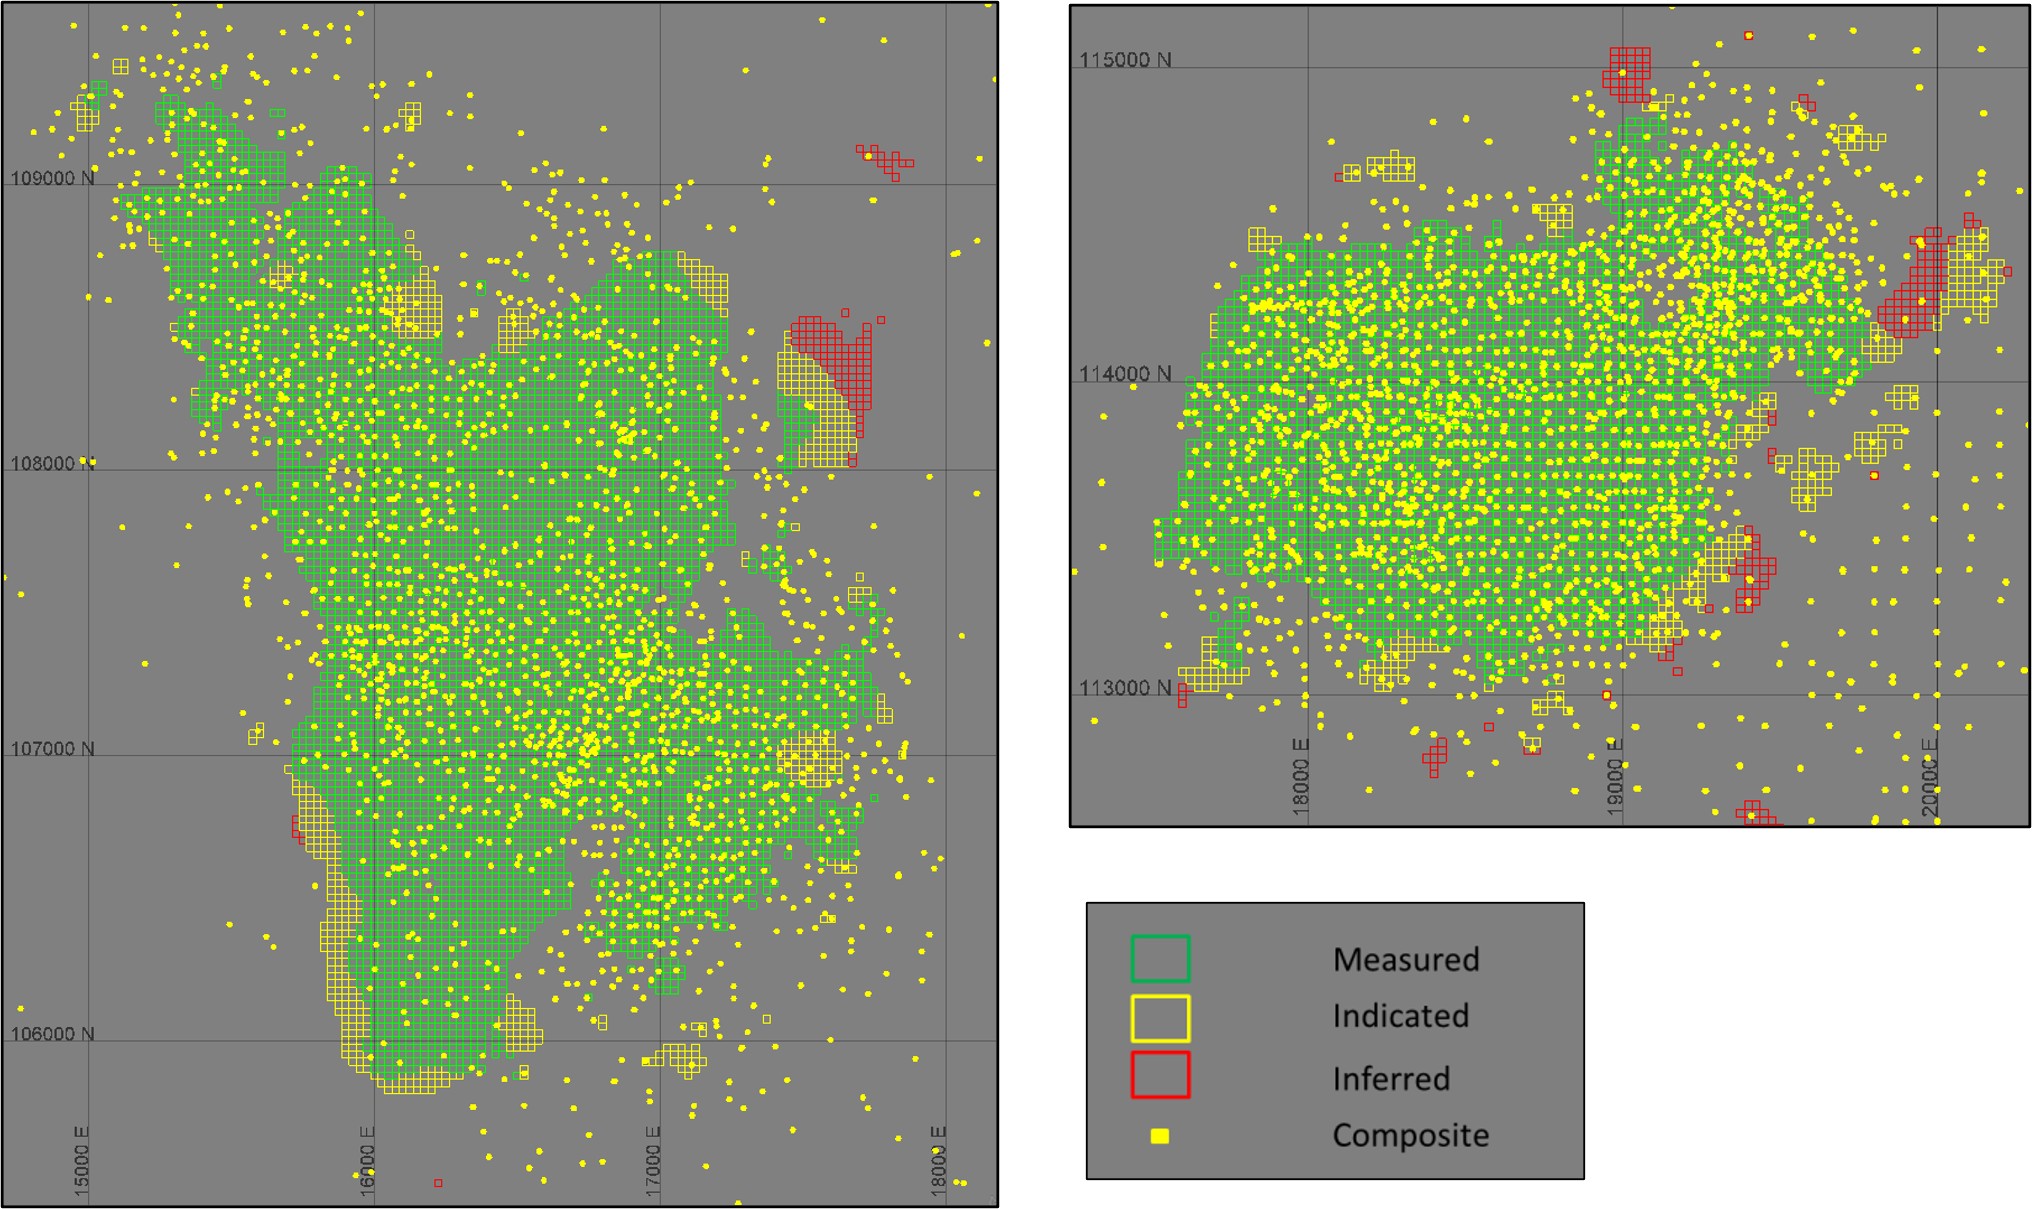
Source: MEL (2022)
Figure 11‑24: Mineral Resources Classification and Data Density
Although MEL mineral resources classification methodology does not use a specific drilling pattern to define the different categories it is possible to calculate a nominal drilling pattern according to the commonly used formula in the industry:

|
|
|
|
MEL_TRS_June 2022_Mike |
June 2022 |
|
|
SEC Technical Report Summary – Minera Escondida Limitada |
Page 135 |
Table 11‑25 shows the nominal drilling pattern calculated for each one of the resource categories.
Table 11‑25: Nominal Drilling Pattern
|
|
|
|
Category |
Oxide |
Mixed |
Sulphide |
Measured (mean) |
40 x 40 m |
45 x 45 m |
60 x 60 m |
Indicated (mean) |
60 x 60 m |
75 x 75 m |
150 x 150 m |
Inferred (maximum) |
90 x 90 m |
100 x 100 m |
320 x 320 m |
Source: MEL (2022)
Mineral resources are not mineral reserves and do not necessarily demonstrate economic viability. There is no certainty that all or any part of these mineral resources will be converted into mineral reserves.
Inferred mineral resources are too speculative geologically to have economic considerations applied to them to enable them to be categorised as mineral reserves.
Mineral resources estimates may be materially affected by the quality of data, natural geological variability of mineralisation and / or metallurgical recovery and the accuracy of the economic assumptions supporting reasonable prospects for economic extraction including metal prices, and mining and processing costs.
Mineral resources may also be affected by the estimation methodology and parameters and assumptions used in the grade estimation process including top-cutting (capping) of data or search and estimation strategies although it is the QP’s opinion that there is a low likelihood of this having a material impact on Figure 11‑25 and Figure 11‑26 show the mineral resources distribution by category for sulphide mineral mined during the last 10 years, showing that the majority corresponds to measured resources.
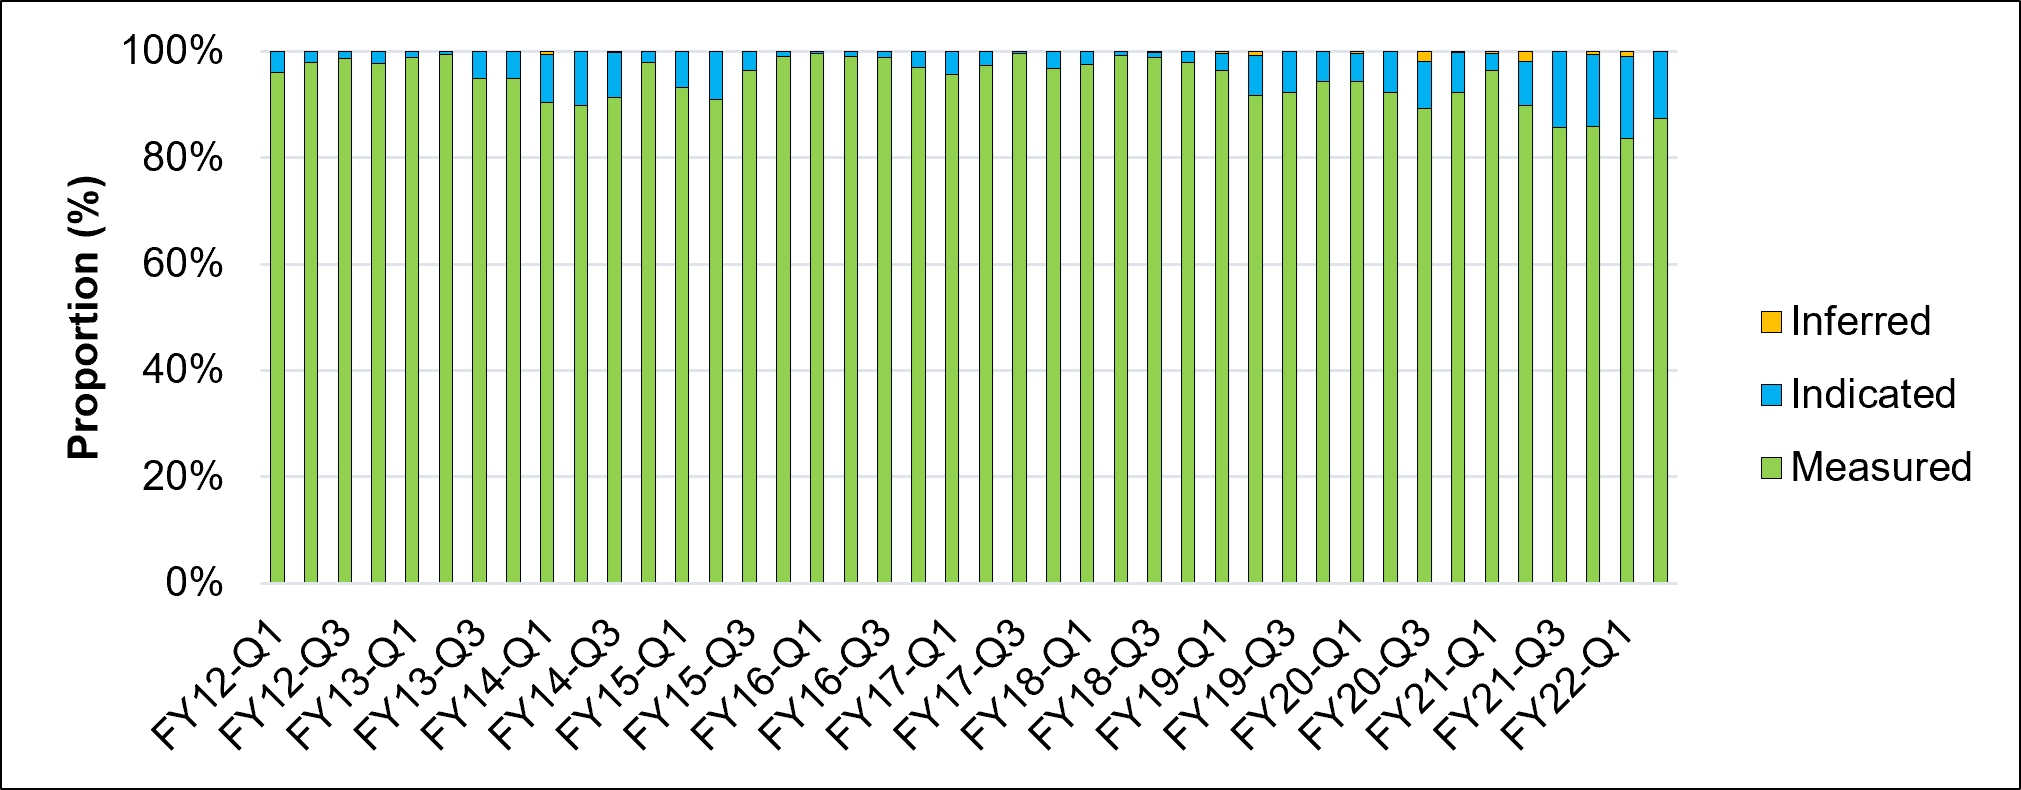
Source: MEL (2022)
Figure 11‑25: Mined Sulphide Material by Mineral Resources Category, FY12 to FY22, Escondida
|
|
|
|
MEL_TRS_June 2022_Mike |
June 2022 |
|
|
SEC Technical Report Summary – Minera Escondida Limitada |
Page 136 |
Source: MEL (2022)
Figure 11‑26: Mined Sulphide Material by Mineral Resources Category, FY12 to FY22, Escondida Norte
Figure 11‑27 shows Escondida annually and quarterly deviation for tonnage, grade and in-situ copper. There is one annual period were the in-situ copper deviation is outside of accepted limit with 8% underestimation. Considering quarterly periods, FY13-Q1, FY-15-Q2 and FY-19-Q3 period shows in-situ copper deviation outside of the guideline used to define the measured category.
For the Escondida Norte case, Figure 11‑28 only FY13 in-situ copper deviation outside of the guideline used to define the measured category shows there were no deviations outside of the limits used to define measured category.
Based on the previous analysis, there is a high effectiveness of the measured Resource in adhering to its current definitions used during the resource classification process.
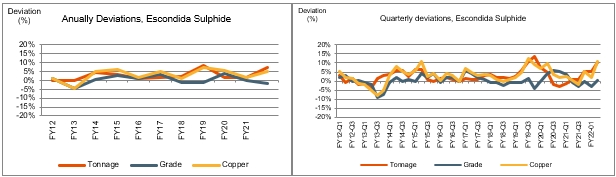
Source: MEL (2022)
Figure 11‑27: Escondida Sulphide Annual and Quarterly Deviations
|
|
|
|
MEL_TRS_June 2022_Mike |
June 2022 |
|
|
SEC Technical Report Summary – Minera Escondida Limitada |
Page 137 |
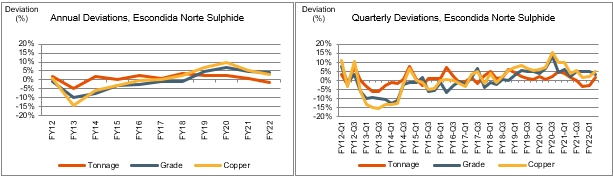
Source: MEL (2022)
Figure 11‑28: Escondida Norte Annual and Quarterly Deviations
Figure 11‑29 shows the mineral resources classification proportions and the total mined ore for the Oxide and Mixed ore for the last 10 years. There were certain periods in which the measured resource exceeds 80%, decreasing the ability to quantify the effectiveness for measured category to produce estimation errors inside of the guidance used during the mineral resources classification process.
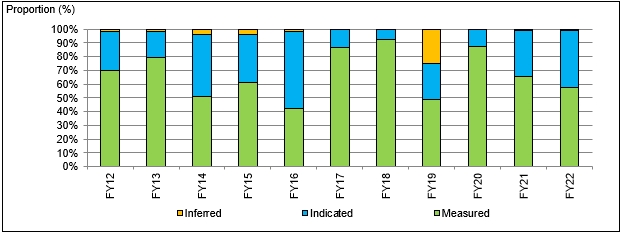
Source: MEL internal geology document. (2022)
Figure 11‑29: Mined Oxide and Mixed Material by Mineral Resources Category, FY12 to FY22, Escondida Norte
11.9.Mineral Resources Statement
The mineral resources statement is generated and summarised in accordance the SEC S-K 1300 Regulations. The tables are presented as follows:
•Mineral Resources Exclusive of Mineral Reserves corresponding to BHP’s 57.7% ownership (Table 11‑26);
•Mineral Resources Inclusive of Mineral Reserves corresponding to BHP’s 57.5% ownership (Table 11‑27);
The mineral resources Statement reflects BHP’s ownership of the Escondida property through Minera Escondida Limitada as at June 30, 2022. This statement includes the Escondida and Escondida Norte deposits combined. The tables present a breakdown of the mineral resources by classification and material type, presenting on both an exclusive (of those mineral resources that have been converted to mineral reserves) and an inclusive basis.
|
|
|
|
MEL_TRS_June 2022_Mike |
June 2022 |
|
|
SEC Technical Report Summary – Minera Escondida Limitada |
Page 138 |
Table 11‑26: Escondida Property BHP Ownership Basis (57.5%) – Summary of Mineral Resources Exclusive of Mineral Reserves as of 30th June 2022
|
|
|
|
|
|
|
|
|
|
Copper Chile Escondida |
Mining Method |
Measured Resources |
Indicated Resources |
Measured + Indicated Resources |
Inferred Resources |
Tonnage |
Quality |
Tonnage |
Quality |
Tonnage |
Quality |
Tonnage |
Quality |
Mt |
%Cu |
Mt |
%Cu |
Mt |
%Cu |
Mt |
%Cu |
Oxide |
OC |
4.0 |
0.48 |
5.0 |
0.47 |
9.0 |
0.48 |
2.0 |
0.75 |
Mixed |
OC |
4.0 |
0.53 |
9.0 |
0.44 |
13 |
0.47 |
11 |
0.49 |
Sulphide |
OC |
596 |
0.49 |
1,020 |
0.49 |
1,620 |
0.49 |
5,370 |
0.53 |
Escondida Total |
|
604 |
0.49 |
1,030 |
0.49 |
1,640 |
0.49 |
5,380 |
0.53 |
Notes:
1.The sole purpose of the presented information above is to demonstrate the economic viability of the mineral reserves for the purposes of reporting in accordance with S-K 1300 only and should not be used for other purposes. The annual cash flow data was prepared based upon Pre-Feasibility-level studies and three year historical prices and costs described in this Technical Report Summary; it is subject to change as assumptions and inputs are updated. The information presented does not guarantee future financial or operational performance. The presented information contains forward-looking statements. Please refer to "Note Regarding Forward Looking Statements" at the front of this Technical Report Summary.
2.Mineral resources are being first time reported in accordance with S-K 1300 and are presented for the portion attributable to BHP's economic interest. All tonnes and quality information have been rounded, small differences may be present in the totals.
3.Mineral resources are presented exclusive of mineral reserves.
4.Escondida, in which BHP has a 57.5% interest, is considered a material property for purposes of Item 1303 of S-K 1300.
5.Escondida point of reference for the mineral resources was mine gate.
6.Escondida mineral resources estimates were based on a copper price of US$3.04/lb.
7.Escondida mineral resources cut-off criteria used was Oxide ≥ 0.20% soluble Cu; Mixed ≥ 0.30% Cu; Sulphide ≥ 0.25% Cu for mineralisation assigned to be processed via leaching or ≥ 0.30% Cu for mineralisation assigned to be processed via the concentrator.
8.Escondida metallurgical recoveries for Oxide 62%; Mixed 42%; Sulphide 42% for material processed by leaching or 83% for material processed via the concentrator.
Table 11‑27: Escondida Property BHP Ownership Basis (57.5%) – Summary of Mineral Resources Inclusive of Mineral Reserves as of 30th June 2022
|
|
|
|
|
|
|
|
|
|
Copper Chile Escondida |
Mining Method |
Measured Resources |
Indicated Resources |
Measured + Indicated Resources |
Inferred Resources |
Tonnage |
Quality |
Tonnage |
Quality |
Tonnage |
Quality |
Tonnage |
Quality |
Mt |
%Cu |
Mt |
%Cu |
Mt |
%Cu |
Mt |
%Cu |
Oxide |
OC |
49 |
0.59 |
18 |
0.53 |
67 |
0.57 |
2.0 |
0.75 |
Mixed |
OC |
34 |
0.52 |
28 |
0.47 |
61 |
0.50 |
11 |
0.49 |
Sulphide |
OC |
2,910 |
0.59 |
2,160 |
0.51 |
5,070 |
0.56 |
5,370 |
0.53 |
Escondida Total |
|
2,990 |
0.59 |
2,210 |
0.51 |
5,200 |
0.56 |
5,380 |
0.53 |
Notes:
1.The sole purpose of the presented information above is to demonstrate the economic viability of the mineral reserves for the purposes of reporting in accordance with S-K 1300 only and should not be used for other purposes. The annual cash flow data was prepared based upon Pre-Feasibility-level studies and three year historical prices and costs described in this Technical Report Summary; it is subject to change as assumptions and inputs are updated. The information presented does not guarantee future financial or operational performance. The presented information contains forward-looking statements. Please refer to "Note Regarding Forward Looking Statements" at the front of this Technical Report Summary.
2.Mineral resources are being first time reported in accordance with S-K 1300 and are presented for the portion attributable to BHP's economic interest. All tonnes and quality information have been rounded, small differences may be present in the totals.
3.Mineral resources are presented exclusive of mineral reserves.
4.Escondida, in which BHP has a 57.5% interest, is considered a material property for purposes of Item 1303 of S-K 1300.
5.Escondida point of reference for the mineral resources was mine gate.
6.Escondida mineral resources estimates were based on a copper price of US$3.04/lb.
7.Escondida mineral resources cut-off criteria used was Oxide ≥ 0.20% soluble Cu; Mixed ≥ 0.30% Cu; Sulphide ≥ 0.25% Cu for mineralisation assigned to be processed via leaching or ≥ 0.30% Cu for mineralisation assigned to be processed via the concentrator.
8.Escondida metallurgical recoveries for Oxide 62%; Mixed 42%; Sulphide 42% for material processed by leaching or 83% for material processed via the concentrator.
11.10.Discussion of Relative Accuracy/Confidence
In the QP’s opinion, the relative accuracy, and therefore, confidence of the mineral resources estimates are deemed appropriate for their intended purpose of global mineral resources reporting and medium to long term mine planning studies. The factors influencing the accuracy and confidence, as stated in Section 11.7 are taken into consideration during classification of the model; and therefore, are addressed by the QP in the attributed mineral resources classification.
|
|
|
|
MEL_TRS_June 2022_Mike |
June 2022 |
|
|
SEC Technical Report Summary – Minera Escondida Limitada |
Page 139 |
Mineral resources are not mineral reserves and do not necessarily demonstrate economic viability. There is no certainty that all, or any part, of this mineral resources will be converted into mineral reserves.
Inferred mineral resources are too speculative geologically to have economic considerations applied to them to enable them to be categorised as mineral reserves.
Mineral resources estimates may be materially affected by the quality of data, natural geological variability of mineralisation and/or metallurgical recovery and the accuracy of the economic assumptions supporting reasonable prospects for economic extraction including metal prices, and mining and processing costs.
11.11.Opinion on Influence for Economic Extraction
The QP is of the opinion that, with the recommendations and opportunities outlined in Section 23.1 (Recommended Work Programmes), any issues relating to all applicable technical and economic factors likely to influence the prospect of economic extraction can be resolved with further work.
12.Mineral Reserves Estimate
12.1.Key Assumptions, Parameters, and Methods
MEL is a mature open pit operation with more than 30 years of operation. To generate a mineral reserves, we utilize the measured and indicated components of the mineral resources estimates and apply additional modifying factors to produce a mine plan which MEL uses as the basis of a mineral reserves declaration. Modifying factors include mining parameters, geological and geotechnical models, costs, and revenue.
Estimating the mineral reserves at MEL is part of an annual process that aims to optimise a large scale and complex operation comprising of three process routes (Concentrator, Sulphide, and Oxide Leaching), which are fed from two active pits. Each process route presents different copper grades, geo-metallurgical characteristics, and mining constraints. The overall process of Reserve development is provided graphically below in Figure 12‑1.

Figure 12‑1: MEL Process for Mineral Reserves Estimation
Maps presented in this chapter use local mine coordinates derived from the PSAD-56 UTM projection.
The subsections below describe the ore Reserve estimation process.
12.1.1.Geologic Resource and Mining Models
The dimensions of the block model are shown in Table 12‑1 for the Escondida Norte pit, and Table 12‑2 for the Escondida pit. The principal variables of the block model used for mineral reserves are shown in Table 12‑3.
Table 12‑1: Block Model Dimensions – Escondida Norte Pit
|
|
|
|
|
Dimension |
Minimum |
Maximum |
Block Size (m) |
No. of Blocks |
X |
0 |
5,400 |
25 |
216 |
Y |
0 |
5,450 |
25 |
218 |
Z |
0 |
1,650 |
15 |
110 |
Source: MEL (2022)
|
|
|
|
MEL_TRS_June 2022_Mike |
June 2022 |
|
|
SEC Technical Report Summary – Minera Escondida Limitada |
Page 140 |
Table 12‑2: Block Model Dimensions – Escondida Pit
|
|
|
|
|
Dimension |
Minimum |
Maximum |
Block Size (m) |
No. of Blocks |
X |
0 |
7,400 |
25 |
296 |
Y |
0 |
10,400 |
25 |
416 |
Z |
0 |
2,160 |
15 |
144 |
Source: MEL (2022)
Table 12‑3: Principal Variables of the Block Model
|
|
Variable |
Description |
TCu |
Total Copper (%) |
SCu |
Soluble copper (%) |
Au |
Gold (%) |
Ag |
Silver (%) |
densidad |
Dry Density |
bwi |
Bond Work Index (Kwh/ton) |
spi |
Sag Power Index (min) |
rec_flc |
Flotation recovery for Los Colorados concentrator (%) |
rec_fls1 |
Flotation recovery for Laguna Seca Line 1 concentrator (%) |
rec_fls2 |
Flotation recovery for Laguna Seca Line 2 concentrator (%) |
rec_lixaci |
Acid leach recovery (%) |
rec_sl_350 |
Sulphide leach recovery (%) |
Categ_Rec |
Resource category |
Source: MEL (2022)
MEL reports using financial years that start on 1st July and end the next year on 30th June of each year. The model starts on the 1st July 2022 (start of the FY23 financial year). The estimated depletion was based off the CY2021 May Forecast which includes approximately 12 months of forecasted movement. In the opinion of the QP any difference between the planned and actual start surface is not material.
A Mining Model was created from the Geologic Resource Model by applying dilution and mining recovery factors of 0% and 0% respectively. See Section 13.3.4 for further discussion.
The Escondida pit falls completely within the MEL property limits.
The Escondida Norte pit shares a lease boundary with Compañía Minera Zaldivar (CMZ), this is a mine that is operated by Antofagasta Minerals. The shared boundary impacts Pushback N12, N10 and N14. All material in the CMZ lease is considered as waste when developing the optimal pit designs.
|
|
|
|
MEL_TRS_June 2022_Mike |
June 2022 |
|
|
SEC Technical Report Summary – Minera Escondida Limitada |
Page 141 |
CMZ and MEL have historic agreements in place with regards to CMZ accessing areas that fall within the MEL property, as well as MEL gaining access to portions of the Escondida Norte pit that fall within the CMZ mine property.
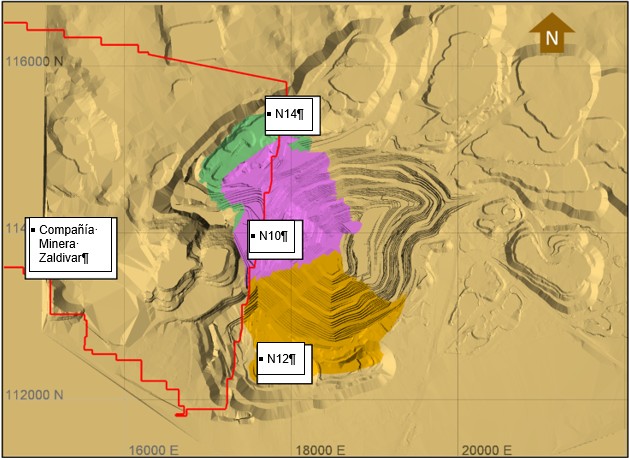
Source: MEL (2022)
Figure 12‑2: Escondida Norte Pit and the Compañía Minera Zaldivar Lease Boundary
12.2.2.Project Constraints
The mining project boundary isn’t limited by existing infrastructure; however, there are several projects that enable the final boundary to be reached.
•Los Colorado Concentrator Removal
•Hamburgo Tailings Removal
Los Colorado Concentrator Demolition
The Los Colorado Concentrator is the original concentrator at MEL. As the pit has expanded this concentrator is required to be removed to access the ore underneath it. In the SEC mine plan, the final year of operation for this concentrator is FY27. A replacement of this concentrator is not included in this plan, however concentrators Laguna Seca Lines 1 and 2 are expected to continue to operate. Once removed access into PL2s/PL2n and subsequent pushbacks is available.
|
|
|
|
MEL_TRS_June 2022_Mike |
June 2022 |
|
|
SEC Technical Report Summary – Minera Escondida Limitada |
Page 142 |
Truck Shop Removal
The current Truck Shop where the maintenance of the trucks is carried out it located adjacent to the Los Colorado Concentrator and must be removed to access the ore underneath it. Once removed access into PL2s and subsequent pushbacks is available. A new truck shop is planned to replace the one that has been removed.
Hamburgo Tailings Removal
The Hamburgo tailings deposit is located at the southeast end of the Escondida pit. It is required to be removed to access the pushbacks E8 and PL5s, PL6s, PL7s. E8 is the initial pushback that is enabled from the removal of the Tailings, and this pushback is planned for FY50.
Material is mined from two open pits; Escondida and Escondida Norte, using truck and shovel mining methods (described in further detail in Chapter 13) and sent to one of three processes (see Figure 12‑3):
•Concentrators (Consisting of three separate concentrators; Los Colorados, Laguna Seca Line 1, Laguna Seca Line 2)
Product is then sent via a pipeline (in the case of concentrators) or sent via railways (in the case of Cathodes) to ports near the city of Antofagasta for export.
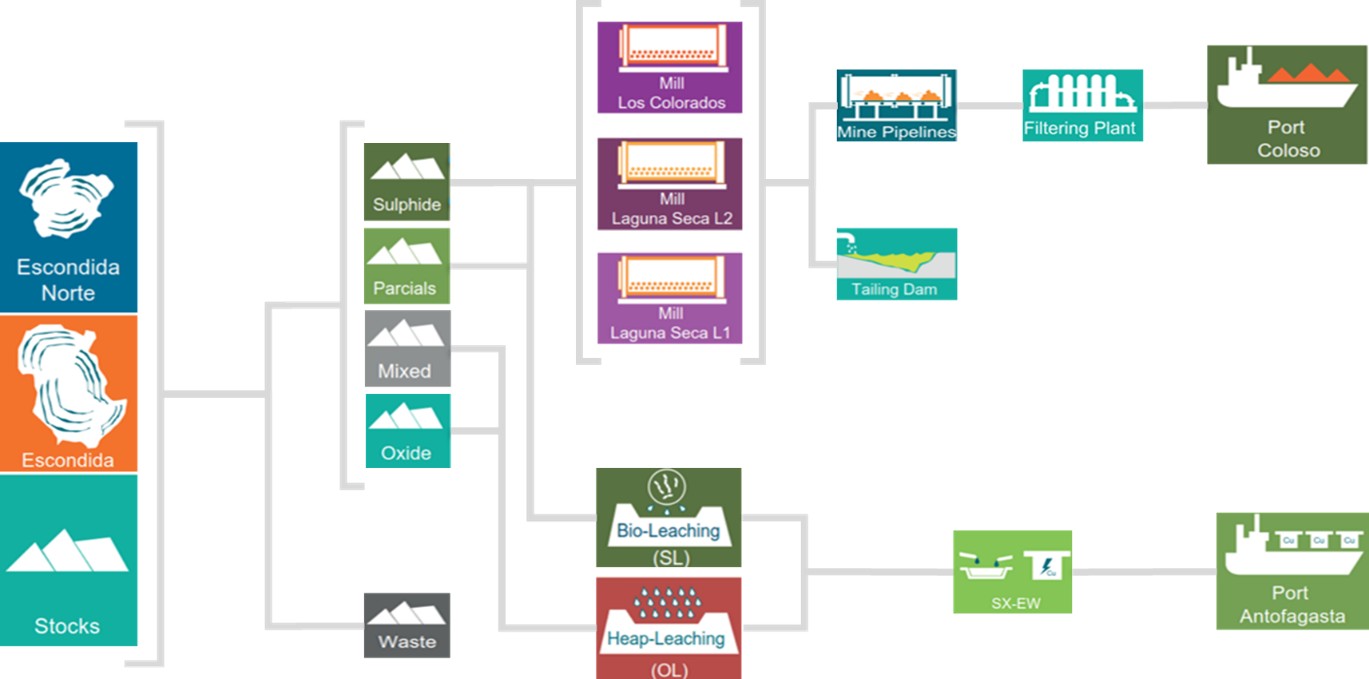
Source: MEL (2022)
Figure 12‑3: Sources and Actual Destination Flowsheet
12.2.4.Commodity Prices Used
The copper price and used for the pit optimisation and economic cut-off analysis was: 2.79 US$/lb.
The historic price of copper since the mid 2000’s has average approximately 3.5 US$/lb. External forecasts project a shortage of copper supply over the next 10 years as demand grows, while supply is forecast to drop from existing mines, resulting in an expected long-term price (2032 onwards) to be above 3.50 US$/lb (real$ 2022), which is higher than the price used in the current reserves estimation process (2.79 US$/lb).
|
|
|
|
MEL_TRS_June 2022_Mike |
June 2022 |
|
|
SEC Technical Report Summary – Minera Escondida Limitada |
Page 143 |
Chapter 16 contains the full analysis of the copper commodity price in which discussion of the validity of the commodity prices employed is presented. In the opinion of the QP for reserves the selected price for reserves is considered reasonable.
12.2.5.Cut-off Grade Estimate
The cut-off grades (COG) used to differentiate waste from mineralised ore are 0.3% of total copper for the Sulphide (concentrator feed) and 0.25% of total Copper and less than 70% of Chalcopyrite for Sulphide Leach (ROM sulphide leach feed) reserves whereas for the Oxide (acid heap leach) feed reserves are reported above 0.2% Acid soluble copper. These cut-off grades are based on economic analysis and assume open-pit extraction and concentrator, ROM or heap leach processing alternatives as per the current operation. Since the material fed to concentrator and sulphide leach processes are sourced from the same ore body, MEL employed a variable cut-off grade (VCOG) to determine the ore destination that provides maximum value.
The cut-off grades are based on copper content only. Material processed through the concentrators also contains gold and silver, from which MEL generates revenue. The gold and silver revenues have been included in the financial model (Chapter 19), however they are excluded from the cut-off grade calculation. This is considered to be a relatively conservative method of applying the cut-off.
12.2.6.Cut-off Grade Calculation for Mill
The parameters in Table 12‑4 used to calculate the value of sending the material to the mill. If the value is greater than zero, the material can be considered for processing. In addition, it was considered for processing if it had a solubility index less than 0.8.
Table 12‑4: Copper Concentrator COG Parameters
|
|
|
|
Variable |
Units |
Value |
Additional Information |
Payable metal in concentrate dispatched from site |
% |
96.65 |
|
Mill recovery |
% |
83 |
Life of Mine (LoM) Average. |
Indicative site costs |
Mining cost |
$/t material moved |
0.87 |
|
Hauling cost |
|
Variable |
|
Mill Processing cost |
$/t of Ore Processed |
7.10 |
|
Mill Selling cost |
$/t of Saleable Cu |
359 |
|
Administration and overheads cost |
$/t of Saleable Cu |
838 |
|
Note: The sole purpose of the presented information above is to demonstrate the economic viability of the mineral reserves for the purposes of reporting in accordance with S-K 1300 only and should not be used for other purposes. The annual cash flow data was prepared based upon Pre-Feasibility-level studies and three year historical prices and costs described in this Technical Report Summary; it is subject to change as assumptions and inputs are updated. The information presented does not guarantee future financial or operational performance. The presented information contains forward-looking statements. Please refer to "Note Regarding Forward Looking Statements" at the front of this Technical Report Summary.
Source: MEL (2022)
The Mill Cut-off Grade (COG) for the Concentrator is shown below:
|
|
Mill CoG= |
(MiningCost + ProcessingCost) |
( SellingPrice - SellingCost) * Recovery * Payability) |
Based on the above equation, the Mill cut-off is 0.23%. The cut-off used to calculate the mineral reserves, is 0.20%. The mill and sulphide bioleaching use the same material for processing, so we use a variable cut-off grade to maximum value between the mill and leaching processes. The minimum cut-off grade is 0.2% and greater than the variable cut-off grade.
|
|
|
|
MEL_TRS_June 2022_Mike |
June 2022 |
|
|
SEC Technical Report Summary – Minera Escondida Limitada |
Page 144 |
12.2.7.Cut-off Grade Calculation for Sulphide Bioleaching Process
The parameters in Table 12‑5 are used to calculate the value of sending the material to the Sulphide Bioleaching. If the value is greater than zero, the material can be considered for processing.
Table 12‑5: Sulphide Bioleaching COG Parameters
|
|
|
|
Variable |
Units |
Value |
Additional Information |
Payable |
% |
100.0 |
|
Leaching recovery |
% |
42 |
Life of Mine (LoM) Average. |
Indicative site costs |
Mining cost |
$/t material moved |
0.87 |
|
Hauling cost |
|
Variable |
|
Processing cost |
$/t of ROM ore |
1.31 |
|
Mill Selling cost |
$/t of Saleable Cu |
441 |
|
Administration and overheads cost |
$/t of Saleable Cu |
838 |
|
Note: The sole purpose of the presented information above is to demonstrate the economic viability of the mineral reserves for the purposes of reporting in accordance with S-K 1300 only and should not be used for other purposes. The annual cash flow data was prepared based upon Pre-Feasibility-level studies and three year historical prices and costs described in this Technical Report Summary; it is subject to change as assumptions and inputs are updated. The information presented does not guarantee future financial or operational performance. The presented information contains forward-looking statements. Please refer to "Note Regarding Forward Looking Statements" at the front of this Technical Report Summary.
Source: MEL (2022)
The Sulphide Bioleaching Cut-off Grade (COG) is shown below:
|
|
Sulphide Bio Leaching CoG= |
(MiningCost+ProcessingCost) |
(SellingPrice-SellingCost)* Recovery*Payability) |
Based on the above equation, the Sulphide Bioleaching Cut-off Grade is 0.21%. The cut-off used to calculate the mineral reserves, is 0.25%.
12.2.8.Cut-off Grade Calculation for Acid Leaching Process
The parameters in Table 12‑6 are used to calculate the value of sending the material to the acid leaching process. If the value is greater than zero, the material can be considered for processing.
Table 12‑6: Acid Leaching COG Parameters
|
|
|
|
Variable |
Units |
Value |
Additional Information |
Payable |
% |
100.0 |
|
Leaching recovery |
% |
62 |
Life of Mine (LoM) Average. |
Indicative site costs |
Mining cost |
$/t material moved |
0.87 |
|
Hauling cost |
|
Variable |
|
Processing cost |
$/t of ROM ore |
7.98 |
|
Mill Selling cost |
$/t of Saleable Cu |
661 |
|
Administration and overheads cost |
$/t of Saleable Cu |
838 |
|
Notes: 1) Selling cost includes solvent extraction-electrowinning and transport.
2) The sole purpose of the presented information above is to demonstrate the economic viability of the mineral reserves for the purposes of reporting in accordance with S-K 1300 only and should not be used for other purposes. The annual cash flow data was prepared based upon Pre-Feasibility-level studies and three year historical prices and costs described in this Technical Report Summary; it is subject to change as assumptions and inputs are updated. The information presented does not guarantee future financial or operational performance. The presented information contains forward-looking statements. Please refer to "Note Regarding Forward Looking Statements" at the front of this Technical Report Summary.
|
|
|
|
MEL_TRS_June 2022_Mike |
June 2022 |
|
|
SEC Technical Report Summary – Minera Escondida Limitada |
Page 145 |
Source: MEL (2022)
The Acid Leaching Cut-off Grade (COG) is shown below:

Based on the above equation, the Acid Bioleaching Cut-off Grade is 0.35%. The cut-off used to calculate the mineral reserves, is 0.35%.
For ore to be routed to the mill in this study, the following criteria had to be met:
•A mineral resource classification of either measured or indicated
•A mill value greater than or equal to zero
•Does not exceed the feed limit which is based on the design and historical data
•Does not exceed the limit of the crushing circuit which is based on rock hardness and the design and historical data of the crushing circuit
•Concentrator metallurgical recovery is based on mineralogical data in the block model and historical performance data
For ore to be routed to the Sulphide bioleaching pad in this study, the following criteria had to be met:
•A mineral resources classification of either measured or indicated
•A leach value greater than or equal to zero
•Less than 70% of Chalcopyrite ore
•Limited by the electrowinning process to 200k tonnes of copper produced per year
For ore to be routed to the Acid Leaching in this study, the following criteria had to be met:
•A mineral resources classification of either measured or indicated
•A leach value greater than or equal to zero
•Clay content does not exceed 17%
•Limited by the electrowinning process to 150,000 t of copper produced per year
A pit optimisation analysis was carried out using Blasor software, an internally developed software programme. The purpose of pit optimisation work is to determine the economic shell that can be mined using open pit methods. The optimum result is to mine as much of the resource as economically possible.
Blasor uses the Lerchs-Grossman algorithm for pit optimisation. It employs a series of geometric assumptions (related to pit slope angles) and economic assumptions (price, recovery, mining, and processing costs) to determine the three-dimensional shape that yields the maximum profit under those assumed conditions. Individual blocks in the model are assigned the net revenue the block generates, from its recoverable copper, after mining processing and smelting costs have been deducted. Waste blocks have a negative value; ore blocks will generally generate positive revenue.
|
|
|
|
MEL_TRS_June 2022_Mike |
June 2022 |
|
|
SEC Technical Report Summary – Minera Escondida Limitada |
Page 146 |
The Lerchs-Grossman algorithm is an industry standard algorithm. The Optimised Reserve pit is defined based on the mineral resources excluding inferred resources. In addition, the historical prices and costs for the past 3 years are used to define the limits for the public reporting of mineral reserves. Pit slope parameters for the pit optimisation were developed as described below with additional detail provided in Section 13.2. The design slopes were adjusted to account for anticipated haul road locations.
Geotechnical evaluation defined different geotechnical parameters for the Escondida and Escondida Norte pit slope designs. Recommendations for geotechnical slope angles are defined in terms of Inter-Ramp Angles (IRA), global angle, bench face angle, width ramp and considerations in terms of height and geometry of design. To reduce the risk associated with the vertical interaction between phases, and to mitigate wall failures between pushbacks, the geotechnical design includes a catch berm (step out) every 10 benches for single benching and a catch berm every five benches for double benching. It is considered good practice to build a containment berm on the crest of the step-out, and if possible, at the toe of the bench face. The minimum height of the parapet wall should be 2m, (1/2 of height wheel of trucks).
A nested pit analysis was performed on the geologic model using the three processing routes and the economic cut-offs described in Section 12.3. Additional optimisation parameters are shown in Table 12‑7.
Table 12‑7: Pit Optimisation Economic Inputs
|
|
|
Description |
Units |
Value |
Mining - Base Cost |
$/t material moved |
0.87 |
Mining - Haulage Cost |
|
Variable |
Mining Loss |
% |
0 |
Mining Dilution |
% |
0 |
Ore Processing Cost - Milled Ore |
$/t Ore Processed |
7.10 |
Ore Processing Cost - Sulphide Bio Leach Ore |
$/t Ore Processed |
1.31 |
Ore Processing Cost - Acid Leached Oxide Ore |
$/t Ore Processed |
7.98 |
Metallurgical Recovery - Milled Ore |
% |
83* |
Metallurgical Recovery - Sulphide Bio Leach Ore |
% |
42* |
Metallurgical Recovery - Acid Leached Oxide Ore |
% |
62* |
Payable Cu - Milled Ore |
% |
96.65 |
Payable Cu - Sulphide Bio Leach Ore |
% |
100 |
Payable Cu - Acid Leached Oxide Ore |
% |
100 |
Cu Price |
US$ / lb |
2.79 |
Notes: 1) * variable recovery curves is applied to each block and material type
2) Note: The sole purpose of the presented information above is to demonstrate the economic viability of the mineral reserves for the purposes of reporting in accordance with S-K 1300 only and should not be used for other purposes. The annual cash flow data was prepared based upon Pre-Feasibility-level studies and three year historical prices and costs described in this Technical Report Summary; it is subject to change as assumptions and inputs are updated. The information presented does not guarantee future financial or operational performance. The presented information contains forward-looking statements. Please refer to "Note Regarding Forward Looking Statements" at the front of this Technical Report Summary.
Source: MEL (2022)
|
|
|
|
MEL_TRS_June 2022_Mike |
June 2022 |
|
|
SEC Technical Report Summary – Minera Escondida Limitada |
Page 147 |
Figure 12‑4 and Figure 12‑5 show how each pit reacts to different Revenue Factors (RF), with a Revenue Factor of 1 corresponding to the copper price outlined in Chapter 16. The selected optimal pits for both Escondida and Escondida Norte are 82 and 72 respectively, which represent RF of 0.92 and 0.82 respectively. These pits correspond to the point where the discounted cash flow starts to flatten out. Pits after the selected point do not add significantly more value.
Ultimate pits were designed for which were based on the selected pit shells the geotechnical design parameters outlined Escondida and Escondida Norte. The final pit designs in the context of the overall mine site are presented in Figure 13‑16 (Chapter 13).
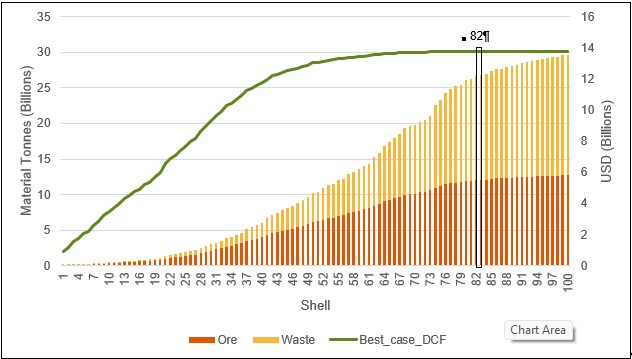
Note: The sole purpose of the presented information above is to demonstrate the economic viability of the mineral reserves for the purposes of reporting in accordance with S-K 1300 only and should not be used for other purposes. The annual cash flow data was prepared based upon Pre-Feasibility-level studies and three year historical prices and costs described in this Technical Report Summary; it is subject to change as assumptions and inputs are updated. The information presented does not guarantee future financial or operational performance. The presented information contains forward-looking statements. Please refer to "Note Regarding Forward Looking Statements" at the front of this Technical Report Summary.
Source: MEL (2022)
Figure 12‑4: Optimal Pit Selection for Escondida Pit
|
|
|
|
MEL_TRS_June 2022_Mike |
June 2022 |
|
|
SEC Technical Report Summary – Minera Escondida Limitada |
Page 148 |
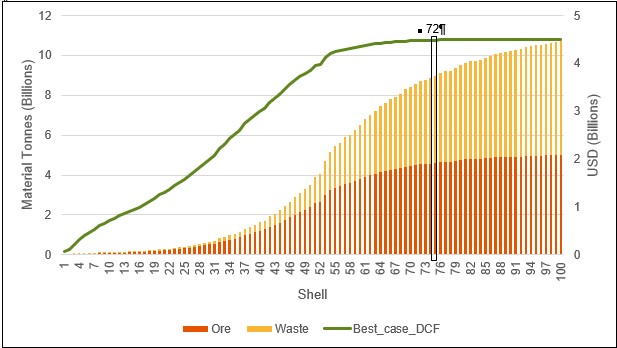
Note: The sole purpose of the presented information above is to demonstrate the economic viability of the mineral reserves for the purposes of reporting in accordance with S-K 1300 only and should not be used for other purposes. The annual cash flow data was prepared based upon Pre-Feasibility-level studies and three year historical prices and costs described in this Technical Report Summary; it is subject to change as assumptions and inputs are updated. The information presented does not guarantee future financial or operational performance. The presented information contains forward-looking statements. Please refer to "Note Regarding Forward Looking Statements" at the front of this Technical Report Summary.
Source: MEL (2022)
Figure 12‑5: Optimal Pit Selection for Escondida Norte Pit
12.3.Mineral Reserves Classification and Criteria
Generally, the approach to classifying mineral reserves is to convert measured mineral resources to proven mineral reserves and Indicated mineral resources to probable mineral reserves based on the modifying factors. MEL has taken this approach for all mineral reserves up until FY50 in the mine plan, with all mineral reserves being classified as probable after this year.
In FY50 MEL is required to renew surface rights and in addition we expect to be approaching the final approved limit of the tailings dam. To raise the tailings dam wall higher a new Environmental Impact Study (EIA) will be required. The Qualified Person has no reason to think either of these rights and approvals will not be obtained; however, given how far in the future they occur, we have chosen out of an abundance of caution to reflect the increased uncertainty by classifying measured mineral resources as probable mineral reserves after FY50.
|
|
|
|
MEL_TRS_June 2022_Mike |
June 2022 |
|
|
SEC Technical Report Summary – Minera Escondida Limitada |
Page 149 |
The mineral reserves by Category can be seen in and Figure 12‑6.
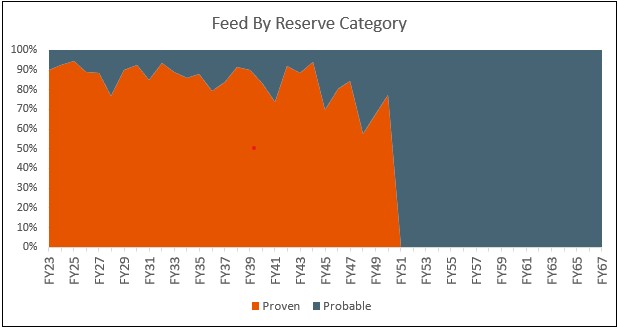
Source: MEL (2022)
Figure 12‑6: Feed by Reserve Category to Process
12.4.Material Risks Associated with the Modifying Factors
The QP has identified the following material risks associated with the modifying factors:
oThe copper price expected for the sale of copper concentrates and cathodes is based on three calendar-year average of historical monthly median values as explained in Chapter 16. There is considerable uncertainty about how future supply and demand will change which will materially impact future copper prices. The reserve estimate is sensitive to the potential significant changes in revenue associated with changes in copper concentrate/cathode prices.
•Mining Dilution and Mining Recovery:
oThe mining dilution estimate depends on the accuracy of the resource model as it relates to internal waste dilution/dikes identification. Due to the spacing of the resource drill holes, it is not possible to identify all of the waste dikes the operation will encounter in the future. If an increased number of waste dikes are found in future mining activities, the dilution may be greater than estimated because there will be more ore blocks in contact with waste blocks. This would potentially introduce more waste into the plant feed, which would decrease the feed grade, slow down the throughput and reduce the metallurgical recovery. A potential mitigation would be to mine more selectively around the waste dikes, although this would result in reduced mining recovery.
•Impact of Currency Exchange Rates on Production Cost
oDifferences in the actual exchange rate compared to the assumed rate in the model could potentially change the mineral reserves estimates.
•Geotechnical Parameters:
Geotechnical parameters used to estimate the mineral reserves can change as mining progresses. Local slope failures could force the operation to adapt to a lower slope angle which would cause the strip ratio to increase and the economics of the pit to change.
|
|
|
|
MEL_TRS_June 2022_Mike |
June 2022 |
|
|
SEC Technical Report Summary – Minera Escondida Limitada |
Page 150 |
•Processing Plant Throughput and Yields:
oThe forecast cost structure assumes that all processing plants remain fully operational and that the estimated recovery assumptions are achieved. If one or more of the plants does not operate in the future, the cost structure of the operation will increase. If the targeted recovery is not achieved, concentrate production will be lower. Both of these outcomes would adversely impact the mineral reserves.
12.5.Mineral Reserves Statement
Based on the modifying factors discussed in this section the mineral reserves is listed in Table 12‑8 on a BHP 57.5% ownership basis.
Table 12‑8: Escondida Property BHP Ownership Basis (57.5%) - Summary of Mineral Reserves as at 30th June 2022
|
|
|
|
|
|
|
|
Copper Chile Escondida |
Mining Method |
Proven Reserves |
Probable Reserves |
Total Reserves |
Tonnage |
Quality |
Tonnage |
Quality |
Tonnage |
Quality |
Mt |
%Cu |
Mt |
%Cu |
Mt |
%Cu |
Oxide |
OC |
75 |
0.57 |
31 |
0.51 |
106 |
0.55 |
Sulphide |
OC |
1,560 |
0.70 |
939 |
0.56 |
2,500 |
0.65 |
Sulphide Leach |
OC |
755 |
0.46 |
197 |
0.40 |
952 |
0.45 |
Escondida Total |
|
2,390 |
0.62 |
1,170 |
0.53 |
3,560 |
0.59 |
Notes:
1.The sole purpose of the presented information above is to demonstrate the economic viability of the mineral reserves for the purposes of reporting in accordance with S-K 1300 only and should not be used for other purposes. The annual cash flow data was prepared based upon Pre-Feasibility-level studies and three year historical prices and costs described in this Technical Report Summary; it is subject to change as assumptions and inputs are updated. The information presented does not guarantee future financial or operational performance. The presented information contains forward-looking statements. Please refer to "Note Regarding Forward Looking Statements" at the front of this Technical Report Summary.
2.Mineral reserves are being first time reported in accordance with S-K 1300 and are presented for the portion attributable to BHP's economic interest. All tonnes and quality information have been rounded, small differences may be present in the totals.
3.Escondida, in which BHP has a 57.5% interest, is considered a material property for purposes of Item 1303 of S-K 1300.
4.Escondida point of reference for the mineral reserves was mine gate.
5.Escondida mineral reserves estimates were based on a copper price of US$2.79/lb.
6.Escondida mineral reserves cut-off criteria used was Oxide ≥ 0.20% soluble Cu. For Sulphide ≥ 0.30% Cu and where greater than the variable cut-off of the concentrator. Sulphide ore is processed in the concentrator plants as a result of an optimised mine plan with consideration of technical and economic parameters in order to maximise net present value. Sulphide Leach ≥ 0.25% Cu and 70% or less of copper contained in chalcopyrite and lower than the variable cut-off grade. Sulphide leach ore is processed in the leaching plant as an alternative to the concentrator process.
7.Escondida metallurgical recoveries for Oxide 62%; Sulphide Leach 42%; Sulphide 42% for material processed by leaching or 83% for material processed via the concentrator.
12.6.Discussion of Relative Accuracy/Confidence
It is the QP’s opinion that the accuracy of the modifying factors are with the plus or minus 25% as defined in the SEC S-K 1300 Regulations for a PFS level study.
13.1.Selected Mining Method
MEL is a mining operation that uses conventional open pit methods to extract mineral reserves containing economic quantities of copper to produce both cathodes and copper concentrates. The mineral reserves are based on the LOM plan which only considers open pit mining.
Maps presented in this chapter use local mine coordinates derived from the PSAD-56 UTM projection.
|
|
|
|
MEL_TRS_June 2022_Mike |
June 2022 |
|
|
SEC Technical Report Summary – Minera Escondida Limitada |
Page 151 |
Since the start of operations at MEL, the mine has operated using an open pit mining method, utilising trucks, and shovels/excavators. This method is suited to the large copper porphyry deposits mined by MEL as the deposits are low grade, high tonnage and located relatively close to the surface.
Since this is an established operation, the deposit, mining, metallurgy and processing, and environmental aspects of the project are well understood. The geological knowledge for MEL is based on the collective experience of personnel from MEL’s site operations geology, mining, metallurgy, and other technical disciplines gained during the history of the operations. This knowledge is supported by years of production data at MEL.
The mining operation begins with the drilling process; drill samples are sent to an assay laboratory for analysis. The assay results are used to mark out zones of ore, leach, and waste rock, which are mined separately. The current drilling equipment is outlined in Table 13‑7.
13.2.2.Waste Removal and Storage
After the blasting is completed, ore and waste are mined by excavators loading onto trucks. The current fleet is outlined in Table 13‑7. Overburden and waste loads can be used for fixing roads, building ramps, or simply placed on the Overburden Storage Facility (OSF).
13.2.3.Ore Removal and Transport
There are three destinations for ore based on the processing method to include mill, sulphide bio leach, and acid leaching.
Ore being sent to the Mills is sent to one of two locations, the Los Colorados plant which is adjacent to the Escondida pit, or Laguna Seca Line 1 / Line 2 plants located approximately 6km south of the Escondida pit. Ore coming from the Escondida pit being sent to Los Colorados is sent to Crusher 1 (with a capacity of 4,500 tonnes per hour [tph]) and then transported by conveyor to Los Colorados. Ore coming from Escondida pit being sent to Laguna Seca Line 1 or Line 2 is sent to Crusher 2 (capacity of 7,420tph) or Crusher 3 (capacity of 9,330 tph) and then via one of two conveyors to Laguna Seca Line 1 or Line 2. Ore from Norte pit is sent from Crusher 5 (capacity of 9,330 tph) and transported to either Los Colorados or Laguna Seca Line 1.
Ore being sent to Sulphide Bioleaching is sent via trucks to the ROM pad located 8 km east of the Escondida pit / 6 km southeast of the Escondida Norte pit. This pad has a design capacity of ~1,600 Mt.
Acid Leaching Ore is taken via trucks to Crusher 4 (capacity of 5,000tph), it then undergoes secondary and tertiary crushing and finally agglomeration before being sent via conveyor to be placed on the dynamic pad approximately 7km to the Northwest of the Escondida pit.
13.3.Additional Parameters Relevant to Mine Designs and Plans
13.3.1.Geotechnical Models
From the geotechnical logging of drilling, geotechnical parameters were obtained, such as resistance of the rocky matrix (Intact Rock Strength [IRS]), degree of fracturing (RQD and FF), additionally the condition of the discontinuities (continuity, opening, roughness, filling, alteration of walls) to determine the RMR89 (rock mass rating Bieniawski) dry condition, which are incorporated in the geotechnical block models for Escondida and Escondida Norte with spatial variability in each of the variables (GSI, FF, RQD, RMR89 each lithology-alteration unit had a fixed value of GSI (geological strength index) or RMR89 calibrated to better represent the observed failure mechanisms.
|
|
|
|
MEL_TRS_June 2022_Mike |
June 2022 |
|
|
SEC Technical Report Summary – Minera Escondida Limitada |
Page 152 |
The current geotechnical model is developed by Interpolation with the Reverse at Distance (RBF) method using Leapfrog tool, applying structural anisotropy for interpretation, with a basis of geological conceptualisation. Figure 13‑1 shows an overview of the process to crease these models.
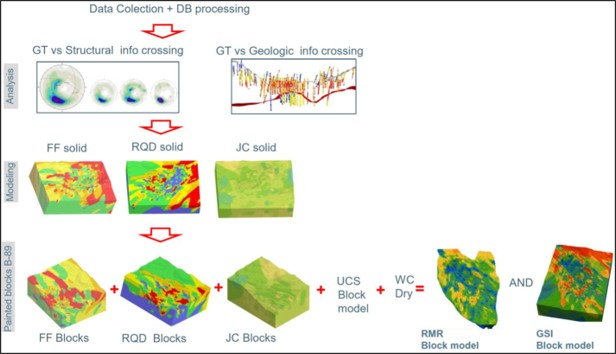
Source: MEL (2022)
Figure 13‑1: Geotechnical Estimate Flowsheet
Geotechnical evaluation has defined different geotechnical parameters for the Escondida and Escondida Norte pit slope designs. Recommendations for geotechnical slope angles are defined in terms of Inter Ramp Angles (IRA), global angle, bench face angle, ramp width, and considerations in terms of height and geometry of design. In order to reduce the risk associated with the vertical interaction between phases, and to mitigate wall failures between pushbacks, the geotechnical design includes a catch berm (step out) every 10 benches for single benching and a catch berm every 5 benches for double benching. It is considered good practice to build a containment berm on the crest of the step-out, and if possible, at the toe of the bench face. The minimum height of the parapet wall should be 2 m, (1/2 of height wheel of trucks).
|
|
|
|
MEL_TRS_June 2022_Mike |
June 2022 |
|
|
SEC Technical Report Summary – Minera Escondida Limitada |
Page 153 |
The mine design parameters applied for the Escondida and Escondida Norte mine pit pushbacks are summarised in Figure 13‑1 and Table 13‑1. Figure 13‑2 and Figure 13‑3 show the IRA for Escondida and Escondida Norte pits, respectively.
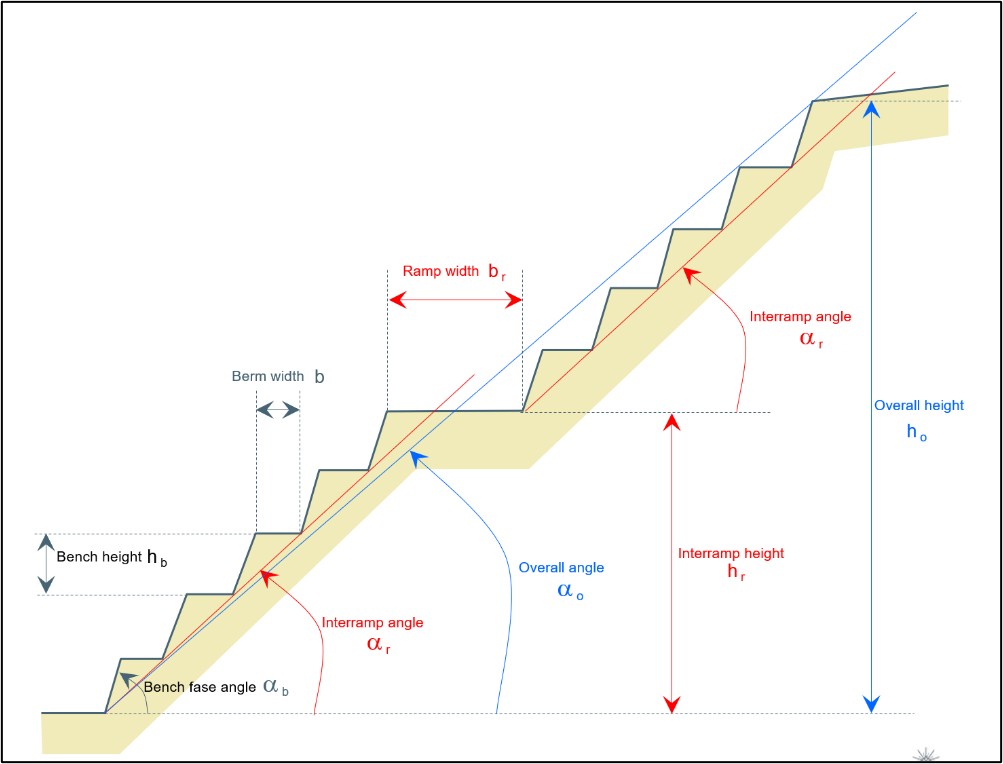
Source: MEL (2022)
Figure 13‑2: Geotechnical Definitions
Table 13‑1: Mine Design Parameters
|
|
Design Parameters |
Dimensions |
Minimum mining width (pushback) |
150 m |
Escondida pit bench height |
15 m (single benching) |
Escondida Norte pit bench height |
15 m (single benching) and 30m (double benching) |
Bench face angle |
70° (single benching) y 72° (double benching) |
Haul road maximum grade |
10% |
Maximum curve radius |
21 m |
Haul road width |
40 m |
Inter-ramp angle |
Variable by sector, based on geotechnical criteria |
Berm width |
Variable, according to inter-ramp angle and bench interval |
Source: MEL (2022)
|
|
|
|
MEL_TRS_June 2022_Mike |
June 2022 |
|
|
SEC Technical Report Summary – Minera Escondida Limitada |
Page 154 |
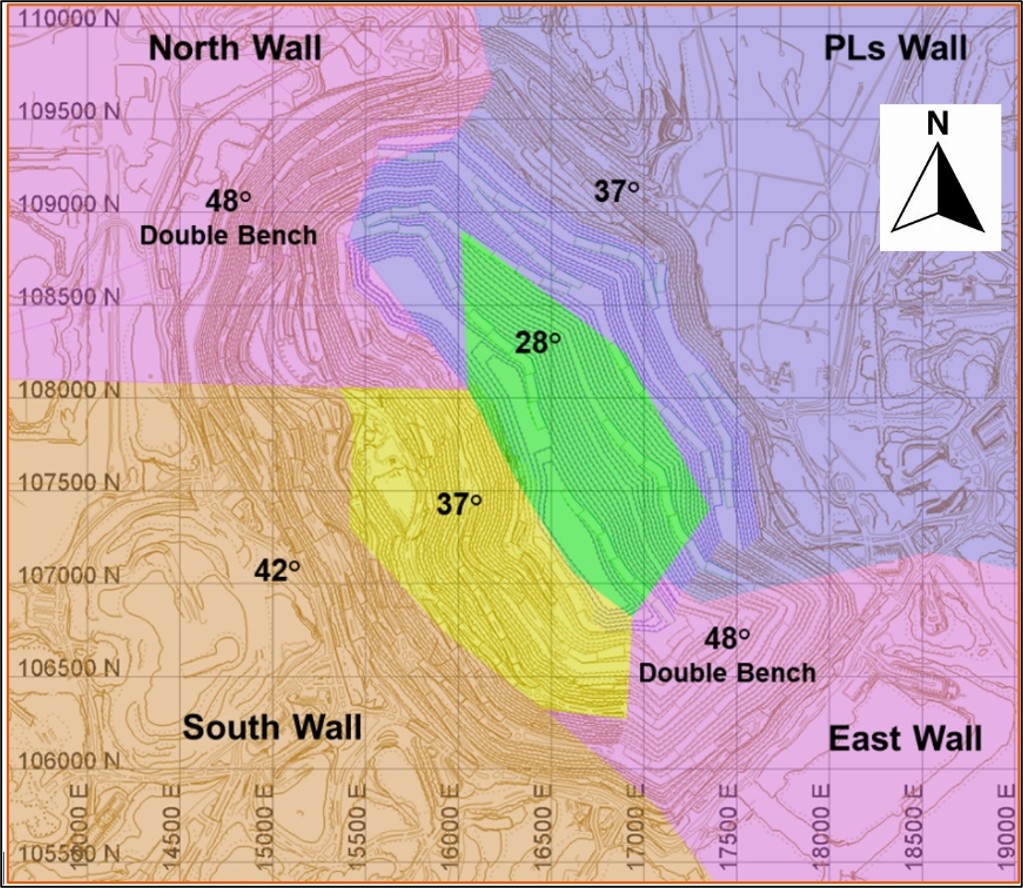
Source: MEL (2022)
Figure 13‑3: Escondida Pit Operational IRA (ToR 23)
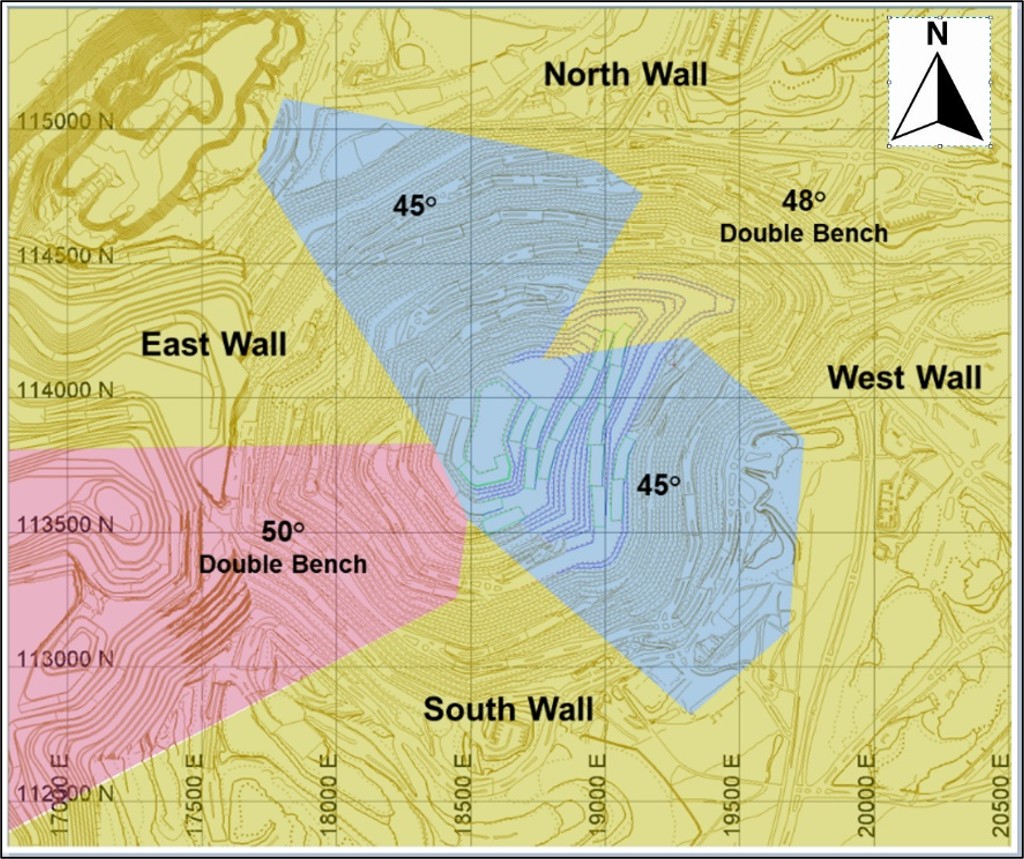
Source: MEL (2022)
Figure 13‑4: Escondida Norte Pit Operational IRA (ToR 23)
|
|
|
|
MEL_TRS_June 2022_Mike |
June 2022 |
|
|
SEC Technical Report Summary – Minera Escondida Limitada |
Page 155 |
Waste dump designs are common throughout the operation and consider the building of dumps with two lifts of 150 m height each and berms of 65 m between each lift Figure 13‑4. This results in waste dumps of 300m maximum height with slope angles of 37°. The design considers access ramps with a maximum gradient of 10%. A summary of the main assumptions for waste dump construction is shown in Table 13‑2.
Table 13‑2: Waste Dump Design Parameters
|
|
Design Parameters Value |
Value |
Face angle (angle of repose) |
37 degrees |
Waste material Density |
1.8 tonnes/m3 |
Access ramps |
10% grade |
Dump height maximum (each level) |
150 m |
Berm width between lifts |
65 m |
Maximum number of levels |
2 |
Haul road width |
40 m |
Source: MEL (2022)
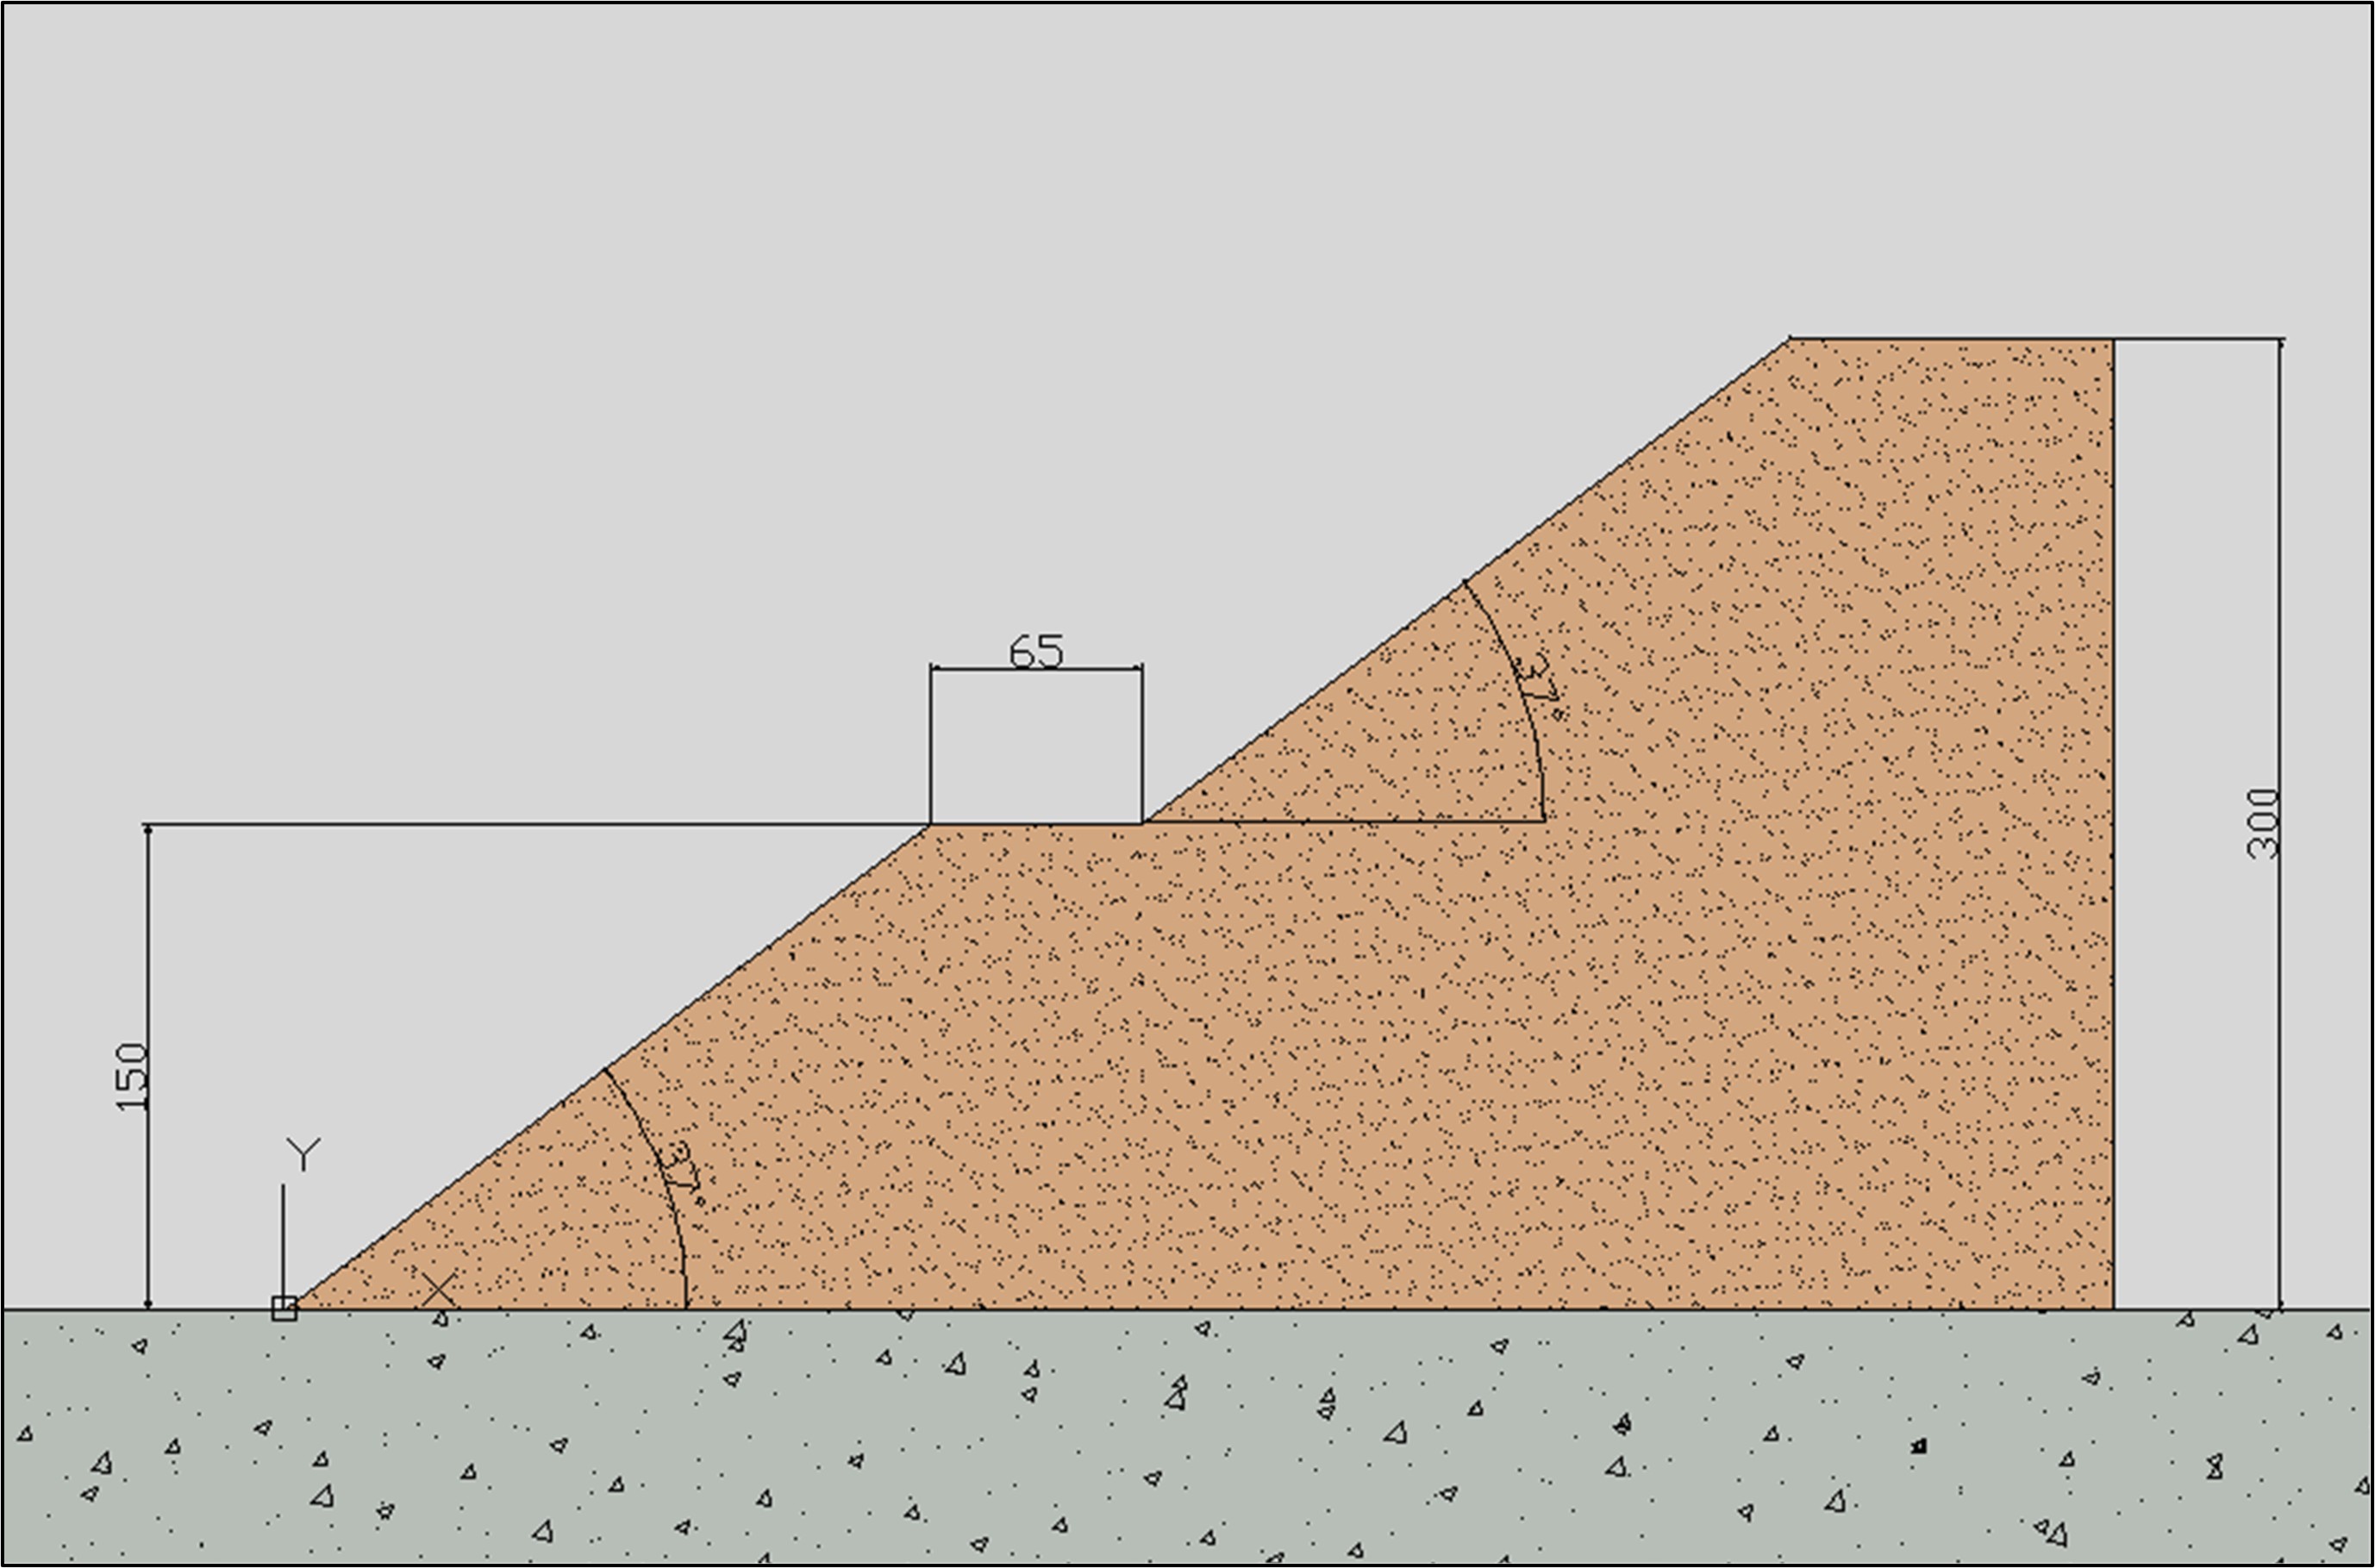
Source: MEL (2022)
Figure 13‑5: Waste Dump Design Parameters
Design Acceptance Criteria for Pit Design
The occurrence of instabilities can occur at the bank, inter-ramp, or global level on a slope. Therefore, it is necessary to consider a criterion of acceptability that a slope must meet for its degree of stability to be considered acceptable. Usually, the acceptability criterion depends on the magnitude and consequences of an eventual instability of the slope considered, and is defined in terms of minimum or maximum permissible values for one or more of the following parameters: Factor of Safety (FoS), Safety Margin, Probability of Failure, reliability index, etc. In MEL, the most used parameter is the FoS, which corresponds to the ratio between the resistance of the material and the acting stress on it (a factor over 1.0 has a stable condition). The FoS of both pits can be seen in Figure 13‑6.
|
|
|
|
MEL_TRS_June 2022_Mike |
June 2022 |
|
|
SEC Technical Report Summary – Minera Escondida Limitada |
Page 156 |
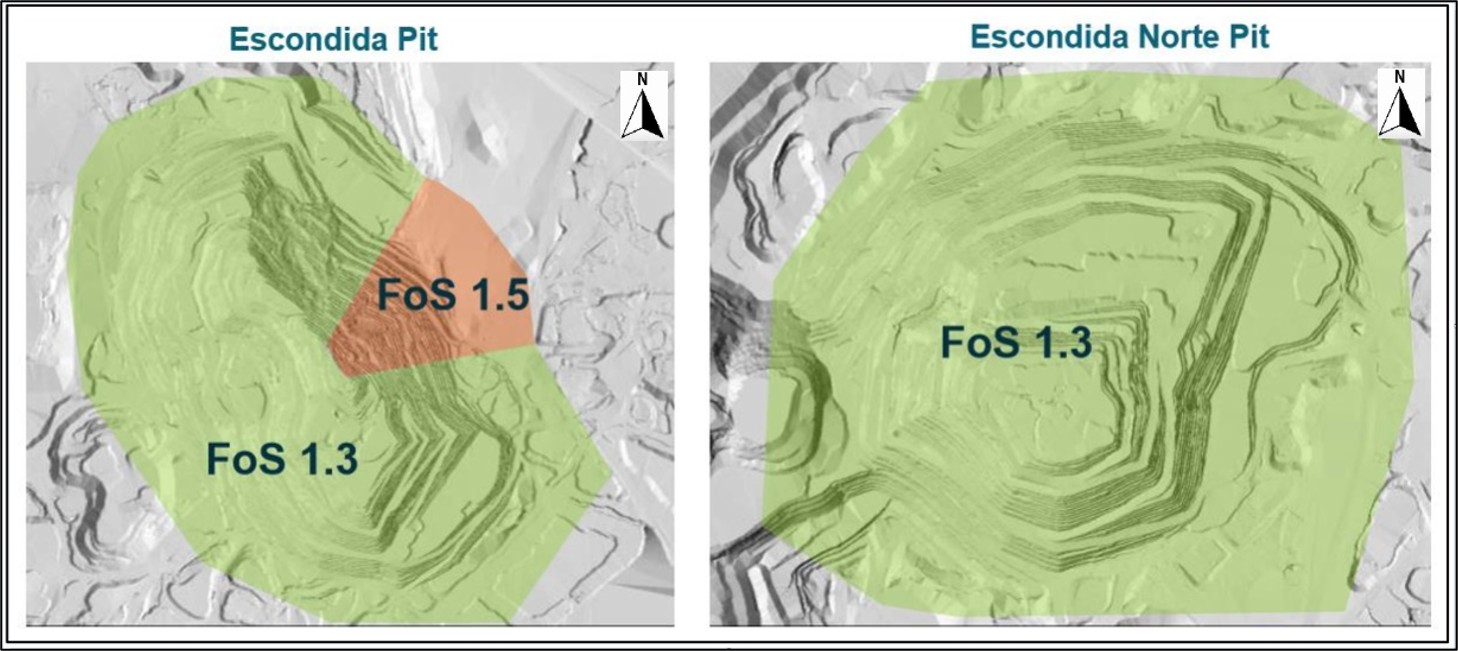
Source: MEL (2022)
Figure 13‑6: Factor of Safety Criteria for Pit Design
13.3.2.Hydrological Models
The Escondida pit is located inside the basin of the Salar de Hamburgo, in its western sector, at an elevation of 3,000 m amsl. The climate corresponds to marginal desert height, with average sporadic rainfall of 19.3 mm/year, and high evaporation rates of the order of 2,136 mm/year, resulting in negligible natural recharges. The basin has no permanent surface water courses, nor surface groundwater outcrops. The flow of natural groundwater occurs through the sedimentary deposits of the Hamburgo Salt Flat basin, formed, mainly gravels and sands of varied selection and degree of consolidation and through the underlying fractured rock consisting of andesitic rocks, which are intruded by the granodioritic intrusive complex.
Groundwater flow would be controlled primarily by major NW-SE and N-S orientation faults, which would act as preferential conduits for water circulation. They would also exert a hydrogeological control, less pronounced, the contact of the primary mineralisation with other mineralisation units, and the areas of the igneous rocky massif (volcanic and intrusive) of greater fracturing, found mainly in the primary mineralisation, characterised by the geotechnical parameter RQD (designation of rock quality). With these parameters eight Hydrogeological Units (UHs) of the pit rock massif are defined, as shown in Table 13‑3.
|
|
|
|
MEL_TRS_June 2022_Mike |
June 2022 |
|
|
SEC Technical Report Summary – Minera Escondida Limitada |
Page 157 |
Table 13‑3: Hydraulic Parameters UH
|
|
|
Description UH |
Permeability K (m/s) |
Specific Porosity (%) |
UH0 Anthropic deposits |
1E-06 - 4E-04 |
21 |
UH1 Hamburgo sediments |
6E-08 - 6E-05 |
0.1 – 12 |
UH2 Supergene and Leaching |
1E-09 - 4E-06 |
0.05 |
UH3 Severely fractured primary |
2E-09 - 1E-07 |
1-5 |
(FF 17-40 1/m) |
UH4 Fractured primary |
1E-10 - 5E-08 |
0.05 |
(FF 5-17 1/m) |
UH5 Poorly fractured primary (FF 0-2 1/m) |
3E-11 - 4E-08 |
0.01 |
UH6 Relevant conducted failures |
1E-11 - 4E-07 |
0.01 |
UH7 Relevant Faults Partial Barrier |
3E-11 - 4E-08 |
0.01 |
UH7 Other faults |
1E-11 - 4E-07 |
0.01 |
Source: MEL (2022)
The excavation of the Escondida pit has generated a cone of depression that has modified the natural groundwater regime, inducing a radial flow into the mining excavation. Two piezometric levels are detected, one more shallow around 3,000 m amsl, contained in the UH2 and a deeper one linked to the primary rock that has heights between 2850 and 2,550 m amsl at the bottom of the pit.
The flow of groundwater manifests itself in the pit as passive outcrops and as a saturated zone on the slopes, hindering efficiency in the development of the mining plan, both in the safety aspect, associated with the geotechnical stability of the slopes, and in the operational aspect, hindering the process of blasting and loading of material in the fronts of advance of the pit.
A diagram of the Escondida hydrogeological model can be seen in Figure 13‑7.
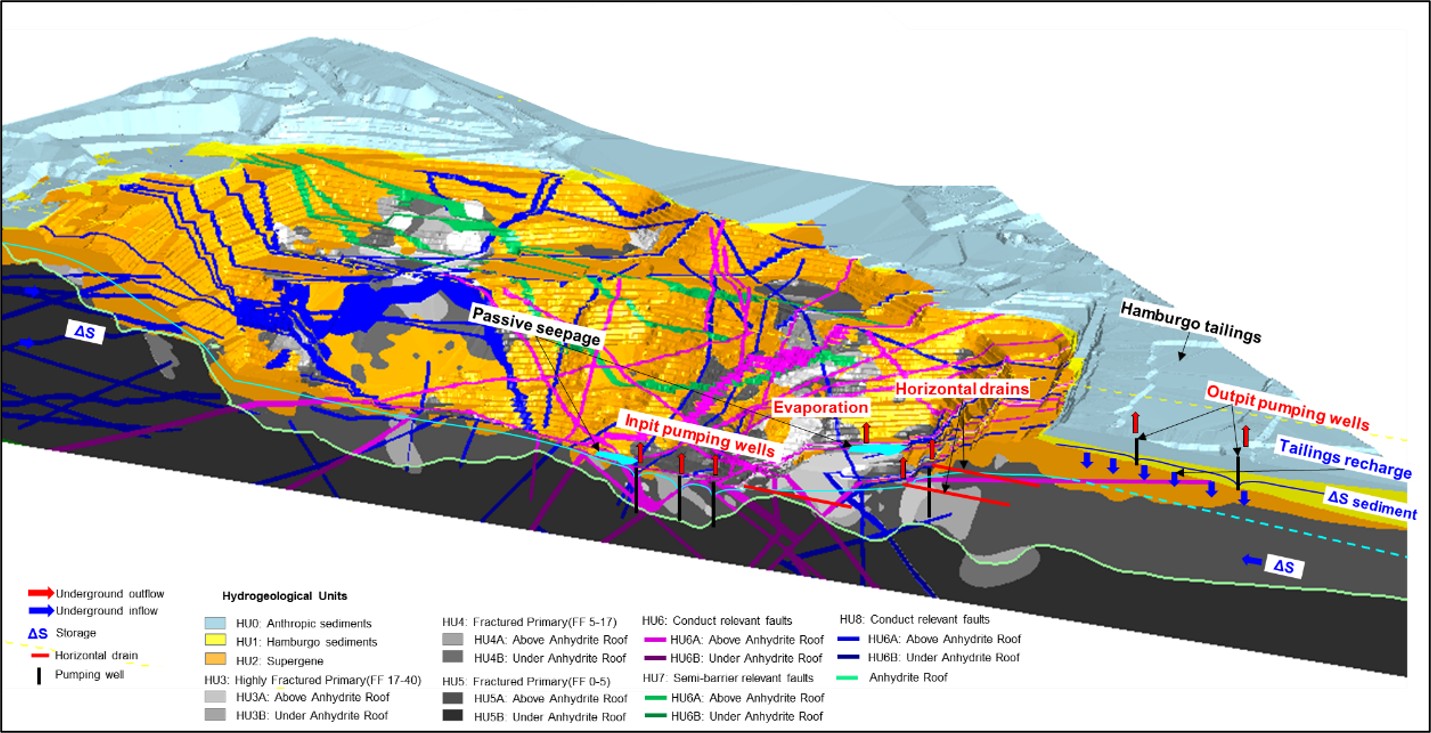
Source: MEL (2022)
Figure 13‑7: Escondida Hydrogeological Model
|
|
|
|
MEL_TRS_June 2022_Mike |
June 2022 |
|
|
SEC Technical Report Summary – Minera Escondida Limitada |
Page 158 |
The water balance of the Escondida pit is composed of the following elements:
oAnthropic refills: Corresponds to the infiltration by seepage from the pool 400x400 that reach the pit, combined with the flow of groundwater generated by the residual recharge produced from the original tailings deposit in the Hamburgo basin. The magnitude of these components is estimated to reach the order of 25 L/s. Within this flow, the possible infiltration from other mining infrastructure near the pit such as the Los Colorados plant is also considered.
oPrecipitation: It is estimated that the recharge by precipitation is negligible, considering that the estimated average annual precipitation and evaporation for the Hamburgo basin are 19.3 and 2,136 mm/year, respectively.
oEvaporation: There are no measurements or land estimates of the magnitude of the passive outcrops in the pit; however, this was estimated based on hydrological studies of the area that the magnitude of evaporation losses could reach 10 L/s.
oPumping wells: This component corresponds to the pumping flow extracted by the depressurisation and drainage system which is of the order of 22 L/s.
oHorizontal drains: This component corresponds to the flow drained passively by the drains of the depressurisation and drainage system, which is of the order of 15 L/s.
oDrainage tunnel: This component corresponds to the flow of groundwater captured by the drainage tunnel, which is of the order of 5 L/s.
oIn this way and as reflected in Table 13‑4, the variation of the storage is of the order of 30 L/s.
Table 13‑4: Escondida System Water Balance
|
|
|
|
Inflows (L/s) |
Output flows (L/s) |
Anthropic refill |
25 ± 4 |
Evaporation passive outcrops |
10 ± 2 |
Pumping wells |
22 ± 4 |
Horizontal drains |
15 ± 3 |
Drainage tunnel |
5 ± 1 |
TOTAL |
25 ± 4 |
TOTAL |
52 ± 10 |
Source: MEL (2022)
The Escondida Norte pit is located on the northern limit of the Hamburgo Salar watershed, about 140 km southeast of Antofagasta, at an average elevation of 3,200 m amsl.
At the district level, the Basin of the Salar de Hamburgo is composed of a series of sedimentary deposits of varied consolidation, mainly gravels and sands with different proportions of fines in their matrix, which are arranged by overlaying both porphyry rocks that make up the ore deposit, as well as ancient volcanic and sedimentary rocks that host the intrusions.
The Hamburgo Salt Flat basin is characterised by a marginal desert climate of height, with sporadic rainfall of the order of 19.3 mm/year, and high evaporation rates of the order of 2,136 mm/year. It has no surface water courses, nor natural groundwater outcrops; only a few ravines on the western slope of the Domeyko Mountain Range have sparse vegetation.
In its natural condition, that is, prior to any anthropic intervention in the basin, the direction of the underground flow occurred mainly in the direction of the West of the basin, following a hydraulic gradient of low magnitude finally discharging towards the end of the West limit. MEL's operations modified both the magnitude and direction of groundwater flow that occurred in natural condition (due to the excavation of the pits, as well as the generation of anthropic recharge from mining infrastructure built in the basin). Of these in the vicinity of the Escondida Norte pit, the sub terrestrial flow is radial towards the centre of it.
|
|
|
|
MEL_TRS_June 2022_Mike |
June 2022 |
|
|
SEC Technical Report Summary – Minera Escondida Limitada |
Page 159 |
The hydrogeological units are defined in the fractured rock mass, associated with the unconsolidated deposits that fill the Hamburgo basin and that are defined as gravels. The description of the hydrogeological units is included in the Table 13‑5.
A diagram of the Escondida Norte hydrogeological model can be seen in Figure 13‑8.
Table 13‑5: Hydrogeological Units of Escondida Norte
|
|
|
|
Hydrogeological Unit |
Description |
Permeability K (m/s) |
Porosity Sy (%) |
UH1 |
Hamburgo sediments |
6E-08 - 6E-05 |
0.1-12 |
UH2 |
Supergene and Leaching |
4E-10 - 5E-06 |
0.05 |
UH3 |
Severely fractured primary (FF 17-40 1/m) |
8E-10 - 2E-06 |
1-5 |
UH4 |
Fractured primary (FF 5-17 1/m) |
3E-09 - 6E-07 |
0.05 |
UH5A |
Poorly fractured primary (FF 0-2 1/m) |
1E-10 - 3E-08 |
0.01 |
UH5B |
Poorly fractured primary (FF 2-5 1/m) |
1E-10 - 3E-09 |
0.01 |
UH6 |
Relevant Faults |
6E-09 - 3E-06 |
0.01 |
UH7 |
Other faults |
6E-09 - 3E-06 |
0.01 |
Source: MEL (2022)
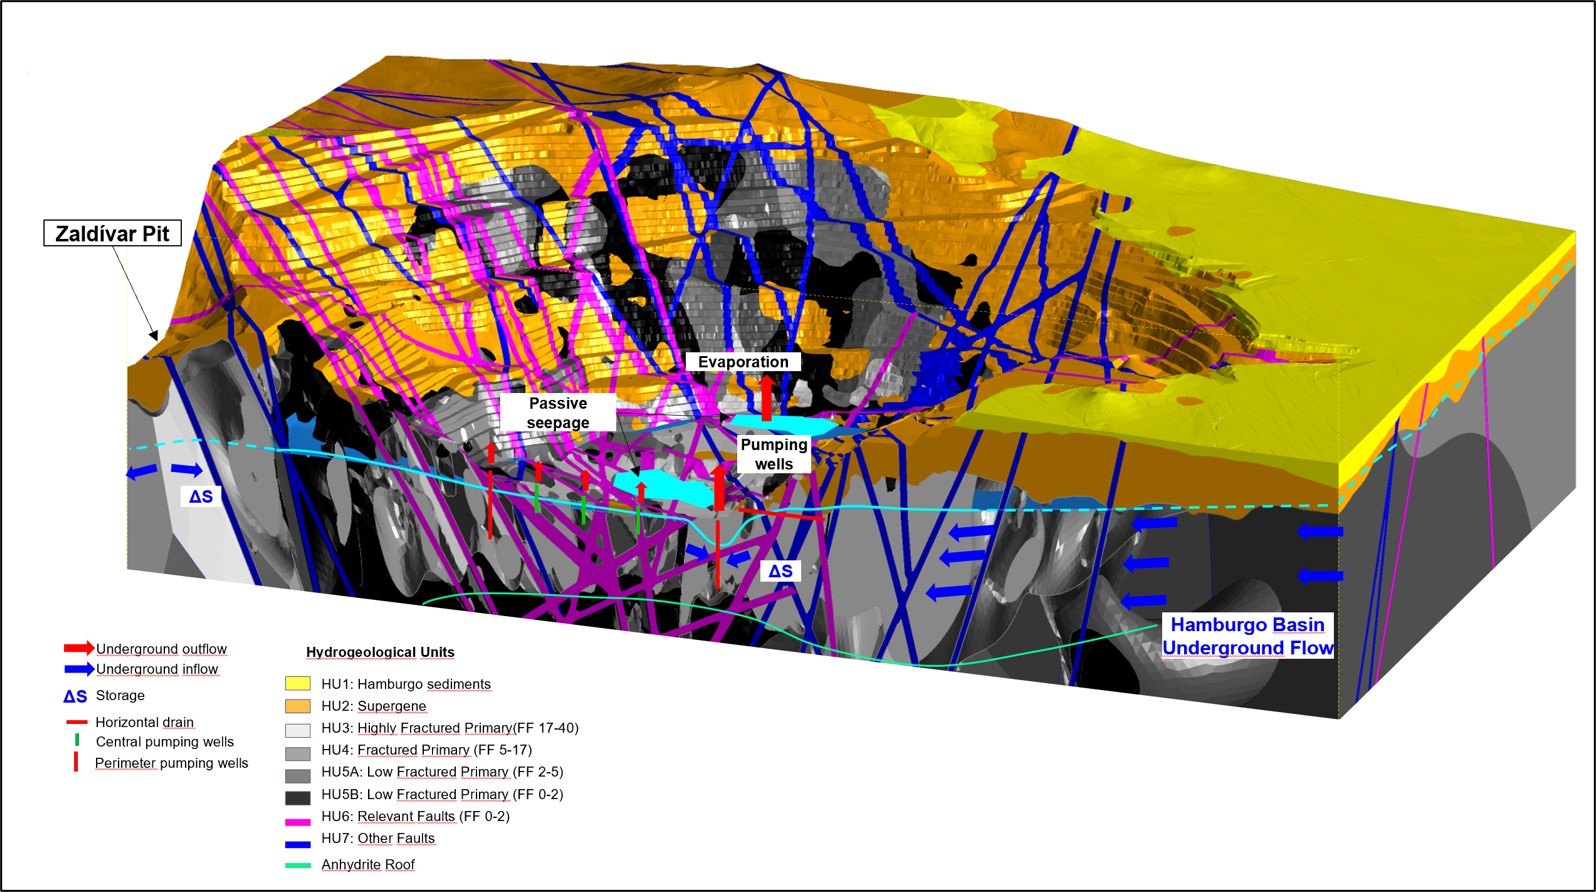
Source: MEL (2022)
Figure 13‑8: Escondida Norte Hydrogeological Model
The water balance of the Escondida pit is composed of the following elements, as discussed below.
Inflows
•Groundwater flow from the Hamburgo Salt Flat basin: Corresponds to the flow of groundwater coming from the district environment of the Escondida Norte pit, mainly from the upper part of the basin (east and south of the pit) and from its middle zone, where the Escondida pit and the Hamburg well field are located. It is estimated that the underground flow from the west and north of the Escondida Norte pit would be lower, due to the effect of the Zaldivar pit and the low underground flow expected at the upper limit of the basin, respectively. The estimates that the magnitude of the groundwater flow from the Hamburgo basin could be in a range between 19 L/s, which would come mainly from the east and south of the Escondida Norte pit.
|
|
|
|
MEL_TRS_June 2022_Mike |
June 2022 |
|
|
SEC Technical Report Summary – Minera Escondida Limitada |
Page 160 |
•Precipitation: It is estimated that the recharge by precipitation is negligible, considering that the estimated average annual precipitation and evaporation for the Hamburgo basin are 19.3 and 2,136 mm/year, respectively.
Output flows
Evaporation: There are no measurements or ground estimates of the magnitude of passive outcrops in the pit, however, this was estimated to reach 8 L/s
•Pumping wells: This component corresponds to the pumping flow extracted by the pit drainage system. The average monthly pumping flow rate is in the order of 20 L/s.
•Horizontal drains: This component corresponds to the flow generated by the horizontal drains. The flow rate was found in the order of 5 L/s.
In this way and as reflected in the table the variation of the storage is of the order of 14 L/s.
Regarding the hydrogeology of the tailings dam, currently in operation, (Tailing Laguna Seca) it is located in the hydrological basin called Laguna Seca, approximately 15 km southwest of the Escondida pit. This basin is endorheic in nature without the presence of surface runoff, given the arid conditions of the area.
Table 13‑6: Escondida Norte System Water Balance
|
|
|
|
Inflows (l/s) |
Output flows (l/s) |
Lateral flow |
19 |
Evaporation passive outcrops |
8 |
Pumping wells |
20 |
Horizontal drains |
5 |
TOTAL |
19 |
TOTAL |
33 |
Source: MEL (2022)
From the hydrogeological point of view, although in the centre of the basin under the basin of the tailing, there are sediments with storage potential and flow of groundwater, the underground discharge of the basin, occurs to the west through fractured rock units, mainly by the sector where the Tailing wall is currently located (Figure 13‑9).
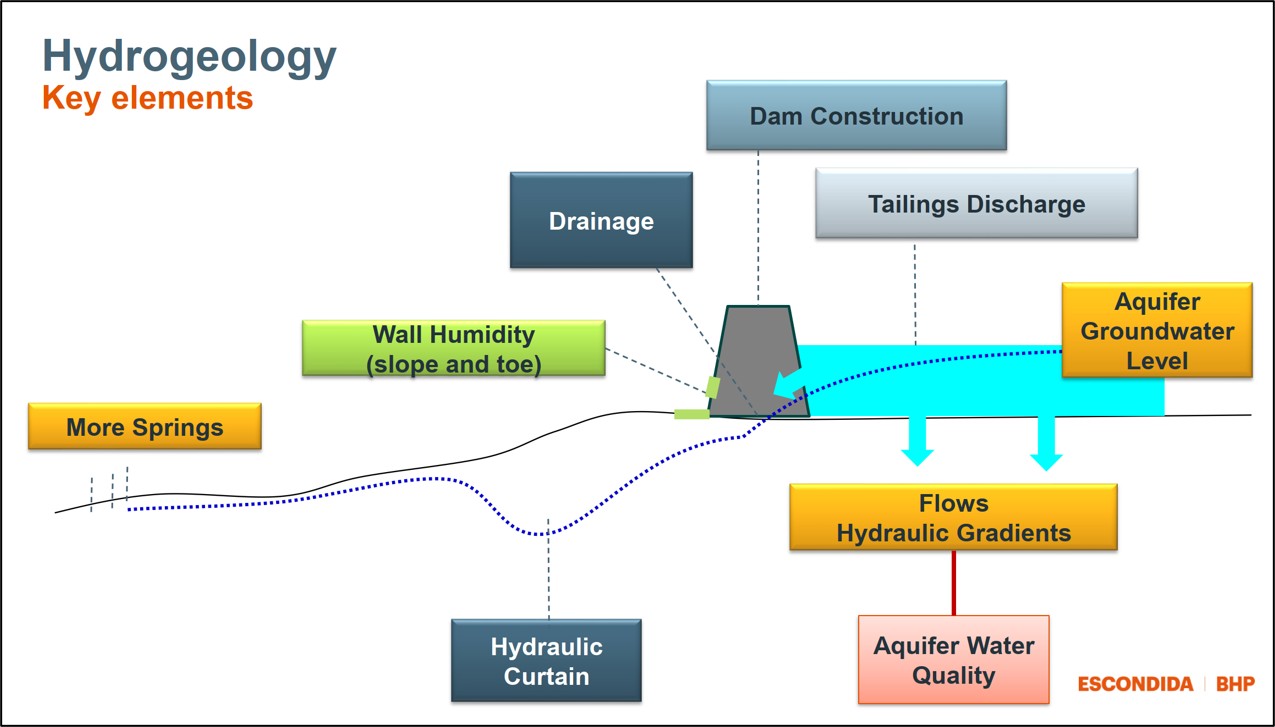
Source: MEL (2022)
Figure 13‑9: Laguna Seca Tailing Storage Facility Hydrogeological Model
|
|
|
|
MEL_TRS_June 2022_Mike |
June 2022 |
|
|
SEC Technical Report Summary – Minera Escondida Limitada |
Page 161 |
13.3.3.Mine Design Parameters
Mine planning at MEL follows the typical standards for open pit mining. The processes include:
•Revision of dilution and recovery factors
•Development of a value for each of the blocks in the model
•Perform pit optimisation and select optimal pit shell to be used for the basis of the ultimate pit design
•Develop pushback/phase designs
•Develop mine planning targets and constraints
The ultimate pit shell selected from the pit optimisation process was used as a guide to develop a more detailed design. The resulting pit design was referred to as the operational pit. The operational pit was also limited by the following constraints:
•Mining restrictions, including legal and environmental impacts
•Operational design characteristics, including ramp locations and grades, OSF locations, mining width and height, and other practical mining considerations given the mine geometry.
The mine design criteria are listed below:
•Minimum operating width of 80 m
•Haul road design width of 40 m
•Maximum road grade of 10%
•Bench face angle and catch berms vary based on geotechnical sector
•Typical blasting grid ranging from 7x7 until 11x14m
•Final wall Control Drill Pattern 2.0, 2.5 and 3.0 m depending on sector
•Blasthole diameter of 6.1/2, 9, 10 5/8 and 12 inches
•Rock density average of 2.5
13.3.4.Dilution, Loss, and Mine Recovery
A dilution of 0% was applied to the schedule and Mineral reserves estimate. It is the opinion of the QP for mineral reserves that with the current practices at MEL no ore loss or mining dilution is required as the resource model has been reconciled to actual mining production. This conclusion is based on the results of a reconciliation between the geological resource model and actual mine production. The results of the reconciliations are provided below in Figure 13‑10 and Figure 13‑11.
|
|
|
|
MEL_TRS_June 2022_Mike |
June 2022 |
|
|
SEC Technical Report Summary – Minera Escondida Limitada |
Page 162 |
Based on the previous analysis, there is a high effectiveness of the measured mineral resource in adhering to its current definitions used during the resource classification process. Figure 13‑10 and Figure 13‑11 shows the historical adherences to tonnage, grade and copper productions which is the basis of assuming zero dilution.
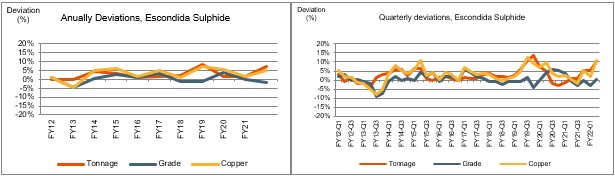
Source: MEL (2022)
Figure 13‑10: Escondida Sulphide Annual and Quarterly Deviations
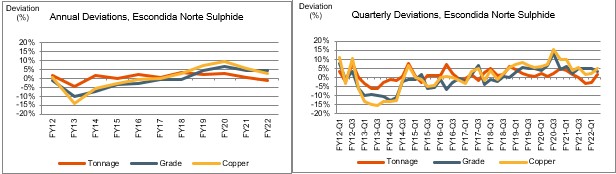
Source: MEL (2022)
Figure 13‑11: Escondida Norte Annual and Quarterly Deviations
|
|
|
|
MEL_TRS_June 2022_Mike |
June 2022 |
|
|
SEC Technical Report Summary – Minera Escondida Limitada |
Page 163 |
The operation mine plan consists of 22 pushbacks in the Escondida Pit (Figure 13‑12) and nine (9) pushbacks in the Escondida Norte Pit (Figure 13‑13).
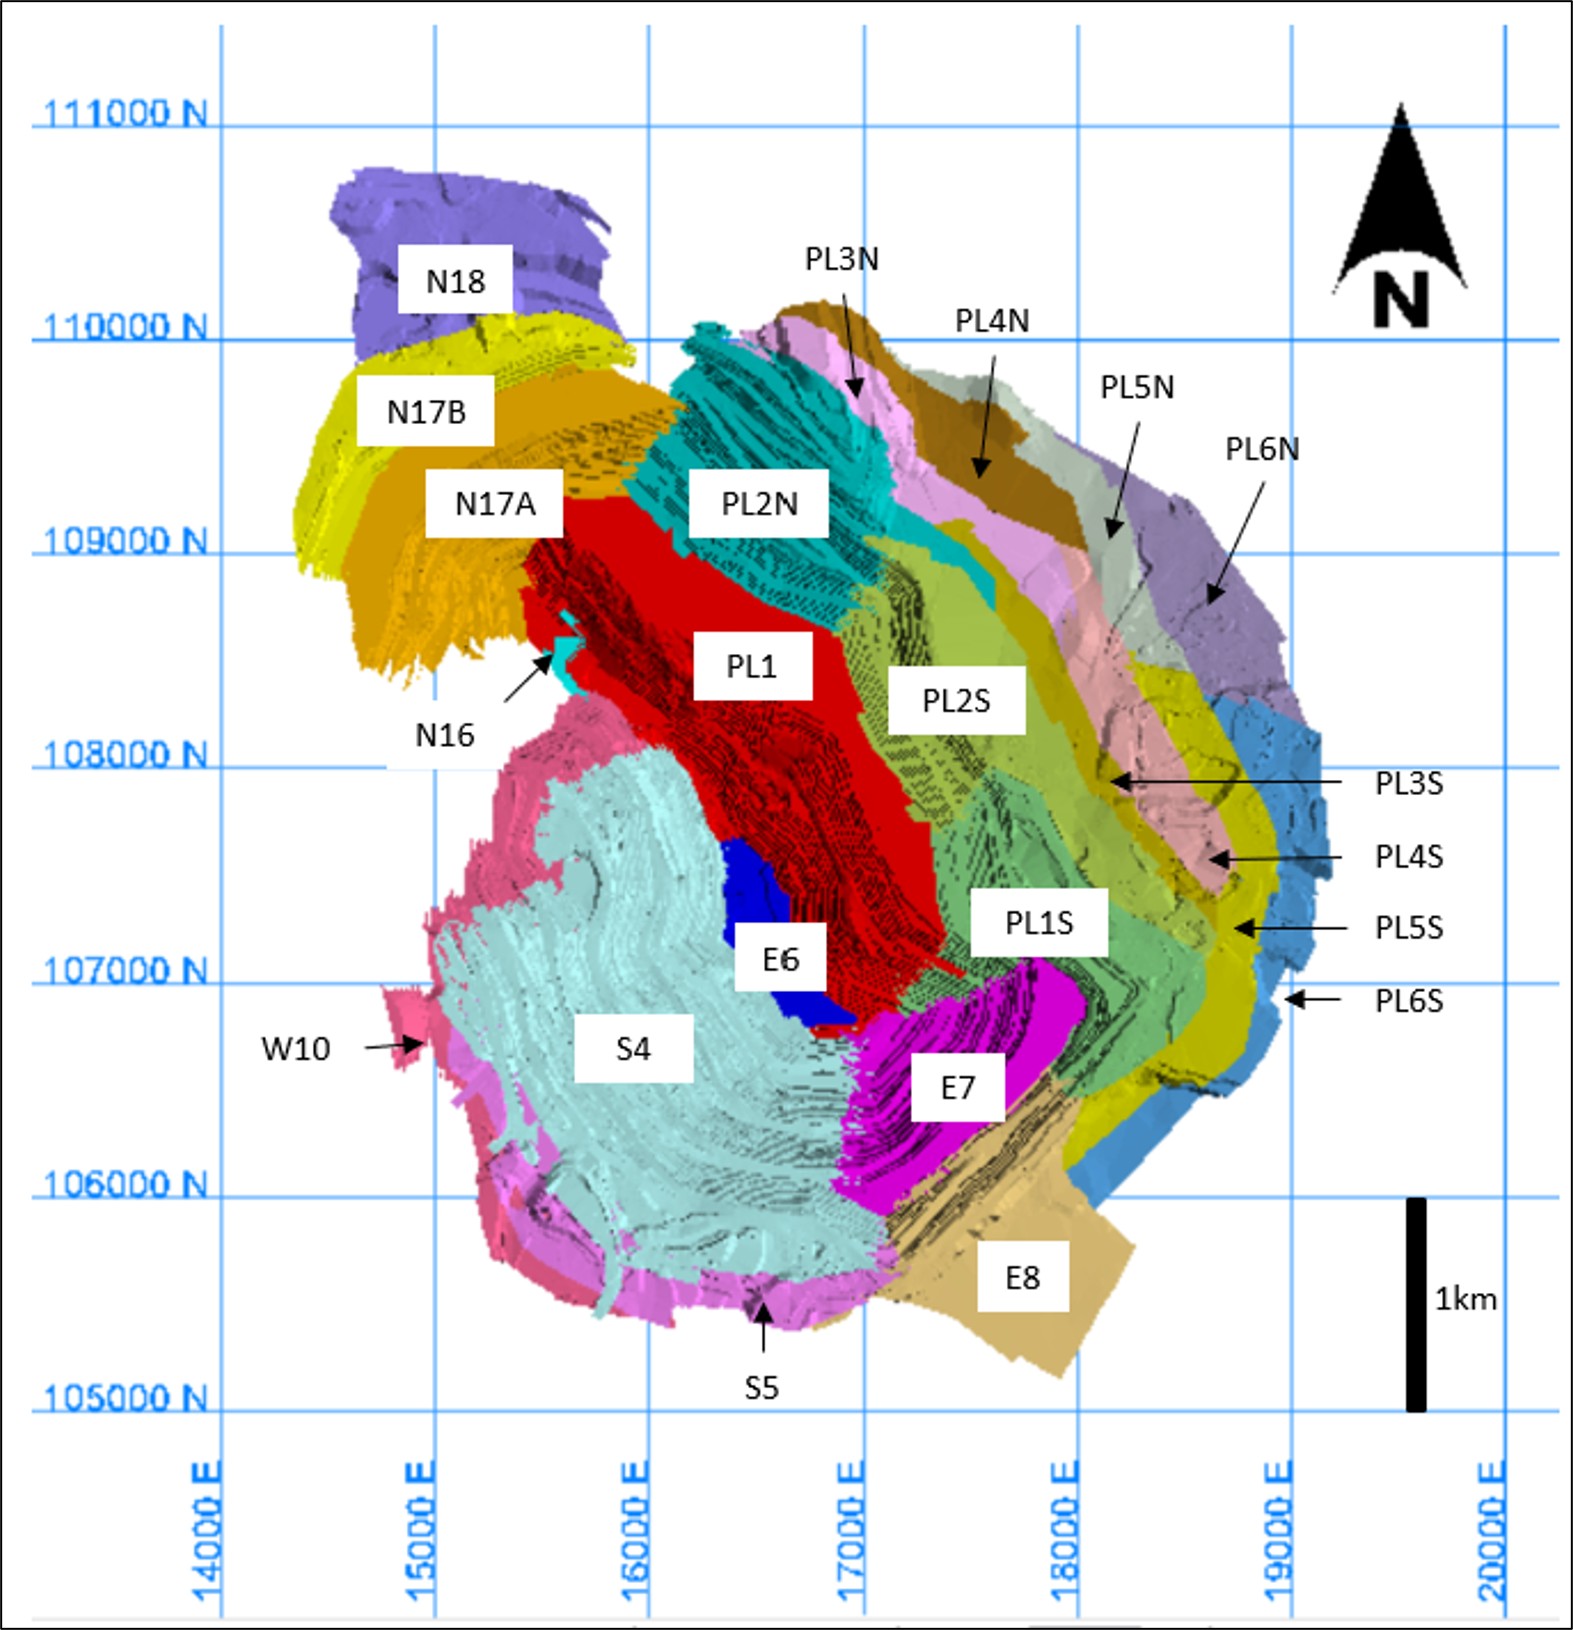
Source MEL (2022)
Figure 13‑12: Escondida Pit Pushbacks
|
|
|
|
MEL_TRS_June 2022_Mike |
June 2022 |
|
|
SEC Technical Report Summary – Minera Escondida Limitada |
Page 164 |
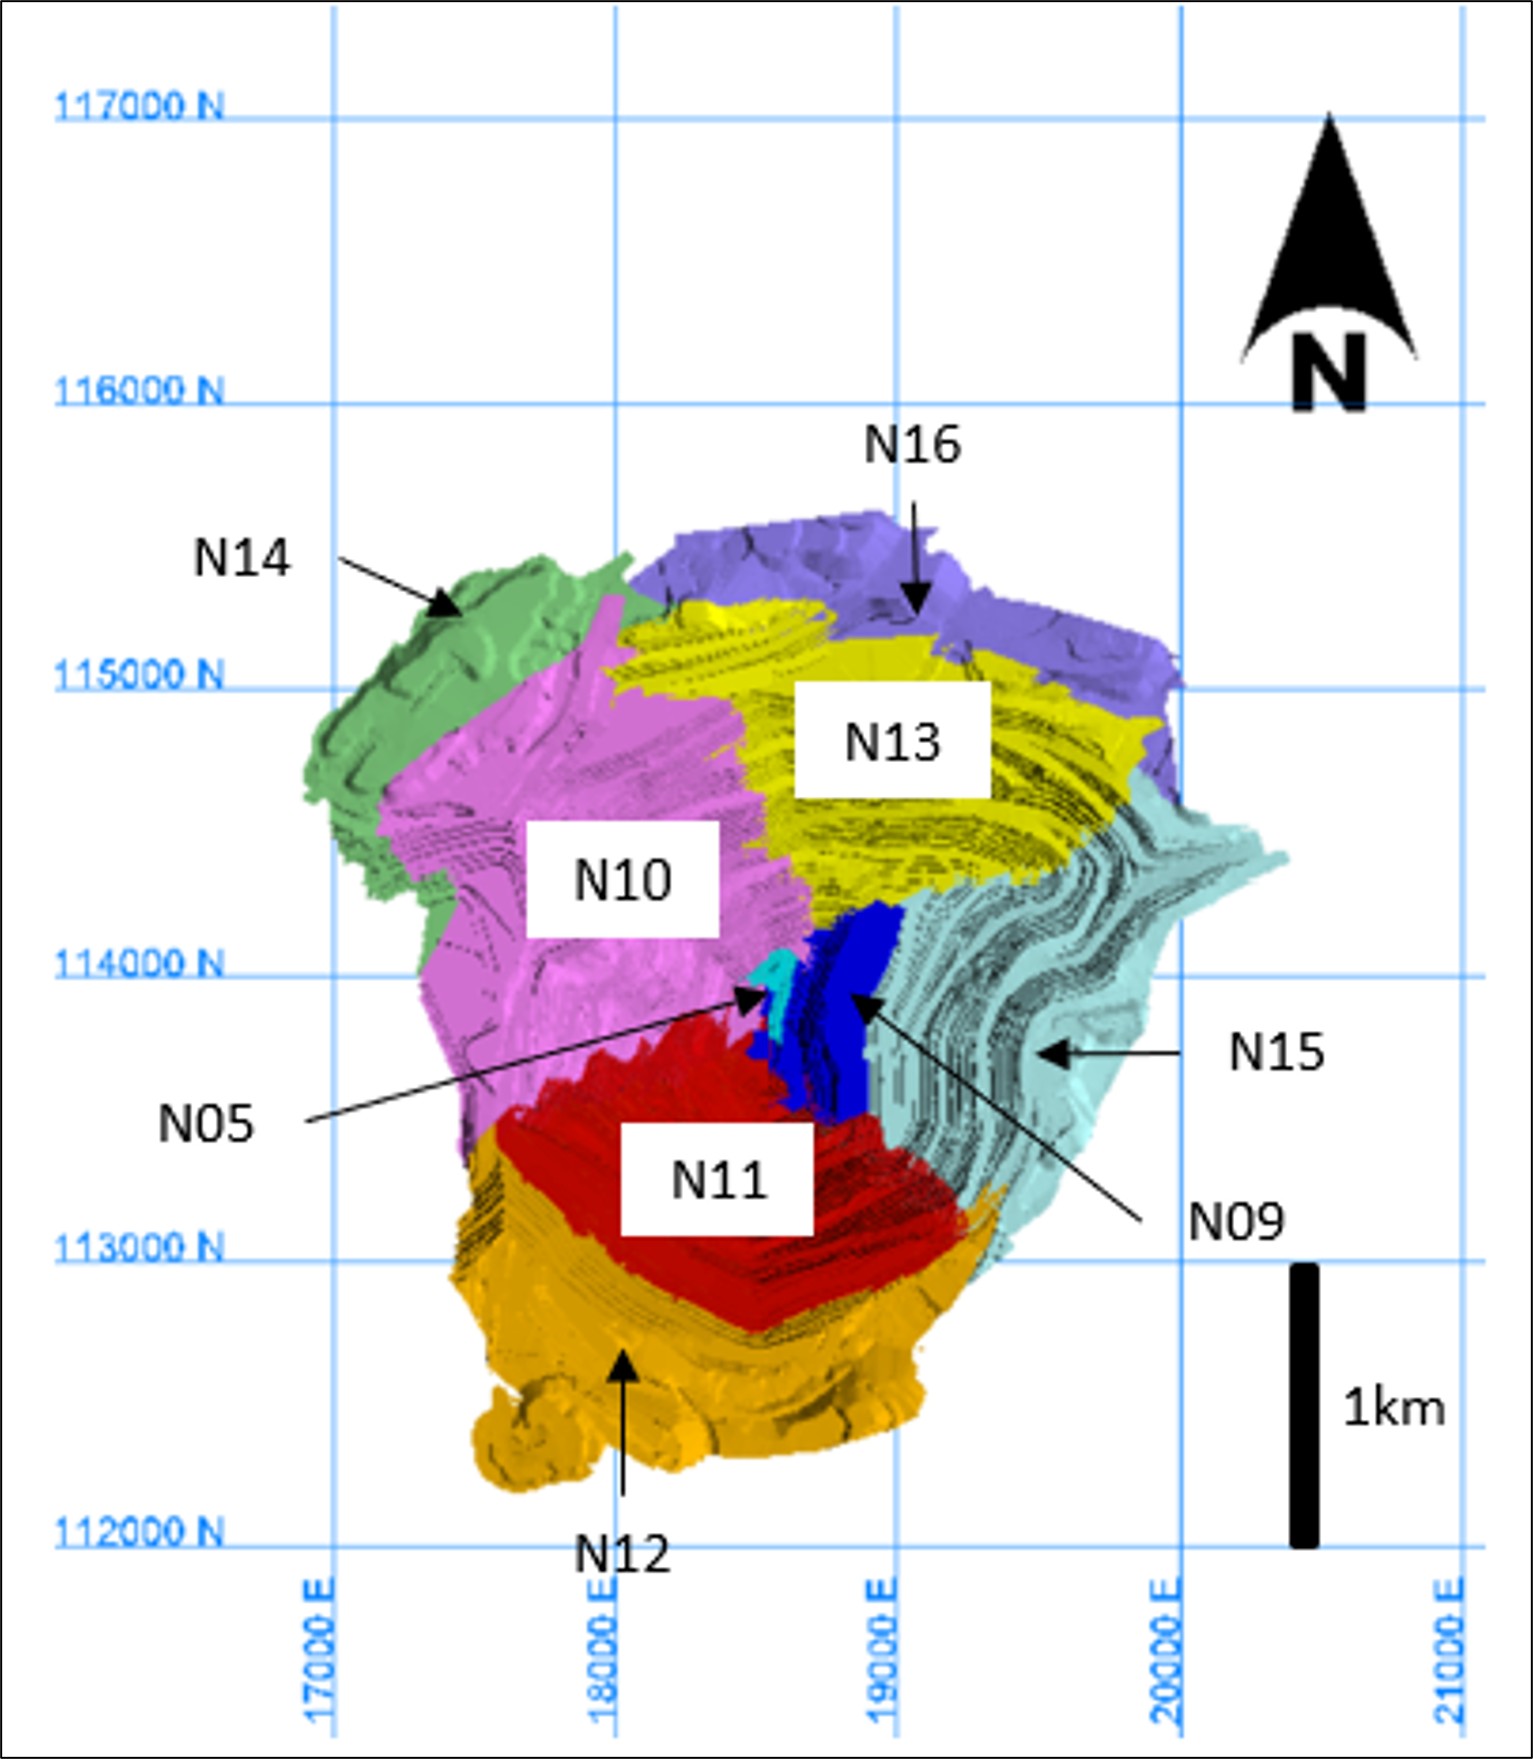
Source: MEL (2022)
Figure 13‑13: Escondida Norte Pit Pushbacks
13.3.6.Mining Strategy and Production Rates
The SEC LOM mine plan results in a mill feed rate of about 149 Mtpa of Mill Feed until FY27 (when the SEC LOM plan has Los Colorado’s concentrator finishing) and approximately 91 Mtpa over the remainder of the LOM Schedule. An average feed rate of 74 Mtpa of Sulphide Bio Leach Ore and 20 Mtpa of Acid Leach Ore with the LOM mine plan averaging an annual total movement of 380 Mtpa. It should be noted that production rates presented in this section, as discussed in the Note Regarding Forward-Looking Statements (see page ii), have been prepared using commodity prices and costs which are different to those that have been employed in the preparation of BHP’s production guidance. Therefore, the production
|
|
|
|
MEL_TRS_June 2022_Mike |
June 2022 |
|
|
SEC Technical Report Summary – Minera Escondida Limitada |
Page 165 |
rates presented herein may differ significantly from the assumptions utilized in determining BHP’s production guidance published in accordance with ASX Listing Rules.
Other considerations to the mine planning process are:
•Maximum extraction rate for each pit as conditioned by mine fleet and performance
•Extraction rates are conditioned by operational restrictions of specific pushbacks
•Equipment availability for stockpile movement and re-handling
•Maximum capacity of the primary crushers for each individual process and pit
•The overall crusher-conveying system capacity
•The concentrator feed programme including throughput rates and operating hours
•Applicable blending restrictions for both leaching processes
The effective date of the mine plan for reserves estimation (the LOM Plan) is 1st July 2022 (start of FY23). A summary of the LOM Plan production is found in Figure 13‑14, total movement and ore grade is shown in Figure 13‑15.
It should be noted that production schedule presented in this section, as discussed in the Note Regarding Forward-Looking Statements (see page ii), has been prepared using commodity prices and costs which are different to those that have been employed in the preparation of BHP’s production guidance. Therefore, the production schedule data included herein is based upon pricing and cost assumptions that differ significantly from the assumptions utilized in determining BHP’s production guidance published in accordance with ASX Listing Rules.
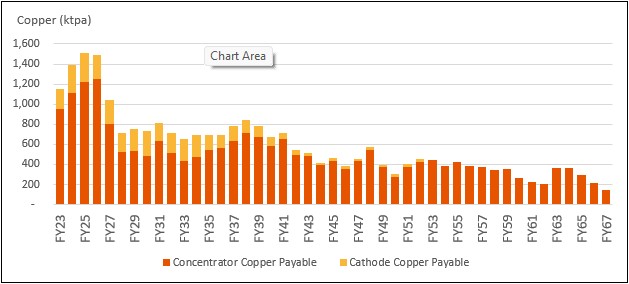
Note: The sole purpose of the presented information above is to demonstrate the economic viability of the mineral reserves for the purposes of reporting in accordance with S-K 1300 only and should not be used for other purposes. The annual cash flow data was prepared based upon Pre-Feasibility-level studies and three year historical prices and costs described in this Technical Report Summary; it is subject to change as assumptions and inputs are updated. The information presented does not guarantee future financial or operational performance. The presented information contains forward-looking statements. Please refer to "Note Regarding Forward Looking Statements" at the front of this Technical Report Summary.
Source: MEL (2022)
Figure 13‑14: SEC Annual Production by Process (ktpa)
|
|
|
|
MEL_TRS_June 2022_Mike |
June 2022 |
|
|
SEC Technical Report Summary – Minera Escondida Limitada |
Page 166 |
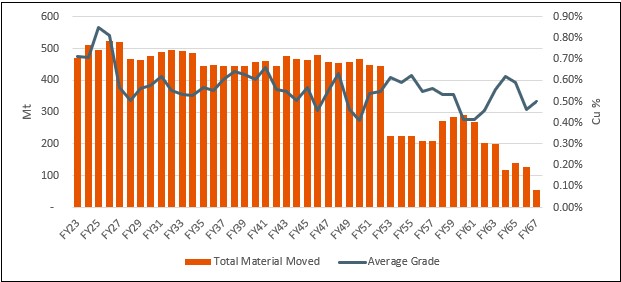
Note: The sole purpose of the presented information above is to demonstrate the economic viability of the mineral reserves for the purposes of reporting in accordance with S-K 1300 only and should not be used for other purposes. The annual cash flow data was prepared based upon Pre-Feasibility-level studies and three year historical prices and costs described in this Technical Report Summary; it is subject to change as assumptions and inputs are updated. The information presented does not guarantee future financial or operational performance. The presented information contains forward-looking statements. Please refer to "Note Regarding Forward Looking Statements" at the front of this Technical Report Summary.
Source: MEL (2022)
Figure 13‑15: Total Material Movement (Mt) and Average Grade
13.5.Production Rates and Mine Life
The Life of Mine (LoM) plan is optimised using a Net Present Value methodology described in detail in Chapter 19. The total movement is largely driven by ensuring the concentrators have consistent supply of ore, as well as, but to a lesser degree, ensuring a consistent supply of ore to the leaching processes.
The average production of the LOM Plan for MEL is expected to be 610 Ktpa over the 44-year Reserve life. The concentrators are operational over the mine life, however the Oxide ore is expected to be exhausted in FY34 resulting in the closure of the Oxide leaching. The Sulphide leach pad is expected to be completed in FY52 when the leach pile reaches it design limits. The production schedule data included herein is based upon pricing and cost assumptions that differ significantly from the assumptions utilized in determining BHP’s production guidance (see Note Regarding Forward-Looking Statements page ii).
13.6.Equipment and personnel
All major equipment at MEL is owner operated. The primary loading units are electric shovels, with the primary haulage units consisting of CAT 797 / 793 trucks as well as Komatsu 930 and 960. Front end Loaders and small excavators also assist with loading. An overview of all equipment in FY23 can be seen in Table 13‑7. Equipment replacement is assumed to be like for like once equipment reaches the end of its operational life.
Table 13‑7: Mine equipment distribution FY23
|
|
|
|
|
|
Equipment |
Fleet |
# |
Equipment |
Fleet |
# |
Trucks |
Caterpillar 797 |
114 |
Drills |
Electric |
5 |
Caterpillar 793 |
7 |
Diesel |
9 |
Komatsu 930 |
3 |
Pre-split |
5 |
Komatsu 960 |
43 |
Ancillary |
Motorgrader |
9 |
Electric Shovel (73yd3) |
P&H |
8 |
Watertruck |
12 |
Bucyrus |
8 |
Wheeldozer |
16 |
Hydraulic Shovel |
Komatsu |
2 |
Bulldozer |
16 |
Front End Loader |
Komatsu |
3 |
Cable Reeler |
10 |
Source: MEL (2022)
|
|
|
|
MEL_TRS_June 2022_Mike |
June 2022 |
|
|
SEC Technical Report Summary – Minera Escondida Limitada |
Page 167 |
Final pit outline of MEL’s open pits can be seen in Figure 13‑16.
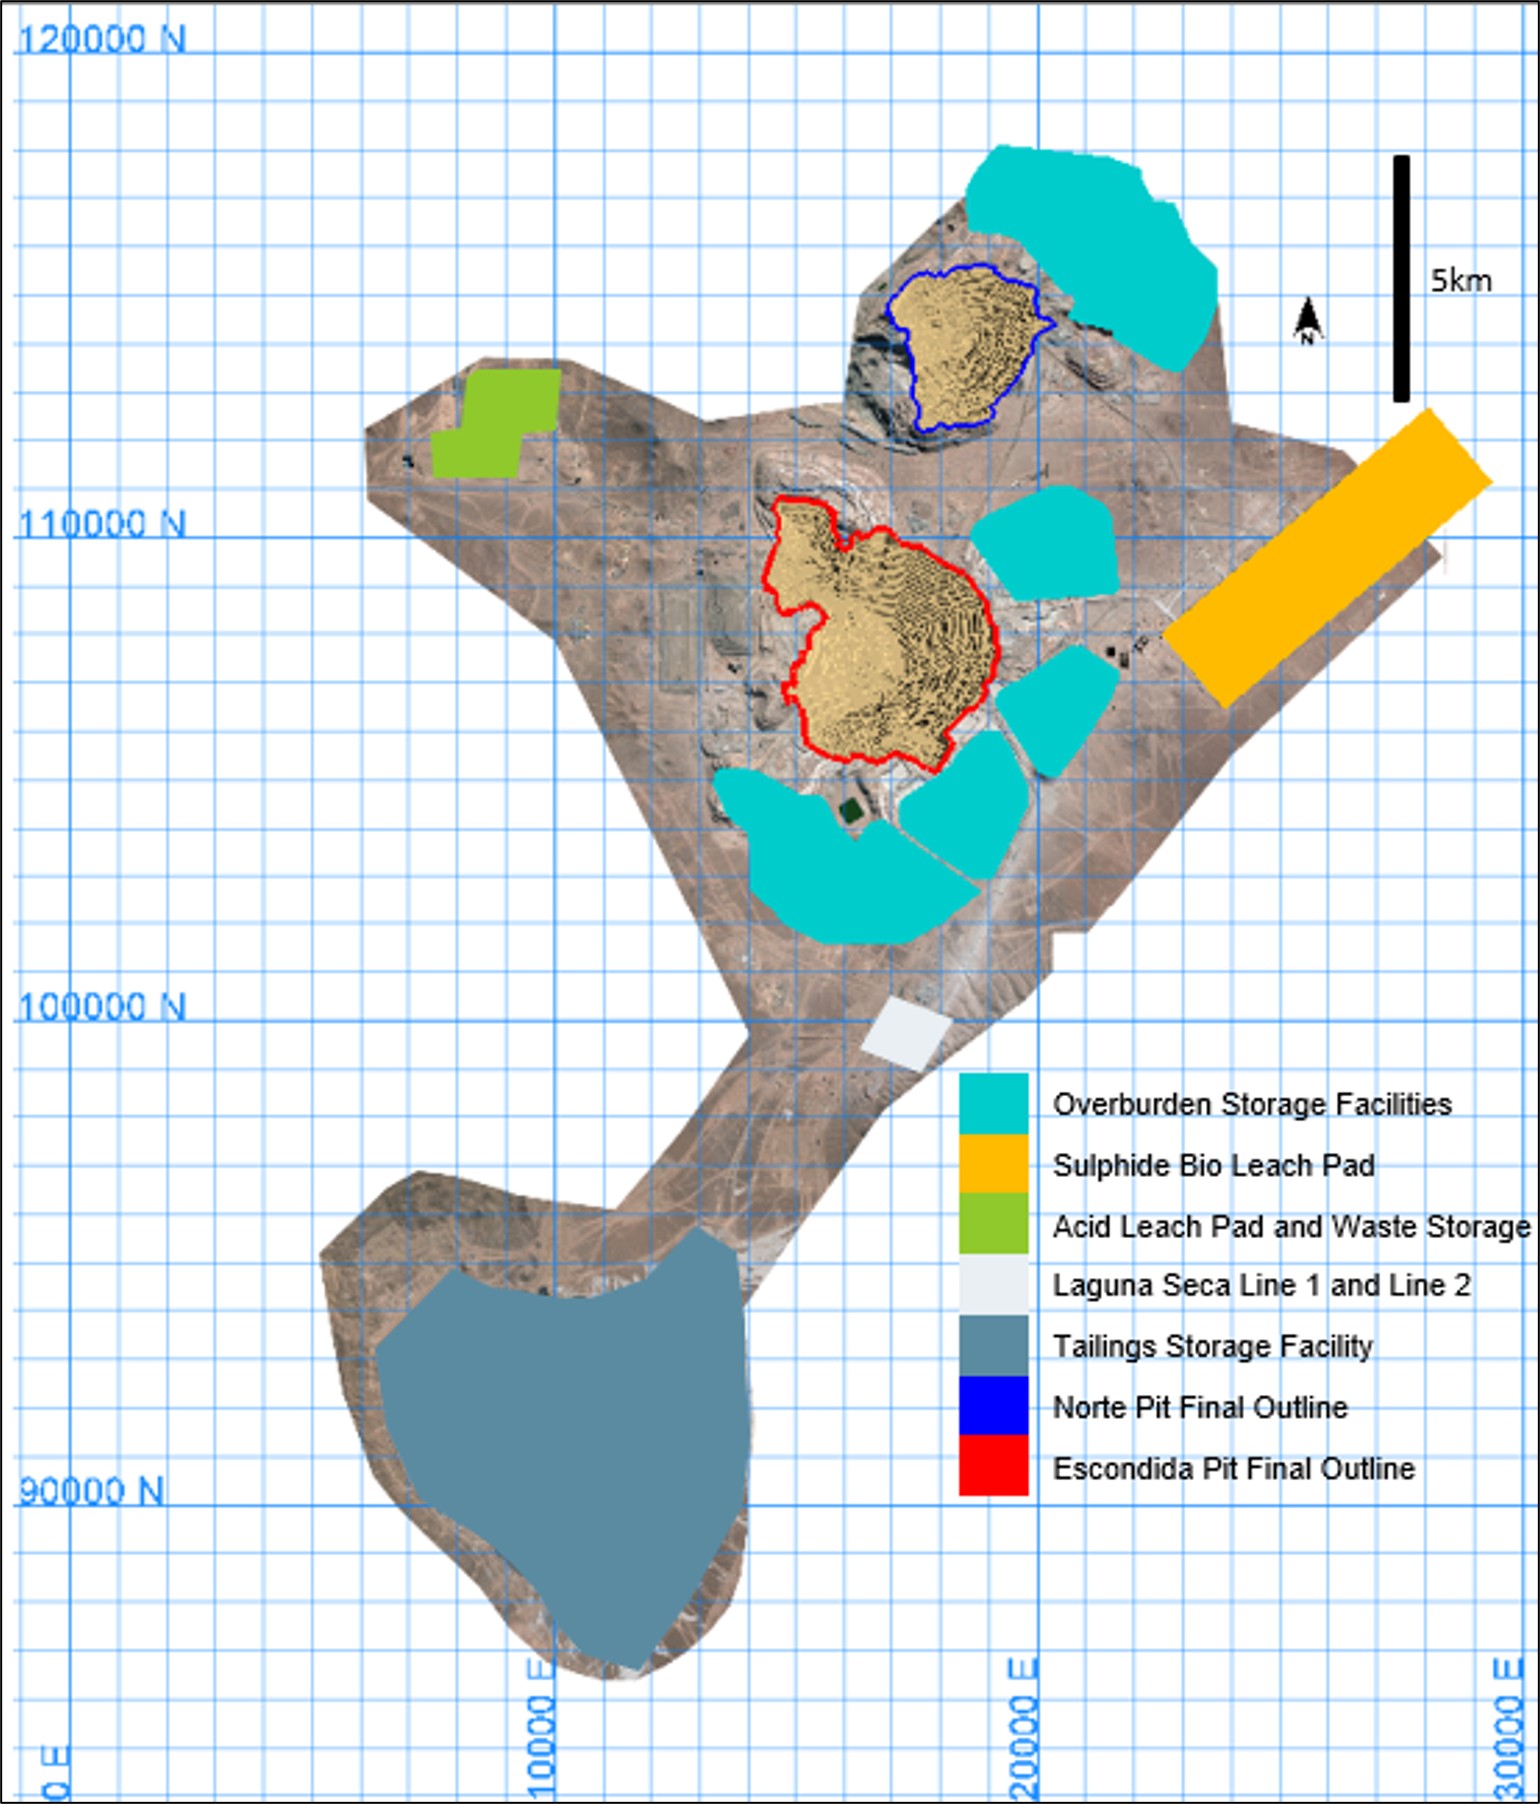
Source: MEL (2022)
Figure 13‑16: Final Pit outlines of the MEL mining operations
|
|
|
|
MEL_TRS_June 2022_Mike |
June 2022 |
|
|
SEC Technical Report Summary – Minera Escondida Limitada |
Page 168 |
14.Processing and Recovery Methods
The dominant type of copper mineral in both the Escondida and Escondida Norte deposits consists of copper sulphides: these sulphides are secondary (or enriched) sulphides such as chalcocite and covellite, along with the primary (or hypogene) copper sulphide chalcopyrite. In addition, there are lesser oxide copper minerals which include a range of copper bearing species such as brochantite, chrysocolla and antlerite. These copper mineralised species present an overall zonation that is related to the genesis of the deposits, as described in Chapter 6.
The copper oxides are generally soluble, or part soluble, in acidic solutions (sulphuric acid). In contrast, the copper sulphide species, particularly chalcopyrite, is refractory to acid solutions at ambient temperatures, with chalcocite being moderately soluble and covellite less soluble. This mixture of copper minerals, and distribution within the overall deposits, is typical of what are termed “Secondary Enriched Copper Porphyry”.
Because of the fundamental metallurgical response of this range of minerals, combined with the spatial distribution of general, but not pure, zones of the various copper minerals, the characteristics of the mineral resources have made it possible to define three main primary product lines:
•Concentration of supergene and hypogene sulphides by grinding and conventional froth flotation to produce a copper rich sulphide concentrate. Over time within the operation, sulphide concentration has moved from secondary sulphides to hypogene sulphides.
•Acid leaching of crushed oxide minerals (“heap” leaching) to then produce copper cathodes by solvent-extraction and electro-winning (SX-EW).
•A third process, which is also leaching but uncrushed material in “run of mine” (ROM) pads, employs acid bioleaching of lower grade secondary sulphide material that is below sulphide concentrator cut-off, which also produces copper cathodes SX-EW.
MEL receives economic benefits from the gold and silver recovered in copper concentrate as by-products. When present, these by-product metals are not recovered in leaching process.
The company's basic infrastructure comprises two open-pit mines, three concentrator plants (comprising milling, grinding, flotation and thickening), an acid heap leach pad facility (on/off heap leach - oxides), a ROM bioleach pad facility (permeant dump leach - sulphides) and a solvent-extraction and electro-winning plant producing copper cathodes from both leach facilities.
Copper concentrate is transported through two pipelines to the filtration plant, located at the coast in Coloso port, where it is loaded for shipping to end customers. The copper cathodes are transported to the Antofagasta port of Mejillones from where they are shipped to customers (Figure 14‑1). In terms of metal tonnes, the copper contained in concentrate represents approximately 70 % of sales while the copper cathodes production represents approximately 30% of sales. This ratio changes over the life of mine.
14.2.Plant Throughput and Design, Equipment Characteristics and Specifications
The main objective of the primary crushing stage is to generate particles of suitable size and shape to enables the material handling on conveyor belts that feed the stockpiles for the processes.
In the case of high grade sulphides, mixed and oxides the blasted ore is transported by trucks to the primary crushers. Low grade sulphides, under the cut-off for concentrators, goes to Bioleaching process which receives only run-of-mine blasted ore. A general flowsheet for the primary crushers which feed
|
|
|
|
MEL_TRS_June 2022_Mike |
June 2022 |
|
|
SEC Technical Report Summary – Minera Escondida Limitada |
Page 169 |
concentrators is observed in Figure 14‑2, the specifications for main conveyor belts and ancillary equipment are presented in Table 14‑1 and Table 14‑2.
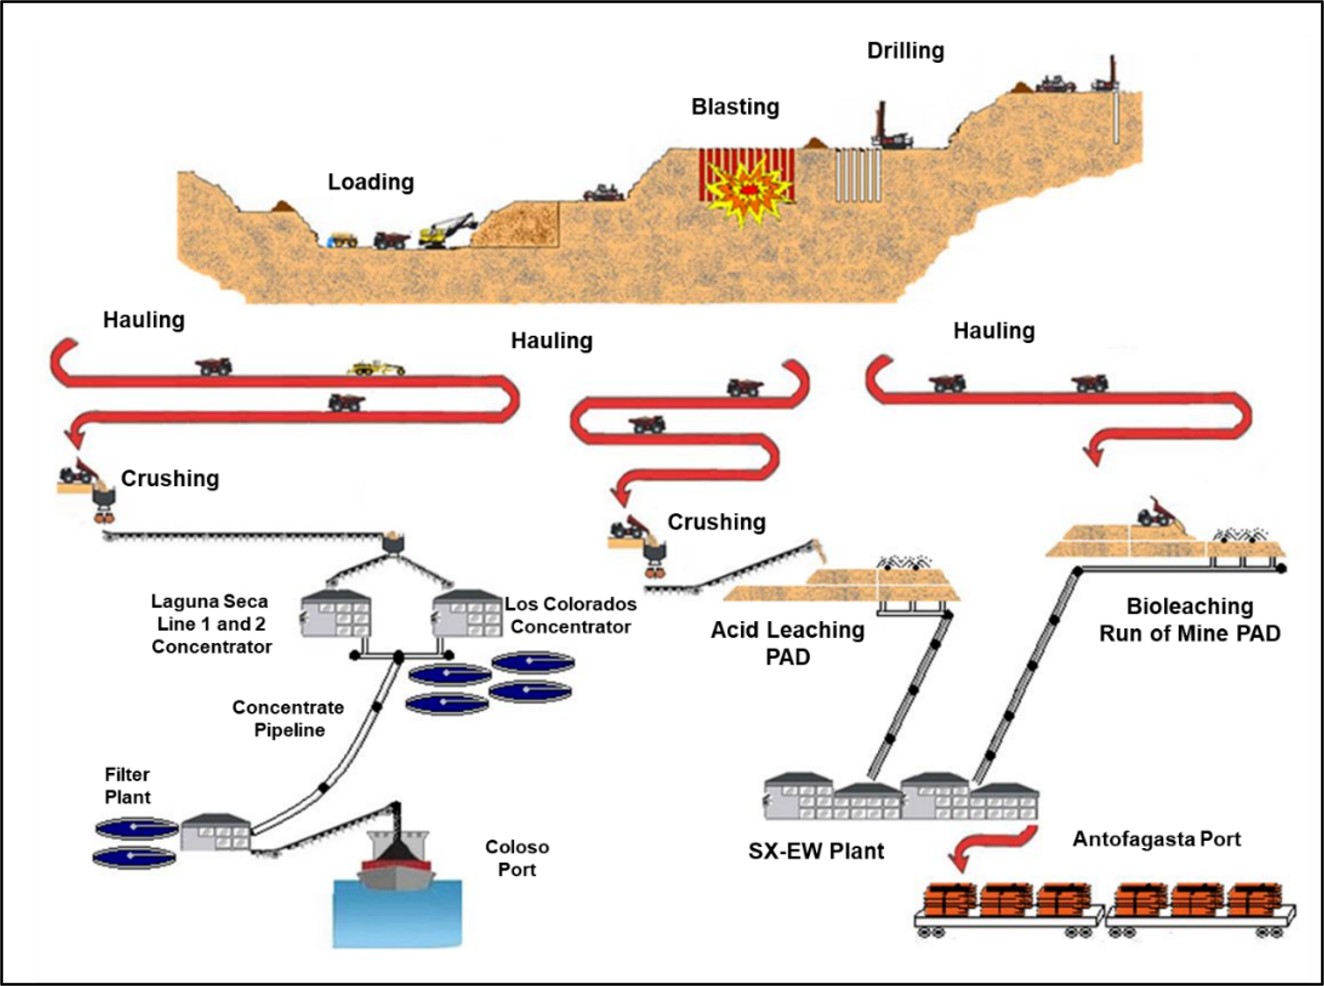
Source: MEL (2022)
Figure 14‑1: Schematic of MEL Infrastructure
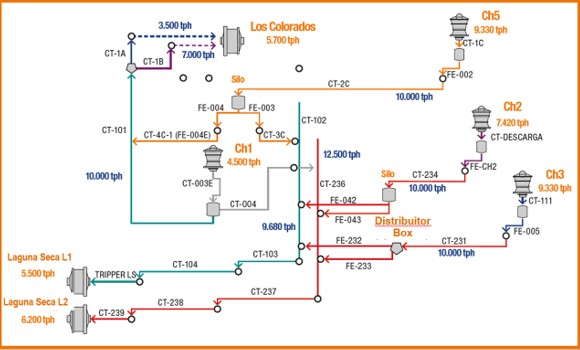
Source: MEL (2022)
Figure 14‑2: Primary Crusher System for Concentrators
|
|
|
|
MEL_TRS_June 2022_Mike |
June 2022 |
|
|
SEC Technical Report Summary – Minera Escondida Limitada |
Page 170 |
Table 14‑1: Primary Crushers Specifications
|
|
|
|
|
|
|
Equipment |
Manufacturer |
Specification
(inches) |
Capacity
(tph) |
Power
(HP) |
Ore-Type
Treated |
Ore-Type / Possible Destination |
Crusher 1 |
Allis
Chalmers |
54x74 |
4,500 |
1,000 |
High-Grade
Sulphides |
Laguna Seca L1 |
Crusher 2 |
Fuller |
60x89 |
7,420 |
1,000 |
High-Grade
Sulphides |
Los Colorados, Laguna Seca L1,
Laguna Seca L2 |
Crusher 3 |
Fuller |
60x113 |
9,330 |
1,000 |
High-Grade
Sulphides |
Los Colorados, Laguna Seca L1,
Laguna Seca L2 |
Crusher 4 |
Fuller |
60x89 |
5,000 |
1,000 |
Oxides |
Secondary Crushing at Acid Leaching |
Crusher 5 |
Fuller |
60x113 |
9,330 |
1,000 |
High-Grade
Sulphides |
Los Colorados, Laguna Seca L1 |
Source: MEL (2022)
Table 14‑2: Conveyor Belts and Equipment Specifications at Primary Crushing System
|
|
|
|
|
Area |
Equipment |
Width (mm) |
Length (m) |
Capacity (tph) |
Crusher 1 |
Crusher |
|
|
4,500 |
CT-Fino |
2,590 |
58 |
4,500 |
CT-Descarga |
2,438 |
90 |
4,500 |
CT-003 |
1,219 |
170 |
4,500 |
Crusher 2 |
Crusher |
|
|
7,420 |
CT-Descarga |
2,794 |
210 |
7,500 |
FE-3305 |
2,438 |
50 |
7,500 |
CT-234 |
2,200 |
632 |
11,000 |
FE-042 |
2,800 |
106 |
11,000 |
FE-043 |
2,800 |
121 |
11,000 |
Crusher 3 |
Crusher |
|
|
9,330 |
CT-111 |
3,150 |
275 |
11,000 |
FE-005 |
3,150 |
44 |
11,000 |
CT-231 |
2,200 |
556 |
11,000 |
CT-232 |
2,200 |
87 |
11,000 |
CT-233 |
2,200 |
107 |
11,000 |
Crusher 4 |
Crusher |
|
|
6,000 |
FE-005 |
2,438 |
45 |
6,000 |
CT-001 |
1,828 |
700 |
6,000 |
Crusher 5 |
Crusher |
|
|
9,330 |
CT-1C |
3,150 |
350 |
10,000 |
FE-002 |
3,150 |
44 |
10,000 |
CT-2C |
1,600 |
12,550 |
10,000 |
FE-003 |
3,150 |
44 |
9,000 |
CT-3C |
1,828 |
145 |
9,000 |
FE-004 |
3,150 |
44 |
10,000 |
CT-4C |
1,828 |
622 |
10,000 |
Overlands |
CT-102 |
1,600 |
7,600 |
9,300 |
CT-103 |
1,600 |
7,500 |
9,300 |
CT-104 |
1,600 |
3,950 |
9,300 |
New Overlands |
CT-236 |
1,800 |
7,075 |
12,500 |
CT-237 |
1,800 |
8,442 |
12,500 |
CT-238 |
1,800 |
4,005 |
12,500 |
CT-239 |
2,200 |
581 |
12,500 |
Source: MEL (2022)
14.2.2.Concentration Process Description
The main product of Minera Escondida Ltd. consists of copper contained in a concentrate of copper and iron sulphides. This is currently produced by three plants located at the mine site to include; 1), Los Colorados; 2), Laguna Seca Line 1; and 3), Laguna Seca Line 2, which collectively have a total nominal capacity of 413,700 tpd of ore Table 14‑3.
|
|
|
|
MEL_TRS_June 2022_Mike |
June 2022 |
|
|
SEC Technical Report Summary – Minera Escondida Limitada |
Page 171 |
Table 14‑3: Installed Capacity for Concentrators
|
|
|
|
|
Concentrator Plant |
Installed Capacity
(tpd) |
Run Time
(%) |
Nominal Capacity
(tpd) |
Commissioning
Year |
Los Colorados |
35,000
45,600
54,600
107,500
127,500 |
93.5 |
119,200 |
1990
1993
1994
1996
1998 |
Laguna Seca Line 1 |
135,000
150,000 |
95 |
142,500 |
2002
2012 |
Laguna Seca Line 2 |
160,000 |
95 |
152,000 |
2016 |
TOTAL |
|
|
413,700 |
|
Source: MEL (2022)
These run times are based on design criteria and were established by the process engineering considering vendor specifications. A general scheme for the concentration process is shown in Figure 14‑3. It was designed to process only sulphide ores and consists of the following stages:
•Coarse ore Stockpile receiving crushed ore from primary crushers.
•Primary grinding is undertaken in SAG mills, operating in closed circuit with pebble crushing systems.
•Secondary grinding is undertaken in ball mills, operating in closed circuit with hydrocyclones.
•Rougher flotation cells.
•Cleaner flotation cells, operating in closed circuit with a regrind circuit.
•Concentrate dewatering in conventional thickeners.
•Tailings dewatering in thickeners.
The coarse ore is sent to primary grinding circuit which uses SAG mills. The SAG mill reduces the size of the ore from an average feed size of 10 cm to a product of about 5 cm in size. Next, the material is classified, and the coarse particle fraction is sent to the pebble crusher, while the fine material is sent to conventional ball milling process, which finally produces a fine product, below 150 microns, which is the target for particle size for flotation feed. These stages are necessary to ensure that the valuable sulphide minerals are liberated from the silicate gangue rock. The grinding processes are similar in the three plants. Only equipment dimensions are different.
In the flotation stage, the different physicochemical properties between the valuable copper minerals and the gangue are used to produce the separation, incorporating a series of chemical reagents. When air is injected into the system, the copper sulphide particles adhere to the bubbles, producing a froth in the flotation separation process. The froth is copper concentrate. The particles that do not float are eliminated as tailings. These are silicates and other gangue minerals, which includes some iron sulphides.
Primary, or rougher flotation, aims to maximize the recovery of valuable mineral species. Cleaning flotation stages have the purpose of eliminating impurities and improving the copper grade in the concentrate to achieve the final product grade. The scavenger cells reduce the losses in cleaner tailings. There are minor differences in the configuration of the flotation circuits at the three plants.
|
|
|
|
MEL_TRS_June 2022_Mike |
June 2022 |
|
|
SEC Technical Report Summary – Minera Escondida Limitada |
Page 172 |
A simplified process flow diagram for the concentrators is included as Figure 14‑3 and shows the major equipment. In addition, an equipment list for the plants is provided in Table 14‑4.
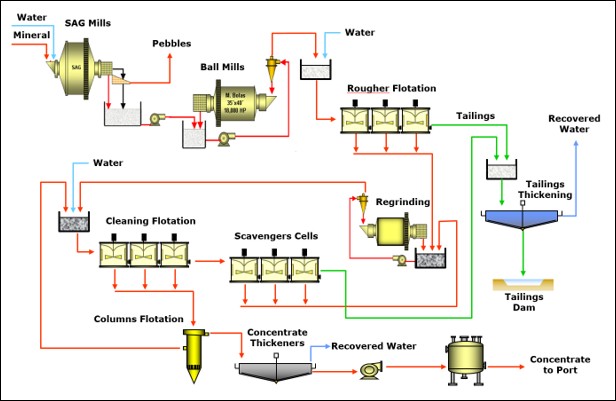
Source: MEL (2022)
Figure 14‑3: Schematic of MEL Concentrator Process
Table 14‑4: Main Equipment list for Concentrator Process
|
|
|
|
|
Concentrator |
Equipment |
Manufacturer |
Description |
Quantity |
Los Colorados |
Stockpile |
|
420,000 t Capacity 60,000 t Live |
1 |
Pebble Crusher |
Symons |
7 ft. Cone Short Head 750 HP |
2 |
SAG Mill |
|
Single Pinion 24’ x 14’ (D x EGL) Westinghouse 6,300 HP Installed |
2 |
SAG Mill |
|
Dual Pinion 36’ x 19’ (D x EGL) General Electric 19,440 HP Installed |
1 |
Ball Mill |
|
Single Pinion 18’ x 24.5’ (D x EGL) Westinghouse 5,500 HP Installed |
4 |
Ball Mill |
|
Single Pinion 20’ x 35’ (D x EGL) General Electric 9,000 HP Installed |
2 |
Ball Mill |
|
Dual Pinion 26.4’ x 36’ (D x EGL) General Electric 14,000 HP Installed |
1 |
Rougher Flotation Cells |
Outotec |
100 m³ Capacity |
80 |
Rougher Flotation Cells |
Outotec |
300 m³ Capacity |
10 |
Scavenger Flotation Cells |
Dorr-Oliver |
44 m³ Capacity |
130 |
Cleaner Columns |
Cominco |
4 x 4 x 15 m |
14 |
Regrinding Mill |
|
Single Pinion 14’ x 26.5’ (D x EGL) 2,750 HP Installed |
3 |
Concentrate Thickener |
Dorr Oliver |
52 m Diameter |
2 |
Tailing Thickener |
Dorr Oliver |
125 m Diameter |
4 |
Tailing Thickener |
EIMCO |
125 m Diameter |
1 |
Laguna Seca Line 1 |
Stockpile |
|
410,000 t Capacity 110,000 t Live |
|
Pebble Crusher |
Nordberg |
MP-1000 1,000 HP |
2 |
|
|
|
|
MEL_TRS_June 2022_Mike |
June 2022 |
|
|
SEC Technical Report Summary – Minera Escondida Limitada |
Page 173 |
|
|
|
|
|
Concentrator |
Equipment |
Manufacturer |
Description |
Quantity |
|
SAG Mill |
Fuller |
Gearless 38’ x 20’ (D x EGL) 26,000 HP Installed |
1 |
Ball Mill |
Fuller |
Gearless 25’ x 40’ (D x EGL) 18,000 HP Installed |
3 |
Ball Mill |
|
Gearless 26’ x 41.5’ (D x EGL) 21,000 HP Installed |
1 |
Rougher Flotation Cells |
Wemco |
160 m³ Capacity |
72 |
First Cleaner Flotation Cells |
Wemco |
160 m³ Capacity |
25 |
Cleaner – Scavenger Flotation Cells |
Wemco |
160 m³ Capacity |
20 |
Second Cleaner Flotation Column Cells |
|
Microcell 4.5 m Diameter |
10 |
Regrinding Mills |
|
Tower Mills 1,500 HP |
5 |
Concentrate Thickeners |
Delkor |
42.7 m Diameter |
2 |
Tailings Thickeners |
EIMCO |
125 m Diameter |
3 |
Laguna Seca Line 2 |
Stockpile |
|
297,000 t Capacity 146,000 t Live |
|
Pebble Crusher |
|
1,000 HP |
2 |
SAG Mill |
|
Gearless 40’ x 26’ (D x L) 32,200 HP Installed |
1 |
Ball Mill |
|
Gearless 26’ x 42.5’ (D x L) 21,000 HP Installed |
4 |
Rougher Flotation Cells |
Outotec |
300 m³ Capacity |
49 |
Scavenger Flotation Cells |
Outotec |
300 m³Capacity |
21 |
Rougher Column Flotation Cells |
|
Microcell 4.5 m Diameter |
7 |
Scavenger Column Flotation Cells |
|
Microcell 4.5 m Diameter |
5 |
Regrinding Mills |
|
Tower Mills 3,000 HP |
3 |
Concentrate Thickeners |
FLSmidth |
42.7 m Diameter |
2 |
Tailings Thickeners |
FLSmidth |
125 m Diameter |
3 |
Source: MEL (2022)
14.2.3.Oxide Leach Process Description
The oxide leach process has been designed to treat ore containing oxide minerals following the traditional flowsheet for heap leaching of copper ores. The battery limits of the process are the coarse ore stockpile and electro-winning with the metal production. The stages of the process are the following:
•Coarse ore reclaiming from stockpile receiving crushed ore from the mine.
•Secondary and tertiary crushing operating in closed circuit with screens.
•Agglomeration with sulphuric acid and water in tumbling drums.
•Stacking of the agglomerated ore in a dynamic heap.
•Irrigation using an acid solution operating in closed circuit with a solution treatment plant denominated solvent extraction (SX).
•Transferring of the dissolved copper contained in the output solution to a cleaned solution using selective solvents.
•Transformation of the dissolved copper in metal using electric energy through an electrolytic process called electrowinning (EW).
•Spent ore disposal in waste dump called a ripios dump.
|
|
|
|
MEL_TRS_June 2022_Mike |
June 2022 |
|
|
SEC Technical Report Summary – Minera Escondida Limitada |
Page 174 |
The process starts with the coarse ore reclamation from the stockpile. The ore is then transported to the crushing plant where secondary crushers reduce the size of the ore from an average size of 100 mm to about 19 mm in diameter. The ore is transported to the tertiary crushing stage operating in closed circuit with screens. The final product from crushing must comply with the 80 % of the mass passing 19 mm. Next the crushed ore is agglomerated using concentrated sulphuric acid and water to increase dissolution kinetics of the copper species and to generate stability before irrigation.
The ore is stacked in the area in the form of a 6-metre-high heap and then a solution of sulphuric acid is used to irrigate the ore and dissolve the copper. The irrigation cycle is 150 days. The drainage solution containing the dissolved copper is treated in a solvent extraction plant (SX), where the objective is to remove impurities and produce a cleaned solution without other elements that can affect the following stages. Finally, the clean copper solution is pumped to a tank house where electrolyses is applied to transfer copper in solution to stainless steel plates, where the copper deposits in the form of metal. This is called electrowinning and the final product is copper cathodes.
The leached ore (ripios) are reclaimed using a bucket wheel excavator that uses an overland and series of mobile conveyors to transport the ripios out of the leach pad. Subsequently, a shiftable conveyor with tripper discharges the ripios on the spreader, which will finally deposit the waste material onto the ripios dump.
A simplified flow diagram for the process at oxide leach is included as Figure 14‑4 and shows the existing major equipment. In addition, an equipment list is provided in Table 14‑5.
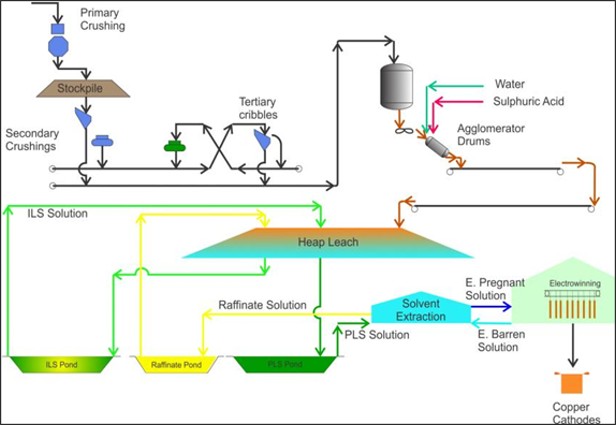
Source: MEL (2022)
Figure 14‑4: Schematic of MEL Oxide Leach Process
|
|
|
|
MEL_TRS_June 2022_Mike |
June 2022 |
|
|
SEC Technical Report Summary – Minera Escondida Limitada |
Page 175 |
Table 14‑5: Main Equipment List for Oxide Process
|
|
|
|
Area / Process |
Equipment |
Description |
Quantity |
Crushing |
Stockpile |
162,000 t Capacity, 56,000 t Live |
1 |
Secondary Crusher |
MP-1000, 1000 HP, Capacity 1,523 tph |
2 |
Secondary Screen |
Nominal Capacity 880 tph, Vibratory Double Deck |
2 |
Tertiary Crusher |
MP-1000, 1000 HP, Capacity 551 tph |
3 |
Tertiary Screens |
Nominal Capacity 609 tph, Vibratory Single Deck |
4 |
Agglomeration Drum |
Capacity 4,166 tph |
2 |
Stacking |
Conveyor Belt |
Capacity 5,250 tph (wet), length 27m,
width 60”, max. speed 3.9 m/s |
1 |
Overland Conveyor Belt |
Capacity 5,250 tph (wet), length 1,615m,
width 60”, max. speed 4 m/s |
1 |
Conveyor Belt |
Capacity 4,120 tph (wet), length 360m,
width 60”, max. speed 4 m/s |
1 |
Overland Conveyor Belt |
Capacity 4,120 tph (wet), length 1,018m,
width 60”, max. speed 4 m/s |
1 |
Overland Conveyor Belt |
Capacity 4,120 tph (wet), length 3,432m,
width 60”, max. speed 4 m/s |
1 |
Conveyor Belt |
Capacity 4,120 tph (wet), length 168m,
width 60”, max. speed 4 m/s |
1 |
Tripper |
length path 50 m, path speed 6 m/min |
1 |
Conveyor belt and stacking
mobile bridge |
Capacity 4,120 tph (wet), length 401m,
width 60”, max. speed 4 m/s |
1 |
Tripper |
length path 50m, path speed 6 m/min |
1 |
Stacking Belt |
Capacity 4,120 tph (wet), length 18m,
width 84”, max. speed 2.2 m/s |
1 |
Reclaiming |
Bucket Wheel Excavator |
Capacity 5,027 tph (wet),
wheel diameter 12 m |
1 |
Discharge conveyor belt |
Capacity 5,027 tph (wet), length 27m,
width 84”, max. speed 2.5 m/s |
1 |
Hoppers |
Capacity 5,027 tph (wet) |
2 |
Conveyor belt and discharge
mobile bridge |
Capacity 5,027 tph (wet), length 416m,
width 84”, max. speed 5 m/s |
1 |
Source: MEL (2022)
14.2.4.Bioleaching Process Description
The bioleaching process started operations in 2006. It was designed as a low-cost method to process low grade sulphides. Since this material is mined to access ore for the sulphide concentrators this material would be sent to marginal stocks or to waste dump. The bioleaching process realizes value from this this material. In general, the stages at the process can be described as:
•Transport of the run of mine (ROM) ore from the existing pits or stockpiles to the leach pads
•Stacking of the ore in a permanent heap.
•Irrigation using an acid solution operating in closed circuit with a solution treatment plant denominated SX.
•Transferring of the dissolved copper contained in the output solution to a cleaned solution using selective solvents.
•Transformation of the dissolved copper in metal using electric energy through an electrolytic process, EW.
The process involves the extraction of copper from ROM material with copper content above 0.25%, through bioleaching of the sulphide ore. The ore is placed in a permanent (static) leach pad with seven lifts of 18 m each one and irrigated with acid solution for more than 350 days. An aeration system is necessary to promote bioleaching process.
|
|
|
|
MEL_TRS_June 2022_Mike |
June 2022 |
|
|
SEC Technical Report Summary – Minera Escondida Limitada |
Page 176 |
In general, it is the leaching of sulphide minerals that distinguishes bioleaching from conventional acid leaching wherein only oxidised minerals are leached. Bioleaching involves the use of microorganisms to catalyse the oxidation of iron sulphides to create ferric sulphate and sulphuric acid. Ferric sulphate, which is a powerful oxidising agent, then oxidizes the copper sulphide minerals and the copper contained is then leached by the sulphuric acid formed.
The key factors for successful leaching in all the sulphide oxidation reactions are:
•The presence of ferric iron, supplied in part by the pyrite and chalcopyrite but much more importantly regenerated from the ferrous iron by bacterial action.
•The presence of oxygen supplied by the forced aeration system.
•The presence of acid, supplied in part by oxidising pyrite but also from the irrigation liquors fed to the dump.
Without these three components, namely bacteria, oxygen and acid, the leaching process is not effective.
Copper is then recovered from pregnant leach solutions via dedicated facilities for SX and EW. The sulphide leach maximum irrigation capacity is 16,500 cubic metres per hour (m³/h).
A simplified flow diagram for the process at low grade sulphides leaching is presented as. Figure 14‑5 the existing major equipment, in addition an equipment list is provided in Table 14‑6.
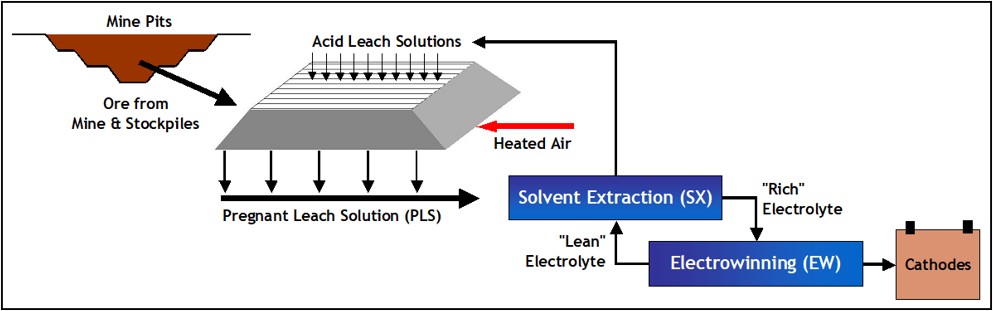
Source: MEL (2022)
Figure 14‑5: Schematic of MEL Bioleach Process
Table 14‑6: Main Equipment List for Bioleaching Process
|
|
|
|
Area / Process |
Equipment |
Description |
Quantity |
Leaching |
Fans Aeration |
Pressure 15.5 KPa e.a., Flow 1,720.000 A m3/h |
50 |
Raffinate Pumps |
Flow Rate 1,500 m3/h |
8 |
PLS Pumps |
Flow Rate 1,500 m3/h |
7 |
Heat Exchangers |
6,000 kW e.a., Flow Rate 300 m3/h |
2 |
Solvent Extraction |
Organic Cyclone |
Flowrate 4.5 m3/h |
1 |
Recovered Organic Tank |
Capacity 6 m3 |
1 |
Ponds |
PLS |
Capacity 108,000 m3 |
1 |
Raffinate |
Capacity 108,000 m3 |
1 |
Source: MEL (2022)
|
|
|
|
MEL_TRS_June 2022_Mike |
June 2022 |
|
|
SEC Technical Report Summary – Minera Escondida Limitada |
Page 177 |
14.3.Requirements for Energy, Water, Process Materials, and Personnel
The following sections describe the requirements for energy, water, processing and personnel.
MEL operations considers a stable power demand of 6,120 [MWh] until June 2028, after that the power demand will likely decrease by approximately 30% in response to the anticipated Los Colorados concentrator shutdown. In general terms, the main energy consumption is associated with the concentrator processes, followed by desalinated water pumping from the sea level to the mine site. The energy consumption distribution is presented in Figure 14‑6.
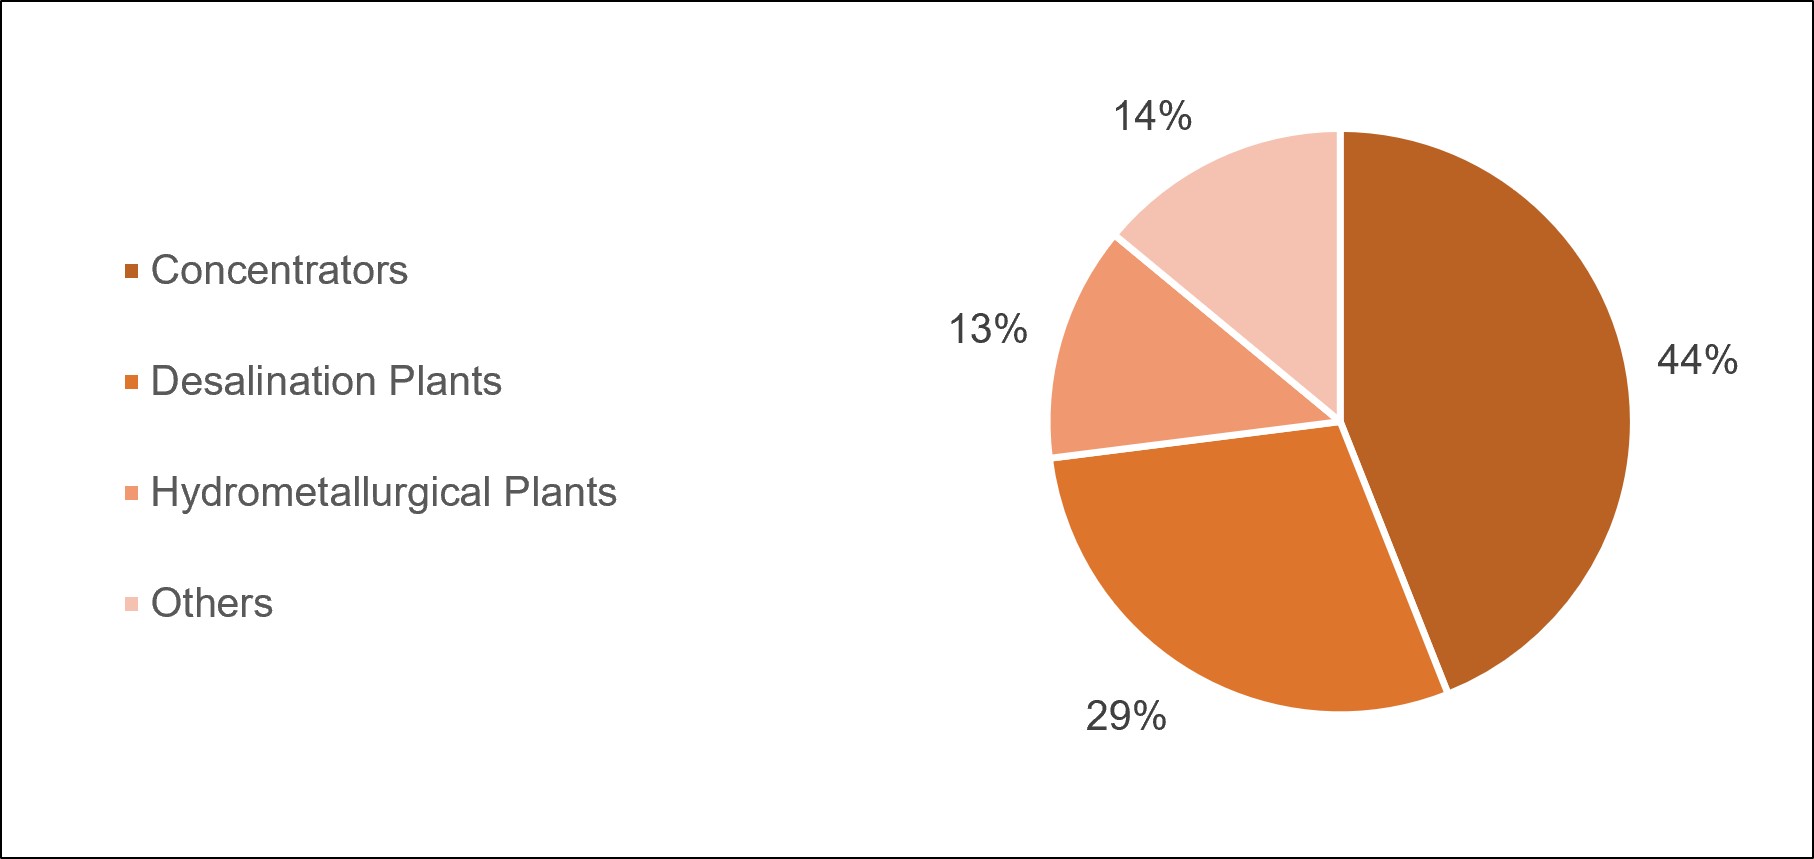
Source: MEL (2022)
Figure 14‑6: Energy Consumption Distribution at MEL
MEL operations has a total demand of water of over 4,500 litres/second. The water consumption in MEL site is driven by concentration process. The water supply for the processes is composed of two main sources; i), desalinated water which is pumped from the ocean to the mine site; and ii), recovered water from the dewatering processes at concentrators. The consumption distribution is show in Figure 14‑7. In the next decade it is expected that water demand will decrease 30 % because of the closure of both oxide leaching operation and Los Colorados concentrator
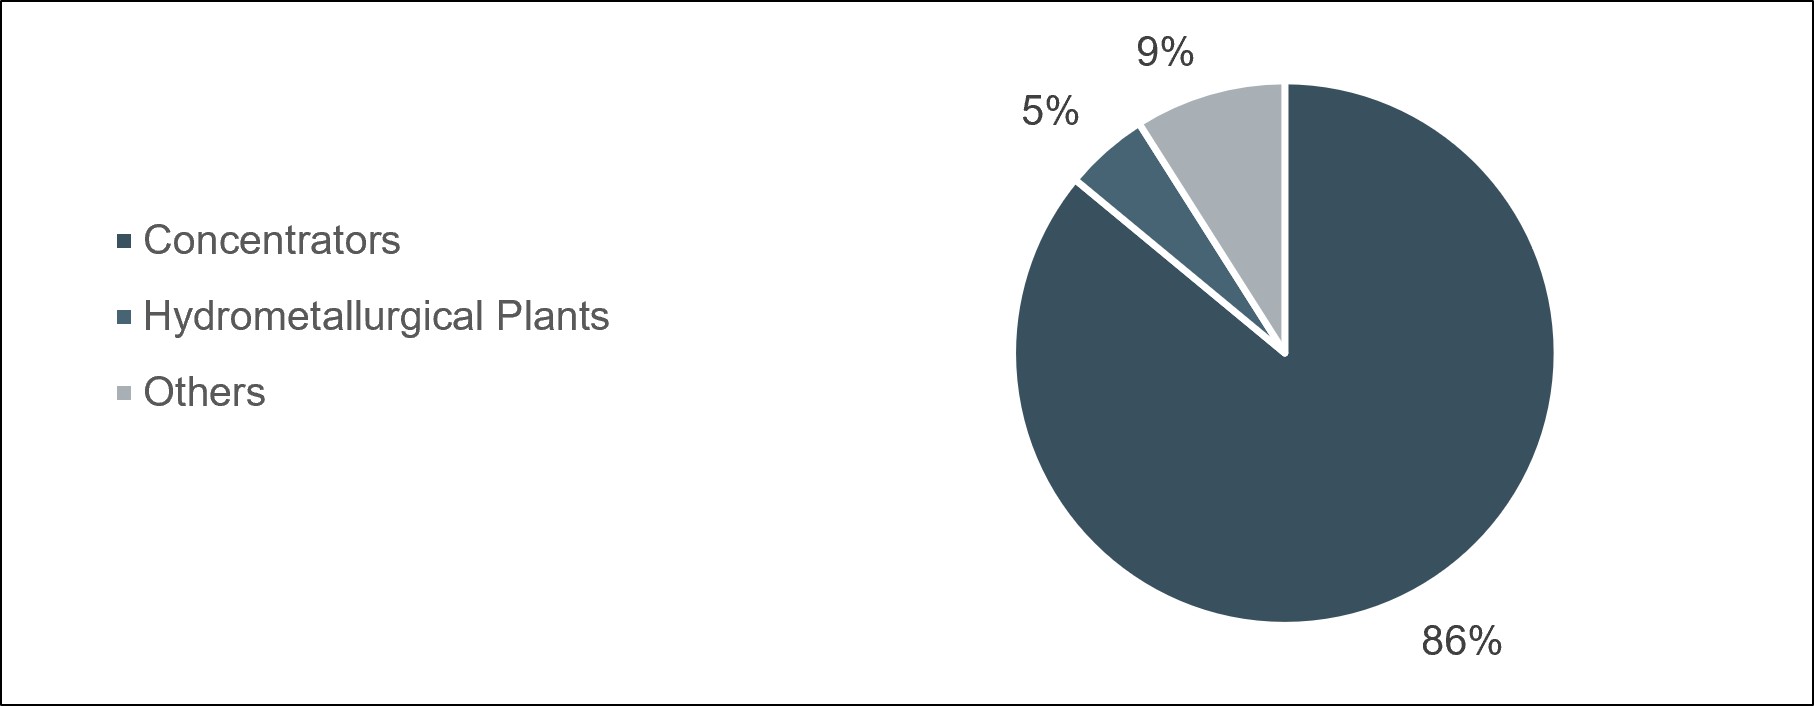
Source: MEL (2022)
Figure 14‑7: Water Demand Distribution at MEL
|
|
|
|
MEL_TRS_June 2022_Mike |
June 2022 |
|
|
SEC Technical Report Summary – Minera Escondida Limitada |
Page 178 |
The desalinated water represents the 70 % of the whole water supply. No water sourced from pumping of underground water is used for either mining or processing.
14.3.3.Suppliers for Process
The main materials used at the mine and the process are presented in Table 14‑7. The critical supplies are managed by long term contracts to mitigate low stock risk.
Table 14‑7: Main Materials used at the Mine and Process
|
|
Process |
Main Supplies |
Mine |
Tires, Fuel |
Concentrators |
Grinding balls, mill liners, lime, chemical reagents, replacement parts. |
Hydrometallurgical Plants |
Sulphuric Acid |
Source: MEL (2022)
Over the next 25 years in the base plan at MEL, total personnel (MEL & Contractors) are projected remain stable at 2021 levels. The estimated personnel ranges between 12,000 and 14,000 people because of spot contracts for shut-down maintenance. The personnel employed directly by MEL consists of approximately 3,800 people.
14.4.Novel Processing Methods
In the opinion of the Qualified Person the processing methods and practices are considered conventional for the industry standard. The process technology and equipment are widely proven in the industry to support long term mine plans for MEL and therefore limits the risk for reserves estimation.
|
|
|
|
MEL_TRS_June 2022_Mike |
June 2022 |
|
|
SEC Technical Report Summary – Minera Escondida Limitada |
Page 179 |
MEL has a company-owned infrastructure distributed over an extended area of the Antofagasta Region from port sites on the pacific coast to the mine site in the Andes. The infrastructure is required to support the magnitude of MEL’s operational activities: the extraction of waste and mineral from two mining open pits, the operation of three concentrator plants, two heap leaching processes with their cathode production plants, the operation of two seawater desalination plants and water pumping to mine site, a tailings deposit, along with support and service facilities. These are shown schematically in Figure 15‑1.
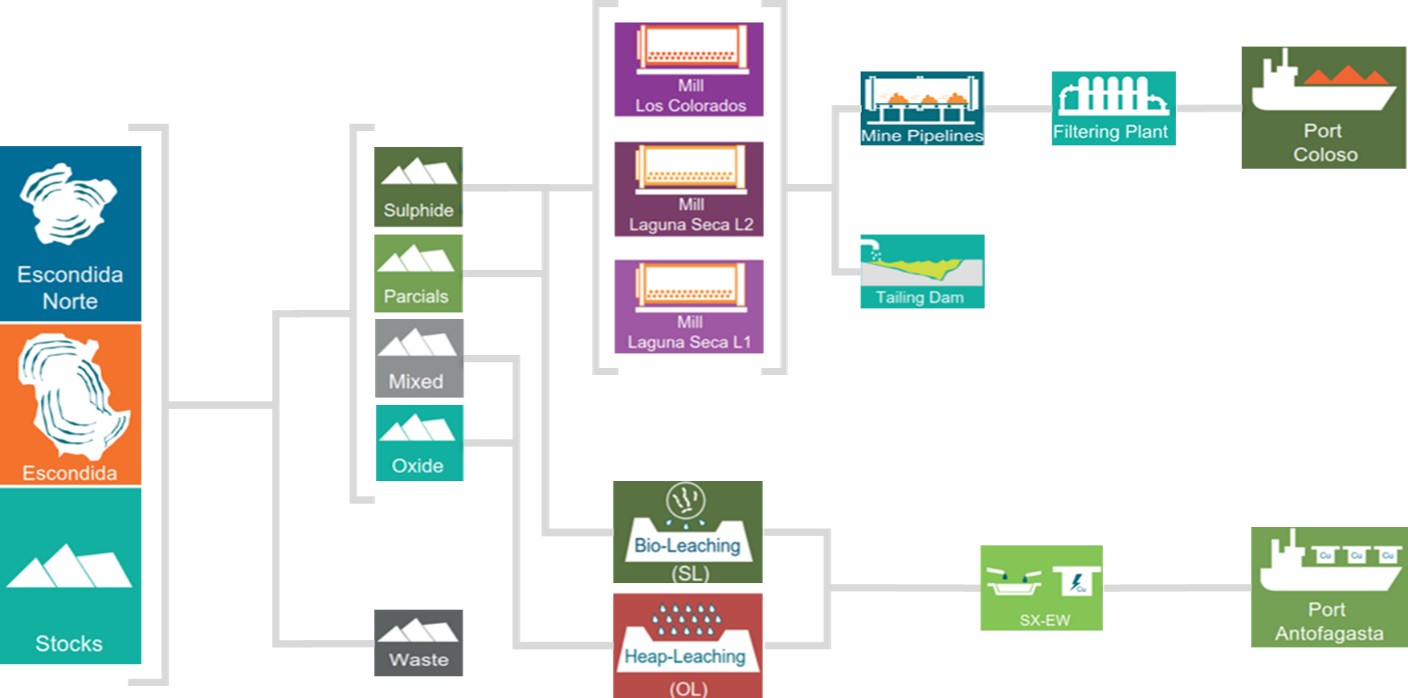
Source: MEL (2022)
Figure 15‑1: Schematic of MEL Operations
Table 15‑1 describes the principal value chain at MEL which is comprised of three major subsystems to include mine site, transportation and port, with seven process steps.
Table 15‑1: Overview of Major Subsystems at MEL
|
|
|
Mine site: |
Mineral |
1 |
Mining, including drill and blast, and load and haul |
2 |
Ore handling and transport to processing plants (including crushing and/or screening as required) and metallurgical processing |
|
Product: Concentrate |
Product: Cathode |
3 |
Concentrate stockpiled as slurry then pumped to port via pipeline |
Cathode packaged, stored, and loaded for rail transport to port |
Transport |
Product: Concentrate |
Product: Cathode |
4 |
Gravity driven transport of concentrate via pipeline to port |
Cathode by train to port |
Port |
Product: Concentrate |
Product: Cathode |
5 |
Concentrate collected, filtered and dried at port |
Unloaded and stored at port |
6 |
Stockpiled at Coloso Port |
Stockpiled at Angamos Port |
7 |
Direct ship loading to dedicated bulk carriers; |
Loaded to ship |
Source: MEL (2022)
Maps presented in this chapter use UTM WGS84 unless otherwise stated.
|
|
|
|
MEL_TRS_June 2022_Mike |
June 2022 |
|
|
SEC Technical Report Summary – Minera Escondida Limitada |
Page 180 |
MEL began construction in 1988, with an initial investment of US$836 M for the construction of general facilities, plant, port, and pipelines, and started operations in 1990. In 1991, it had a plant capacity of 35,000 tpd.
Subsequently, in 1993, with an investment of US$76, Phase I began, with an expansion to 45,000 tpd. Then, with an investment of US$ 261 million, Phase II began in 1994; and over the next ten years, Phases III, III1/2 and IV were developed, reaching 230,000 tpd in 1993.
MEL's operating process begins with the extraction of materials from the Escondida and Escondida Norte deposits using conventional open-pit mining techniques. Extraction includes waste materials and ores.
After fracturing the rock with controlled blasting, the removed material is loaded by electromechanical shovels onto trucks and transported to processing plants in the case of high grade ore, to sulphide leaching heaps in the case of low grade sulphide ores, or to authorised dumps in the case of waste.
The sulphide ores are processed in three concentrator plants: Los Colorados, located near the Escondida pit, Laguna Seca Lines N°1 and N°2, located some 17 km south of the Escondida pit. The valuable mineralisation is separated from the waste rock through the flotation concentration process, generating copper concentrate as the final product. The waste or residue from the concentration process is taken to the tailings deposit known as the Laguna Seca tailings dam.
The copper concentrate is transported as a pulp with 65% solids through two 170 km long pipelines to the Coloso Port sector, located on the coast south of Antofagasta, where it is filtered until it reaches a humidity of around 9%, and then placed in stockpiles until it is shipped from the port on bulk carriers. Some minor amounts of concentrate is loaded onto trucks and transported by road to other ports or to national smelters.
The oxidised ores are processed through a sequence of leaching, SX, and EW processes. The process begins with crushing and agglomeration of the ore, which is then deposited on large heaps where it is irrigated with sulphuric acid solutions to dissolve the copper present.
In addition, low-grade sulphide ores are processed through a sequence of bioleaching, solvent extraction (SX), and EW processes. The process begins by transporting these materials directly from the mine and depositing them in giant heaps, where they are irrigated with sulphuric acid solutions and treated with bacteria at a certain temperature, which dissolve the copper contained in these minerals.
The recovery of copper from the solutions emanating from the leaching heaps, both oxides and sulphides, is carried out by selective extraction using specific organic compounds (SX), obtaining a solution enriched in copper after a re-extraction process. Finally, by EW, the dissolved copper is deposited on stainless steel plates that constitute the copper cathodes. These cathodes reach an approximate weight of 78 kg with a purity of 99.999% and are transported by rail to the port of Antofagasta or Mejillones for subsequent shipment to the international market.
The operational infrastructure also includes all the facilities associated with production support services and the supply of inputs, such as electrical energy transmission systems at different thickness levels, desalinated, drinking and recovered water supply systems, camps, warehouses and buildings, administrative offices, and access and internal roads among many other complementary facilities.
The main existing infrastructures in the sectors where operations and support activities are carried out for MEL are:
|
|
|
|
MEL_TRS_June 2022_Mike |
June 2022 |
|
|
SEC Technical Report Summary – Minera Escondida Limitada |
Page 181 |
•Crushers and Conveyors Belts
•Sulphide ore concentrator plants: Los Colorados and Laguna Seca Lines N°1 and N°2
•Copper Concentrate Transport Systems (Pipelines)
•Tailings transport systems (Relay pipelines)
•Copper Concentrate Filtration Plant (Punta Coloso)
•Copper concentrate shipping facilities (Coloso port)
•Reclaimed water transport and storage systems
•Tailings deposits: Hamburgo and Laguna Seca
•Oxidised ore leaching heaps
•Heap leaching of low-grade sulphide ores
•Crushers and conveyor belts
•Supply and support facilities:
•Industrial water supply systems (desalinated water)
•Seawater desalination plants (Coloso sector)
•Drinking water treatment plants
•Wastewater treatment plants
•Electricity supply systems, consisting of substations, transmission lines, electrical rooms and service roads.
•Waste storage facilities
•Fuel storage and distribution systems
•Explosive’s storage and preparation
•Warehouses and workshops:
•Access roads and internal connections
|
|
|
|
MEL_TRS_June 2022_Mike |
June 2022 |
|
|
SEC Technical Report Summary – Minera Escondida Limitada |
Page 182 |
The location of MEL's main existing facilities is presented in Figure 15‑2.
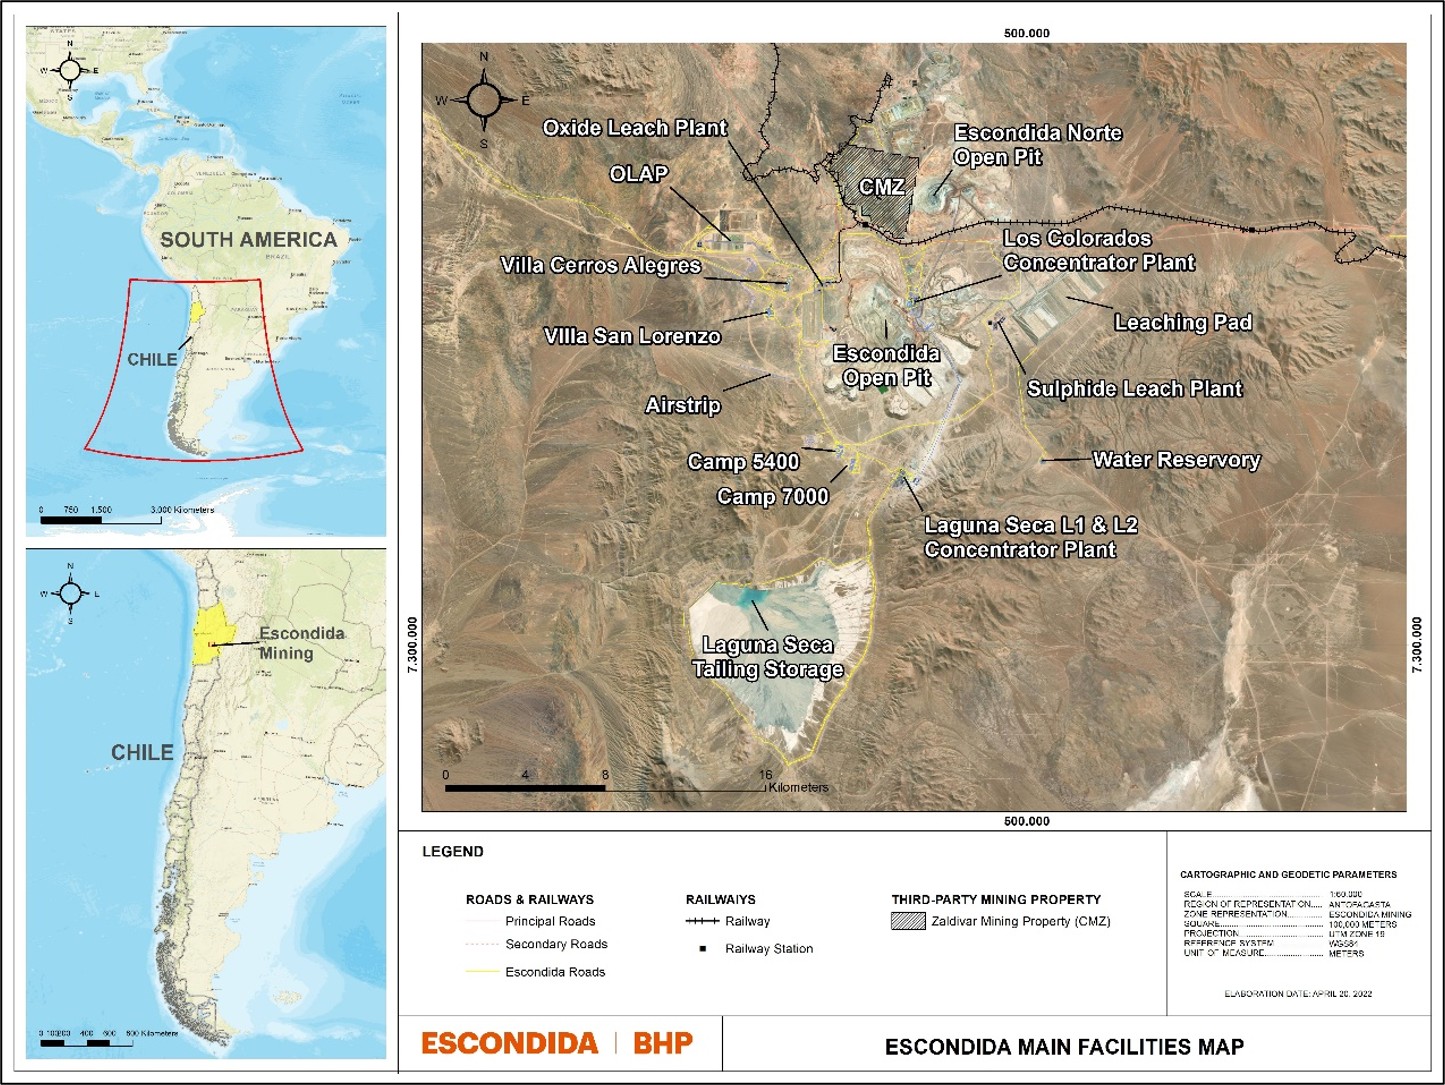
Source: MEL (2022)
Figure 15‑2: MEL's Main Facilities
MEL is an important user of the existing railways in the Antofagasta Region for the transport of copper cathodes to the port of Antofagasta and Mejillones, as well as for the transport of sulphuric acid from ports to the mine site, where it is stored in tanks for later use. To transport cathodes and sulphuric acid, MEL has transport service contracts with the main railway companies that own the railways, such as Ferrocarril de Antofagasta a Bolivia (FCAB) or Empresa de Transportes Ferroviarios S.A. (Ferronor). Ferronor, in addition to owning the railway track and railway stations, among others, owns the section that goes from Augusta Victoria Station to Socompa, which crosses the Pinta Verde sector. Ferronor also owns the surface land along the railway track, whose width varies between 50 m for sectors of relatively flat relief, up to 100 m wide for those sectors with steep topography. These distances are measured from the axis of the railway track (Figure 15‑3).
MEL owns only a small railway line that connects the Cathodes Plant with the railway line that runs from Augusta Victoria to Socompa, and which connects with the railway line owned by Ferronor in the sector called Adolfo Zaldívar Station. This railway line has a length of 4.1 km and can be seen in Figure 15‑3.
|
|
|
|
MEL_TRS_June 2022_Mike |
June 2022 |
|
|
SEC Technical Report Summary – Minera Escondida Limitada |
Page 183 |
It should be noted that the gauge of the railway tracks is 1.0 m and that, apart from the rail convoys that transport the cargoes of mining companies such as MEL, or CMZ, rail traffic in the region for other products has been quite scarce and sporadic for many years.
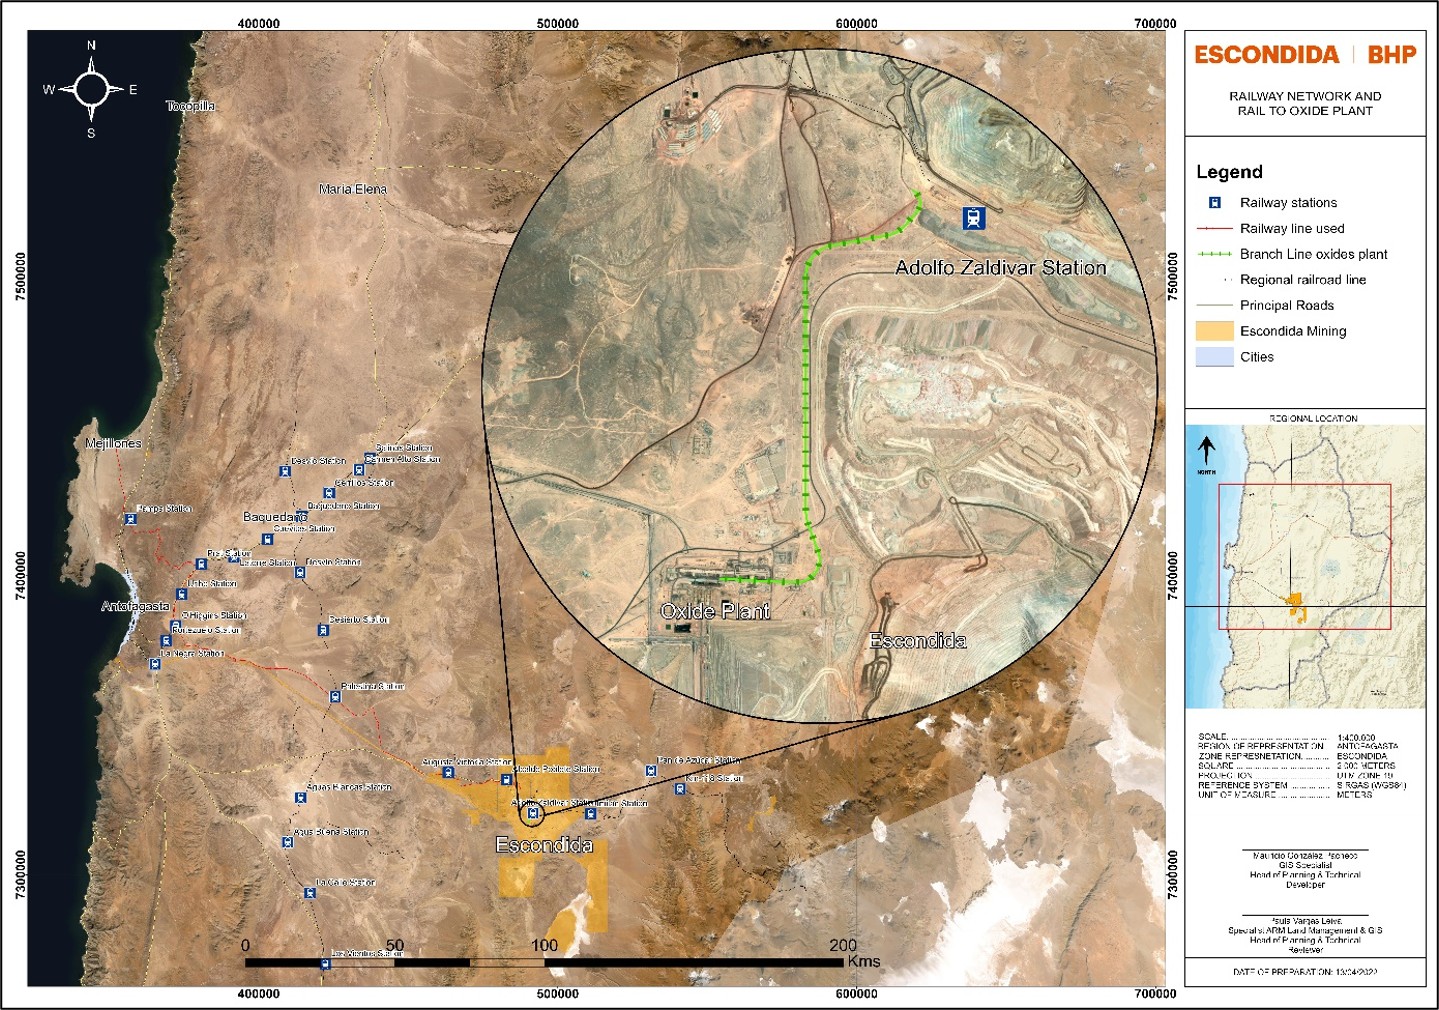
Source: MEL (2022)
Figure 15‑3: Regional Railway Scheme
MEL has an access road approximately 150 km long, which connects the mine with the main public roads in the Antofagasta Region. In the vicinity of Antofagasta city, in the sector known as La Negra, it joins with Route 5, which is one of the main longitudinal routes in the country, and with Route B-28, which connects with the city of Antofagasta (Figure 15‑4).
The access road is owned by MEL and its layout is within its mining easements. It connects the Coloso Port with the mine. MEL is fully responsible for its maintenance, applying high standards in terms of vehicular traffic, in accordance with the regulations in force in Chile to ensure the safe movement of people, vehicles and supplies. This road allows the movement of MEL personnel and collaborating companies, as well as the transport of various supplies, equipment and components required for the operation of the mines, plants, camps and other operating units. In the same way, this road is the main artery for the transport to their final disposal sites of all discarded materials, components to be repaired and other industrial waste that cannot remain in the operational areas.
For access to the port and facilities of Coloso, the main connection route is Route B-1, also known as the coastal route, as it provides a link to all the coastal cities located to the north, such as Antofagasta, Mejillones, Tocopilla and Iquique.
|
|
|
|
MEL_TRS_June 2022_Mike |
June 2022 |
|
|
SEC Technical Report Summary – Minera Escondida Limitada |
Page 184 |
Another public road of alternative use to access the different MEL facilities is the international road Route B‑55, which also connects with the Republic of Argentina, and whose roadway is not paved. The importance of this road is that part of its route divides the Escondida and Escondida Norte deposits, and for MEL's mining vehicles to cross it, special permits must be obtained and kept in force with the Roads Department for the crossing of this route by mining equipment with overweight and overwidth.
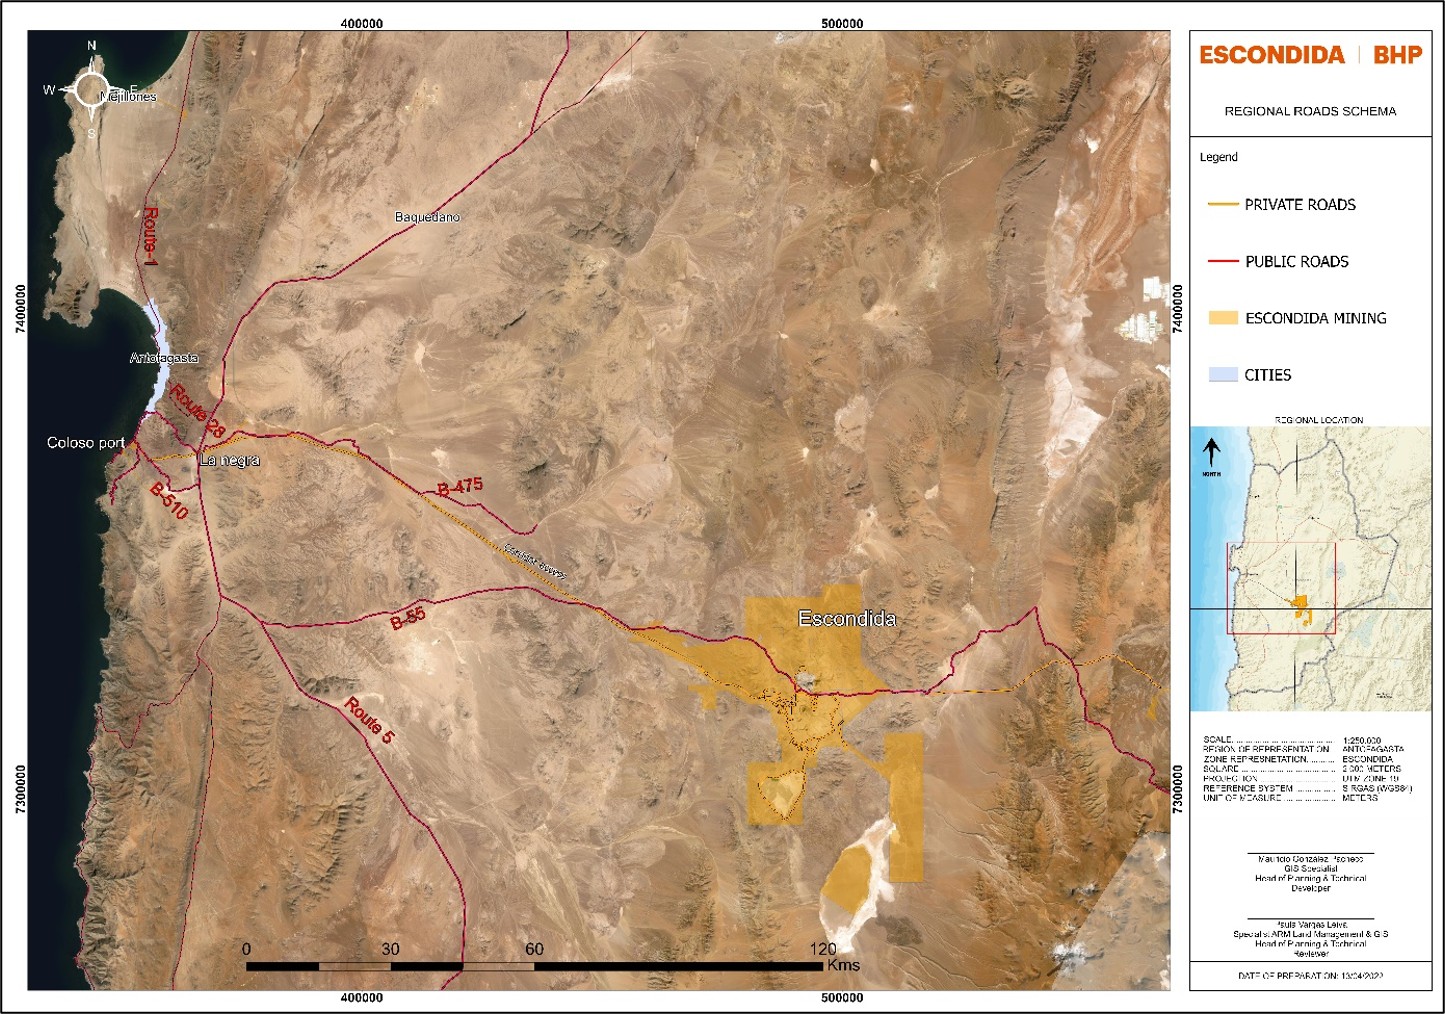
Source: MEL (2022)
Figure 15‑4: Regional Roads Schema
Within the operational area, there are more than 275 km of internal roads, of which approximately 85 km are paved. These roads connect the various camps with the mining areas, processing plants and other industrial areas, such as the Laguna Seca dam, sulphide and oxide leaching heaps. This number of kilometres does not include the roads to the well fields of Salar de Punta Negra and Monturaqui, whose operation is currently halted, and their facilities are not in use.
In general, the existing roads, both internal and access roads, have two lanes in both directions and have a 7‑m wide roadway. In addition, the access road and paved roads have a 1-m wide berm. In terms of traffic safety measures, the current regulations of the Roads Directorate are fully complied with, which MEL has also complemented by implementing standards to reinforce traffic safety, which apply to both people and all types of vehicles travelling on these roads.
|
|
|
|
MEL_TRS_June 2022_Mike |
June 2022 |
|
|
SEC Technical Report Summary – Minera Escondida Limitada |
Page 185 |
The concentrate is pumped from the concentrator tanks via 2 pipelines, 6 inches and 9 inches, each with valves stations down the way to Antofagasta (Figure 15‑5).
Both pipelines end in low density tanks that receive the concentrate and pump it into the thickening process to increase solids percentage and feed the filter plant (Figure 15‑6).
Six vertical cloth filters operate by mechanic method generating a water elimination process to be able to achieve 9% solids. Filters discharge in conveyor belts that go all the way up to the top of the stockpile where it is discharged into the loading area. Transporters conduct the dry concentrate into the port area from where the concentrate is deposited into the vessels holds.
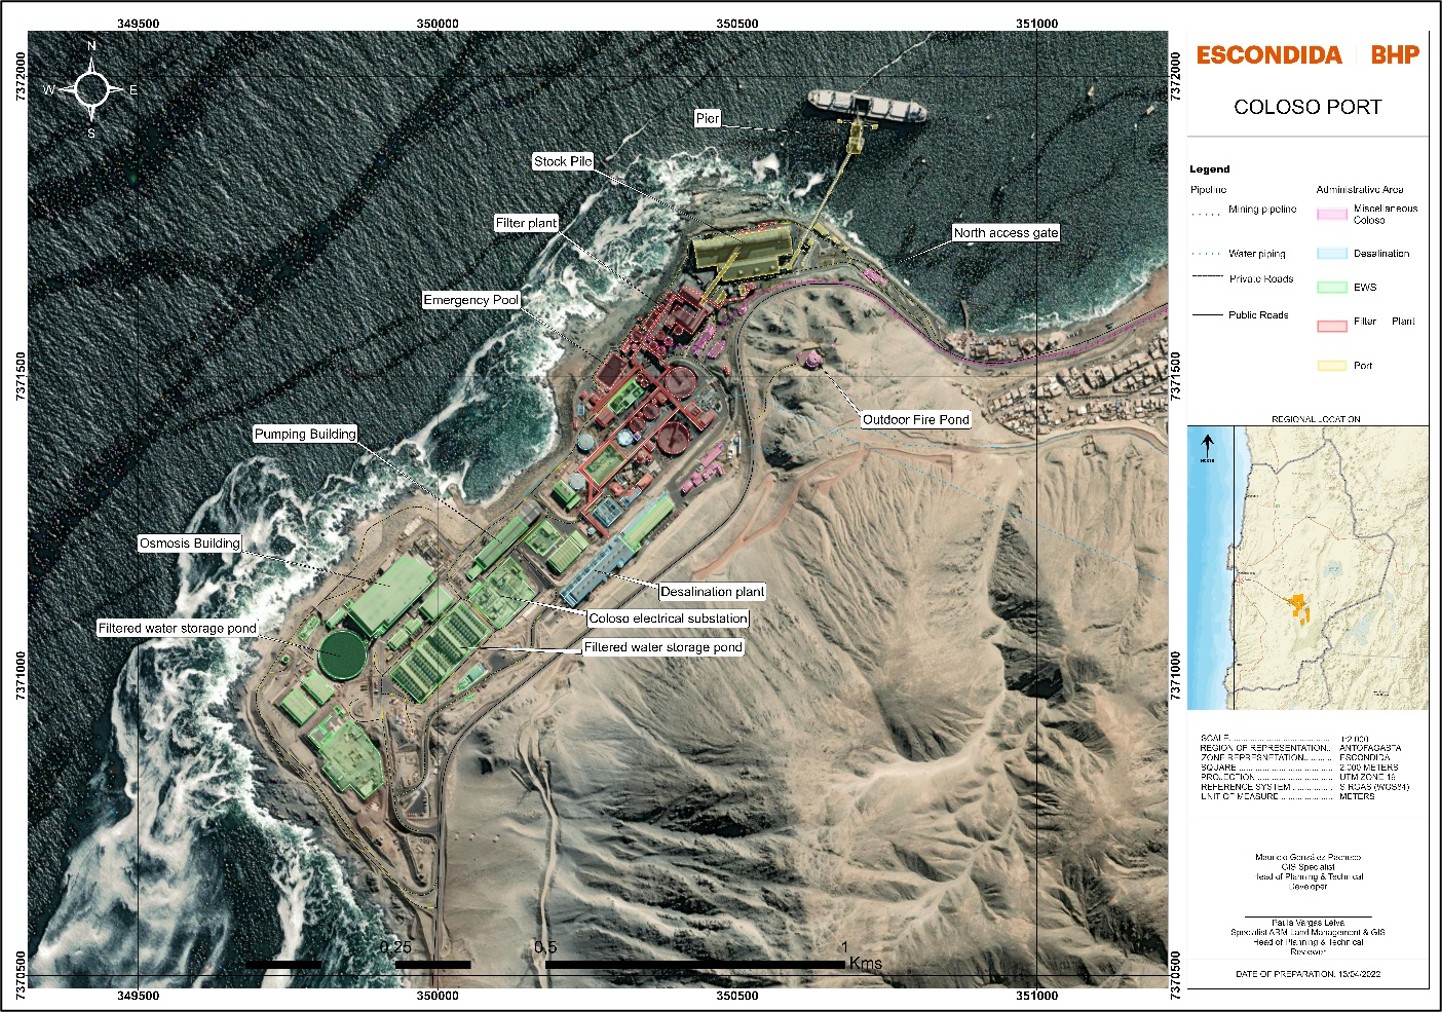
Source: MEL (2022)
Figure 15‑5: Coloso Port
|
|
|
|
MEL_TRS_June 2022_Mike |
June 2022 |
|
|
SEC Technical Report Summary – Minera Escondida Limitada |
Page 186 |
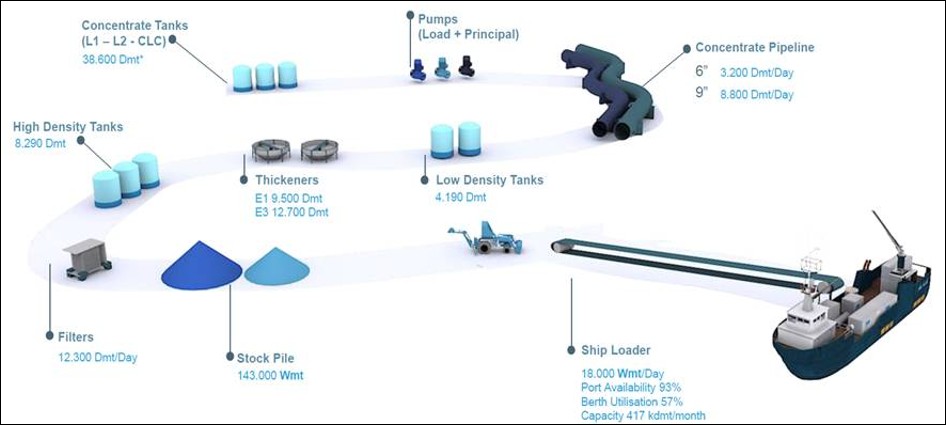
Source: MEL (2022)
Figure 15‑6: Coloso Port Process Schematic
The Laguna Seca tailings deposit became operational in 2002. It is located in a small intermontane basin in the Domeyko mountain range, about 15 km southeast of the Escondida pit and 170 km southeast of the city of Antofagasta. This deposit stores tailings from the three concentrator plants currently in operation (Figure 15‑7).
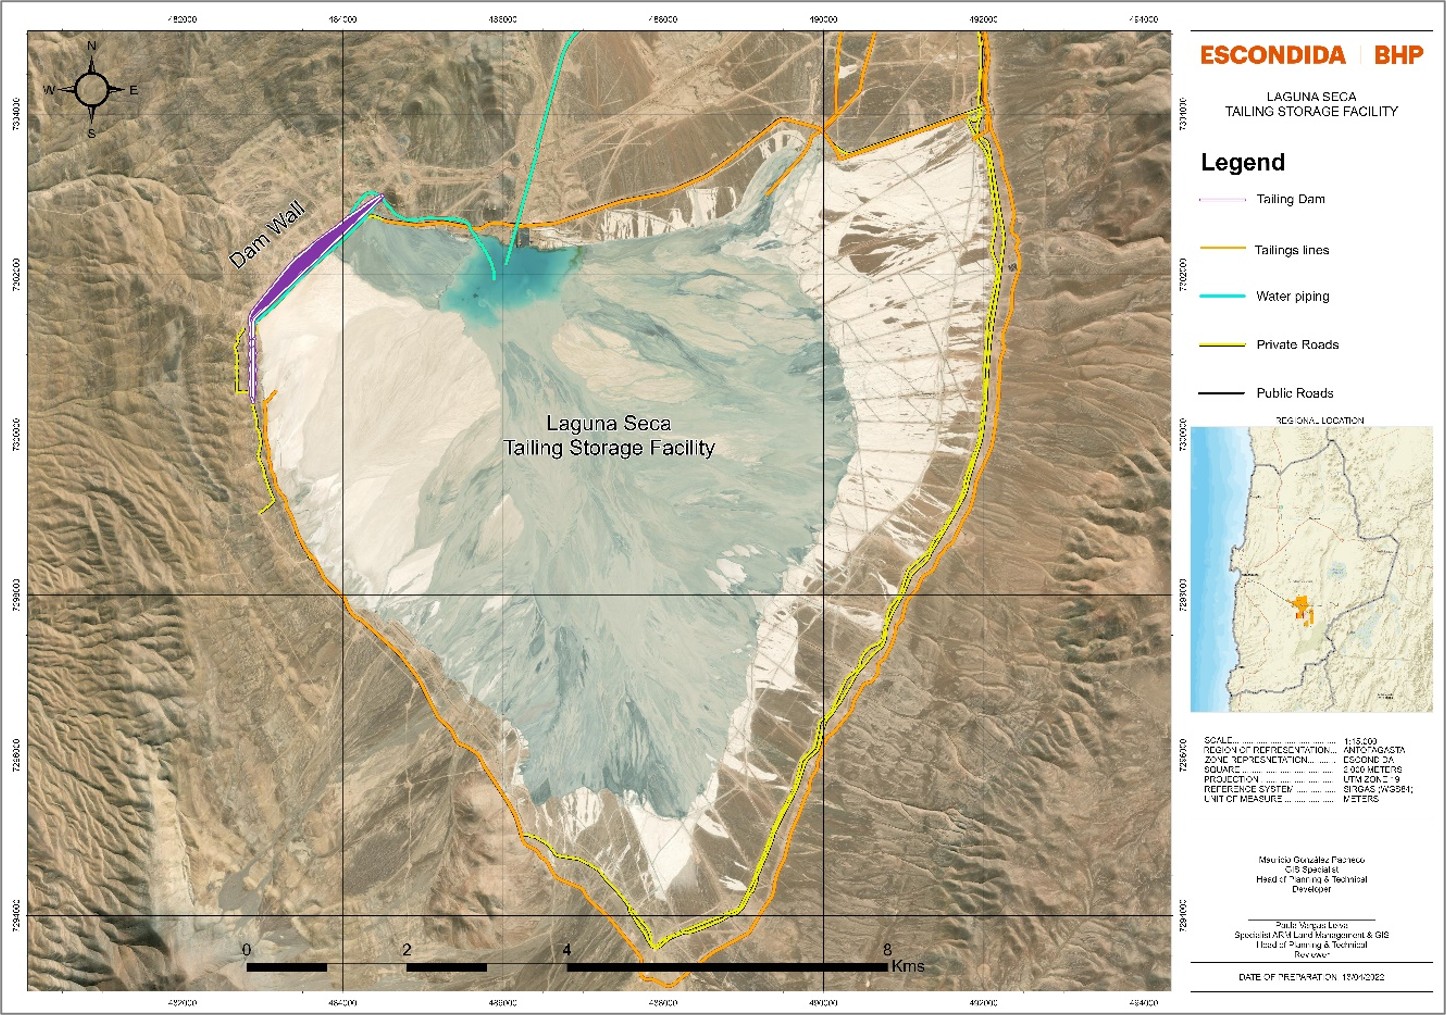
Source: MEL (2022)
Figure 15‑7: Laguna Seca Tailing Storage Facility
|
|
|
|
MEL_TRS_June 2022_Mike |
June 2022 |
|
|
SEC Technical Report Summary – Minera Escondida Limitada |
Page 187 |
Tailings are conveyed through 48-inch high density polyethylene (HDPE) pipes (tailings pipelines) and then discharged to the 12-cell tailings impoundment with dividing dams. The northwest boundary of the Laguna Seca basin has a retaining wall that is built with borrow materials, has a 15-m berm, at present (2021) the wall is at an elevation of 2,955 m above sea level, and its growth maintains the 5 m of revanch and a compaction of 95% proctor. For the monitoring and control of water infiltration, there are three piezometers and a curtain of wells below the wall.
The Laguna Seca deposit has an authorised tailings disposal capacity of approximately 4,500 Mt and involves reaching a maximum height of 3,010 m amsl, with a wall 107 m high and approximately 3 km long. According to current studies and the current permit, the deposit is expected to be completely filled by 2058 and occupy an area of approximately 62 km2 by that year.
The clear water recovery system is installed on a dam of compacted fill material, which is periodically relocated to a higher elevation as the deposit grows. The deposit wall is waterproofed with an HDPE geo-membrane on its slope to prevent water ingress from the basin. The wall includes a drainage system at its base to collect any water that eventually percolates through to keep the base of the slope dry to ensure its strength and stability.
The drainage water is collected in a pool for recirculation to the deposit lagoon and then reused in the process.
The general design characteristics of the Laguna Seca tailings impoundment are described in Table 15‑2.
Table 15‑2: General Characteristics Laguna Seca Dam
|
|
Design Parameter |
Status |
Tailings production (ktpd) |
450 |
Height of wall crown |
3.010 |
Final altitude (m) |
107 |
Upstream slope (H:V) |
2.0:1.0 |
Downstream slope (H:V) |
2.7:1.0 |
Waterproofing |
With Geomembrane |
Minimum freeboard (m) |
5 |
Crowning width (m) |
15 |
Final capacity (Mton) |
4.500 |
Wall material |
loan |
Final deposit area (km2) |
62 |
Source: MEL (2022)
The design of the Laguna Seca tailings dam is currently at its sixth increase in wall elevation (raise) and presents the main geometrical characteristics shown in Table 15‑3.
|
|
|
|
MEL_TRS_June 2022_Mike |
June 2022 |
|
|
SEC Technical Report Summary – Minera Escondida Limitada |
Page 188 |
Table 15‑3: Design Features for the Sixth raise
|
|
Geometric Parameters |
Dimensions |
Height 6° Camber |
2,955 m amsl |
Wall Material |
Loan |
Growth Method |
Downstream |
Upstream slope |
1.8:1.0 (H:V) |
Downstream slope |
2.0:1.0 (H:V) |
Crowning width (m) |
15 m |
Maximum Height of Main Wall |
51 m (to elevation 2,955 m amsl) |
Length Main Wall |
2,180 m (to elevation 2,955 m amsl) |
Length Secondary Wall |
226 m (to elevation 2,955 m amsl) |
Minimal Operational freeboard of the Wall |
> 5 m |
Source: MEL (2022)
15.5.Power, Water, and Pipelines
15.5.1.Power (Electric Energy)
The infrastructure of the electricity transmission systems is designed and built to support and carry out the adequate supply of this input at high, medium, and low voltage levels.
The 220-kilovolt (kV) high voltage electricity supply infrastructure connects directly with the generating sources and is an integral part of the National Electricity System (SEN), forming part, in addition to the South-Cordillera system, of the North Zone SEN. In general, the generating sources or connection points to the SEN are located far from the consuming sources, such as crushers and conveyor belts, concentrator plants, cathode plants, tailings pipeline systems and reclaimed water pumping, facilities located in areas of the mine and the desalination plant and concentrate filter plant located at Coloso.
To ensure that the transmission of electrical energy reaches the places where MEL carries out its operations, it currently has more than 1,000 km of electrical lines at high voltage levels of 220 kV, 215 km of electrical lines that transmit electrical energy at voltage levels of 69 kV and more than 600 km of electrical lines that allow distribution at voltage levels of less than 34.5 kV. This entire distribution system allows the continuous supply of this critical input for the operation of all its mining plants, desalinated water plants and all complementary plants and facilities to fully develop its activities. Table 15‑4 and Table 15‑5 shows a summary of the high voltage power lines (HVL) at 220 kV and 69 kV, respectively, with their corresponding origin substations and arrival substations, as well as the length of these lines.
|
|
|
|
MEL_TRS_June 2022_Mike |
June 2022 |
|
|
SEC Technical Report Summary – Minera Escondida Limitada |
Page 189 |
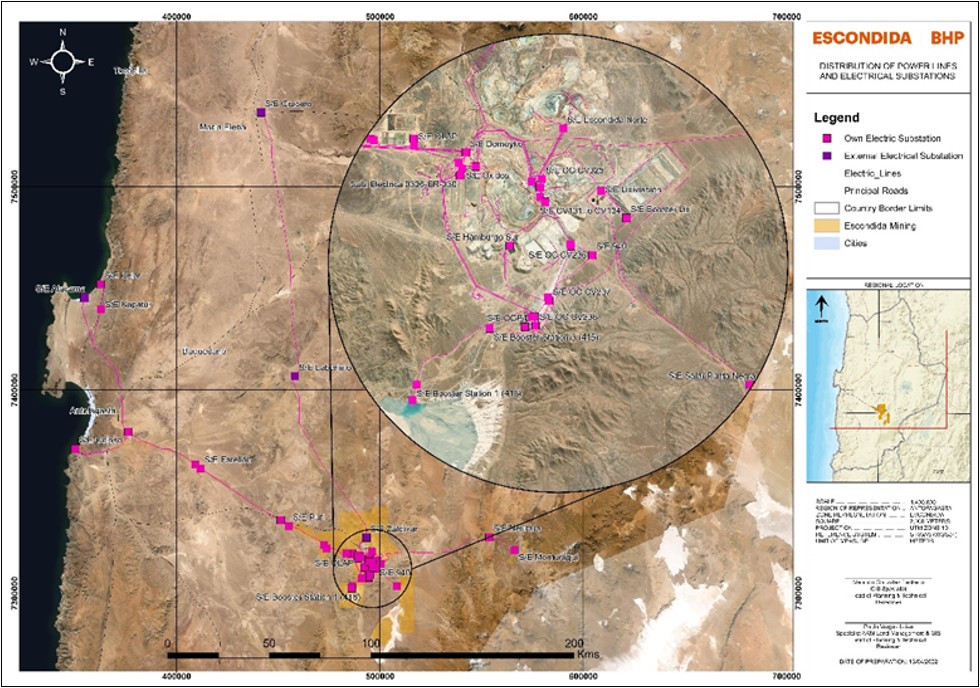
Source: MEL (2022)
Figure 15‑8: Electric Transmission Lines Schematic
For connections to the electricity system at 220 kV voltages, there are transmission lines at 15 substations owned by the company and another four lines at three substations belonging to other companies. For transmission at 69 kV voltage levels, there are 25 substations with a main voltage of 69 kV and 69 kV panels at 4 substations with a main voltage of 220 kV.
Electricity is distributed to the different plants and operational facilities at voltages of 34.5, 33.0, 23.0, 13.8, 7.2, 6.9, and 4.16 kV from the distribution switchgear (Figure 15‑8). As for the distribution of electricity for the extraction of materials from the Escondida and Escondida Norte pits, there are a total of 19 mobile substations and 16 distribution cells, and the transmission cables operate at voltages of 13.8 kV and 7.2 kV.
The high voltage electrical substation is considered to be a group of equipment that, as a whole, enables the connection of high voltage electrical lines that supply or collect energy from it and, in the event of a failure of one of the lines, allows it to be disconnected without interrupting the power supply. In MEL's electrical system, there are two types of substations:
•Open Yard, consisting of a large fenced yard inside which equipment is installed to interrupt the electrical flow of each line, called high voltage switches, and all the equipment associated with the operation of these (current transformers, voltage transformers, disconnectors, lightning arresters). Each line arrives at the substation through one of the sets of equipment ("line panel"). The substation is also composed of a series of structures that support the high-voltage conductors that interconnect all the high-voltage lines coming into the substation and all the aforementioned equipment. Most of the substations in MEL's electrical system correspond to this type of technology.
|
|
|
|
MEL_TRS_June 2022_Mike |
June 2022 |
|
|
SEC Technical Report Summary – Minera Escondida Limitada |
Page 190 |
•In GIS (Gas Insulat Substation), which is made up of compact equipment that includes similar equipment to that described for the open yard substation, but which is confined in metal ducts filled with a highly insulating gas. This makes it possible to configure a substation with the same characteristics as the open-air substations, but with physical dimensions that are equivalent to 85% of those of the open-air substations. In the GIS, the equipment is housed inside a building isolated from the environment, to which the high-voltage conductors of the respective power lines reach. At MEL, there are currently 5 substations in GIS technology, which are: SE OGP1, SE Puri, SE Farellón, SE Chimborazo and SE 360. This technology was also included in the extensions of SE O'Higgins and SE Coloso.
Table 15‑4: 220-kV High Voltage Electrical Energy Transmission Systems with their Source and Destination Substations
|
|
|
|
|
|
|
|
No |
SE Origin |
SE Destination |
Circuit |
Level of Tension |
Length (km) |
Status |
1 |
SE Crucero |
SE Laberinto |
2 |
Double |
220 kV |
133 |
In Use |
2 |
SE Laberinto |
SE Nueva Zaldívar |
2 |
Double |
220 kV |
95 |
In Use |
3 |
SE Nueva Zaldívar |
SE Escondida |
2 |
Double |
220 kV |
14 |
In Use |
4 |
SE O'Higgins |
SE Domeyko |
1 |
Double |
220 kV |
128 |
In Use |
5 |
SE Mejillones |
SE O'Higgins |
2 |
Double |
220 kV |
74 |
In Use |
6 |
SE Kapatur |
SE O'Higgins |
2 |
Double |
220 kV |
69 |
In Use |
7 |
SE O'Higgins |
SE Coloso |
1 |
Simple |
220 kV |
33 |
Desarming |
8 |
SE O'Higgins |
SE Coloso |
2 |
Double |
220 kV |
66 |
In Use |
9 |
SE Domeyko |
SE OGP1 |
1 |
Simple |
220 kV |
15 |
In Use |
10 |
SE Domeyko |
SE Laguna Seca |
1 |
Simple |
220 kV |
13 |
In Use |
11 |
SE Nueva Zaldívar |
SE Sulfuros |
1 |
Simple |
220 kV |
13 |
In Use |
12 |
SE Domeyko |
SE Escondida |
1 |
Simple |
220 kV |
7 |
In Use |
13 |
SE Nueva Zaldívar |
SE OGP1 |
2 |
Double |
220 kV |
28 |
In Use |
14 |
SE Domeyko |
SE Sulfuros |
1 |
Simple |
220 kV |
1 |
In Use |
15 |
SE Domeyko |
SE Oxido |
1 |
Simple |
220 kV |
1 |
In Use |
16 |
SE Kelar |
SE Kapatur |
2 |
Double |
220 kV |
15 |
In Use |
17 |
SE Atacama |
SE O'Higgins |
2 |
Double |
220 kV |
148 |
In Use |
18 |
SE O'Higgins |
SE Farellón |
1 |
Simple |
220 kV |
41 |
In Use |
19 |
SE O'Higgins |
SE Puri |
1 |
Simple |
220 kV |
93 |
In Use |
20 |
SE Puri |
SE Domeyko |
1 |
Simple |
220 kV |
42 |
In Use |
21 |
SE Chimborazo |
SE Domeyko |
1 |
Simple |
220 kV |
17 |
In Use |
22 |
SE Farellón |
SE Chimborazo |
1 |
Simple |
220 kV |
77 |
In Use |
23 |
SE Domeyko |
SE SVC Domeyko |
1 |
Simple |
220 kV |
0, 07 |
In Use |
Source: MEL (2022)
Note: The above stations allow connection to the National Electrical System for the supply of electrical energy for MEL's processes.
MEL owns much of the power transmission system that supplies its operations. However, due to changes in national electricity regulations, several of the 220 kV high voltage lines became part of the national electricity transmission network, which is why MEL created a subsidiary company in the electricity sector called Kelti, so these assets became the property of Kelti, which currently operates these assets, leaving MEL in charge of the maintenance of the lines and other installations of these lines. In addition, the SE Kapatur - SE O'Higgins power line was built and is operated and maintained by the company STN, a subsidiary of the company SAESA, under a Building, Owner, and Transfer (BOT) contract with MEL.
|
|
|
|
MEL_TRS_June 2022_Mike |
June 2022 |
|
|
SEC Technical Report Summary – Minera Escondida Limitada |
Page 191 |
Table 15‑5: 69-kV High Voltage Electrical Power Transmission Systems with their Origin and Destination Substations
|
|
|
|
|
|
|
|
No |
Origin |
Destination |
Circuit |
Level of Tension |
Length (km) |
Status |
25 |
S/E Escondida |
Camino SPN |
1 |
Simple |
69 kV |
19,19 |
De-energised |
26 |
S/E OGP1 |
S/E Esc. Norte |
2 |
Double |
69 kV |
18,59 |
In Use |
27 |
S/E OGP1 |
Monturaqui |
2 |
Double |
69 kV |
18,59 |
De-energised |
28 |
S/E Escondida |
S/E Neurara |
1 |
Simple |
69 kV |
18,04 |
De-energised |
29 |
S/E Neurara |
S/E Monturaqui |
1 |
Simple |
69 kV |
15,74 |
De-energised |
30 |
S/E Sulfuro |
S/E Lixiviación |
2 |
Double |
69 kV |
14,10 |
In Use |
31 |
S/E Laguna Seca |
S/E Tranque |
1 |
Simple |
69 kV |
11,74 |
In Use |
32 |
S/E OGP1 |
S/E 940 |
2 |
Double |
69 kV |
6,79 |
In Use |
33 |
S/E 401 |
S/E Hamburgo Sur |
1 |
Simple |
69 kV |
6,77 |
In Use |
34 |
S/E 940 |
S/E Laguna Seca |
1 |
Simple |
69 kV |
5,91 |
In Use |
35 |
LAT OGP1 |
S/E Hamburgo Sur |
1 |
Simple |
69 kV |
5,89 |
In Use |
36 |
S/E Sulfuros |
S/E OLAP 0752-
ER-051 |
1 |
Simple |
69 kV |
5,21 |
In Use |
37 |
S/E Escondida |
S/E Esc. Norte |
1 |
Simple |
69 kV |
4,20 |
In Use |
38 |
S/E 401 |
S/E 402 |
1 |
Simple |
69 kV |
3,69 |
In Use |
39 |
S/E 401 |
S/E 940 |
1 |
Simple |
69 kV |
1,70 |
In Use |
40 |
S/E 640 |
S/E 401 |
1 |
Simple |
69 kV |
0,77 |
In Use |
41 |
S/E Escondida |
S/E 640 |
1 |
Simple |
69 kV |
0,73 |
In Use |
42 |
S/E Lixiviación |
S/E Booster Lix |
2 |
Double |
69 KV |
2,43 |
In Use |
Note: The above stations allow for the distribution of electrical energy for MEL's processes.
Source: MEL (2022)
For the operation of the Electrical Power System there is a specialised Superintendence called Power Supply, which has a SCADA system that includes 35 substations and electrical rooms, which have their respective communication equipment, data concentrators and operating consoles. In addition, there are two groups of SCAD servers or Operation Centre, the main one being located near Pavilion 15 in the former Camp 3.5 and another backup centre located in Building H next to the Sulfur SE.
Currently, most of the industrial water supply for operational needs comes from seawater, which is desalinated in specially designed and purpose-built plants located on the Antofagasta coastline, at a site known as Punta Coloso. There, there are two desalination plants, whose production is sent to the mine, approximately 170 km away and at a difference in elevation of 3,000 m. The water is carried by three pipelines, one of 24‑inch diameter and two of 42‑inch diameter. Figure 15‑9 shows an overview of the water lines for MEL.
Part of the water needs are covered by the water recovered from the tailings dam, which is sent by aqueducts to the concentrator plants to be used again in the ore beneficiation processes.
A smaller amount of industrial water comes from pit drainage and from the area called Hamburgo, where MEL's first tailings dam was previously located. The use of these waters is covered by mining legislation (Article 110 of the Mining Code) and water legislation (Article 56 of the Water Code), which empowers the mining concession holder, by the sole authority of the law, to use these waters found in mining operations to the extent necessary to carry out the exploration, exploitation, and benefit of its minerals.
|
|
|
|
MEL_TRS_June 2022_Mike |
June 2022 |
|
|
SEC Technical Report Summary – Minera Escondida Limitada |
Page 192 |
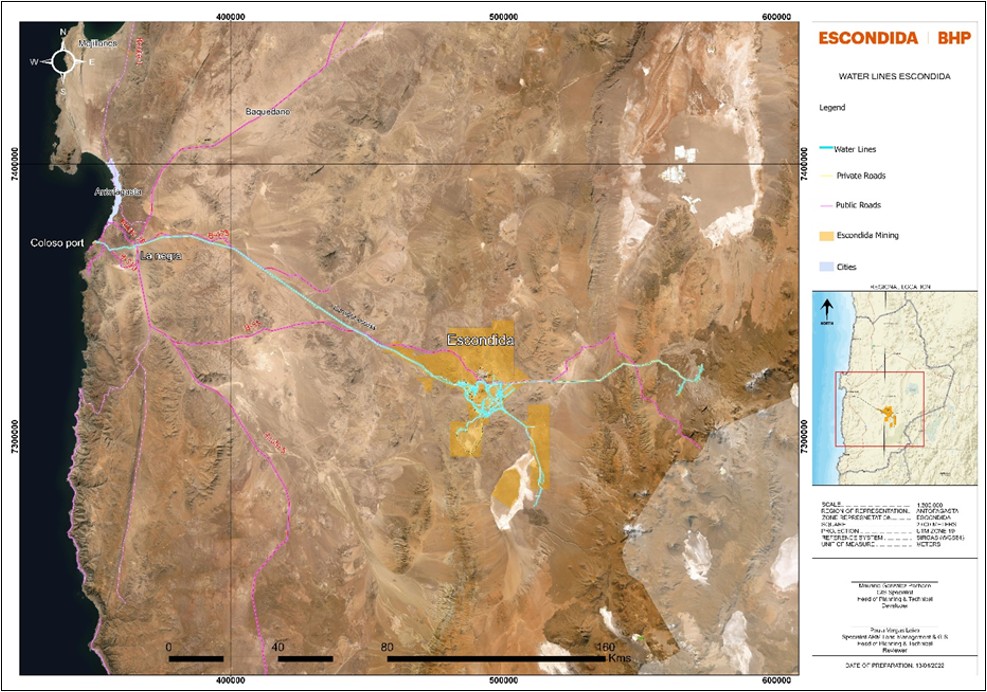
Source: MEL (2022)
Figure 15‑9: Water Lines Schematic
Desalination Plants
MEL has two seawater desalination plants which, as mentioned above, are located in the Punta Coloso sector. These plants are called Plant 0 and EWS Plant. Plant 0 came into operation in 2007 and the EWS Plant came into operation in 2017 and an extension of this came into operation in 2019.
The Plant 0 and EWS Desalination Plants meet the water demand of the following areas:
•Rajo Escondida Norte mine area, from which feed is supplied to the crushers, projects, crusher #5, drilling and exploration workings.
•Rajo Escondida Mine Area, from which feed is supplied to watering stations, crushers N°2 and N°3, truck workshop and projects.
•TK-272 and TK-02 ponds at the Cathode Plant.
•Sealing water for areas 640 and Drawer DI-165.
•Pond TK-83 for feeding Line N°1 of Laguna Seca Concentrator Plant (L1).
•Pond TK-251 for feeding Line N°2 of Laguna Seca Concentrator Plant (L2)
•Laguna Seca Concentrator Plant north pool feed, from which line L1 of the same concentrator is fed.
•Reverse Osmosis (RO) Plant Cerro Tecno Oxide
•Reverse Osmosis Plant (RO) 5300
•Reverse Osmosis Plant (RO) 7000
|
|
|
|
MEL_TRS_June 2022_Mike |
June 2022 |
|
|
SEC Technical Report Summary – Minera Escondida Limitada |
Page 193 |
Plant P0
Plant P0 was designed and built for a production capacity of 500 L/s and a transport system that included a 24‑inch aqueduct. Currently, due to the deterioration of this aqueduct, the product of this Plant is transported through the aqueducts of the EWS Plant.
The main installations and equipment that make up the processes of Plant 0 are as follows:
•Seawater collection system, including pipeline and suction pumps.
•Filtration system using cartridge and bi-layer filters for the pre-treatment of seawater.
•Reverse osmosis plant for seawater desalination.
•Reagent addition plant for process conditioning.
•Desalinated water impulsion system to the mine, consisting of five (5) electrical ES, impulsion pumps and 24‑aqueduct.
•Water storage systems in its different stages and processes, consisting of ponds and pools.
•Brine water discharge system.
EWS
The EWS plant, comprising Desalination Plants 1, 2, and 3, which came into operation in 2017, was designed and built for a production capacity of 2,500 l/s and a transport system comprising two 42-inch aqueducts each. In turn, Desalination Plant 4 was designed and built for a production capacity of 833 l/s and transports its product through the same 42-inch aqueducts already mentioned.
The main installations and equipment that make up the processes of the EWS Plant are as follows:
•Seawater collection system, with tunnels and suction pumps.
•Filtration system using cartridge and bi-layer filters for the pre-treatment of seawater.
•4 reverse osmosis plants for seawater desalination.
•Reagent addition plant for process conditioning.
•Desalinated water impulsion system to the mine, consisting of four (4) electrical SE, impulsion pumps and two 42-inch aqueducts.
•Water storage systems in its different stages and processes, consisting of ponds and EWS reservoir.
•Brine water discharge system.
Seawater Collection System
This system is composed of two tunnels of approximately 580 m long, with a nominal useful diameter of 2,000 mm, designed to capture 8,000 L/s. The intake is located approximately 580 metres from the coastline, and consists of two seawater intake structures, at an estimated depth of 26 metres below sea level.
The collected seawater is pumped to the pre-treatment stage by suction pumps located in a start-up pit on land.
Wastewater Discharge System
The salt water generated in the reverse osmosis process is discharged into the sea through a submarine outfall consisting of a submarine tunnel (the project considered building two tunnels), approximately 320 m long and 2,000 mm in nominal useful diameter, whose ends are composed of a system of diffusers consisting of two pipes of 1,600 mm in diameter and 77 m long, which will be distal to 20 m below sea level, on the seabed and outside the coastal protection zone (LPA). Each pipe has a system of 12 diffusers located in the last 77 m, through which the final discharge of the saltwater rejection into the marine
|
|
|
|
MEL_TRS_June 2022_Mike |
June 2022 |
|
|
SEC Technical Report Summary – Minera Escondida Limitada |
Page 194 |
environment takes place. It should be noted that the outfall is designed to discharge a maximum flow of 8000 L/s, estimated at the time of the start-up of the desalination plant.
Considering the aspects indicated in the previous paragraphs, it is possible to specify that all the land installations of the plant with its service, administrative and maintenance areas, ponds, machinery, equipment, and production systems were installed on the fields owned by MEL, according to the 1994 inscription in the Real Estate Registry, as indicated in Chapter 3. The beach, seabed, and seabed fields were used, given in Maritime Concession and according to the Supreme Decrees, for the construction of an access pit to seawater intake and saltwater discharge tunnels.
In conclusion, the submarine tunnel system consists of two underground intake tunnels of 2,000-mm nominal useful diameter, with an approximate length of 580 m and a buried discharge tunnel of 2,000-mm nominal useful diameter with an approximate length of 395 m, the last 77 m of which correspond to diffusers formed by two 1,600-mm diameter pipes on the surface of the sea.
15.6.Infrastructure Layout Map
Figure 15‑10 shows the high level infrastructure layout map of the MEL complex.
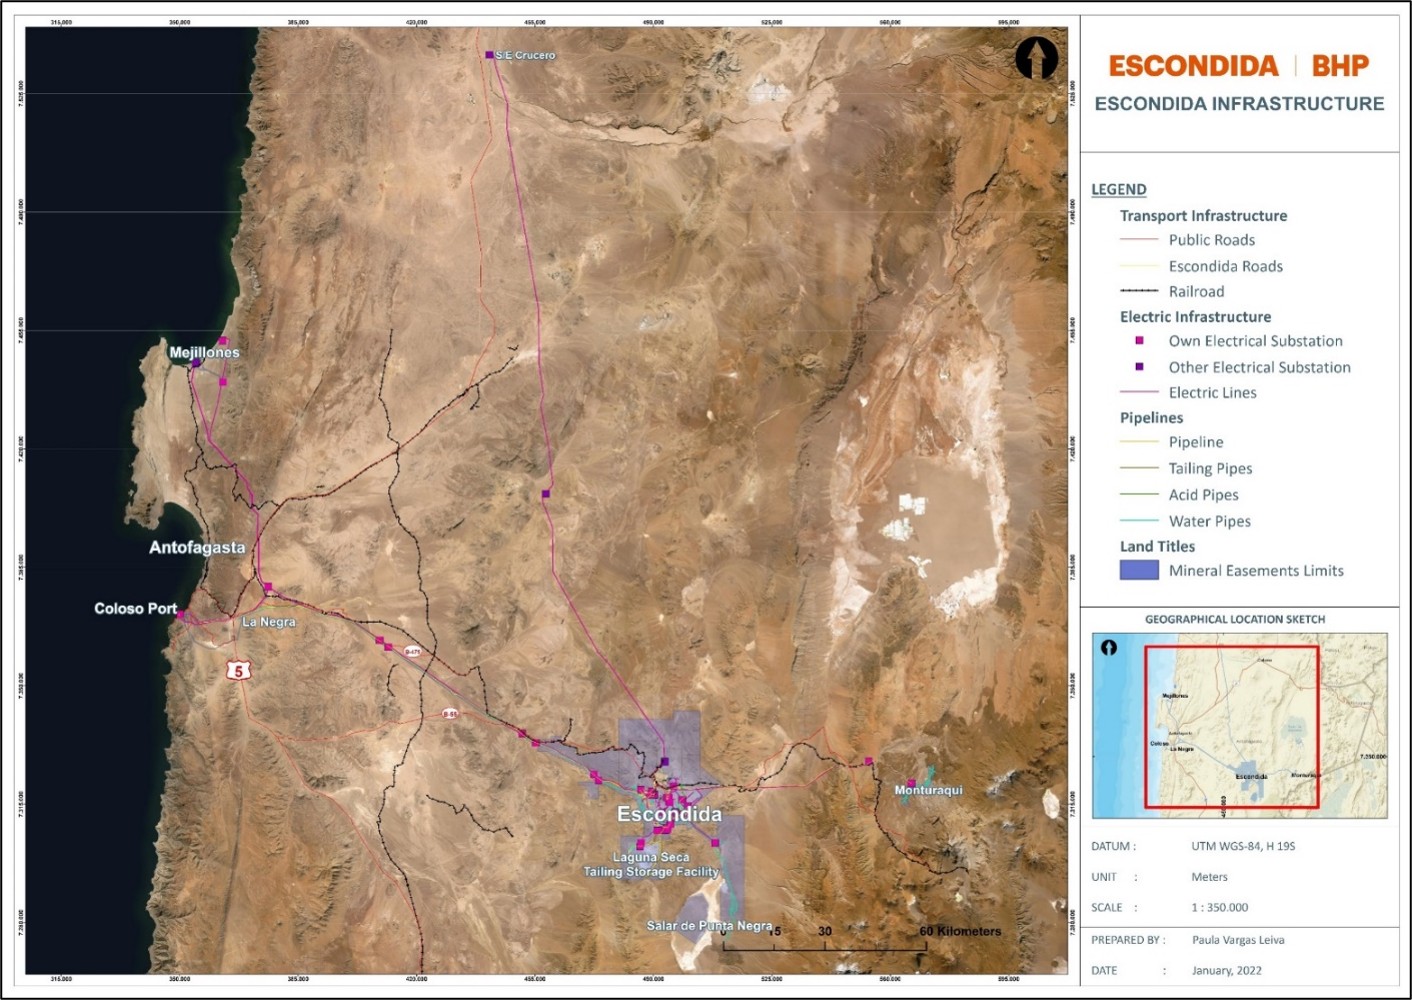
Source: MEL (2022)
Figure 15‑10: Infrastructure Layout Map
|
|
|
|
MEL_TRS_June 2022_Mike |
June 2022 |
|
|
SEC Technical Report Summary – Minera Escondida Limitada |
Page 195 |
The supply and demand for copper is affected by a wide range of factors including changes in the global copper consumption due to economic development.
In CY2021, global copper cathode demand increased by +6% YoY due to rebounding economies and continued recovery in China. Prevailing geo-political uncertainty and Covid-19 lockdowns has moderated demand growth in CY2022. Growth is likely to remain muted over the medium term (CY2023-25) as the stimulus wears off and while the decarbonisation megatrend remains in the early stage. Over the long-term, copper still sees promising growth outlook, underpinned by development of emerging economies and growth in EVs and renewables.
The CY2021 cathode balance ended with a deficit due to healthy end-use demand, and as global inventories fell significantly throughout the year as a result. A small deficit is expected for CY2022 before shifting to a surplus in the medium term following new mine ramp-up. Different from the previous surplus period (a demand down-cycle) during CY2015-16, copper consumption is likely to be more resilient supported by decarbonisation needs.
The concentrates balance could turn in CY2022 as global smelting capacity additions have lagged mine supply growth over the past few years under low TCRC (Treatment Charge and Refining Charge) environment. New mining projects (Tenke Fungurume, Kamoa Phase 2 and Quebrada Blanca) have been sanctioned in response to the high prices and promising demand outlook and concentrate balance could shift into a surplus in CY2022-2024 after being deficit for several years.
BHP Marketing AG (BMAG) sells 100% of MEL production on behalf of all shareholders under an Agency Agreement. Copper cathodes are directly sold to customers that primarily consist of semi-fabricators and trading firms; while copper concentrate is sold to smelters firms.
16.1.1.Copper Long Term Price for Establishing the Economic Viability
For the resource and reserve estimation processes in accordance with the SEC S-K 1300 Regulations, as well as for the economic analysis of the mine plan that supports the reserves, BHP uses a global and objective approach for all its assets for defining commodity prices as inputs to establish economic viability.
This approach employs historical actual monthly prices for the past three financial years (July 2018 to June 2021). For the mineral resources estimate the third quartile average value is employed, whereas for the mineral reserves estimate and economic evaluation the median average value is employed.
The source of the actual historical copper data is the official LME cash settlement price, expressed in US dollars per pound. Historic prices for the past five calendar years are shown below in Table 16‑1.
The Copper price used for resources and reserves estimation in this report are 3.04 US$/lb and 2.79 US$/lb, respectively.
Table 16‑1: Historic Copper Price
|
|
|
|
|
|
|
Calendar Year |
2016 |
2017 |
2018 |
2019 |
2020 |
2021 |
Price (US$/lb, nominal) |
2.21 |
2.80 |
2.96 |
2.72 |
2.80 |
4.23 |
Note: The sole purpose of the presented information above is to demonstrate the economic viability of the mineral reserves for the purposes of reporting in accordance with S-K 1300 only and should not be used for other purposes. The annual cash flow data was prepared based upon Pre-Feasibility-level studies and three year historical prices and costs described in this Technical Report Summary; it is subject to change as assumptions and inputs are updated. The information presented does not guarantee future financial or operational performance. The presented information contains forward-looking statements. Please refer to "Note Regarding Forward Looking Statements" at the front of this Technical Report Summary.
|
|
|
|
MEL_TRS_June 2022_Mike |
June 2022 |
|
|
SEC Technical Report Summary – Minera Escondida Limitada |
Page 196 |
Over the past three Financial Years, we have seen market conditions range from:
•Macroeconomic softness in 2019, due to the US-China trade tensions and a cyclical slowdown in autos and electronics
•The collapse of demand due to COVID lockdowns in early 2020, followed by a sharp rally on the back of unprecedented levels of fiscal and monetary stimulus
•Subsequent supply shortages as global demand recovered in 2021, with copper hitting record prices (on a nominal basis)
Regarding the supply and demand balance, the two following issues must be considered according to Wood Mackenzie “Copper 2021 update to 2040” (Q3 2021):
•Current supply tightness to give way to surplus in the near term, as mines under construction come online.
•Longer term continued growth in demand and declines in supply from currently-operating mines will require the development of new mines to make up the shortfall.
Specifically for the supply, it is worth mentioning that many copper mines are subject to grade decline, which reduces the productivity of the operation over time. In addition, copper mines on average are shorter-lived than iron ore or coal mines, which means the industry requires a steady pipeline of new projects to maintain production levels and provide growth.
From a demand perspective, it is worth mentioning that copper demand growth in the future is expected to be underpinned by development in emerging economies, as they electrify, industrialise, and urbanise. The global energy transition provides further upside, as copper is widely used in electric vehicles and renewables.
The global supply-demand balance can be seen in Figure 16‑1.
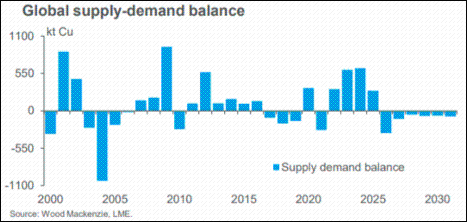
Note: The sole purpose of the presented information above is to demonstrate the economic viability of the mineral reserves for the purposes of reporting in accordance with S-K 1300 only and should not be used for other purposes. The annual cash flow data was prepared based upon Pre-Feasibility-level studies and three year historical prices and costs described in this Technical Report Summary; it is subject to change as assumptions and inputs are updated. The information presented does not guarantee future financial or operational performance. The presented information contains forward-looking statements. Please refer to "Note Regarding Forward Looking Statements" at the front of this Technical Report Summary.
(Source: Wood Mackenzie 2021, LME.)
Figure 16-1: Global supply-demand balance
|
|
|
|
MEL_TRS_June 2022_Mike |
June 2022 |
|
|
SEC Technical Report Summary – Minera Escondida Limitada |
Page 197 |
Looking longer term, copper demand is expected to continue to rise on the back of both the global energy transition as well as growth in emerging economies. Wood Mackenzie forecasts refined copper demand 2030 to 2040 will grow at 1.6% p.a. While it is anticipated that demand growth will continue to decelerate (by comparison the 2020s are expected to grow at around 2.3% p.a.), the QP[s] believes it is reasonable to assume that the trend will remain positive.
New mine supply is expected to be required to not only meet this rising demand, but also to replace declining production as currently available ore grades are expected to decline and resources at other mines are to be depleted [over what period?]. Wood Mackenzie estimates that production from currently operating (or committed) mines will decline at a rate of over 700kt Cu year-to-year during the 2030s. The QP[s] believes it is reasonable to assume that this declining trend will continue in [subsequent decades].
The QP[s] believes the combination of rising demand and declining supply means that, on average, prices will need to be sufficiently attractive to induce the construction of new mines and expansions.
Regarding long term prices, the range of real copper prices moved higher in the mid-2000s, after a downward trend throughout the 1980s and 1990s. The real price of copper has averaged nearly US$3.5/lb in the past 15 years as shown in Figure 16‑2.
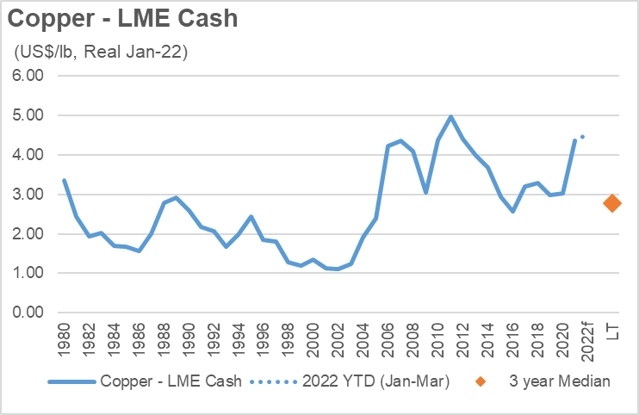
Note: The sole purpose of the presented information above is to demonstrate the economic viability of the mineral reserves for the purposes of reporting in accordance with S-K 1300 only and should not be used for other purposes. The annual cash flow data was prepared based upon Pre-Feasibility-level studies and three year historical prices and costs described in this Technical Report Summary; it is subject to change as assumptions and inputs are updated. The information presented does not guarantee future financial or operational performance. The presented information contains forward-looking statements. Please refer to "Note Regarding Forward Looking Statements" at the front of this Technical Report Summary.
(Source; LME, BHP Analysis)
Figure 16‑2: Historical LME copper price
Current prices for copper (~US$4.30/lb) are believed to be reflective of a scarcity dynamic at this time and as such are not considered sustainable. They are expected to decline in coming years, which is consistent with the lower price level indicated by the three-year trailing price.
However, it should be noted that the three-year trailing price also sits a little low in the range of prices seen since 2006, and so could be considered relatively conservative.
Therefore, regarding the copper price, the QP is confident of the appropriateness of the value used for both the estimation and the economic valuation of the reserves, which is supported by Wood Mackenzie’s forecast, that expects the long-term price (2032 onwards) to be above 3.50 US$/lb (real$ 2022), which is higher than the price used in the current reserves estimation process (2.79 US$/lb).
|
|
|
|
MEL_TRS_June 2022_Mike |
June 2022 |
|
|
SEC Technical Report Summary – Minera Escondida Limitada |
Page 198 |
Copper concentrates produced at MEL contain gold and silver, which the asset receives by-product credits for. Gold and silver are expected to account for less than 10% of revenue for MEL over the life of the mine. The price assumptions are set out in this report outlined for clarity. For gold and silver, the three-year trailing price is taken as the median monthly price for the past three Financial Years: US$1,536/troy oz and US$17.2/troy oz; respectively.
16.1.3.Evaluation of Competitors
Copper supply is quite fragmented by geographical region and number of operating mines. Based on the estimated 2030 C3 costs (Wood Mackenzie) MEL sits in the 3rd quartile.
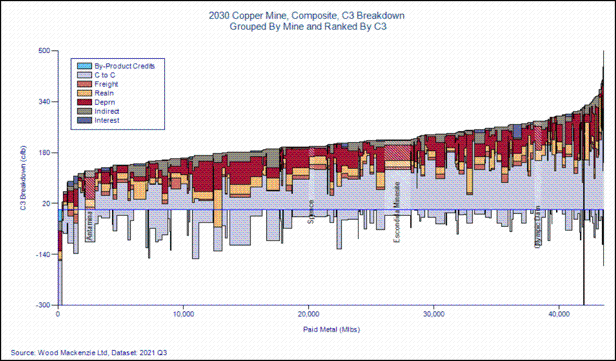
Note: The sole purpose of the presented information above is to demonstrate the economic viability of the mineral reserves for the purposes of reporting in accordance with S-K 1300 only and should not be used for other purposes. The annual cash flow data was prepared based upon Pre-Feasibility-level studies and three year historical prices and costs described in this Technical Report Summary; it is subject to change as assumptions and inputs are updated. The information presented does not guarantee future financial or operational performance. The presented information contains forward-looking statements. Please refer to "Note Regarding Forward Looking Statements" at the front of this Technical Report Summary.
(Source: Wood Mackenzie, 2021 Q3 Dataset)
Figure 16‑3: Copper Supply Curve 2030 C3 Costs
The QP does not view competitors as a material risk to the mineral reserves estimate due to the expected long-term structural supply deficit.
16.2.Products and Markets
By far, the two most-traded forms of copper are cathode (refined copper) and copper concentrates. Copper cathode is a 99.99% pure form of the metal and is the product that is traded (and deliverable) on the three major exchanges: LME, SHFE and COMEX. Copper Concentrates is the most-traded intermediate product that is fed into copper smelters for refining to cathode form. MEL primarily produces copper concentrate, which is complemented with the production of LME Grade A copper cathodes (refer to LME website for minimum requirements). These products are mainly sold to international markets.
|
|
|
|
MEL_TRS_June 2022_Mike |
June 2022 |
|
|
SEC Technical Report Summary – Minera Escondida Limitada |
Page 199 |
‘Cathode’ refers to the copper deposited on the negative terminal of an electrorefining or electrowinning plant. They are around one metre square and weigh 50-80kg.
Copper cathode is usually sold on a CIF or Delivered basis and priced with reference to LME (or SHFE or COMEX), with a Quotation Period (average month in which the copper price is based on for a particular shipment) of ‘M’ (Month of shipment) or ‘M+1’ (One month after shipment), with an additional physical premium. This premium value typically ranges between 30 and 120 US$/tonne depending on regional specific cathode supply and demand, base price arbitrages (e.g. LME vs COMEX vs SHFE) and logistics costs. Generally, this premium represents less than one per cent of the total cathode price.
A ‘Grade A’ cathode is largely fungible, with only small differences in premium between different brands. The main penalty adjustment is for cathode, which is not deliverable to an exchange, which attracts a discount to the price achieved by Grade A material. The size of this discount is still insignificant compared to the overall price.
The copper grade of ore in a mine is low, often <1% Cu. Therefore, the ore is concentrated via a process of milling and froth flotation, to a grade of 20-40%, which is more economic to transport.
Copper Concentrates have greater variability in qualities, since they are more exposed to the geological variations of the mine’s ore body.
Copper Concentrates are typically priced on the content of key metals (Copper, Gold, Silver), with discounts for recoverability. The copper content is priced on LME basis, with Quotation Period typically ranging from ‘M+1’ (One month after shipment) to ‘M+4’ (Four months after shipment).
The copper payable is [typically?] determined by the lower between 96.7% of the copper content and the copper content less 1.0 unit. For example, if the copper assay is 27%, MEL will get paid for (27 - 1) = 26% but if assay is 35% it will get paid for 35 x 96.7% = 33.845%. For gold, the payable terms respond to the following content criteria: there is no payment for content below 1 g/dmt; 90% for 1 to 3 g/dmt; 94% for 3 to 5 g/dmt; 95% for 5 to 7 g/dmt; 96% for 7 to 10 g/dmt; and 97% for above 10 g/dmt. In case of silver, a 90% payable factor applies when its content exceeds 30 g/dmt. These payable terms consider Wood Mackenzie as standard basis and Asia as primary market.
The other main component of the copper concentrate pricing is the TCRC which compensates the smelter/refinery for the cost of converting the concentrate to refined copper. The value of the TCRC is roughly 2-3% of the value of the concentrate. According to Wood Mackenzie, the TCRCs are expected to reach a long-term forecast of US$90/t & 9.0c/lb (real$ 2022) by 2027, which would be equivalent to the average TCRC over the last 20 years.
Copper concentrates attract penalties for high levels of Arsenic, Zinc, Lead, plus a list of lesser elements. A key rejection level for Arsenic (As) has historically been 0.5%, which is the import limit for China. However, in recent years, Chinese smelters have been granted permits to build blending facilities to enable them to blend high Arsenic concentrates with cleaner material, so long as the blended material is below 0.5% As. Typically, there is no penalties for MEL concentrate, as it is a ‘clean’ product that is low in impurities.
|
|
|
|
MEL_TRS_June 2022_Mike |
June 2022 |
|
|
SEC Technical Report Summary – Minera Escondida Limitada |
Page 200 |
16.3.Contracts and Status
Most production is negotiated for sale in advance with a minor proportion allocated to manage operational and market. The terms contained within these contracts are typical and consistent with standard industry practice for each product, considering the special characteristics of our products, low impurities in concentrates and LME Grade A quality cathodes requirements.
In the case of concentrates, the contracts include industry benchmark terms for metal payables and TCRC. Depending on the specific contract, the terms for the sale are either referenced to benchmark-based TCRC or negotiated fixed terms. Treatment charges assumed for estimation of mineral reserves are based on forecasts published by third party data providers such as Wood Mackenzie or the CRU Group.
For cathodes, premium negotiations are conducted on a case-by-case basis, considering the chemical and physical characteristics of the product and the destination market or region. Annual contracts for sales of copper cathodes are completed between Sept and Nov for the calendar year ahead.
17.Environmental Studies, Permitting, Plans and Agreements
The management of the environmental aspects of MEL’s operations are managed under the company’s ISO14001 certified Environmental Management System (EMS). The EMS describes the organisational structure, responsibilities, practices, processes and resources for implementing and maintaining environmental objectives at all MEL sites. The EMS also outlines a commitment to setting objective and targets to achieve sustainable outcomes and to continually improve performance.
Operational controls for environmental management are guided by BHP’s Charter Values. The Charter Values outline a commitment to develop, implement and maintain management systems for sustainable development that drive continual improvement and set and achieve targets that promote efficient use of resources. To give effect to the Charter Values, a series of Our Requirements (OR) documents have been developed, including Our Requirements for Environment and Climate Change (OR E&CC). The OR E&CC applies to environment-related risks and potential impacts on the physical environment: air, water, land, biodiversity, communities, and their interrelationships.
17.1.Environmental Studies and Impact Assessments
MEL supports its operation upon the Environmental Qualification Resolution (RCA) 398 of 2009, which approves the existence of two pits and three concentrator plants with a maximum material processing rate of 460 ktpd. For the tailings deposit, it considers the surfaces and locations previously approved in RCA 001 of 1997. Additionally, it authorizes a height of 3,010 m amsl as the maximum growth for the Laguna Seca tailings deposit, with a storage capacity of 4,500 million tons. Its validity is approximately until the year 2050. It also considers the existence of the infrastructure of Puerto Coloso, in addition to a desalination plant of 525 l/s. In addition, RCA 205 of 2009 approves the operation of a second desalination plant, with a production of 3,200 l/s.
The sulphide leach pad has environmental approval until 2046, while OLAP is authorised to operate until 2051.
Current permits that allow MEL operation have validity until FY50. Any project that modifies these conditions or/and the level of the environmental impacts currently approved could require an EIA.
|
|
|
|
MEL_TRS_June 2022_Mike |
June 2022 |
|
|
SEC Technical Report Summary – Minera Escondida Limitada |
Page 201 |
17.2.Waste and Tailings Disposal
17.2.1.Tailings Management
The plan utilizes the Laguna Seca TSF over the life of the mine.
The goal will be to achieve safety by design, accelerating the implementation of new technologies to reduce tailings management risks, also getting significant benefits on water recovery, reduction of waste volumes and impacted areas and physical stability improvements.
17.2.2.Waste Management and Circular Economy
In line with ICMM performance and the implementation of the REP Law in Chile, MEL’s focus is on delivering improved performance to prevent pollution, manage waste, and address potential impacts on human health and the environment. Growing health concern with potentially carcinogen releases and the emerging risk related to Per and Polyfluoroalkyl Substances (PFAS) release in Australia, has resulted in a separation of hazardous and non-hazardous work streams, as different reduction pathways will apply.
Key actions to implement a waste management system that includes a commitment to the waste hierarchy and is applicable to all waste types (hazardous, non-hazardous, and inert, excluding mine waste) are being developed. Diagnostic baseline assessments were developed during FY22 and gaps identified are expected to be closed during FY23, aiming for an appropriate understanding of the magnitude and types of waste to set reduction targets.
The Strategy was developed based on the following strategic pillars to include; i), operational security; ii), cost competitiveness; iii), sustainability & social value; and iv), innovation and water efficiency. These pillars act as drivers to identify challenges, opportunities, and water-related risks, considering MEL business plans.
MEL’s short and medium term strategy (to FY27) is focused on:
•Increasing Overall Equipment Effectiveness (OEE) at the desalination plant at a competitive cost,
•Making efficient use of water through optimisation
•Following an appropriate closure process for SPN and MTQ aquifers offsetting the residual impacts, studying and diagnosing the impacts in the catchment where MEL operates
•Developing and implementing the dewatering and depressurisation strategy through new and innovative technologies handling geotechnical challenges
•Continuing to improve water management through controlling and monitoring water-related risks
•Enabling water stewardship action plans
•Defining new context-based water targets during FY22 that will apply for FY23 to FY30.
The long term strategy (FY28 onward) is focused on: increasing the water supply allowance as a consequence of the innovative projects that increase the water recovery; ensuring supply to enable future growth options; minimising impacts in the catchment from a sustainability standpoint; and managing safety challenges through innovation and an effective, sustainable, and flexible implementation of dewatering and depressurisation.
The Antofagasta region contains a large number of projects which require the occupation of vast surfaces. This is the reason why it is so important for MEL to keep an appropriate management and optimisation of the portfolio and its Land Titles and Rights. In 2022, as part of the improvement strategy in the land management process, Planning and Technical at MEL implemented the Landfolio platform which was designed to improve the safeguards of the mining concessions portfolio, water rights and superficial land rights.
|
|
|
|
MEL_TRS_June 2022_Mike |
June 2022 |
|
|
SEC Technical Report Summary – Minera Escondida Limitada |
Page 202 |
The strategy for the long term goes along with a territorial availability evaluation and the definition of a mine lease for MEL, circumscribing a strategic safeguard area that protects from the current and future occupation of the land, the commercial interest areas, the superficial infrastructure protection, and the patrimonial and environmental restricted areas. Also, the inclusion of certain territorial prospects without a mining direct interest is considered to be offered in the development of social value pathway.
Regarding those projects that require the soil as construction material, an early characterisation is being developed with the required volumes and granulometry with focus on optimising the errands timings and contracts assignment. The current areas environmentally authorised for this are destined for the Laguna Seca Tailing Storage Facility.
BHP has committed to deliver improved environmental performance in relation to biodiversity conservation through a series of actions. These include the implementation of the biodiversity framework in the operations, verifying MEL’s performance and measuring MEL’s contribution to conservation and adopting a sustainable use and restoration of the marine and terrestrial ecosystems according to the site’s operational footprint. In line with the biodiversity mitigation, hierarchy progressive rehabilitation has also been identified as a deliverable. The key focus area for land theme over the life of the mine is to raise performance in relation to the management of cultural heritage. Improved processes and procedures are required to ensure MEL’s legal commitments and community obligations are met.
As part of the work related to biodiversity & land management, during FY22 we have developed a new Material Risk, called Biodiversity loss, which aims to consider the risk of potentially affecting biodiversity due to MEL’s water extractions from Monturaqui well field, which ended operation in 2019. This is intended to allow as to have in place controls to prevent and mitigate those potential future effects
Air quality issues related to mining and other activities are increasingly becoming an important area of focus for MEL’s employees, communities, environmental authorities, and other external stakeholders. The current focus is on continued implementation of an interdisciplinary air quality strategy, which has been developed in conjunction with Minerals Americas. As part of that work, the Air Quality Table was implemented in FY21, where improvements and projects are expected to be identified, prioritised, and followed by the asset leaders, according to hygiene and environmental criteria and based on deeper understanding of the problem and its effects in diverse areas.
A real time monitoring system is being implemented that is designed to provide information to associate sources of pollution with workers exposure, as well environmental conditions, which is expected to help to take relevant decisions in short- and long-term planning related to air quality issues, reducing impacts in MEL’s workforce health conditions.
Projects that MEL is expected to develop over the next five years are located inside the industrial area; most such projects are within the environmental scopes of other projects already authorised. As a result, a new EIA is not expected to be required in the short term. Nevertheless, the evolution of the following environmental context needs to be monitored:
•Base case permits compliance
•Laguna Seca Tailing Dam infiltration control measures effectiveness
•Laguna Seca Tailing Dam Particle mater dispersion behaviour
•Hydrogeological stronger characterisation in the infiltration risks zones
•Regulatory changes, or community context
|
|
|
|
MEL_TRS_June 2022_Mike |
June 2022 |
|
|
SEC Technical Report Summary – Minera Escondida Limitada |
Page 203 |
To enable a project, an evaluation and planning of permits is carried out, which must be in line with the date of execution of the project, and which is permanently re-evaluated through change management.
Additionally, during the annual planning process, a detailed evaluation of permits is carried out, which allows validating the current strategy and identifying and resolving possible gaps.
Finally, plausible alternatives to keep improving permits management would consider a Permit Committee to identify and track synergy among projects, improve the connection between projects responsible and permits management, generate an integrated strategy to approach the authorities and identify from different perspectives the possible deviations in terms of schedule and compliance.
17.4.Social Plans and Agreements
MEL expects to deepen its Social Value Strategy to enable its operation and projects through the development of a sustainable relationship with the environment and meaningful engagement with its host communities, stakeholders and government.
17.4.1.Indigenous Partnerships
Aligned with the Indigenous Peoples Policy, MEL closed an historical and unprecedented conciliation agreement between the State Defence Council, the Peine Atacamanian Indigenous Community, the Council of Atacamanian Peoples and MEL, which is expected to guide the implementation of compensation and repair actions for the Salar de Punta Negra through an Environmental Management Plan. Participatory decision-making mechanisms and instances of dissemination, environmental education and transparency were established. The technical measures for compensation, mitigation and restoration are aligned with the biodiversity reference framework and responsible water management, long-term policies of the company.
A stronger Cultural Heritage management approach is expected to be developed, based on a set of approved recommendations by the BHP Board. The short-term goal is to articulate the enablement and deployment of structure, processes and systems to effectively manage the Cultural Heritage material risk at MEL during exploration, construction, operation and closure phases. Leveraging MEL’s global framework of cultural heritage as well as MEL’s Regional Indigenous People Plan, the medium term goal is to develop a bespoke framework for cultural heritage management that embeds the participatory engagement with indigenous people in Chile, reflecting their expectations and rights, the legal obligations and current commitments, as well as BHP’s principles regarding future societal expectations.
BHP’s closure objective is to deliver optimised closure outcomes for MEL’s sites. MEL achieves their objective by following the closure management process, which produces an optimised closure management plan.
The LOM considered in this closure is until 20662. This LOM was determined based on the mining of mineral reserves estimated in 2014. However, the closure phase was considered from 2042 to 2066, as per how it was defined in the closure plan, approved by SERNAGEOMIN (Res. Ex. N°1149/2009). It is relevant to mention that MEL has a closure plan that currently is being assessed by SERNAGEOMIN since September 2020.
2 Mine closure regulation in Chile (Law N°20.551) determines a specific methodology to estimate the remaining mine for financial assurances purposes, and it does not define the date of definitive closure.
|
|
|
|
MEL_TRS_June 2022_Mike |
June 2022 |
|
|
SEC Technical Report Summary – Minera Escondida Limitada |
Page 204 |
Based on the physical and socioeconomic environment of the operation, MEL intends to mitigate environment post-closure impacts, through a compatible status with regional ethnographic, ecological, and environmental values returned to the environment. In addition, it is intended to preserve the local biodiversity and remedying the possible affected area until a status in which they are safe and stable3.
Specific objectives have been defined as per the closure vision stated prior that are being constantly reviewed based on the current state of the knowledge base for each closure domain. These objectives are:
•Post-closure site conditions generate minimal health, safety, and environmental risk
•Prioritize sustainable economic returns from decommissioning to offset the financial costs of closure
•Execute closure in an orderly manner to achieve the established deadline criteria
•Avoid long-term liabilities for MEL, the government and the community
•Demonstrate MEL’s accountability
•Migrate socioeconomic impacts
•Provide sustainable land use that is consistent with the need of local authorities and communities considering the characteristics of the resource and its environment
•Post-mine landform reconstruction (profiling) must be safe, stable and visually compatible with the surrounding landscape
•Post mine ground profiling to allow water to run off freely and not be contaminated
•Surface materials, such as soils, do not represent a risk to human health or the environment
•No unacceptable impacts of closure on MEL’s business
•Maintain the employee’s well-being and quality of life after the end of production and mining activities
•Maintain communication with the community and stakeholders throughout the closure
•Validate compliance with the objectives of the Closure Plan and the project success criteria
MEL is pursuing, as part of the closure management strategy, progressive closures that have been identified and scheduled based on the mine plan.
Major closure activities (e.g., closure of remaining pits and ramps and infrastructure) are currently scheduled to commence rehabilitation when areas become available at the end of the LoM in FY67.
BHP closure management process considers two different kind of post-closure monitoring activities. The first one is based on what is mandated by Chilean closure law, which are related to physical and chemical stability of the facilities (reviewed by SERNAGEOMIN authority). The second ones are those activities related to aspects beyond or complementary to the ones committed to the regulator, aligned to BHP standards.
Closure strategies are based on the current understanding of the site and legal requirements, and it is acknowledged that modifications are likely to occur as additional information is available. Information gathered during operations is used to regularly test the validity of closure assumptions and is expected to assist in refining closure options and defining completion criteria.
3 LoA22 Closure Management Plan Minera Escondida Ltda, BHP, 2021.
|
|
|
|
MEL_TRS_June 2022_Mike |
June 2022 |
|
|
SEC Technical Report Summary – Minera Escondida Limitada |
Page 205 |
The closure cost has been estimated based on the current closure provision. This estimate is considered as per a scope class 4 and the total closure cost estimated for MEL is US$ 2,653 M as presented in Table 17‑1.
|
|
Table 17‑1: |
Cost Estimates - SEC SK 1300 Regulations |
|
|
Section |
Cost (US$ M) |
Direct costs |
1,604 |
Indirect costs |
284 |
Others |
66 |
Contingency |
464 |
Risk events |
235 |
Total Cost |
2,653 |
Note: The sole purpose of the presented information above is to demonstrate the economic viability of the mineral reserves for the purposes of reporting in accordance with S-K 1300 only and should not be used for other purposes. The annual cash flow data was prepared based upon Pre-Feasibility-level studies and three year historical prices and costs described in this Technical Report Summary; it is subject to change as assumptions and inputs are updated. The information presented does not guarantee future financial or operational performance. The presented information contains forward-looking statements. Please refer to "Note Regarding Forward Looking Statements" at the front of this Technical Report Summary.
Source: MEL (2022)
As shown, the total closure cost estimate includes direct and indirect costs, other closure related aspects (i.e., pre-closure studies, closure opportunity framing, studies and post-closure monitoring, studies, and closure monitoring), and contingencies associated to the engineering level of the estimate (Class 4). The expected costs for the risk events identified for the closure phase of MEL are also included.
17.6.Local Procurement and Hiring
MEL is committed to supporting the local economies and communities in which it operates. One way of achieving this is through local procurement practices where we have established internal goals and supporting practices and processes for local procurement. In particular, procurement with small local businesses is encouraged through the BHP Local Buying Programme, which facilitate more direct engagement between MEL’s operations and small local businesses through an online portal (Local Buying Programme | Building Our Future Together) In addition, in June 2021, BHP announced it was introducing 7-day payment terms for all small, local and indigenously owned businesses where it operates globally.
MEL’s plan is expected to expand the impact we have in the regional economy, the need of labour and suppliers for the asset in the long term as well as trained internal and external workers. Diversity, inclusion, and local content is planned to be incorporated in this strategy, while strengthening the local business ecosystem, local hiring, intensification of employability programme through the collaboration of Centro Entrenamiento Industrial y Minero (CEIM) and partnership with local Universities (HEUMA).
Social investment is referred to in the plans and negotiations included in the sections above. Social investment involves more than supporting local procurement. MEL’s voluntary contribution to invest at least 1% of pre-tax profits over a three-year rolling average into the community
|
|
|
|
MEL_TRS_June 2022_Mike |
June 2022 |
|
|
SEC Technical Report Summary – Minera Escondida Limitada |
Page 206 |
17.6.3.Reconversion and Developing MEL Capabilities
Developing MEL´s workforce capabilities strategy over the next 25 years will bring challenges and opportunities between external recruitment and skills development for current employees in order to address skills projected needs in critical capabilities for existing roles, as well as for emerging roles through new capability architecture so that every individual has the opportunity to assess their capabilities against their current and future roles and develop more meaningful development and career plans that prepare them for the future. It is probable that future skill profiles, as digital skills, problem solving and analytics skills are more suited to new technologies and to a more automated environment, will need to be sourced from other industries or friendlier technology based generations. This will also place a challenge to on-board newer workforce with less, or no, traditional operational experience into BHP´s values and priorities.
MEL’s expected plans will require the Antofagasta Region to develop new skills and capacities, capable of adapting and embracing the challenges of a mining industry based on technology, renewable energy, Artificial Intelligence (AI), and autonomy. MEL intends to leverage operational challenges to collaborate with local universities, particularly the HEUMA consortium, working on various lines of technical development and advanced research that include digital and data analytics, desalination, non-conventional tailings, and new extractive metallurgy. This is expected to help MEL ensure knowledge is within the organisation, integrate it into work processes, facilitate access to training, and create local capacities in Research and Development (R&D). Employability programmes through CEIM are intended to expand their coverage, adding OEMs and large contractors in their practical training process. Programmes to generate digital skills and promote STEM careers are also expected to be strengthened. The alliances with MEL’s critical educational institutions (CEIM, HEUMA, and partnership with Antofagasta and National Universities) are expected to help MEL drive and implement the following initiatives, as discussed in the coming subsections, supporting MEL’s agenda of social values.
17.6.4.Local Procurement Strategy
The local procurement strategy attempts improve relationships and reputation with local stakeholders, building support for the growth of MEL’s local business into the site’s supply chain through the direct and indirect supply of goods and services:
•In direct spend the focus is expected to be balancing local spend priorities with the need to constantly seek cost productivity; and improving the diversification of spend in appropriate categories of spend that are valued by local stakeholders. The expected proportion of local spend over total spend in contractors should reach 24% by FY25.
•For indirect spend, local contribution mechanisms are expected to be implemented in tenders, leveraging in the supply chain to amplify MEL’s contribution in the space of local employment, local subcontracting, and diversity. Expected proportion of local employment in project and contractors should match the BHP internal target of 50% by FY25.
17.7.Discussion of Relative Accuracy/Confidence
In the LOM plan MEL’s strategy is to enable operations and projects based on enhancing sustainable relations with the environment and to help to accelerate the decarbonisation of the global economy. A series of actions are planned to be developed to reduce emissions along with building climate resilience at MEL’s operations to face plausible climate change impacts from the decades to come and are essential to meet the expectations of MEL’s stakeholders.
Every year during the business planning cycle the risks associated with MEL's growth projects are reviewed, in order to ensure that they are carried out as scheduled.
Strategies mentioned in the chapter are based on Environmental Impact Assessment Service (SEIA), in compliance with Chilean legislation requirements, Sernageomin standards, and BHP's corporate guidelines with the required level of accuracy for each organization
|
|
|
|
MEL_TRS_June 2022_Mike |
June 2022 |
|
|
SEC Technical Report Summary – Minera Escondida Limitada |
Page 207 |
In the opinion of the qualified persons the plans, processes and strategies briefly described in this chapter are adequate in addressing any issues related to environmental compliance, permitting, social plans, closure planning, and local procurement.
18.Capital and Operating Costs
18.1.Basis of Cost estimation
For this report, capital and operating costs are estimated to a PFS-level with a targeted accuracy of +/- 25% and contingency not exceeding 15%. However, this accuracy level is only applicable to the base case operating scenario and forward-looking assumptions outlined in this report. Therefore, changes in these forward-looking assumptions can result in capital and operating costs that deviate more than 25% from the costs forecast herein.
Capital cost estimates are included in the LoM plan and are based on the estimates derived from the Pre-Feasibility level studies utilising experience from the construction of similar projects at MEL.
Sustaining capital costs estimates are based on the major equipment rebuild, replacement schedule and other capital required to sustain the LoM production level.
Closure costs have been included for the LoM schedules.
Therefore in the QPs’ opinion, a timeframe of preceding three years sufficiently covers cycles of price variability and the selection of the median price from a data set of month averages over this period is a reasonable estimate of the long term cost for this purpose. Inflation could potentially change the cost structure and the QP has identify this as an uncertainty. Additionally changes in the exchange rate and future diesel and power costs can materially change the accuracy of the cost estimate.
It should be noted that cost data presented in this section, as discussed in the Note Regarding Forward-Looking Statements (see page ii), has been prepared using costs which are different to those that have been employed in the preparation of BHP’s production guidance. Therefore cost data included herein may differ significantly from costs utilized in determining BHP’s production guidance published in accordance with ASX Listing Rules.
18.2.Capital and Operating Cost Estimates
Capital costs at MEL are broken up into four main areas: Mine, Concentrators, Leaching and Non-Process Infrastructure (NPI). In the opinion of the Qualified Person, the estimation methodology and resulting estimates are a fair representation of the capital costs. Table 18‑1 outlines the total capital spend that has been included in the life of mine plan.
Figure 18‑1 shows the timings of these costs over the life of the mine.
|
|
|
|
MEL_TRS_June 2022_Mike |
June 2022 |
|
|
SEC Technical Report Summary – Minera Escondida Limitada |
Page 208 |
|
|
Table 18‑1: |
Total Capital Cost by Area (Life of Mine) |
|
|
Area |
Total estimated capital investment over life (US$ M Real) |
Mine |
9,566 |
Concentrators |
7,231 |
Leaching |
1,724 |
NPI |
2,042 |
Total |
20,563 |
Note: The sole purpose of the presented information above is to demonstrate the economic viability of the mineral reserves for the purposes of reporting in accordance with S-K 1300 only and should not be used for other purposes. The annual cash flow data was prepared based upon Pre-Feasibility-level studies and three year historical prices and costs described in this Technical Report Summary; it is subject to change as assumptions and inputs are updated. The information presented does not guarantee future financial or operational performance. The presented information contains forward-looking statements. Please refer to "Note Regarding Forward Looking Statements" at the front of this Technical Report Summary.
MEL (2022)
The capital costs are forecast using three approaches. The historical average of the past three years capital costs to estimate general capital costs per year. An hourly approach for equipment replacements, allowing us to ensure these costs occur in the correct year based on the equipment life. Finally, specific projects are schedule based on the year they need to occur based on the schedule.
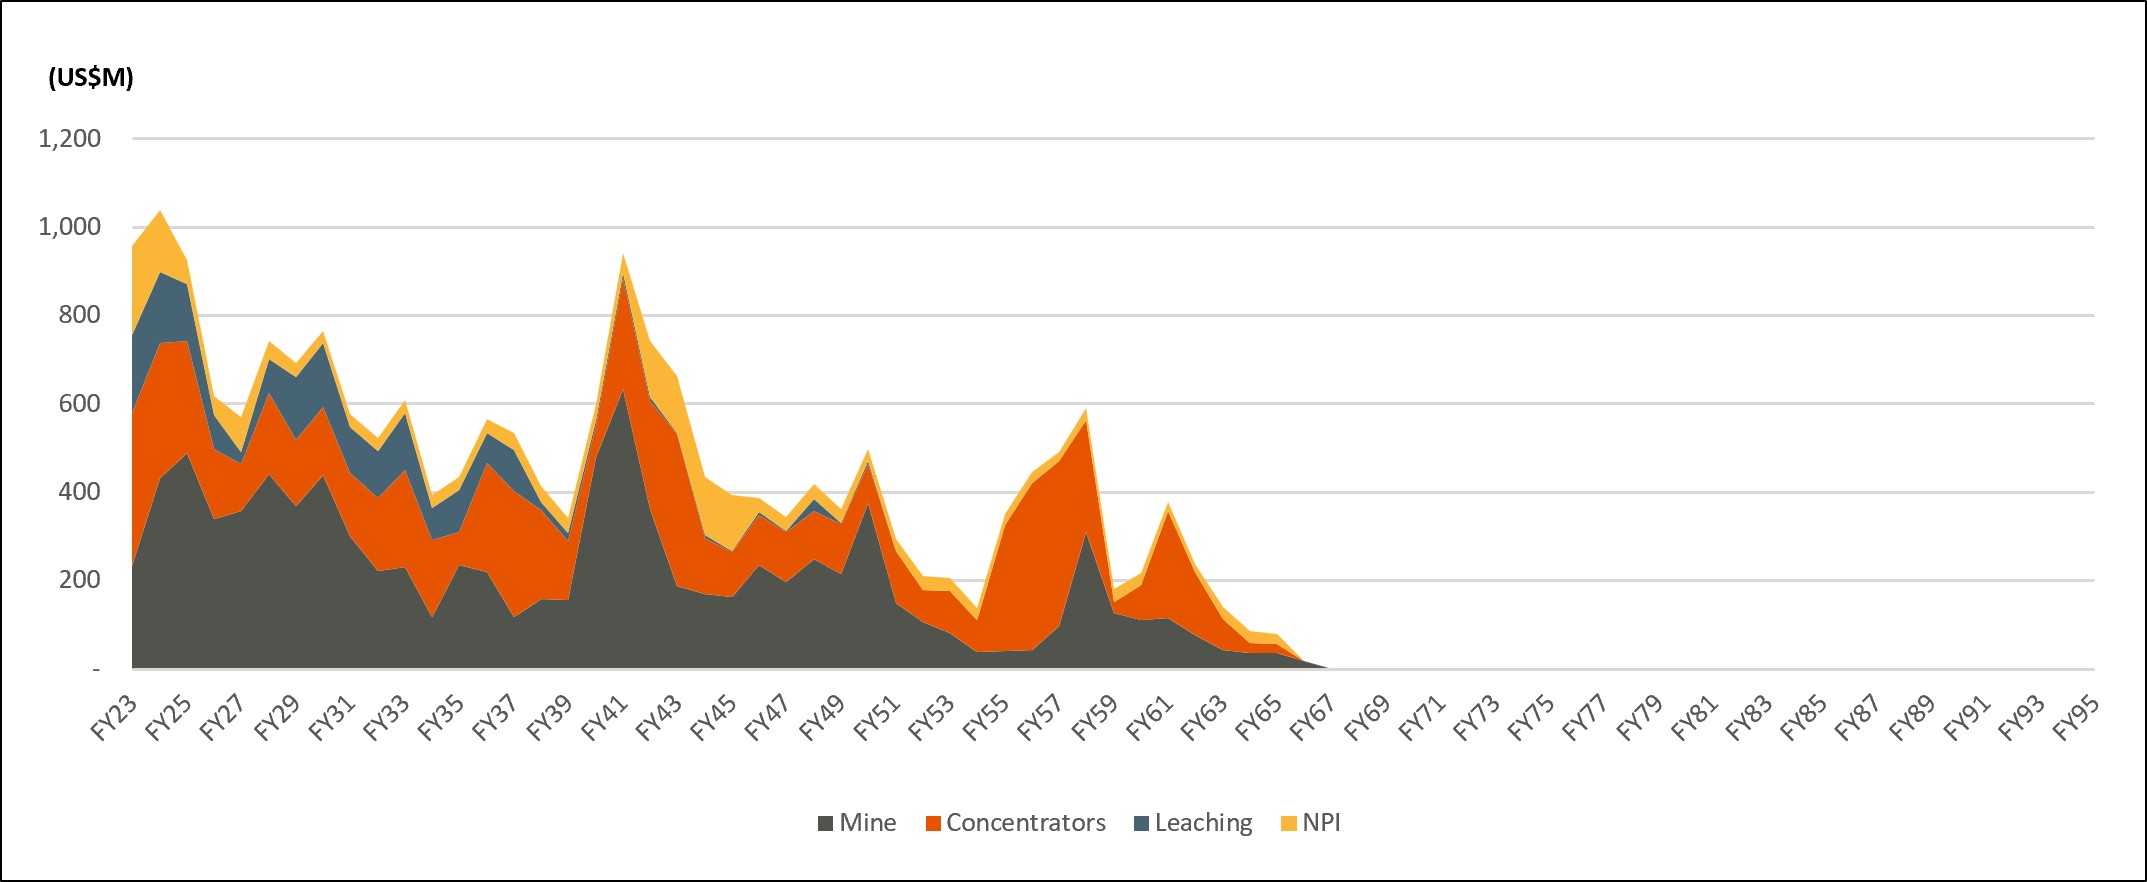
Note: The sole purpose of the presented information above is to demonstrate the economic viability of the mineral reserves for the purposes of reporting in accordance with S-K 1300 only and should not be used for other purposes. The annual cash flow data was prepared based upon Pre-Feasibility-level studies and three year historical prices and costs described in this Technical Report Summary; it is subject to change as assumptions and inputs are updated. The information presented does not guarantee future financial or operational performance. The presented information contains forward-looking statements. Please refer to "Note Regarding Forward Looking Statements" at the front of this Technical Report Summary.
Source: MEL (2022)
|
|
Figure 18‑1: |
Annual Capex Breakdown |
Mine
Capital costs for the mine are divided into two main areas, Mobile Equipment and Pit infrastructure. Mobile Equipment includes capital costs associated with the purchase of replacement equipment to sustain operations as well as any capital associated with the operations and maintenance of the equipment. These costs are based on the required hours of the equipment and total hours. Pit infrastructure is related to any costs associated with advancement of pushbacks. These costs are forecast for specific years based on when we require each pushback.
|
|
|
|
MEL_TRS_June 2022_Mike |
June 2022 |
|
|
SEC Technical Report Summary – Minera Escondida Limitada |
Page 209 |
Concentrators
Capital costs for the concentrators are divided into two main areas, Concentrator Plants and Tailings. Concentrator Plant costs include capital costs associated with the operation of the three concentrators and the infrastructure at Coloso. Tailings costs are associated with the operation of the Laguna Seca Tailing dam. The costs in this area use a mix of historical averages and schedule driven costs.
Leaching
Leaching costs cover both the Sulphide Bioleaching and the Acid Leaching as well as the Electrowinning infrastructure. The costs in this area use a mix of historical averages and schedule driven costs.
NPI
NPI Costs cover the capital for NPI at MEL. Examples of these include, but are not limited to, capex associated with desalination plants, and maintenance of the private road to the MEL minesite. The costs in this area use a mix of historical averages and schedule driven costs.
The operational costs at MEL are split into the following areas:
Mining Costs
Leaching Costs
Concentrator Costs
General and Administration (G&A)
Closure and Rehabilitation
The mining, leaching, concentrator and G&A costs have been estimated used the historical 3-year average costs. An assessment was undertaken to ensure no significant one-off variations were impacting these historical rates, and adjustments made if appropriate. The closure and rehabilitation costs have been based on the expected timing of the costs on a yearly basis.
|
|
Table 18‑2: |
Major Components of Capital and Operating Costs (100% Basis) |
|
|
|
|
Cost Category Level 1 |
Cost Category Level 2 |
Cost Unit |
Value |
Mining Costs |
Fixed Mining Cost |
Real US$ /t material moved |
0.87 |
Haulage Cost |
|
Variable |
Concentrator Costs |
Processing Costs |
Real US$ /t ore processed |
7.10 |
Selling Costs |
Real US$/t Cu produced |
359 |
Leaching Costs |
Oxide Processing Costs |
Real US$/ton Leached Ore |
7.98 |
Sulphide Processing Costs |
Real US$/ton Leached Ore |
1.31 |
Selling Costs |
Real US$/t Cu produced |
524 |
Closure & Rehabilitation |
Closure & Rehabilitation |
Real US$ M Total |
2,653 |
Overheads + Other Costs |
General and administration costs (G&A) |
Real US$/t Cu produced |
838 |
Note: The sole purpose of the presented information above is to demonstrate the economic viability of the mineral reserves for the purposes of reporting in accordance with S-K 1300 only and should not be used for other purposes. The annual cash flow data was prepared based upon Pre-Feasibility-level studies and three year historical prices and costs described in this Technical Report Summary; it is subject to change as assumptions and inputs are updated. The information presented does not guarantee future financial or operational performance. The presented information contains forward-looking statements. Please refer to "Note Regarding Forward Looking Statements" at the front of this Technical Report Summary.
Source: MEL (2022)
|
|
|
|
MEL_TRS_June 2022_Mike |
June 2022 |
|
|
SEC Technical Report Summary – Minera Escondida Limitada |
Page 210 |
Mining Costs
Mining costs relate to the cost of extracting material from the pit and delivering it to the final dentation onsite. The major components of mining costs are drilling, blasting, loading, and hauling. The historical 3-year average costs for these components were used as the basis. An assessment was undertaken to ensure no significant one-off variations were impacting these rates. Drilling, blasting, and loading a fixed rate was used, while for haulage a variable rate was used.
Leaching Costs
Leaching costs relate to the processing of ore sent to either the Oxide leaching or Sulphide Bioleaching processes. Leaching costs were estimated for both Oxide and Sulphide Bioleaching and includes processing of the ore, crushing costs (if applicable), solvent extraction (SX) and electrowinning (EW). The historical 3-year average costs for these components were used as the basis. An assessment was undertaken to ensure no significant one-off variations were impacting these rates.
Concentrator Costs
Concentrator costs relate to the processing of ore sent to one of the 3 concentrators at MEL. The costs are averaged over the 3 concentrators. They include the crusher costs, costs of running the plants- and the filter costs at the port, Treatment Charges (TC) and Refining Charges. The historical 3-year average costs for these components were used as the basis. An assessment was undertaken to ensure no significant one-off variations were impacting these rates.
General and Administration
The General and Administration (G&A) costs relate to the general running of MEL and include items such as utilities, rent and salaries as well as others. The historical 3-year average costs for these components were used as the basis. An assessment was undertaken to ensure no significant one-off variations were impacting these rates.
Closure and Rehabilitation
Closure and Rehabilitation costs relate to any costs to do with the closure and rehabilitation at MEL. These costs are irregular and thus have been estimated based on when the costs are expected to be incurred in the mine plan (as opposed to the 3-year historical average costs). More detail on these can be found in Section 17.5.
|
|
|
|
MEL_TRS_June 2022_Mike |
June 2022 |
|
|
SEC Technical Report Summary – Minera Escondida Limitada |
Page 211 |
Figure 18‑2 shows the estimated annual spending on Opex by area. Opex costs are expected to reduce in FY28 when the Los Colorados plant closes, we also see some of the associated closure are rehabilitation costs for this in the following years. Between FY28-41 Opex costs are expected to remain steady, and then reduce between FY42 and FY52 as the leaching processes finish. Between FY53 and the end of mine life we expect to see a steady decrease in Opex costs as the mine movement reduces as we approach the end of mine life.
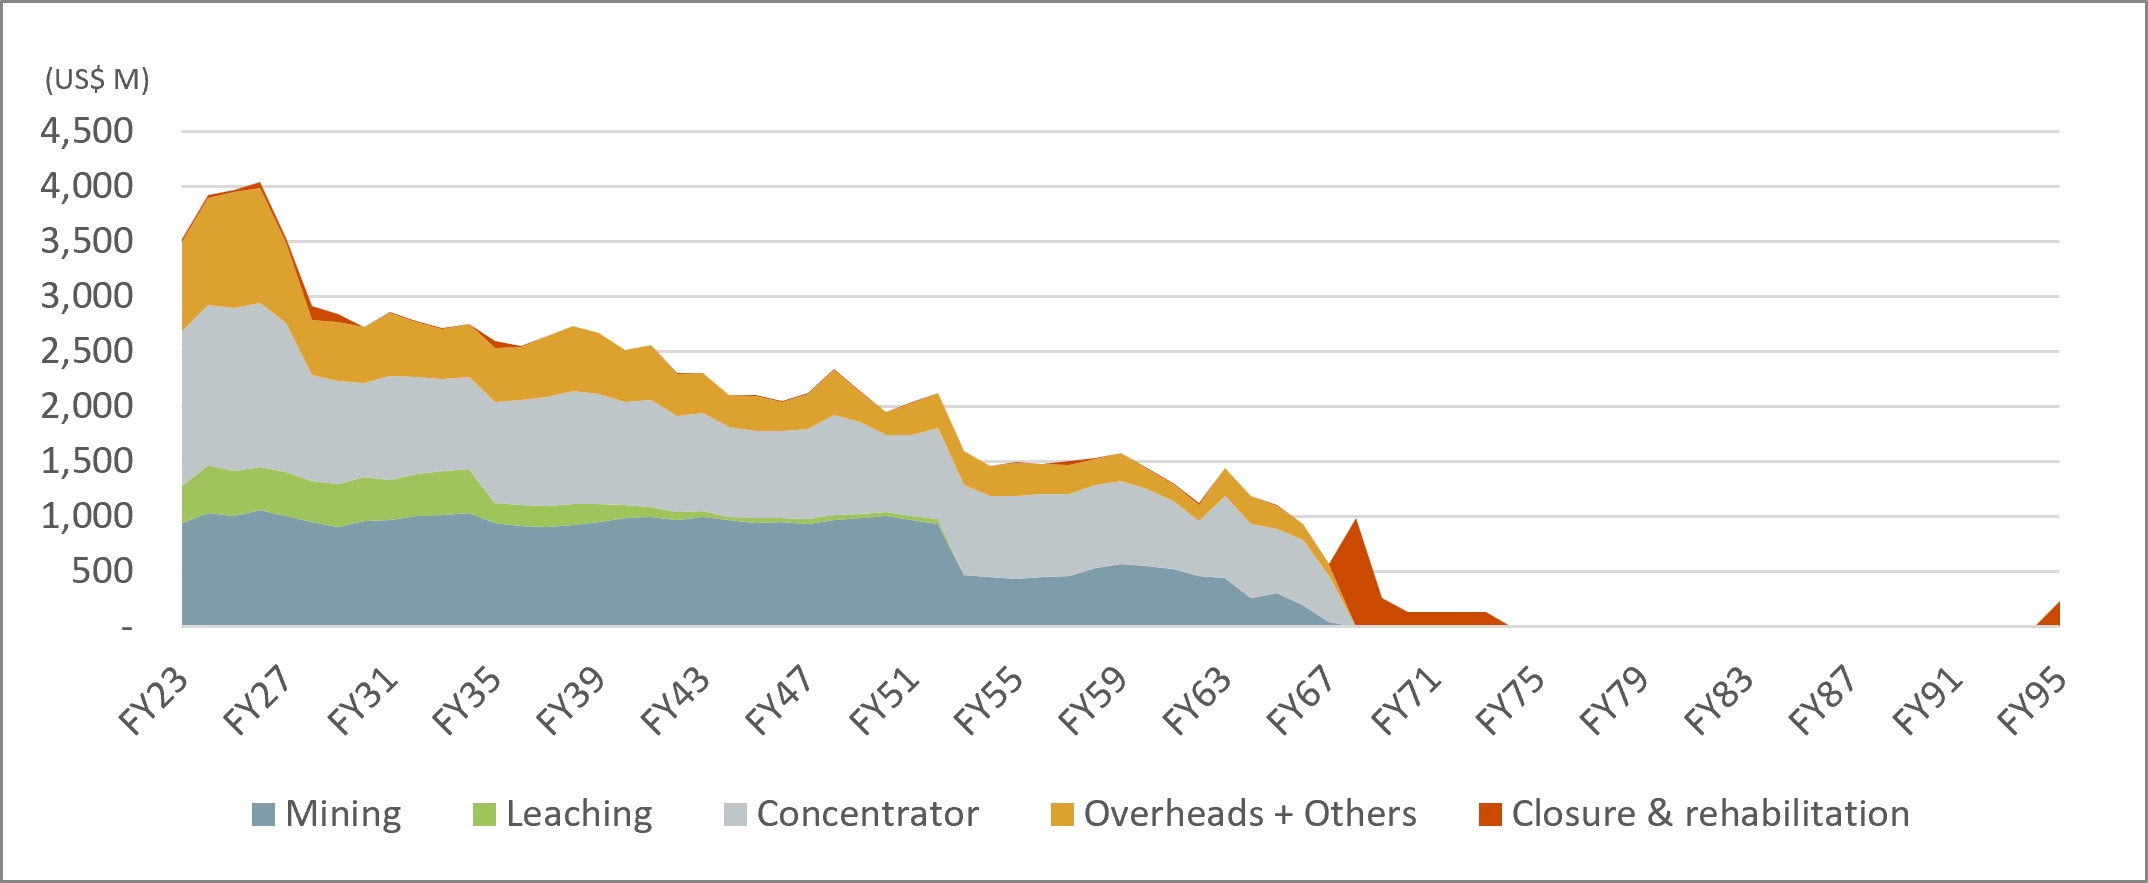
Note: The sole purpose of the presented information above is to demonstrate the economic viability of the mineral reserves for the purposes of reporting in accordance with S-K 1300 only and should not be used for other purposes. The annual cash flow data was prepared based upon Pre-Feasibility-level studies and three year historical prices and costs described in this Technical Report Summary; it is subject to change as assumptions and inputs are updated. The information presented does not guarantee future financial or operational performance. The presented information contains forward-looking statements. Please refer to "Note Regarding Forward Looking Statements" at the front of this Technical Report Summary.
Source: MEL (2022)
|
|
Figure 18‑2: |
Annual Opex Breakdown |
19.1.Key assumptions, parameters and methods used
The economic analysis presented in this section is based on annual cash flows including sales revenue, operating & closure costs, capital expenditure and taxes for the full mineral reserves production schedule, reflecting the MEL production system and supply chain to mine, process and transport of copper concentrate to the sales point.
All results are presented in 57.5% BHP economic interest terms, unless otherwise stated.
19.1.1.Mine Plan Physicals
Total material movement and mineral reserves tonnages included in the economic analysis are shown in Table 19‑1.
|
|
|
|
MEL_TRS_June 2022_Mike |
June 2022 |
|
|
SEC Technical Report Summary – Minera Escondida Limitada |
Page 212 |
|
|
Table 19‑1: |
Mineral Reserves Physicals (100% MEL Terms) |
|
|
Physical |
Tonnage |
Material Movement including waste |
17,137Mt |
Mineral Reserve |
6,187Mt |
Note: The sole purpose of the presented information above is to demonstrate the economic viability of the mineral reserves for the purposes of reporting in accordance with S-K 1300 only and should not be used for other purposes. The annual cash flow data was prepared based upon Pre-Feasibility-level studies and three year historical prices and costs described in this Technical Report Summary; it is subject to change as assumptions and inputs are updated. The information presented does not guarantee future financial or operational performance. The presented information contains forward-looking statements. Please refer to "Note Regarding Forward Looking Statements" at the front of this Technical Report Summary.
Source: MEL (2022)
The mine plan is based on a Mineral reserves estimate supported by mine design and schedule. The schedule (shown as Figure 19-1) has been prepared in accordance with the regulations SEC S-K 1300, and excludes the use of inferred mineral resources in pit optimisation and mine scheduling. All inferred material is treaded as waste.
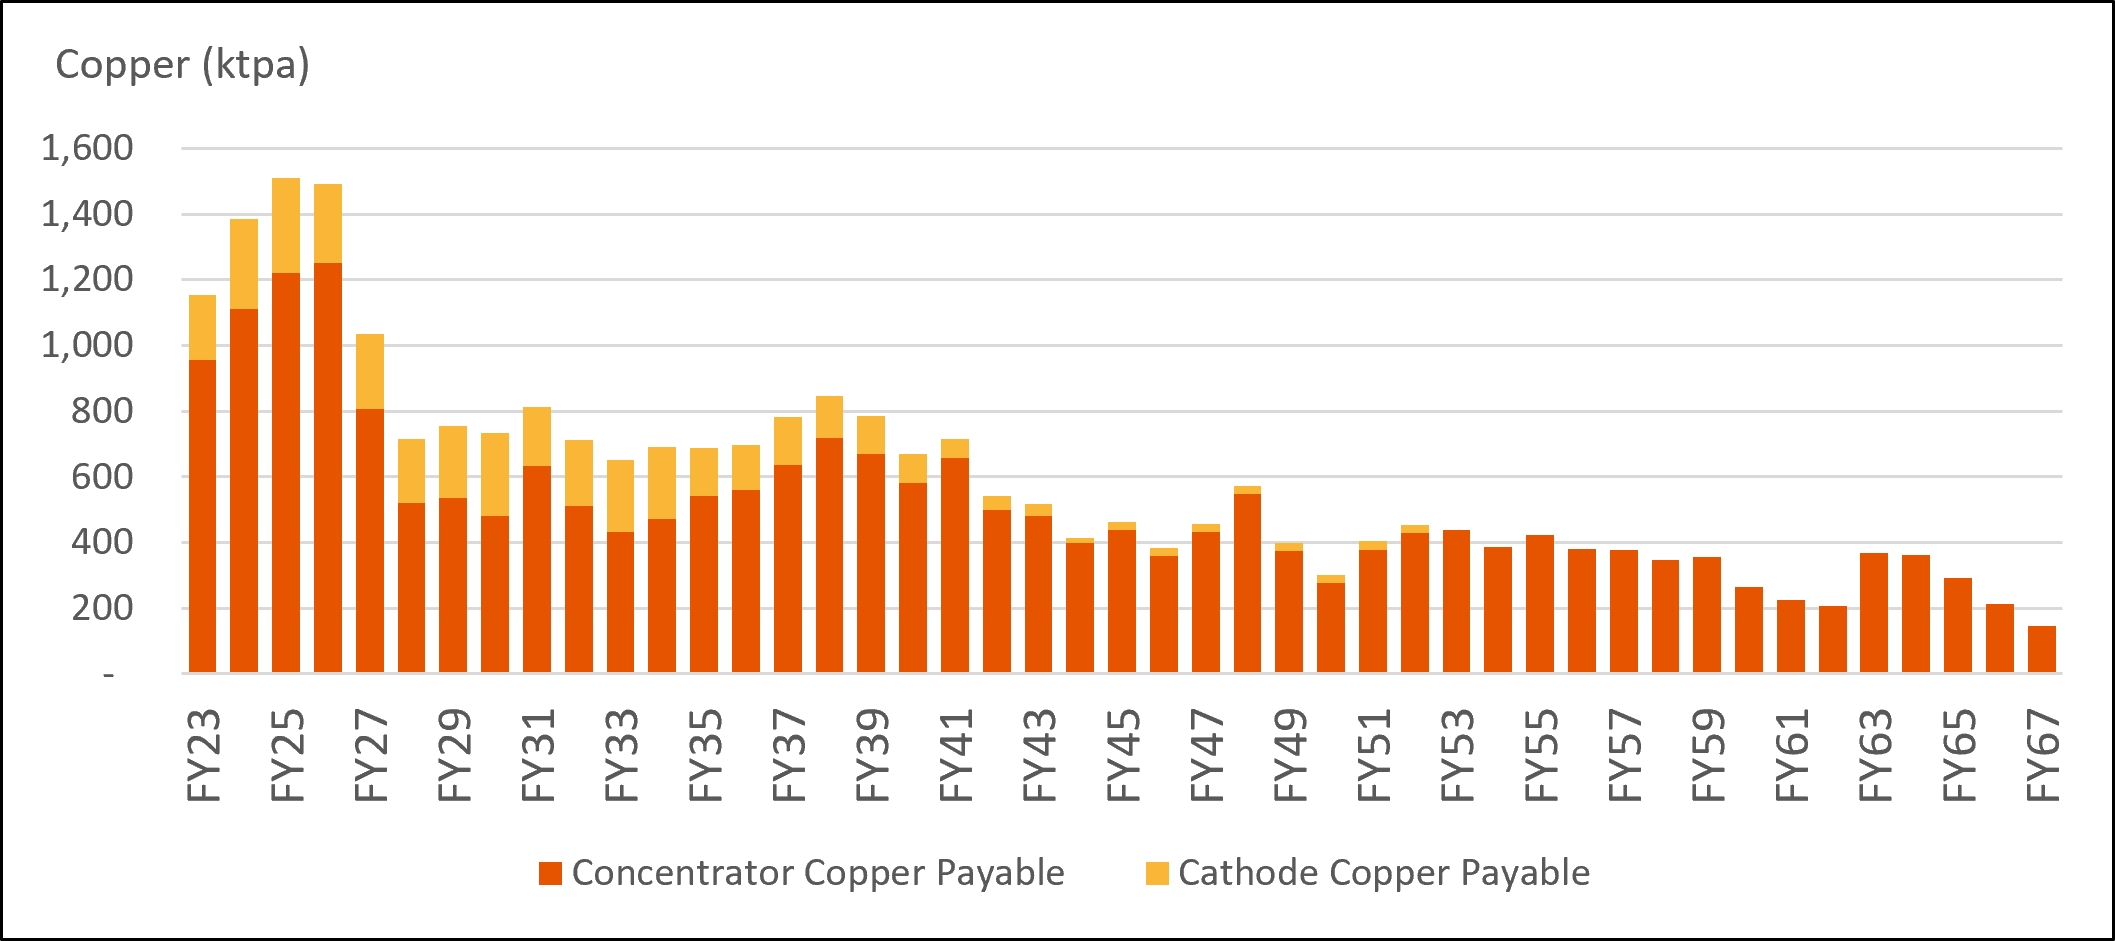
Note: The sole purpose of the presented information above is to demonstrate the economic viability of the mineral reserves for the purposes of reporting in accordance with S-K 1300 only and should not be used for other purposes. The annual cash flow data was prepared based upon Pre-Feasibility-level studies and three year historical prices and costs described in this Technical Report Summary; it is subject to change as assumptions and inputs are updated. The information presented does not guarantee future financial or operational performance. The presented information contains forward-looking statements. Please refer to "Note Regarding Forward Looking Statements" at the front of this Technical Report Summary.
Source: MEL (2022)
|
|
Figure 19‑1: |
SEC Production Schedule for MEL (100% MEL Terms) |
19.1.2.Prices and payable metals
The median value of the calendar month average Copper product, Gold and Silver subproducts prices for the preceding three financial years (July 2018 to June 2021) has been provided by the registrant. The prices (rounded to the nearest whole number) are presented in Table 19‑2, whilst only the long term copper price has been used for the estimation of mineral reserves, gold and silver are included since they do generate additional revenue from the copper driven mine plan. Average payable metals are shown in the Table 19‑3
|
|
|
|
MEL_TRS_June 2022_Mike |
June 2022 |
|
|
SEC Technical Report Summary – Minera Escondida Limitada |
Page 213 |
|
|
Table 19‑2: |
Long Term Product and Subproduct Prices |
|
|
|
Inputs |
Units |
Value |
Copper Price |
USD / lb |
2.79 |
Gold Price |
USD / troy oz |
1,536 |
Silver Price |
USD / troy oz |
17.2 |
Note: The sole purpose of the presented information above is to demonstrate the economic viability of the mineral reserves for the purposes of reporting in accordance with S-K 1300 only and should not be used for other purposes. The annual cash flow data was prepared based upon Pre-Feasibility-level studies and three year historical prices and costs described in this Technical Report Summary; it is subject to change as assumptions and inputs are updated. The information presented does not guarantee future financial or operational performance. The presented information contains forward-looking statements. Please refer to "Note Regarding Forward Looking Statements" at the front of this Technical Report Summary.
Source: MEL (2022)
|
|
Table 19‑3: |
Average Payable Metals |
|
|
|
|
Cu Concentrate* |
Cu Cathodes |
Au |
Ag |
96.2% |
100.0% |
90.0% |
90.0% |
Notes: 1) *Based on the SEC LOM Plan
2) The sole purpose of the presented information above is to demonstrate the economic viability of the mineral reserves for the purposes of reporting in accordance with S-K 1300 only and should not be used for other purposes. The annual cash flow data was prepared based upon Pre-Feasibility-level studies and three year historical prices and costs described in this Technical Report Summary; it is subject to change as assumptions and inputs are updated. The information presented does not guarantee future financial or operational performance. The presented information contains forward-looking statements. Please refer to "Note Regarding Forward Looking Statements" at the front of this Technical Report Summary.
Source: MEL (2022)
19.1.3.Foreign Exchange Rate
Input operating and capital costs for MEL are Chilean Pesos (CLP). An average foreign exchange rate for the preceding three financial years (July 2018 to June 2021) of 730.5 CLP/USD has been provided by the registrant to convert and present cash flows in US dollars.
19.1.4.Capital and Operating Costs
Capital costs (refer Section 18.2.1) are included in the cash flow to sustain from mine to the port production capacity required for the mineral reserves mine plan schedule along with typical mine replacement of mining equipment, pit pushbacks, development clear, replacement of plant instrumentation and sustaining tailings storage facilities. There are no material individual development expenditures (e.g., new mining hubs) expected to be required above the sustaining capital amounts to produce the mineral reserve.
Operating costs (refer Section 18.2.2) included in the cash flow are representative of operating conditions at MEL over the previous three financial years (July 2018 to June 2021) and are applied to the full mineral reserves activity schedule from mines to sales point.
Closure and rehabilitation costs throughout the production period and after end of mineral reserves mine life in 2067 have been included in the economic analysis (refer Section 17.5).
|
|
|
|
MEL_TRS_June 2022_Mike |
June 2022 |
|
|
SEC Technical Report Summary – Minera Escondida Limitada |
Page 214 |
The following taxes are assumed to be paid in the financial year incurred in the annual cash flow analysis:
•Chilean corporate tax rate of 27% based on the current statutory rate of Chile.
•Variable Mining Tax gross rate from 5% to 14% depending on the operating margin. Mining tax is deductible for corporate tax purposes.
•~ 8% Withholding Tax rate on dividend remittance (35% Withholding Tax rate less the corporate tax rate of 27%).
•Depreciation is estimated using the straight line method
19.1.7.Valuation Assumptions
Discounted annual cash flows are calculated using a 6.5% discount rate at a valuation date of 1 July 2022. The discount rate is provided by the registrant for utilisation in the economic analysis.
19.2.Results of Economic Analysis
Results of the economic analysis based on the annual production schedule of MEL mineral reserves is summarised at Table 19‑4 and Table 19-5. Total cash flow of US$18.7 billion, discounted to July 2022 at 6.5% results in a net present value (NPV) of US$10.5 billion.
|
|
Table 19‑4: |
Financial Metrics Summary |
|
|
Mineral Reserve Cash Flow Summary |
Value (US$B, real) |
Revenue |
100.9 |
Operating costs |
57.3 |
Capital expenditures |
11.8 |
Closure & rehabilitation |
1.5 |
Taxes |
11.6 |
After-tax cash flow |
18.7 |
Net present value (6.5%, Jul-22) |
10.5 |
Note: The sole purpose of the presented information above is to demonstrate the economic viability of the mineral reserves for the purposes of reporting in accordance with S-K 1300 only and should not be used for other purposes. The annual cash flow data was prepared based upon Pre-Feasibility-level studies and three year historical prices and costs described in this Technical Report Summary; it is subject to change as assumptions and inputs are updated. The information presented does not guarantee future financial or operational performance. The presented information contains forward-looking statements. Please refer to "Note Regarding Forward Looking Statements" at the front of this Technical Report Summary.
Source: MEL (2022)
|
|
|
|
MEL_TRS_June 2022_Mike |
June 2022 |
|
|
SEC Technical Report Summary – Minera Escondida Limitada |
Page 215 |
The annual cash flow presented in Figure 19‑2 includes all remaining closure and rehabilitation related annual cash flows summed after the final year of mineral reserves production, for clarity of presentation.
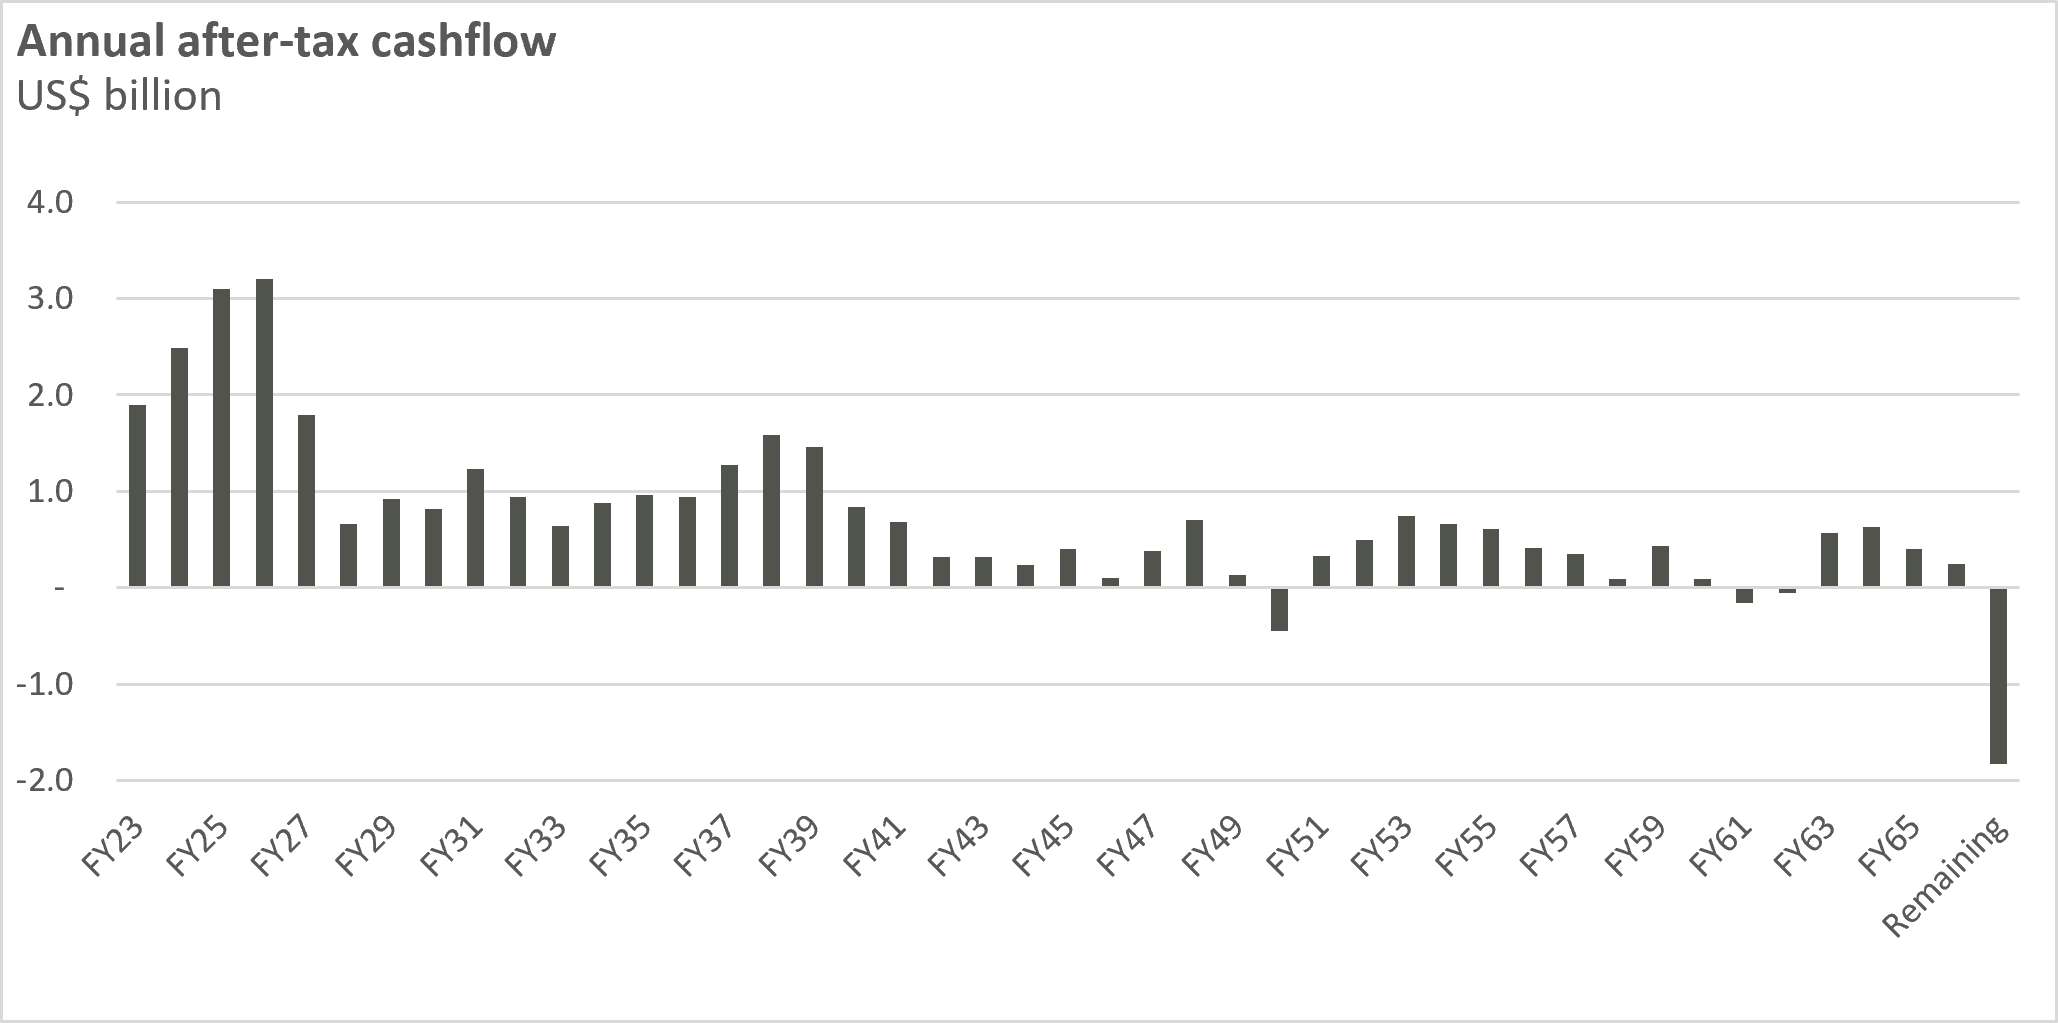
Note: The sole purpose of the annual cash flow data presented above is to demonstrate the economic viability of the mineral reserves for the purposes of reporting in accordance with S-K 1300 only and should not be used for other purposes. The annual cash flow data was prepared based upon Pre-Feasibility-level studies and three year historical prices and costs described in this Technical Report Summary; it is subject to change as assumptions and inputs are updated. The information presented does not guarantee future financial or operational performance. The presented information contains forward-looking statements. Please refer to “Note Regarding Forward Looking Statements” at the front of this Technical Report Summary.
Source: MEL (2022)
|
|
Figure 19‑2: |
Annual Cash Flow |
Table 19‑5 provides the cash flow summary on an annual basis. The annual cash flow is presented with the inputs as averages grouped in five-year groups given the annual inputs for each year are substantially the same throughout the relevant five-year groups. The closure and rehabilitation costs remaining after the final year of production are presented in aggregate (Remaining), and do not represent an annual average.
|
|
Table 19‑5: |
Cash Flow Summary (five-year averages) Minera Escondida - BHP Share |
|
|
|
|
|
|
|
|
|
|
|
|
Reserves
Economic Viability |
Financial Years ending 30 June |
|
|
2023-27 |
2028-32 |
2033-37 |
2038-42 |
2043-47 |
2048-52 |
2053-57 |
2058-62 |
2063-67 |
Remaining |
Material Movement including waste |
Mt |
290 |
275 |
266 |
259 |
270 |
261 |
126 |
151 |
74 |
0.0 |
Revenue |
US$ billion |
5.0 |
2.8 |
2.7 |
2.8 |
1.7 |
1.6 |
1.5 |
1.1 |
1.0 |
0.0 |
Operating costs |
US$ billion |
(2.2) |
(1.6) |
(1.5) |
(1.5) |
(1.2) |
(1.2) |
(0.9) |
(0.8) |
(0.6) |
0.0 |
Capital expenditures |
US$ billion |
(0.5) |
(0.4) |
(0.3) |
(0.3) |
(0.3) |
(0.2) |
(0.2) |
(0.2) |
(0.0) |
0.0 |
Closure & rehabilitation |
US$ billion |
(0.0) |
(0.0) |
(0.0) |
(0.0) |
(0.0) |
(0.0) |
(0.0) |
(0.0) |
(0.0) |
(1.2) |
Royalties and taxes |
US$ billion |
(0.9) |
(0.3) |
(0.3) |
(0.4) |
(0.1) |
(0.1) |
(0.2) |
(0.0) |
(0.1) |
0.0 |
After-tax cash flow |
US$ billion |
1.4 |
0.5 |
0.5 |
0.6 |
0.2 |
0.1 |
0.3 |
0.0 |
0.2 |
(1.2) |
Discounted cash flow |
US$ billion |
1.2 |
0.3 |
0.2 |
0.2 |
0.0 |
0.0 |
0.0 |
0.0 |
0.0 |
(0.1) |
Note: The sole purpose of the annual cash flow data presented above is to demonstrate the economic viability of the mineral reserves for the purposes of reporting in accordance with S-K 1300 only and should not be used for other purposes. The annual cash flow data was prepared based upon Pre-Feasibility-level studies and three year historical prices and costs described in this Technical Report Summary; it is subject to change as assumptions and inputs are updated. The information presented does not guarantee future financial or operational performance. The presented information contains forward-looking statements. Please refer to “Note Regarding Forward Looking Statements” at the front of this Technical Report Summary.
Source: MEL (2022)
|
|
|
|
MEL_TRS_June 2022_Mike |
June 2022 |
|
|
SEC Technical Report Summary – Minera Escondida Limitada |
Page 216 |
As there is no initial capital investment to be recovered, the internal rate of return (IRR) and payback period are not applicable for this cash flow analysis or economic viability.
It is the Qualified Person’s opinion that extraction of the mineral reserves is economically viable.
19.3.Sensitivity Analysis
Economic sensitivity analysis results are presented at Table 19‑6 based on variations in significant input parameters and assumptions.
|
|
Table 19‑6: |
Results of Sensitivity Analysis |
|
|
|
|
NPV US$ billion |
-25% |
Reference |
+25% |
Copper price |
3.7 |
10.5 |
17.1 |
Foreign exchange rate (CLP / USD) |
9.3 |
10.5 |
11.3 |
Capex |
11.4 |
10.5 |
9.7 |
Opex |
14.1 |
10.5 |
6.8 |
Cu Grade |
5.0 |
10.5 |
15.9 |
Note: The sole purpose of the presented information above is to demonstrate the economic viability of the mineral reserves for the purposes of reporting in accordance with S-K 1300 only and should not be used for other purposes. The annual cash flow data was prepared based upon Pre-Feasibility-level studies and three year historical prices and costs described in this Technical Report Summary; it is subject to change as assumptions and inputs are updated. The information presented does not guarantee future financial or operational performance. The presented information contains forward-looking statements. Please refer to "Note Regarding Forward Looking Statements" at the front of this Technical Report Summary.
Source: MEL (2022)
In the opinion of the Qualified Person the NPV of MEL mineral reserves is robust to variation in significant input parameters.
MEL is located adjacent to Compañía Minera Zaldivar (CMZ), owned by Antofagasta Minerals. MEL and CMZ are mining the same mineralization and currently MEL’s Escondida Norte pit and the CMZ main pit share a common pit wall (Figure 20‑1).
CMZ and MEL have historic agreements in place with regards to CMZ accessing areas that fall within the MEL property, as well as MEL gaining access to portions of the Escondida Norte pit that fall within the CMZ mine property.
In Antofagasta Minerals most recent annual report (“Annual Report 2021”) state that the Zaldivar mine is expected to operate until 2036. They also note that 20% of the ore reserves at Zaldivar impact a portion of MEL’s mine property, as well as infrastructure owned by third parties (road, railway, powerline and pipelines).
|
|
|
|
MEL_TRS_June 2022_Mike |
June 2022 |
|
|
SEC Technical Report Summary – Minera Escondida Limitada |
Page 217 |
Maps presented in this chapter use UTM projection PSAD56.
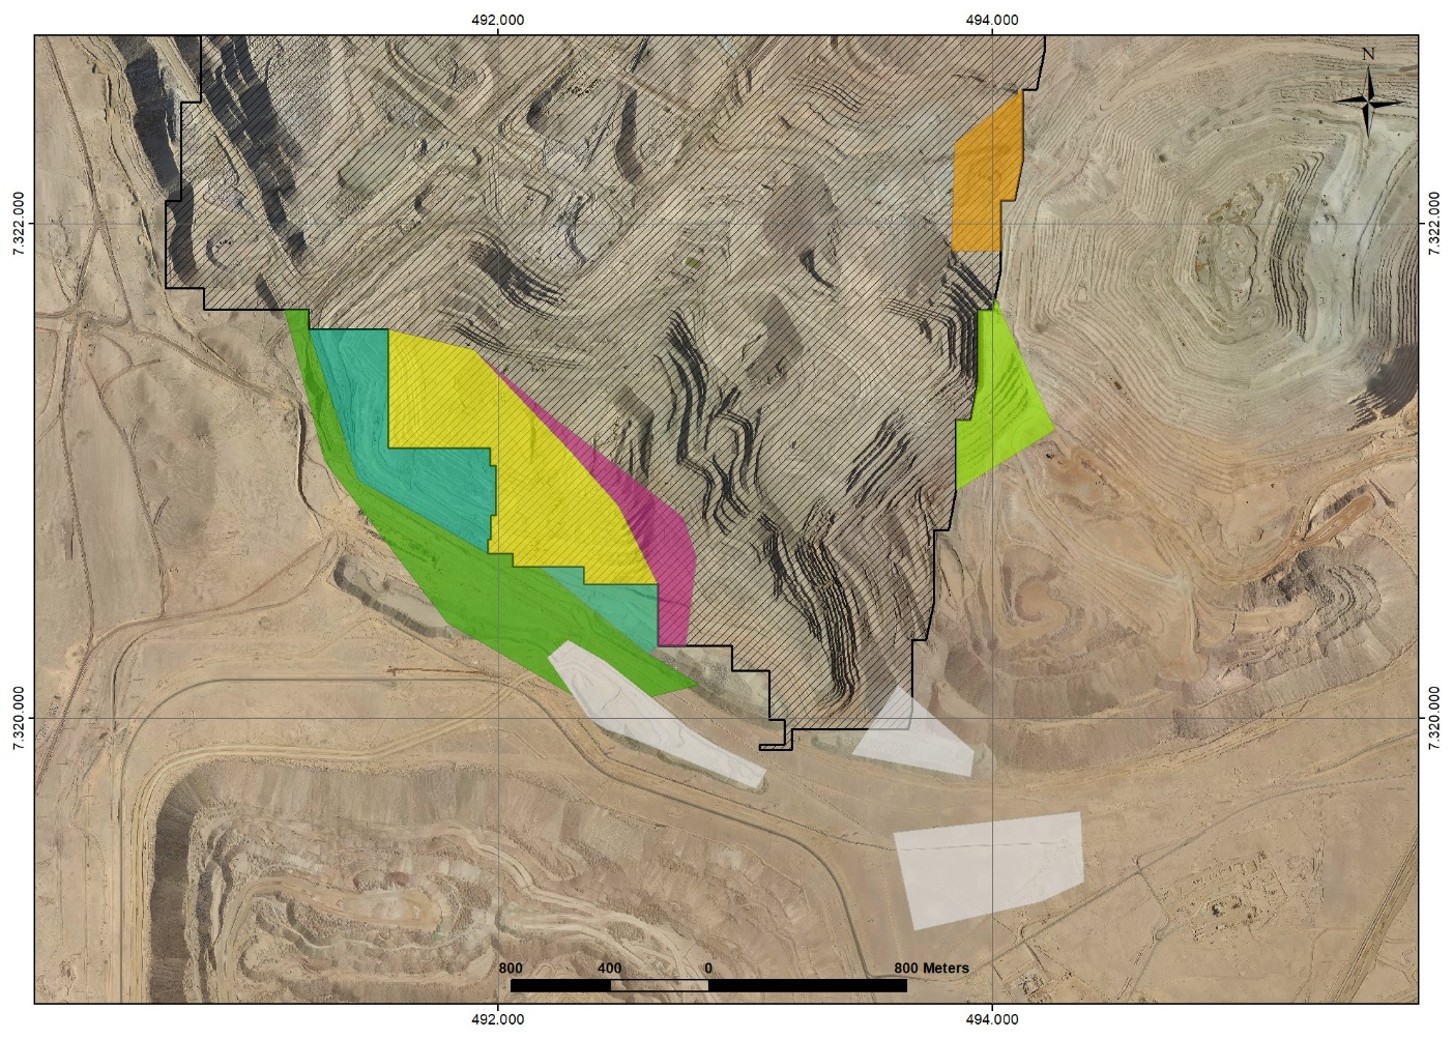
Note: Coloured areas show sections covered by the historic agreements between CMZ and MEL
|
|
Figure 20‑1: |
CMZ Located Next to Escondida Norte Pit |
21.Other Relevant Data and Information
An independent audit of the MEL Ore Reserves were carried out during May 2020 undertaken by Golder Associates S.A. for the Ore Reserves statement as at June 30, 2020.
The main conclusions of Golders audit are presented below. Specific technical conclusions are presented throughout the report.
•The method used to define and estimate Ore Reserves is adequate.
•The modifying factors used to convert mineral resources to Ore Reserves were correctly applied.
•The economic analysis indicates a positive cash flow based on the production schedule adopted.
•The Ore Reserves were reproduced by Golder (tonnes and grades) according to the statement as at June 30, 2020, provided by BHP.
•No fatal flaws were identified during the audit.
|
|
|
|
MEL_TRS_June 2022_Mike |
June 2022 |
|
|
SEC Technical Report Summary – Minera Escondida Limitada |
Page 218 |
•No recommendations classified as Priority 1 or Priority 2 were identified during the audit.
•The Ore Reserves reported by BHP as at June 30, 2020, comply with BHP internal documents Tenement Management and Mineral Reporting (BHP, 2016) and US SEC Mineral Reserves Reporting (BHP, 2018).
Annual internal Risk Reviews are conducted jointly by MEL and the BHP Resource Centre of Excellence to ensure significant and material risks to tenure, mineral resources and mineral reserves are adequately managed. The Risk Review process identifies key reporting changes regarding the annual declaration of mineral resources and mineral reserves and agreed actions requiring completion prior to BHP’s annual reporting. Issues and opportunities identified during the Risk Reviews inform the Annual Assurance Plan and scopes for potential Controls Effectiveness Collaborative Assessment reviews and identify good practice that can be shared across BHP.
The risk review conducted in FY22 found no Significant Deficiencies.
Mine Plan Compliance was estimated for FY22, comparing expit movement per phase to 2YBudget22 Plan (F11), from July 2021 to April 2022 (March 2022 YTD F11).
During the fiscal year the delay in the mine sequence is 7Mt (98% volumetric compliance), with delays in PL01, N017 and N011 being offset be advances in other pushbacks (Figure 21-1).
•PL01 - Delayed zones due to change in sequence compared to F11 & deviation at initial start surface FY22. Actual extraction sequence focused on the north of pushback rather than south.
•N017 - Delay due to less expit movement at the beginning of FY22, 2 shovels operated vs 3 shovels planned. In the 2nd Half of FY22 with change in sequence between centre of pushback rather than west of pushback.
•E007 - Is ahead of plan because F11 considered extraction of the pushback in June FY22 (detention from July to May). The advances are due to delays in the removal of the antenna (N11 pushback) at the beginning of FY22 and the detention of N568 pushback in September
•N011 - Delayed because the antenna was removed in July FY22 and until to February with less movement than planned in F11
|
|
|
|
MEL_TRS_June 2022_Mike |
June 2022 |
|
|
SEC Technical Report Summary – Minera Escondida Limitada |
Page 219 |
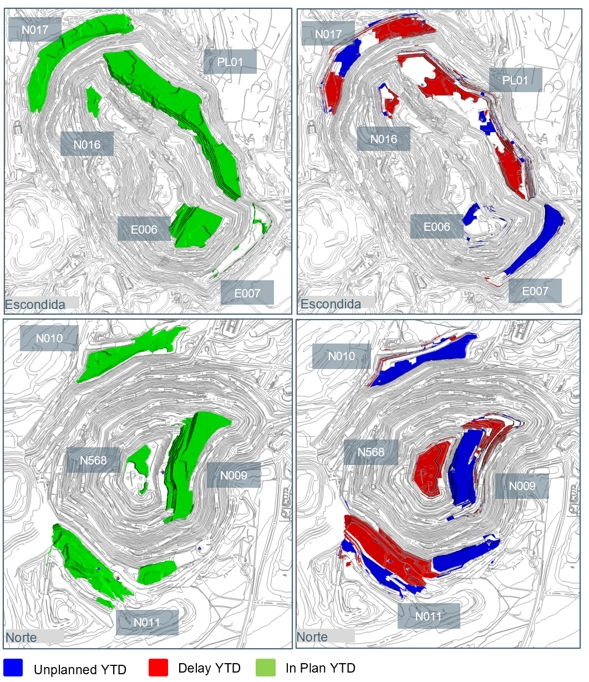
|
|
Figure 21‑1: |
In Plan vs Delayed vs Unplanned |
|
|
|
|
MEL_TRS_June 2022_Mike |
June 2022 |
|
|
SEC Technical Report Summary – Minera Escondida Limitada |
Page 220 |
Figure 21-2 shows volumetric YTD delayed and unplanned expit movement per pushback for FY22, referred 2YBudget22.
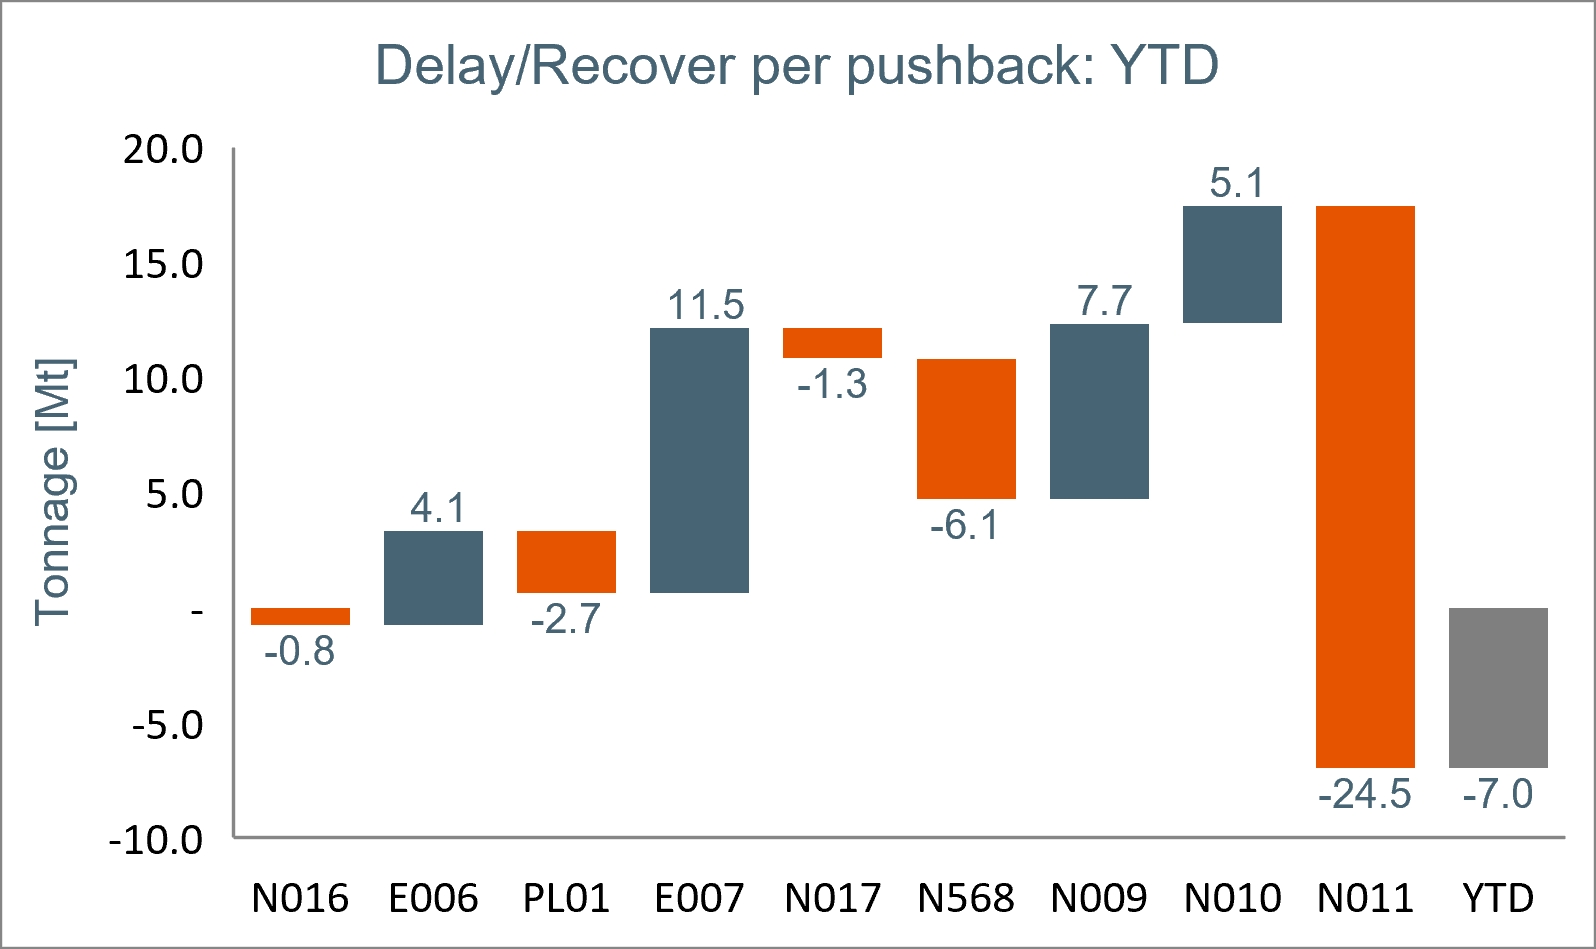
|
|
Figure 21‑2: |
Volumetric delay-recover per pushback, from July to March FY22 |
22.Interpretation and Conclusions
MEL has mineral resources and mineral reserves supported by drilling programmes, all within the boundaries of the MEL Special Mining lease and within 15 km radius of existing infrastructure. The vertically integrated nature of the mining and processing facilities located close to the ore body provides the flexibility to add and optimise growth tonnes to existing infrastructure
Mineral resources confidence is reflected in the applied resource classifications in accordance with the SEC S-K 1300 Regulations with factors influencing mineral resources classification including but not limited to data density, data quality, geological continuity and/or complexity, estimation quality and weathering zones. Reconciliation data from operating mines supports the confidence of resource estimates.
Geology and mineralisation are well understood through three decades of active mining, and MEL has used relevant available data sources to integrate into the modelling effort at the scale of a long term resource for public reporting. A 3D implicit geological model informed by drilling and pit mapping to constrain and control the shapes of lithology, alteration, and mineralisation of the deposit. Copper grades were interpolated into a block model using ordinary kriging methods. Results were validated visually, via various statistical comparisons, and against recent reconciliation data. The estimate was depleted for current production, categorised in a manner consistent with industry standards. Mineral resources have been reported using an optimised pit shape, based on economic and mining assumptions to support the reasonable potential for eventual economic extraction of the resource. A cut-off grade has been derived from these economic parameters, and the resource has been reported above this cut-off. The above process occurs annually in preparation for MEL’s annual business planning cycle.
In QP’s is of the opinion, that the mineral resources stated herein are appropriate for public disclosure and meet the definitions of Indicated and Inferred resources established by the SEC S-K 1300 Regulations and industry standards.
|
|
|
|
MEL_TRS_June 2022_Mike |
June 2022 |
|
|
SEC Technical Report Summary – Minera Escondida Limitada |
Page 221 |
Mineral reserves have been estimated in consideration of both internal and regulatory requirements. Economic assumptions that were applied are consistent with company protocols. An iterative and comprehensive planning process is in place whereby final pit phase designs are reviewed by the geotechnical department in order to endorse the final pushback designs.
FY22 statement considered three concentrator plants operating until FY27, Los Colorados ceases operation at this year and then two concentrators are expected to remain until the end of this operation (Laguna Seca L1 and L2). In terms of the process of cathodes, Sulphide Leach operates until FY56 and OLAP until FY34.
Uncertainties that affect the reliability or confidence in the mineral reserves estimate include but are not limited to:
•Future macro-economic environment, including product prices and foreign exchange rate;
•Changes to operating cost assumptions, including labour costs;
•Ability to extend the mine life after FY50 when we are required to renew our surface rights which are expected to require a new Environmental Impact Assessment (EIA);
•Ability to maintain environmental and social license to operate;
Confidence in the mineral reserves is reflected in the applied reserve classifications in accordance with the SEC S-K 1300 Regulations with factors influencing classification including but not limited to mining methods, processing methods, economic assessment and other life of asset and closure assessments. Reconciliation data from the existing operation supports the confidence of reserve estimates. As with the generation of the Geological and mineral resources models, mine planning is undertaken on an annual basis to inform the MEL business planning process.
In the opinion of the Qualified Person, the positive project NPV provides confidence in the mineral reserve estimates and the supporting mine plan, under the set of assumptions and parameters used in which they were developed.
23.1.Recommended Work Programmes
23.1.1.Geology and Mineral Resources
Maintain, according to the MEL standard, target a minimum of 90% of measured resources for the first two years of production and a minimum of 80% of measured resources for the following three years. This is achieved through the yearly drilling of the deposits focussed upon reducing geological uncertainty in required areas. This data gathering activity both informs the long term planning process and also reduces risk to the medium term (5 year) operational window. This continuation of the annual activity is the fundamental recommendation for geology and mineral resources being the key risk management tool for geological uncertainty.
Better understanding of the geological features will be needed for the deeper portions of the Escondida deposit but at this time this part of the mineralisation isn’t mined until after year 2045.
Continue the process of annual updates of the mineral reserves in line with the annual planning processes. This may be required more frequently if new information becomes available that materially impacts one or more of the modifying factors. Continue with the periodical independent review of mineral reserves estimation methodology and implementation of any identified recommendations from the review outcomes.
|
|
|
|
MEL_TRS_June 2022_Mike |
June 2022 |
|
|
SEC Technical Report Summary – Minera Escondida Limitada |
Page 222 |
Alpers, C.N., and Brimhall, GH., 1988, Middle Miocene climatic change in the Atacama Desert, northern Chile: Evidence from supergene mineralization at La Escondida: Geological Society of America Bulletin, v. 100, pp. 1640–1656.
Brimhall, G.H., Alpers, C.N., and Cunningham, A.B., 1985, Analysis of supergene ore forming processes and ground-water solute transport using mass balance principles: Economic Geology, v. 80, pp. 1227–1256.
Hervé, M., Sillitoe, R. H., Wong, C., Fernández, P., Crignola, F., Ipinza, M., & Urzúa, F. 2012, Geologic overview of the Escondida porphyry copper district, northern Chile. Society of Economic Geologists Special Publication 16, pp. 55–78.
Jara, C., Rabbia, O., and Valencia, V., 2009, Petrología y dataciones U-Pb del depósito tipo pórfido Cu Zaldívar, II Región de Antofagasta, Chile: Congreso Geológico Chileno, 12th, Santiago, 2009, Actas, Pendrive, 4 p.
Maksaev, V., Marinovic, N., Smoje, I. and Mpodozis, C., 1991, Mapa Geológico de la Hoja Augusta Victoria. Servicio Nacional de Geología y Minería. Documento de trabajo 1. 1 mapa escala 1: 100.000. Santiago
Marinovic, N., Smoje, I., Maksaev, V., Hervé, M., and Mpodozis, C., 1995, Hoja Aguas Blancas, Región de Antofagasta. Escala 1:250,000: Servicio Nacional de Geología y Minería, Carta Geológica de Chile 70, 150 p.
Maturana, M., and Saric, N., 1991, Geología y mineralización del yacimiento tipo pórfido cuprífero Zaldívar, en los Andes del norte de Chile: Revista Geológica de Chile, v. 18, pp. 109–120.
Mpodozis, C., Marinovic, N., and Smoje, I., 1993a, Eocene left lateral strike slip faulting and clockwise block rotations in the Cordillera de Domeyko, west of the Salar de Atacama, northern Chile: International Symposium on Andean Geodynamics, 2nd, Oxford, U.K., 1993, Proceedings, pp. 225–228.
Mpodozis, C., Marinovic, N. y Smoje, I., 1993, Estudio geológico-estructural de la Cordillera de Domeyko entre Sierra Limón Verde y Sierra Mariposas, Región de Antofagasta. Servicio Nacional de Geología y Minería, Chile, Informe Registrado IR-93-04, 282 p.
Mpodozis, C. and Cornejo, P., 2012, Cenozoic Tectonics and Porphyry Copper Systems of the Chilean Andes. Society of Economic Geologists Special Publication 16, pp. 329–360.
Monroy, C., 2000, Nuevos antecedentes geológicos del pórfido cuprífero Zaldívar, II Región, Chile: Congreso Geológico Chileno, 9th, Puerto Varas, 2000, Actas, v. 1, pp. 293–297.
Morales, P., 2009, Geología y edad de la zone hipógena del yacimiento Zaldívar, II Región, Chile: Unpublished Memoria de Título, Antofagasta, Universidad Católica del Norte, 136 p.
Navarro, M., Monroy, C., Rubio, M., Bustamante, V., Morales, P., Ramírez, C., Osorio, K., Machulás, K., Maldonado, M., Vera, C., Solís, S., and Me rino, R., 2009, Actualización de la geología del yacimiento Zaldívar: Con greso Geológico Chileno, 12th, Santiago, 2009, Actas, Pendrive, 4 p.
Ojeda, J.M., 1986, The Escondida porphyry copper deposit, II Region, Chile: Exploration drilling and current geological interpretation, in Mining Latin America: London, Institution of Mining and Metallurgy, pp. 299–318.
Ojeda, J.M., 1990, Geology of the Escondida porphyry copper deposit, II Region, Chile: Pacific Rim Congress 90, Gold Coast, Queensland, 1990, Proceed ings, v. 2, p. 473–483.
|
|
|
|
MEL_TRS_June 2022_Mike |
June 2022 |
|
|
SEC Technical Report Summary – Minera Escondida Limitada |
Page 223 |
Padilla-Garza, R.A., Titley, S.R., and Pimentel, F., 2001, Geology of the Escondida porphyry copper deposit, Antofagasta Region, Chile: Economic Geology, v. 96, pp. 307–324.
Padilla-Garza, R.A., Titley, S.R., and Eastoe, C.J., 2004, Hypogene evolution of the Escondida porphyry copper deposit, Chile: Society of Economic Geologists Special Publication 11, pp. 141–165.
Preece, C.K., Williams, M.J., Gilligan, J.M., 2019, Development of partial extraction methods to estimate abundance of copper-iron sulphide minerals in the Escondida Norte porphyry copper deposit, Chile: Geochemistry: Exploration, Environment, Analysis, v. 18 pp. 13–30.
Richards, J.P., Noble, S.R., and Pringle, M.S., 1999, A revised late Eocene age for porphyry Cu magmatism in the Escondida area, northern Chile: Economic Geology, v. 94, pp. 1231–1248.
Richards, J.P., Boyce, A.J., and Pringle, M.S., 2001, Geologic evolution of the Escondida area, northern Chile: A model for spatial and temporal localization of porphyry copper mineralization: Economic Geology, v. 96, pp. 271–305
Sillitoe, R.H., and Perelló, J., 2005: Andean copper province: Tectonomagmatic settings, deposit types, metallogeny, exploration, and discovery: Economic Geology 100th Anniversary Volume, pp. 845–890
Superintendencia Geología 2021., Pórfido Intramineral, Nota Técnica Interna, Minera Escondida Limitada, 8 p..
Urzúa, F., 2009. Geology, geochronology, and structural evolution of La Escondida copper district, northern Chile. Ph.D. Thesis, University of Tasmania, Hobart, Australia. 486 p.
Véliz, W., and Camacho, J., 2003, Antecedentes geológicos del yacimiento La Escondida: Congreso Geológico Chileno, 10th, Concepción, 2003, Actas, CD-ROM, 10 p.
Véliz, W.O., 2004, Relación espacio-temporal del sistema pórfido cuprífero y epitermal en el yacimiento Escondida, Provincia de Antofagasta, Segunda Región, Chile: Unpublished Masters thesis, Antofagasta, Universidad Católica del Norte, 139 p.
Williams, M.J., 2003, Geology and resources of the Escondida Norte deposit, Region II, Chile [abs.]: Congreso Geológico Chileno, 10th, Concepción, 2003, Actas, CD-ROM, 1 p.
Wong, C., 2013, Evidencias de Deformación Terciaria en el Distrito Escondida, Nota Interna Gerencia de Exploraciones de Minera Escondida Limitada, 32 p.
|
|
|
|
MEL_TRS_June 2022_Mike |
June 2022 |
|
|
SEC Technical Report Summary – Minera Escondida Limitada |
Page 224 |
25.Reliance on Information Provided by the Registrant
The qualified persons have relied on information provided by BHP in preparing their findings and conclusions regarding certain aspects of modifying factors, which are listed in Table 25‑1.
|
|
Table 25‑1: |
Reliance on Information Provided by the Registrant |
|
|
|
|
Category |
Report Section/
Portion |
Portion of Technical Report Summary |
Disclose Why the Qualified Person Considers it Reasonable to Rely upon the Registrant |
Macro- economic Assumptions |
Section 19.1 |
Standard discount rate and foreign exchange rate |
Matters related to discount rates and interest rates are maintained by financial professionals within BHP and the accounting practices are audited annually by external auditors. |
Governmental factors |
Section 19.1 |
Royalty and taxation |
These are external factors that BHP has to comply with and data is maintained by financial professionals within BHP |
Source: MEL (2022)
|
|
|
|
MEL_TRS_June 2022_Mike |
June 2022 |