Exhibit 99.2
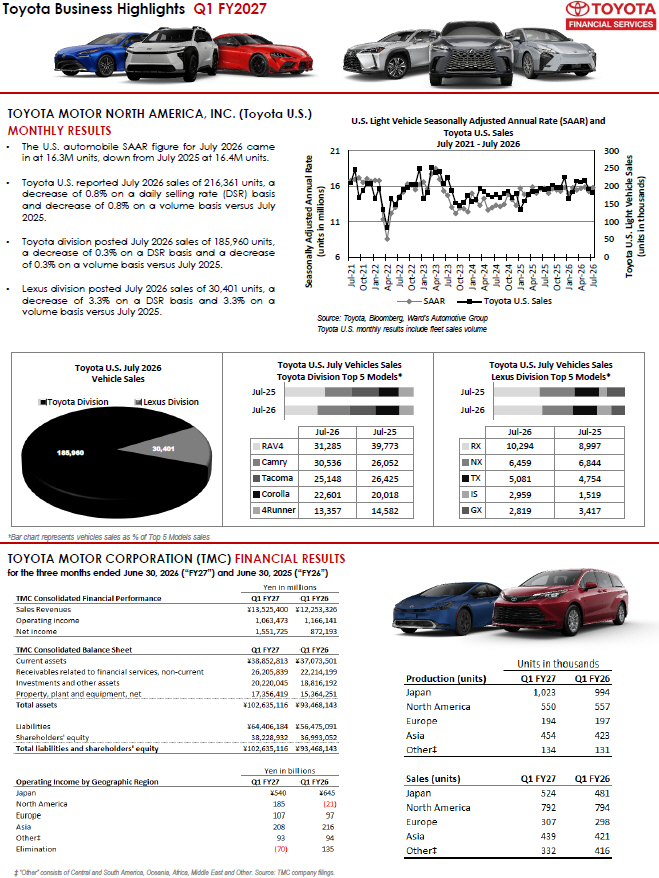
Toyota Business Highlights Q1 FY2027 TOYOTA MOTOR NORTH AMERICA, INC. (Toyota U.S.) MONTHLY RESULTS • The U . S . automobile SAAR figure for July 2026 came in at 16 . 3 M units, down from July 2025 at 16 . 4 M units . • Toyota U . S . reported July 2026 sales of 216 , 361 units, a decrease of 0 . 8 % on a daily selling rate (DSR) basis and decrease of 0 . 8 % on a volume basis versus July 2025 . • Toyota division posted July 2026 sales of 185 , 960 units, a decrease of 0 . 3 % on a DSR basis and a decrease of 0 . 3 % on a volume basis versus July 2025 . • Lexus division posted July 2026 sales of 30 , 401 units, a decrease of 3 . 3 % on a DSR basis and 3 . 3 % on a volume basis versus July 2025 . Source: Toyota, Bloomberg, Ward’s Automotive Group Toyota U.S. monthly results include fleet sales volume TOYOTA MOTOR CORPORATION (TMC) FINANCIAL RESULTS for the three months ended June 30, 2026 (“FY27”) and June 30, 2025 (“FY26”) ‡ “Other” consists of Central and South America, Oceania, Africa, Middle East and Other. Source: TMC company filings. *Bar chart represents vehicles sales as % of Top 5 Models sales 0 50 100 150 200 250 300 6 11 16 21 Jul-21 Oct-21 Jan-22 Apr-22 Jul-22 Oct-22 Jan-23 Apr-23 Jul-23 Oct-23 Jan-24 Apr-24 Jul-24 Oct-24 Jan-25 Apr-25 Jul-25 Oct-25 Jan-26 Apr-26 Jul-26 Toyota U.S. Light Vehicle Sales (units in thousands) Seasonally Adjusted Annual Rate (units in millions) U.S. Light Vehicle Seasonally Adjusted Annual Rate (SAAR) and Toyota U.S. Sales July 2021 - July 2026 SAAR Toyota U.S. Sales 185,960 30,401 Toyota Division Lexus Division Toyota U.S. July 2026 Vehicle Sales Jul-26 Jul-25 Jul-26 Jul-25 RAV4 31,285 39,773 Camry 30,536 26,052 Tacoma 25,148 26,425 Corolla 22,601 20,018 4Runner 13,357 14,582 Toyota U.S. July Vehicles Sales Toyota Division Top 5 Models* Jul-26 Jul-25 Jul-26 Jul-25 RX 10,294 8,997 NX 6,459 6,844 TX 5,081 4,754 IS 2,959 1,519 GX 2,819 3,417 Toyota U.S. July Vehicles Sales Lexus Division Top 5 Models*
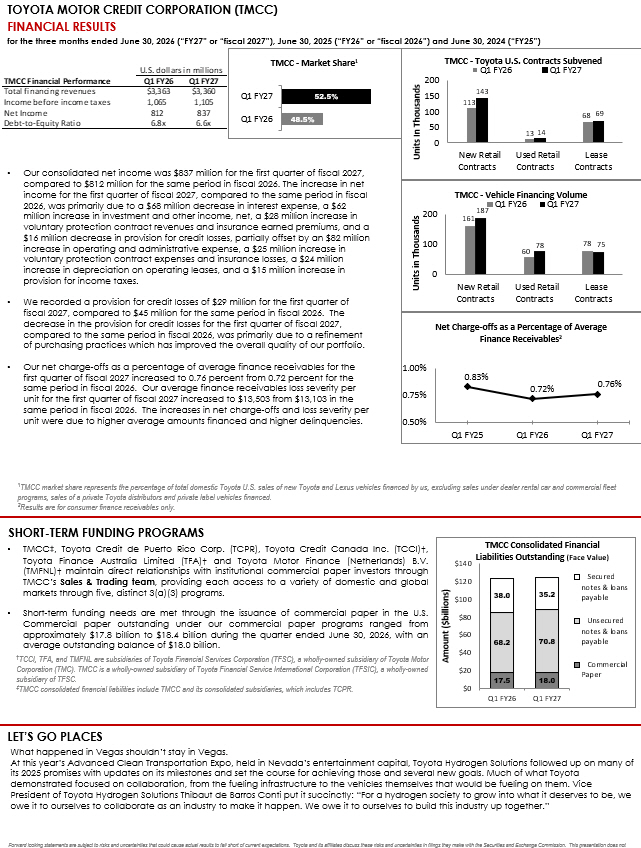
TOYOTA MOTOR CREDIT CORPORATION (TMCC) FINANCIAL RESULTS for the three months ended June 30, 2026 (“FY27” or “fiscal 2027”), June 30, 2025 (“FY26” or “fiscal 2026”) and June 30, 2024 (“ FY25”) • Our consolidated net income was $837 million for the first quarter of fiscal 2027, compared to $812 million for the same period in fiscal 2026. The increase in net income for the first quarter of fiscal 2027, compared to the same period in fiscal 2026, was primarily due to a $68 million decrease in interest expense, a $62 million increase in investment and other income, net, a $28 million increase in voluntary protection contract revenues and insurance earned premiums, and a $16 million decrease in provision for credit losses, partially offset by an $82 million increase in operating and administrative expense, a $25 million increase in voluntary protection contract expenses and insurance losses, a $24 million increase in depreciation on operating leases, and a $15 million increase in provision for income taxes. • We recorded a provision for credit losses of $29 million for the first quarter of fiscal 2027, compared to $45 million for the same period in fiscal 2026. The decrease in the provision for credit losses for the first quarter of fiscal 2027, compared to the same period in fiscal 2026, was primarily due to a refinement of purchasing practices which has improved the overall quality of our portfolio. • Our net charge - offs as a percentage of average finance receivables for the first quarter of fiscal 2027 increased to 0.76 percent from 0.72 percent for the same period in fiscal 2026. Our average finance receivables loss severity per unit for the first quarter of fiscal 2027 increased to $13,503 from $13,103 in the same period in fiscal 2026. The increases in net charge - offs and loss severity per unit were due to higher average amounts financed and higher delinquencies. 1 TMCC market share represents the percentage of total domestic Toyota U.S. sales of new Toyota and Lexus vehicles financed by us, excluding sales under dealer rental car and commercial fleet programs, sales of a private Toyota distributors and private label vehicles financed. 2 Results are for consumer finance receivables only. SHORT - TERM FUNDING PROGRAMS • TMCC ‡ , Toyota Credit de Puerto Rico Corp . (TCPR), Toyota Credit Canada Inc . (TCCI)†, Toyota Finance Australia Limited (TFA)† and Toyota Motor Finance (Netherlands) B . V . (TMFNL)† maintain direct relationships with institutional commercial paper investors through TMCC’s Sales & Trading team , providing each access to a variety of domestic and global markets through five, distinct 3 (a)( 3 ) programs . • Short - term funding needs are met through the issuance of commercial paper in the U . S . Commercial paper outstanding under our commercial paper programs ranged from approximately $ 17 . 8 billion to $ 18 . 4 billion during the quarter ended June 30 , 2026 , with an average outstanding balance of $ 18 . 0 billion . † TCCI, TFA, and TMFNL are subsidiaries of Toyota Financial Services Corporation (TFSC), a wholly - owned subsidiary of Toyota Motor Corporation (TMC). TMCC is a wholly - owned subsidiary of Toyota Financial Service International Corporation (TFSIC), a wholly - own ed subsidiary of TFSC. ‡ TMCC consolidated financial liabilities include TMCC and its consolidated subsidiaries, which includes TCPR. LET’S GO PLACES What happened in Vegas shouldn’t stay in Vegas. At this year’s Advanced Clean Transportation Expo, held in Nevada’s entertainment capital, Toyota Hydrogen Solutions followed up on many of its 2025 promises with updates on its milestones and set the course for achieving those and several new goals. Much of what Toyo ta demonstrated focused on collaboration, from the fueling infrastructure to the vehicles themselves that would be fueling on them. Vice President of Toyota Hydrogen Solutions Thibaut de Barros Conti put it succinctly: “For a hydrogen society to grow into what it d eserves to be, we owe it to ourselves to collaborate as an industry to make it happen. We owe it to ourselves to build this industry up togethe r.” Forward looking statements are subject to risks and uncertainties that could cause actual results to fall short of current ex pec tations. Toyota and its affiliates discuss these risks and uncertainties in filings they make with the Securities and Exchan ge Commission. This presentation does not constitute an offer to purchase any securities. Any offer or sale of securities will be made only by means of a prospectus a nd related documentation . TMCC Financial Performance Q1 FY26 Q1 FY27 Total financing revenues $3,363 $3,360 Income before income taxes 1,065 1,105 Net Income 812 837 Debt-to-Equity Ratio 6.8x 6.6x U.S. dollars in millions 48.5% 52.5% Q1 FY26 Q1 FY27 TMCC - Market Share 1 113 13 68 143 14 69 0 50 100 150 200 New Retail Contracts Used Retail Contracts Lease Contracts Units In Thousands TMCC - Toyota U.S. Contracts Subvened Q1 FY26 Q1 FY27 161 60 78 187 78 75 0 100 200 New Retail Contracts Used Retail Contracts Lease Contracts Units in Thousands TMCC - Vehicle Financing Volume Q1 FY26 Q1 FY27 0.83% 0.72% 0.76% 0.50% 0.75% 1.00% Q1 FY25 Q1 FY26 Q1 FY27 Net Charge - offs as a Percentage of Average Finance Receivables 2 17.5 18.0 68.2 70.8 38.0 35.2 $0 $20 $40 $60 $80 $100 $120 $140 Q1 FY26 Q1 FY27 Amount ($billions) TMCC Consolidated Financial Liabilities Outstanding (Face Value) Secured notes & loans payable Unsecured notes & loans payable Commercial Paper