Exhibit 99.5
PRE-ELECTION
REPORT
ON THE STATE OF
QUÉBEC'S PUBLIC FINANCES
AUGUST 2026
MESSAGE FROM THE MINISTER OF FINANCE
Nathalie Roy
President of the National Assembly
Hôtel du Parlement
1045, rue des Parlementaires
Québec (Québec) G1A 1A3
Madam President,
It is my honour to send you the Pre-election Report on the State of Québec's Public Finances - August 2026, in accordance with the Act respecting the Ministère des Finances.
As required by this Act, the Auditor General of Québec is supporting this publication with an assurance report on the plausibility of the economic and budgetary outlook included herein.
The publication of the pre-election report demonstrates the Québec government's commitment to report with transparency on the state of Québec's public finances in the run-up to the general election. This commitment is a cornerstone of the management of Québec's public finances.
The Pre-election Report on the State of Québec's Public Finances - August 2026 is based on the financial framework of the Québec Budget Plan - March 2026, to which the necessary adjustments were made in accordance with the most recent economic and budgetary information available.
The financial framework of this report is based on a prudent economic scenario, as trade tensions with the United States remain high and the international geopolitical landscape continues to be marked by numerous uncertainties, particularly in the Middle East.
— To account for risks, the financial framework includes provisions totalling $9.0 billion over the forecast horizon. These provisions are intended to preserve the leeway needed to cope with unforeseen expenditures or to mitigate the effects of more-moderate-than-anticipated economic growth.
❏ The economic and budgetary situation
The financial framework presented in this report is based on economic assumptions that take into account the most recent economic and fiscal outlook.
The Ministère des Finances forecasts real GDP growth of 0.7% in 2026 and 1.4% in 2027, which is in line with private sector forecasts. Revenue amounts to $168.4 billion in 2026-2027, up 5%, while expenditures stand at $171.6 billion, an increase of 3.4%.
— Over the period covered by the financial framework, revenue is expected to grow at an average annual rate of 3.3%, while expenditures will increase by 2.3%, a trend consistent with the gradual return to a balanced budget.
| Message from the Minister | |
| of Finance | 1 |
Annual infrastructure investments have reached historic levels. These substantial investments place added pressure on the financial framework and debt. However, continued significant investments remain necessary to maintain public infrastructure.
— Indeed, 71% of the investments planned under the 2026-2036 Québec Infrastructure Plan will be used to maintain infrastructure.
Despite an uncertain economic environment, the financial framework presented in this report is a testament to the resilience of the Québec economy and the strength of its public finances.
❏ A credible plan to restore fiscal balance
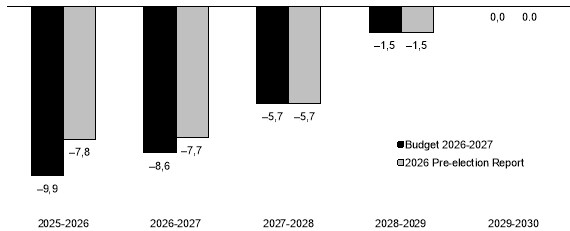
As was the case for 2024-2025, when the deficit within the meaning of the Balanced Budget Act was $2.9 billion lower than the March 2025 forecasts, Québec's budgetary situation improved significantly in 2025-2026. Indeed, the deficit forecast within the meaning of the Balanced Budget Act fell from $13.6 billion in Budget 2025-2026 to $9.9 billion in Budget 2026-2027, and then to $7.8 billion according to the Public Accounts 2025-2026. These favourable results for these two years were achieved, in particular, through the non-utilization of the contingency reserve.
— Among the 2025-2026 results projected or published in Canada, only one province has an accounting deficit as a proportion of its GDP that is lower than Québec's.
For 2026-2027 to 2028-2029, the financial framework also presents improvements in the budgetary situation, which will reduce the forecast deficit by $922 million in 2026-2027, eliminate the $750-million gap to be bridged in 2027-2028 and reduce the gap to be bridged for 2028-2029 by $400 million.
This trend confirms the soundness of our efforts to ensure a gradual return to a balanced budget, after deposits of dedicated revenues in the Generations Fund, which is used solely to repay debt. This means that, upon the return to a balanced budget, which is expected to be achieved in 2029-2030, the government will present an accounting surplus.
Québec has a formal and credible legislative framework to ensure the return to a balanced budget and reduction of the debt. Modernized by our government, the Balanced Budget Act and the Act to reduce the debt and establish the Generations Fund set out the principles that guide the responsible management of public finances.
The government remains committed to consolidating public finances through a plan to restore fiscal balance. The plan presented is credible and is based on specific measures addressing both revenue and expenditures.
— Rating agencies recognized the credibility of the plan to restore fiscal balance and the improvements to the financial framework after the publication of Budget 2026-2027. Adhering to the plan is essential to maintaining Québec's credit rating.
| Pre‑election Report on the State of Québec’s | |
| 2 | Public Finances – August 2026 |
❏ Change in debt
Reducing the debt burden is a core objective of the management of Québec's public finances. It helps preserve the leeway needed to ensure funding for public services and public infrastructure and to address the priorities of Quebecers.
The government forecasts that the net debt will continue its downward trajectory until it reaches the targets set out in the Act to reduce the debt and establish the Generations Fund, namely, 35.5% of GDP in 2032-2033 and 32.5% of GDP in 2037-2038.
— As at March 31, 2026, Québec's net debt represented 38.1% of GDP, a decrease of 4.8 percentage points from the level of 42.9% observed as at March 31, 2019.
— Since 2016-2017, Québec's net debt as a percentage of GDP has fallen by 10.8 percentage points. Only New Brunswick saw a more significant decline.
This reduction in indebtedness was achieved despite the significant economic upheaval of recent years. Québec has demonstrated great resilience in the face of a series of major shocks, including the COVID-19 pandemic, the impact on the global economy of Russia's invasion of Ukraine, the surge in inflation and the rapid rise in interest rates in 2022, as well as the droughts and low runoff experienced in recent years.
More recently, trade tensions with the United States have further increased economic uncertainty. Added to these is a still-unstable geopolitical situation due, in particular, to the war in the Middle East.
Québec nevertheless benefits from a diversified economy, strong public institutions and well-regarded fiscal governance. By relying on responsible and prudent management of public finances, it boasts the necessary means to sustain its prosperity, continue the gradual return to a balanced budget, and meet the aspirations of current and future generations.
Serving Quebecers as Minister of Finance for the past eight years has been an honour and a true privilege. Every era has its challenges. I am particularly proud to note that, despite the significant turbulence we have seen, Québec has narrowed its wealth gap with Ontario and the rest of Canada by 5 percentage points while reducing its debt relative to the economy by 5 percentage points.
Québec's public finances are based on two legislative pillars: the Balanced Budget Act and the Act to reduce the debt and establish the Generations Fund. As the election campaign approaches, these two pillars must guide all parties aspiring to lead Québec.
Sincerely,
Eric Girard
Minister of Finance
Québec, August 2026
| Message from the Minister | |
| of Finance | 3 |
STATEMENT CONCERNING THE RESPONSIBILITY OF THE MINISTÈRE DES FINANCES
The Pre-election Report on the State of Québec's Public Finances - August 2026 was prepared by the Ministère des Finances pursuant to the Act respecting the Ministère des Finances. The financial framework in the report is based on the data published in the Québec Budget Plan - March 2026 and takes into account the most recent financial data available.1
The Ministère des Finances is responsible for the information in the report. As required under the law, the report includes:
— the economic forecasts and assumptions;
— the projected components of the government's financial framework;
— the expenditure forecasts prepared in collaboration with the Secrétariat du Conseil du trésor, broken down by field of State activity;
— the reports required under section 9 of the Balanced Budget Act and section 11 of the Act to reduce the debt and establish the Generations Fund.
The economic forecasts are based on the assumption that trade relations between Canada and the United States will shift toward a new equilibrium, marked by persistent tariff measures, and anticipate the gradual resumption, beginning in summer 2026, of oil flows through the Strait of Hormuz. The economic forecasts for Québec take into account a number of external and internal factors, such as:
— the economic situation of Québec's main trading partners;
— monetary policies and financial markets;
— Québec's domestic demand;
— the labour market.
As for the revenue and expenditure forecasts, they are based on assumptions pertaining to the evolution of the Québec economy that take into account, in particular, the external and internal factors mentioned above, as well as assumptions regarding the change in federal transfers and the cost of the basket of government services.
The economic forecasts as well as revenue and expenditure forecasts include initiatives that are to be implemented by the government.
The financial impacts of the new accounting standard, which replaces the net debt indicator with net financial liabilities and came into force on April 1, 2026, have been included in the forecasts of the Québec government's debt over the budget horizon. As for the financial impacts of the new accounting standard concerning employee future benefits, slated to come into force on April 1, 2029, while analyses have been carried out, certain elements remain to be finalized. Accordingly, no impacts have been incorporated in the government's expenditure and debt forecasts.2
_______________________________________
1 Unless otherwise indicated, this document reflects economic data available as at June 26, 2026. The financial data for 2025-2026 come from the audited public accounts, while those for subsequent years are forecasts based on financial information available as at July 10, 2026.
2 Accounting standards effective on April 1, 2026 or April 1, 2029 are presented in Appendix 5.
| Statement Concerning the Responsibility | |
| of the Ministère des Finances | 5 |
The budgetary balance and debt data are established based on the definitions in the Balanced Budget Act and the Act to reduce the debt and establish the Generations Fund.3
The forecasts presented in this report are underpinned by reasonable, plausible assumptions that reflect best practices, particularly those recommended by international organizations such as the Organisation for Economic Co-operation and Development (OECD).
The pre-election report, provided for in the Act respecting the Ministère des Finances, is in addition to the initiatives taken by the Ministère des Finances to publish transparent, reliable, and timely information, such as the early release of the Public Accounts 2025-20264 in July 2026, thereby creating an environment conducive to decision-making that supports the sustainability of public finances.
Lastly, I wish to acknowledge that this report would not have been possible without the dedication, diligence and superb work of the extended Ministère des Finances team.
Christyne Tremblay
Deputy Minister of Finance
August 2026
_______________________________________
3 A new accounting standard (Section PS 1202 - Financial Statement Presentation) came into force on April 1, 2026. From that date, the concept of net debt is replaced by that of net financial liabilities. This change, which will be presented in the next public accounts, results in a reduction in net debt to GDP of 0.9 percentage points in 2026-2027. However, it does not entail any changes with regard to gross debt or debt representing accumulated deficits.
4 The Public Accounts 2025-2026 are available on Québec.ca at:
https://www.quebec.ca/en/government/public-finances/budget-public-accounts/public-accounts/volumes-public-accounts
| Pre‑election Report on the State of Québec’s | |
| 6 | Public Finances – August 2026 |
ASSURANCE REPORT OF THE AUDITOR GENERAL OF QUÉBEC ON THE 2026 PRE-ELECTION REPORT
To the National Assembly,
I have conducted an assurance review engagement on the plausibility of the assumptions and forecasts presented in the attached pre-election report, prepared by the Minister of Finance. My work involved examining, in all material aspects, the assumptions made and the forecasts related to the financial framework and debt for the following three fiscal years: 2026-2027, 2027-2028 and
2028-2029. The data for the 2025-2026 fiscal year presented in the pre-election report correspond to those in the consolidated financial statements of the Gouvernement du Québec which I audited.
As the forecasts are based on assumptions about future events, the actual results will differ from the information presented in the pre-election report, and the differences could be significant. Thus, I do not express any conclusion as to the likelihood that the forecasts will materialize.
In accordance with the Auditor General Act, I report that I have received all the information and documents requested to arrive at my conclusion.
Conclusion of the Auditor General's review
On the basis of the procedures implemented and the evidence obtained, the assumptions and forecasts related to the financial framework and debt for the 2026-2027, 2027-2028 and 2028-2029 fiscal years are, as of July 10, 2026, plausible in all material respects according to the objective and the criteria established by the Auditor General. It should be noted that there are nonetheless challenges, which are set out in the Auditor General's comments below.
Observations - Presentation of the surplus (deficit) in the financial framework
I draw your attention to the boxed text in section 3.1 of the pre-election report, which notes that the accounting surplus (deficit) presented in the pre-election report's financial framework does not correspond to what will be presented in the government's consolidated financial statements according to applicable public sector accounting standards. It is specified that this difference arises from the fact that in the financial framework, the surplus (deficit) was calculated prior to giving due consideration to the gap to be bridged of $1.85 billion in 2028-2029. As such, the financial framework indicates a deficit of $724 million for 2028-2029, while the government's consolidated financial statements shall mention a surplus of $1.1 billion, and this, if the budgetary balance presents, as anticipated, a deficit of $1.5 billion in 2028-2029.
| Assurance report of the Auditor General | |
| of Québec on the 2026 pre‑election report | 7 |
Auditor General's comments
Without detracting from my conclusion with regard to the plausibility of the forecasts, I would like to make the following comments.
Uncertainty as regards the economic situation
The economic situation remains uncertain due to various issues, among them geopolitical and trade tensions. As a result, projected revenue, despite being based on plausible assumptions, remains subject to fluctuations.
Plausibility of the financial framework
Given the anticipated decrease in the growth of portfolio expenditures, carrying out the plan to restore fiscal balance will notably call for reducing or eliminating the funding of certain activities and programs. There is a risk that these budgetary efforts could, among other things, impact the services provided to the population, especially in 2028-2029. I believe these efforts will represent at least $2 billion in 2027-2028 and $3 billion in 2028-2029. There is also a gap to be bridged of $1.85 billion in 2028-2029 which may need to be addressed through additional measures, unless the gap is eradicated with additional revenue or the contingency reserve is not used. The elements, which nonetheless allow to conclude that the portfolio expenditure forecasts are plausible, are laid out in our report entitled The Auditor General of Québec's detailed analysis of the Pre-Election report 2026, which will be available on the Auditor General's website.
Reports from the Ministère on the application of the Balanced Budget Act and the Act to reduce the debt and establish the Generations Fund
I do not put forth any conclusion with regard to the last two years of the financial framework presented in the pre-election report. I do, however, want to point out the major challenges associated with the budgetary efforts required in 2029-2030 and 2030-2031 to achieve the objectives of the Balanced Budget Act, particularly in light of their cumulative effect and the need to ensure their long-term viability. Furthermore, the debt reduction trajectory as a percentage of GDP until 2037-2038 requires achieving and maintaining a balanced budget in addition to reducing the amounts earmarked for capital investments, all while the condition of Québec infrastructure is deteriorating and several projects are planned.
The Auditor General of Québec's detailed analysis of the Pre-Election report
In addition to this assurance report, I prepared a report entitled The Auditor General of Québec's detailed analysis of the 2026 Pre-Election report, in which I explain my work and the grounds on which I based my conclusion. It also includes additional information necessary to allow pre-election report users to fully assess the assumptions and forecasts associated with the financial framework and debt. This analysis will be available on the Auditor General's website.
This analysis also contains various comments on the presentation of information in the pre-election report, as well as the objective and criteria used to assess the presentation of the information in question. I notably comment on the presentation of the surplus (deficit) in the financial framework referred to in the Observations - Presentation of the surplus (deficit) section in the financial framework above.
| Pre‑election Report on the State of Québec’s | |
| 8 | Public Finances – August 2026 |
Responsibility of the Ministère des Finances
Under the Act respecting the Ministère des Finances, the Minister must prepare and publish, prior to the general election that follows the expiry of a Legislature, a pre-election report on the state of Québec's public finances. This responsibility includes making assumptions and forecasts that are deemed plausible.
Responsibility of the Auditor General
My responsibility is to review the plausibility of the assumptions and forecasts presented in the pre-election report, as of July 10, 2026, based on the procedures I have implemented and the evidence I have obtained with regard to the objective and criteria I have deemed suitable. This objective and these criteria are provided below. I must also indicate whether I received all the information and documents requested. I conducted the engagement in accordance with the Canadian Standards on Assurance Engagements 3001, Direct Engagements. This standard requires that I plan and carry out the engagement so as to obtain assurance that is meaningful in light of the circumstances.
| Objective | Assessment criteria |
| Determine whether the assumptions and forecasts used to develop the financial framework and debt presented in the pre-election report are plausible. |
— The forecasts are based on comprehensive, coherent, realistic and objective assumptions. — The assumptions and forecasts take into account the most recent financial information and the latest government orientations and decisions. — The forecasts are established in accordance with Canadian accounting standards for the public sector. |
Because of the review engagement's purpose, which focuses on forecasts, the nature of the procedures implemented is different than what is done during audit engagements, and the level of assurance obtained is thus lower.
The procedures implemented rely on my professional judgement. These include, to the extent deemed appropriate, an analysis of the budget process, requests for information, cross-referencing of documents or reconciliation with supporting documents, analytical procedures, assessment of the estimation methods used and the Ministère des Finance's economic forecasting models, review of sensitivity calculations and analyses. Finally, the consultation of public finance specialists and economists, including econometric analysts, form an integral part of the procedures.
| Assurance report of the Auditor General | |
| of Québec on the 2026 pre‑election report | 9 |
The Auditor General's independence and quality management
I have complied with the relevant ethical requirements and code of ethics applicable to the practice of public accounting and related to assurance engagements, published by various professional accounting bodies and which are based on the fundamental principles of integrity, objectivity, professional competence and due care, confidentiality and professional behaviour.
The Auditor General applies the Canadian Standard on Quality Management 1, Quality Management for Firms that Perform Audits and Reviews of Financial Statements, or Other Assurance or Related Services Engagements. This standard requires that the Auditor General introduce and maintain a quality management system that includes policies and procedures on compliance with ethical requirements, professional standards and applicable legal and regulatory requirements.
The Auditor General of Québec
Christine Roy, FCPA Auditor
Québec, August 10, 2026
| Pre‑election Report on the State of Québec’s | |
| 10 | Public Finances – August 2026 |
PRE-ELECTION REPORT ON THE STATE OF QUÉBEC'S
PUBLIC FINANCES
11
| Pre‑election Report on the State of Québec’s | |
| 12 | Public Finances – August 2026 |
HIGHLIGHTS
Québec's economic and financial situation is based on a balanced baseline scenario that takes into account, among other things, recent developments in the economic situation of Québec's main trading partners, monetary policies, financial markets and oil prices.
❏ Québec's economy
In its baseline economic scenario, the Ministère des Finances assumes that trade relations between Canada and the United States will evolve toward a new equilibrium, marked by persistent tariff measures. The pre-election report is based on the premise that the tariffs are expected to remain in place for the long term. However, the initial shock caused by the introduction of the tariffs will gradually fade. Furthermore, progress in the Canada-United States-Mexico Agreement (CUSMA) negotiations is expected to help reduce the uncertainty that has shaken consumer and business confidence. This trend will allow for a return to more sustained economic growth starting in 2027.
— The baseline scenario also assumes a gradual normalization, beginning in summer 2026, of oil flows through the Strait of Hormuz, a vital waterway through which approximately 20% of the world's crude oil passes.
Following a 1.7% increase in 2024, Québec's economic growth slowed in 2025 to 0.6%. Despite this moderation, a closer look at the statistics paints a more positive picture. In particular, domestic demand remained strong in 2025 and grew by 1.9%, contributing 2.0 percentage points to economic growth.
Real GDP will continue to grow despite the risks inherent to the forecast scenario. In particular, uncertainty surrounding the trade dispute with the United States will remain high. The geopolitical situation also remains tense, particularly in the Middle East. In addition, growth will be limited by the demographic outlook.
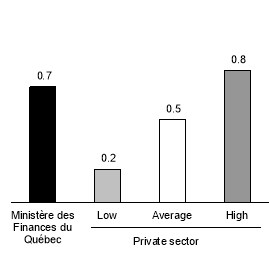
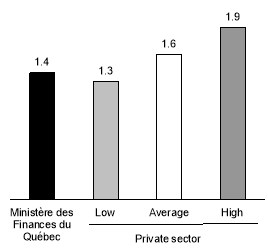
— The Ministère des Finances forecasts an increase in economic activity of 0.7% in 2026 and 1.4% in 2027. This is in line with average private sector forecasts (+0.5% in 2026 and +1.6% in 2027).5
— From 2028 to 2030, average annual increase is expected to stand at 1.4%.
In this uncertain environment, the Ministère des Finances is presenting two alternative economic forecast scenarios in the 2026 pre-election report to estimate the impact of a recession or stronger-than-forecast economic growth on the financial framework and on the Québec government's debt.
_______________________________________
5 Based on the Ministère des Finances survey as at June 18, 2026, which includes the forecasts of 10 private sector institutions.
| Highlights | 13 |
❏ Québec's financial situation
The financial framework presented takes into account risks related to the economic situation.
It includes predictable funding for the government's missions and the financial impact of government decisions made since the release of Budget 2026-2027, particularly the initiatives announced to help cope with the rising cost of living.
The financial framework of the Pre-election Report on the State of Québec's Public Finances - August 2026 remains in compliance with the Balanced Budget Act, as the projected deficits are lower than or equal to those in the plan to restore fiscal balance tabled as part of Budget 2025-2026, and provides for increasing deposits in the Generations Fund over the forecast horizon.
— Efforts to return to a balanced budget are continuing in order to preserve the long-term sustainability of public finances.
Furthermore, greater-than-expected revenue since the release of Budget 2026-2027 has made it possible to present results that are more favourable than anticipated in March 2026. The government remains committed to consolidating public finances.
— The accounting deficit stands at $5.5 billion in 2025-2026, or 0.9% of GDP.
— This represents an improvement of $2.2 billion since the publication of Budget 2026-2027.
— In 2026-2027, the forecast accounting deficit is $5.2 billion (0.8% of GDP), an improvement of $1.1 billion compared to that forecast in Budget 2026-2027.
— This forecast includes a contingency reserve of $2.0 billion.
Starting in 2027-2028, the balances within the meaning of the Balanced Budget Act forecast in Budget 2026-2027 remain unchanged, but include the elimination of the $750-million gap to be bridged in 2027-2028 and a $400-million reduction in the gap to be bridged for 2028-2029.
The financial framework still includes gaps to be bridged of $1.9 billion in 2028-2029 and $2.0 billion in 2029-2030, which will need to be eliminated in order to achieve a balanced budget after deposits of dedicated revenues in the Generations Fund.
— Furthermore, a return to more favourable economic conditions, for example, if the United States were to remove tariffs on imports as part of CUSMA renewal negotiations, would further stimulate economic activity and allow the gaps to be fully bridged.6
Since the government's available levers for eliminating the gaps have not been determined, the government has chosen, starting with Budget 2025-2026, to report an accounting surplus (deficit) before the gap to be bridged.
To ensure the comparability of budget documents, this presentation of the balance has been retained in the financial framework of the Pre-election Report on the State of Québec's Public Finances - August 2026.
However, in accordance with the presentation requirements of the public sector accounting standards applied in preparing the public accounts, an illustration of the accounting balance, as it will be presented in the financial statements, is available in Section 3.1.
_______________________________________
6 The effects of such a scenario are presented in Section 7.
Given the uncertain economic environment, the government is maintaining an $8.0-billion contingency reserve over the period covered by the financial framework, including $2.0 billion
in 2026-2027. This reserve could be used, in particular, to cover unforeseen expenditures or mitigate the effects of more-moderate-than-expected economic growth.
— The $2.0 billion contingency reserve that was provided for 2025-2026 was not used, as was also the case in 2024-2025.
❏ The Québec government's debt
The Act to reduce the debt and establish the Generations Fund stipulates that, for fiscal years 2032-2033 and 2037-2038, the net debt presented in the government's financial statements may not exceed 38.0% and 35.0% of GDP, respectively. These ratios correspond to the maximum limit of the respective targets of 35.5% and 32.5% of GDP, as reviewed by the government in the March 2025 budget speech.
The net debt burden stood at 38.1% of GDP as at March 31, 2026. It is projected to decline to 36.0% of GDP as at March 31, 2031.
A gradual reduction of the debt burden will make it possible to ensure the long-term financing of the government's main missions as well as a prosperous tomorrow for future generations.
| Highlights | 15 |
❏ Québec's economic outlook
TABLE 1
| Québec's economic outlook (annual average, percentage change, unless otherwise indicated) |
|||||||||||||||||||||
| 2024 | 2025 | 2026 | 2027 | 2028 | 2029 | 2030 | |||||||||||||||
| Output | |||||||||||||||||||||
| Real GDP | 1.7 | 0.6 | 0.7 | 1.4 | 1.5 | 1.5 | 1.4 | ||||||||||||||
| Nominal GDP | 5.9 | 4.7 | 3.4 | 3.4 | 3.4 | 3.4 | 3.3 | ||||||||||||||
| Nominal GDP (billions of dollars) | 616.8 | 646.0 | 668.1 | 690.7 | 714.4 | 738.6 | 763.3 | ||||||||||||||
| Components of GDP (in real terms) | |||||||||||||||||||||
| Final domestic demand | 3.1 | 1.9 | 0.5 | 1.0 | 1.0 | 1.0 | 1.1 | ||||||||||||||
| - Household consumption | 2.5 | 1.8 | 1.1 | 1.6 | 1.6 | 1.5 | 1.4 | ||||||||||||||
| - Government spending and investment | 2.5 | 2.2 | 0.1 | 0.3 | 0.5 | 0.5 | 0.9 | ||||||||||||||
| - Residential investment | 5.9 | 6.6 | −1.9 | −1.7 | −3.1 | −2.8 | −1.9 | ||||||||||||||
| - Non-residential business investment | 5.5 | −0.8 | 0.2 | 1.7 | 2.5 | 2.3 | 2.3 | ||||||||||||||
| Exports | 0.5 | −1.2 | −0.4 | 1.9 | 2.0 | 2.0 | 1.9 | ||||||||||||||
| Imports | 1.8 | 1.5 | −0.5 | 1.4 | 1.4 | 1.2 | 1.2 | ||||||||||||||
| Labour market | |||||||||||||||||||||
| Population (thousands) | 8 995 | 9 058 | 9 025 | 9 005 | 8 992 | 8 987 | 8 994 | ||||||||||||||
| Population aged 15 and over - Labour Force Survey (thousands) | 7 435 | 7 579 | 7 584 | 7 579 | 7 583 | 7 594 | 7 617 | ||||||||||||||
| Jobs (thousands) | 4 566 | 4 645 | 4 629 | 4 652 | 4 667 | 4 682 | 4 697 | ||||||||||||||
| Job creation (thousands) | 43.2 | 78.8 | −15.4 | 22.6 | 15.1 | 15.3 | 14.7 | ||||||||||||||
| Unemployment rate (per cent) | 5.3 | 5.6 | 5.6 | 4.9 | 4.3 | 4.1 | 4.1 | ||||||||||||||
| Other economic indicators (in nominal terms) | |||||||||||||||||||||
| Household consumption | 5.1 | 4.6 | 4.3 | 3.7 | 3.4 | 3.3 | 3.2 | ||||||||||||||
| - Excluding food expenditures and shelter | 4.1 | 3.0 | 3.5 | 3.4 | 3.1 | 3.1 | 3.0 | ||||||||||||||
| Housing starts (thousands of units) | 48.7 | 59.9 | 57.0 | 49.5 | 41.5 | 36.9 | 33.9 | ||||||||||||||
| Residential investment | 9.4 | 13.1 | 3.1 | 0.7 | −0.6 | −0.5 | 0.4 | ||||||||||||||
| Non-residential business investment | 9.2 | 3.1 | 2.7 | 4.7 | 5.1 | 4.5 | 4.5 | ||||||||||||||
| Wages and salaries | 6.0 | 4.5 | 3.3 | 3.5 | 3.3 | 3.1 | 3.1 | ||||||||||||||
| Household income | 7.1 | 4.3 | 3.6 | 3.5 | 3.3 | 3.2 | 3.3 | ||||||||||||||
| Net operating surplus of corporations | 3.1 | 3.5 | 4.8 | 1.1 | 3.3 | 3.6 | 3.7 | ||||||||||||||
| Consumer price index | 2.3 | 2.4 | 3.0 | 2.1 | 2.0 | 2.0 | 2.0 | ||||||||||||||
| - Excluding food and energy | 2.7 | 2.7 | 2.4 | 2.1 | 2.0 | 1.9 | 1.9 | ||||||||||||||
| GDP per capita (in dollars) | 68 565 | 71 317 | 74 027 | 76 706 | 79 449 | 82 187 | 84 861 | ||||||||||||||
| Per capita disposable income (in dollars) | 38 426 | 39 604 | 41 393 | 42 961 | 44 445 | 45 893 | 47 369 | ||||||||||||||
Sources: Institut de la statistique du Québec, Statistics Canada, Canada Mortgage and Housing Corporation and Ministère des Finances du Québec.
❏ Financial framework
TABLE 2
| Financial framework from 2025-2026 to 2030-2031 (millions of dollars, unless otherwise indicated) |
|||||||
| 2025- 2026 |
2026- 2027 |
2027- 2028 |
2028- 2029 |
2029- 2030 |
2030- 2031 |
AAGR(1) | |
| Revenue | |||||||
| Personal income tax | 48 969 | 50 942 | 52 841 | 54 861 | 56 867 | 59 006 | |
| Contributions for health services | 9 304 | 9 538 | 9 876 | 10 327 | 10 628 | 10 962 | |
| Corporate taxes | 14 599 | 14 698 | 15 252 | 15 240 | 15 835 | 16 875 | |
| School property tax | 1 243 | 1 301 | 1 367 | 1 426 | 1 479 | 1 531 | |
| Consumption taxes | 29 639 | 30 682 | 31 632 | 32 416 | 33 206 | 34 035 | |
| Duties, permits and royalties | 6 708 | 6 484 | 6 928 | 7 278 | 7 586 | 7 823 | |
| Miscellaneous revenue | 14 922 | 15 790 | 16 110 | 16 744 | 17 385 | 17 988 | |
| Government enterprises | 5 241 | 5 908 | 6 208 | 6 909 | 6 653 | 7 035 | |
| Own-source revenue | 130 625 | 135 343 | 140 214 | 145 201 | 149 639 | 155 255 | |
| % change | 4.0 | 3.6 | 3.6 | 3.6 | 3.1 | 3.8 | 3.5 |
| Federal transfers | 29 803 | 33 046 | 34 011 | 33 643 | 32 802 | 33 757 | |
| % change | −2.3 | 10.9 | 2.9 | −1.1 | −2.5 | 2.9 | 2.5 |
| Total revenue | 160 428 | 168 389 | 174 225 | 178 844 | 182 441 | 189 012 | |
| % change | 2.8 | 5.0 | 3.5 | 2.7 | 2.0 | 3.6 | 3.3 |
| Expenditure | |||||||
| Portfolio expenditures | −155 782 | −161 081 | −165 049 | −166 666 | −168 291 | −173 584 | |
| % change(2) | 3.0 | 3.4 | 2.5 | 1.0 | 1.0 | 3.1 | 2.2 |
| Debt service | −10 148 | −10 516 | −10 870 | −11 402 | −11 860 | −12 749 | |
| % change | 1.8 | 3.6 | 3.4 | 4.9 | 4.0 | 7.5 | 4.7 |
| Total expenditure | −165 930 | −171 597 | −175 919 | −178 068 | −180 151 | −186 333 | |
| % change | 2.9 | 3.4 | 2.5 | 1.2 | 1.2 | 3.4 | 2.3 |
| Contingency reserve | - | −2 000 | −1 500 | −1 500 | −1 500 | −1 500 | |
| ACCOUNTING SURPLUS (DEFICIT) - BEFORE GAP TO BE BRIDGED(3) | −5 502 | −5 208 | −3 194 | −724 | 790 | 1 179 | |
| % of GDP | 0.9 | 0.8 | 0.5 | 0.1 | 0.1 | 0.2 | |
| Gap to be bridged | - | - | - | 1 850 | 2 000 | 2 000 | |
| Deposits of dedicated revenues in the Generations Fund | −2 289 | −2 482 | −2 501 | −2 626 | −2 790 | −2 929 | |
| BUDGETARY BALANCE | −7 791 | −7 690 | −5 695 | −1 500 | - | 250 | |
| % of GDP | 1.2 | 1.2 | 0.8 | 0.2 | - | - | |
Note: Totals may not add due to rounding.
(1) Average annual growth rate, corresponding to the geometric mean over five years, from 2026-2027 to 2030-2031.
(2) Growth in 2028-2029 and 2029-2030 is affected by the impact of the stabilization of investments for infrastructure belonging to third parties and initiatives stemming from the expenditure review. Excluding these elements, growth would be 2.2% and 2.0%, respectively.
(3) The accounting surplus (deficit) before the gap to be bridged corresponds to the accounting surplus (deficit) presented in the budget documents. In accordance with the presentation requirements of the public sector accounting standards applied in preparing the public accounts, an illustration of the accounting surplus (deficit) once the gaps have been bridged is provided in Section 3.1. For example, in 2028-2029, once the gap has been bridged, the accounting surplus will amount to $1 126 million.
| Highlights | 17 |
1. ECONOMIC AND FINANCIAL FORECASTS
1.1 Changes in Québec's situation
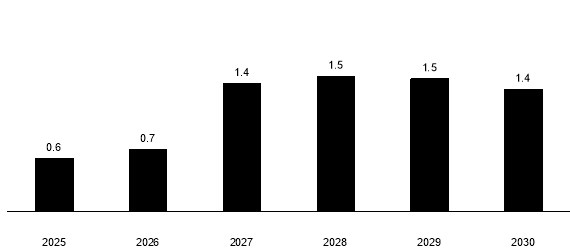
Following a 1.7% increase in 2024, Québec's economic growth slowed in 2025 to 0.6%.
— Despite this moderation, a closer look at the statistics paints a more positive picture. In particular, domestic demand remained strong in 2025 and grew by 1.9%, contributing 2.0 percentage points to economic growth. This change was driven in particular by strong household consumption expenditure (+1.8%) and residential investment (+6.6%).
— In Canada, following a 2.0% increase in 2024, real GDP grew by 1.9% in 2025. This increase is stronger than that observed in Québec in 2025 (+0.6%).
— The shock linked to the trade dispute with the United States has had a greater impact on Québec than on Canada, due to the concentration of tariffs in sectors where Québec is particularly active, including aluminum and lumber.
Economic activity will continue to grow despite the risks inherent to the forecast scenario. In particular, uncertainty surrounding the trade dispute with the United States will remain high. In addition, the geopolitical situation will remain tense, particularly in the Middle East. Moreover, growth will be limited by the demographic outlook.
— Real GDP increases of 0.7% in 2026 and 1.4% in 2027 are expected.
— From 2028 to 2030, average annual increase is expected to stand at 1.4%.
| CHART 1 Economic growth in Québec |
| (real GDP, percentage change) |
 |
| Sources: Institut de la statistique du Québec, Statistics Canada and Ministère des Finances du Québec. |
❏ Determinants of Québec's economic growth
The increase in real GDP is based on the following elements:
— the demographic weight of the main labour pool, which represents individuals aged 15 to 64 compared to the total population;
— improvement in the employment rate, that is, the total number of people employed relative to people aged 15 to 64;
— productivity growth, that is, the change in output per job.
Québec has an aging population. This phenomenon is due, in particular, to the post-war baby boom, the rising life expectancy and the decline in births. In addition, the population will decline from 2026 to 2029, due to federal and provincial immigration policies, among other things. In this context, the effects of an aging population will become more pronounced.
— Accordingly, the demographic weight of the main labour pool-which has been declining since the mid-2000s-will continue to decrease in the coming years.
An increase in labour market participation is essential to support real GDP growth over the long term. However, a significant gain in the employment rate has already been seen in recent years, and the labour market is close to full employment. Further increases are still possible in this area, but they will be more limited.
Against the backdrop of an aging population and a tight labour market, immigration and productivity gains offer the greatest potential for improvement to support Québec's economic growth in the coming years.
TABLE 3
| Contribution of economic growth factors in Québec (average annual percentage change and contribution in percentage points) |
||||||||||
| 2010 to 2019 |
2020 | 2021 | 2022 | 2023 | 2024 | 2025 | 2026 | 2027 | 2028 to 2030 |
|
| Growth factors (contribution) | ||||||||||
| Demographic weight of 15- to 64-year-olds(1) | −0.7 | −0.7 | −0.8 | −0.6 | −0.2 | 0.0 | −0.5 | −0.8 | −0.7 | −0.5 |
| Employment rate(2) | 1.0 | −5.0 | 4.8 | 2.5 | 1.4 | −1.0 | 1.5 | 0.9 | 1.4 | 0.9 |
| Productivity(3) | 0.8 | 0.2 | 2.9 | 1.4 | −2.2 | 0.7 | −1.1 | 1.1 | 0.9 | 1.1 |
| STANDARD OF LIVING(4) | 1.1 | −5.5 | 7.0 | 3.3 | −1.0 | −0.3 | −0.1 | 1.1 | 1.6 | 1.5 |
| Real GDP | 1.9 | −4.7 | 7.3 | 4.5 | 0.7 | 1.7 | 0.6 | 0.7 | 1.4 | 1.4 |
| Population | 0.8 | 0.8 | 0.2 | 1.1 | 1.8 | 2.0 | 0.7 | −0.4 | −0.2 | 0.0 |
Note: Totals may not add due to rounding.
(1) The demographic weight of 15- to 64-year-olds represents the share of the population aged 15 to 64 as a percentage of the total population.
(2) The employment rate corresponds to the total number of workers in proportion to the population aged 15 to 64.
(3) Productivity as measured by real GDP per job.
(4) Standard of living as measured by real GDP per capita.
Sources: Institut de la statistique du Québec, Statistics Canada and Ministère des Finances du Québec.
■ Despite demographic challenges, growth in living standards has continued to rise
The demographic challenges that Québec has been facing for the past several years represent a challenge for the economy, particularly due to their impacts on the main labour pool.
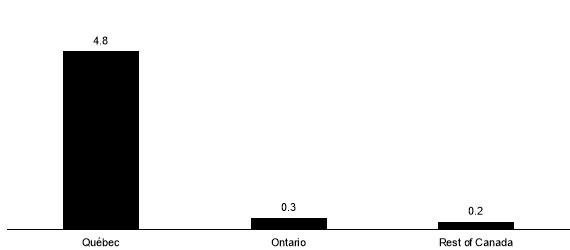
Nevertheless, Québec has stood out by posting steady growth in real GDP per capita (+4.8% between 2018 and 2025).
— This performance exceeded that of Ontario (+0.3%) and the rest of Canada (+0.2%) for the same period.
| CHART 2 Real GDP per capita between 2018 and 2025 |
| (percentage change over the entire period) |
 |
| Sources: Institut de la statistique du Québec, Statistics Canada and Ministère des Finances du Québec. |
■ Recent demographic changes
■ A declining population
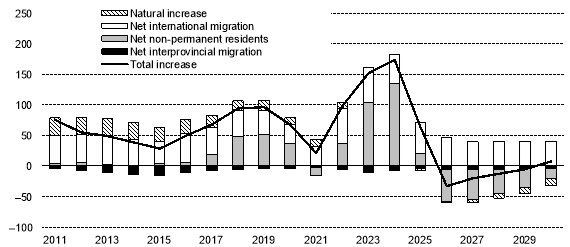
Québec registered record population growth in 2023 (+1.8%) and 2024 (+2.0%), fuelled by immigration policies. A similar trend was observed across Canada, where the population also grew significantly in 2023 (+2.8%) and 2024 (+3.0%).
— For these two years, the net increase in the number of non-permanent residents in Québec (+238 775 people from 2023 to 2024) and international immigrants (+104 364 people) fully accounts for the population increase (+325 511 people).
— In contrast, natural increase-the difference between births and deaths-became negative starting in 2024. Furthermore, interprovincial migration has been showing a negative outflow since statistics began to be compiled.
Although the population continued to grow in 2025 (+0.7%), population growth slowed compared to the strong increases of 2023 (+1.8%) and 2024 (+2.0%). This change can be attributed in particular to policies aimed at reducing the number of non-permanent residents that were implemented by the federal government and the Québec government.
— After reaching a peak of 134 400 in 2024, net non-permanent resident intake in Québec declined to approximately 21 000 in 2025.
This downward trend will continue, and Québec is expected to see population decreases until 2029, including declines of 0.4% in 2026 and 0.2% in 2027.
| CHART 3 Components of population growth in Québec |
| (annual change in population and its components, in thousands of people) |
 |
| Sources: Institut de la statistique du Québec, Statistics Canada and Ministère des Finances du Québec. |
■ The proportion of individuals aged 65 and over in the population has reached a record high
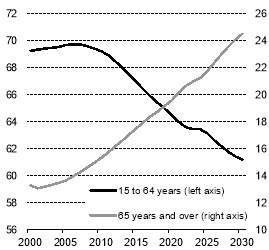
Against this backdrop of population decline, the effects of an aging population will be more pronounced. Consequently, the proportion of individuals aged 15 to 64-defined as the potential labour pool within Québec's total population-has been declining since the mid-2000s and will continue to drop in the coming years.
— It fell from a high of 69.7% in 2007 to 63.1% in 2025, and is expected to reach a low of 61.1%
in 2030.
At the same time, the demographic weight of the population aged 65 and over is increasing steadily. It rose from 14.2% in 2007 to 21.7% in 2025, and is expected to reach a record 24.5% in 2030.
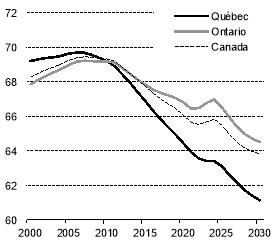
While population aging is a widespread phenomenon among its main economic partners, this trend is more pronounced in Québec.
— By way of comparison, in 2025, the demographic weight of the population aged 15 to 64 within the total population stood at 66.5% in Ontario and 65.5% in Canada (63.1% in Québec).
| CHART 4 Demographic weight of certain age groups in Québec |
CHART 5 Demographic weight of the population aged 15 to 64 |
|
| (proportion of certain age groups in the total population, in per cent) | (proportion in the total population, in per cent) | |
 |
 |
|
|
Sources: Institut de la statistique du Québec, Statistics Canada and Ministère des Finances du Québec. |
Sources: Institut de la statistique du Québec, Statistics Canada and Ministère des Finances du Québec. |
■ State of the labour market
In an uncertain economic climate marked by trade tensions and the demographic slowdown, the labour market remained resilient in 2025.
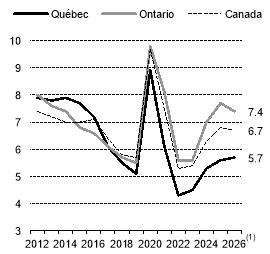
— For the year as a whole, 78 800 jobs were created (+1.7%). Meanwhile, the unemployment rate increased slightly from 5.3% in 2024 to 5.6% in 2025 in Québec. Despite this increase, it remained at a historically low level and was one of the lowest in the country in 2025 (6.8% in Canada).
— In addition, the employment rate for people aged 15 to 64 stood at 77.4% in 2025 in Québec, the highest rate among the provinces (74.2% in Canada).
Despite this strong performance in 2025, the Québec labour market has been showing signs of slowing down since the beginning of 2026.
— In the first five months of 2026, compared with the same period in 2025, there were 19 600 jobs lost (−0.4%).
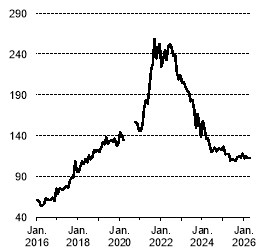
— In addition, after peaking in September 2021 (258 520 positions), the number of job vacancies declined to 112 400 in April 2026. Meanwhile, the unemployment rate averages 5.7% for the months available in 2026 (5.6% in 2025).
— This change resulted in a slowdown in the annual growth rate of employees' weekly earnings, which fell from 5.2% in April 2025 to 3.4% in April 2026.
Over the coming months, job creation is expected to resume, but at a modest pace. A less favourable economic environment, combined with the decline in the labour force, will lead to slower job creation.
| CHART 6 Change in the unemployment rate |
CHART 7 Change in job vacancies in Québec |
|
| (average annual data in per cent) | (in thousands of jobs) | |
 |
 |
|
| (1) Average for the months available in 2026. Source: Statistics Canada. |
Notes: Data on job vacancies begin in April 2015. Data for the second and third quarters of 2020 are unavailable, as some of Statistics Canada's activities were temporarily suspended during the COVID-19 pandemic. Source: Statistics Canada. |
❏ Change in nominal GDP
After posting strong increases since 2021, including a 4.7% gain in 2025, nominal GDP is expected to show more moderate growth, rising by 3.4% on average annually from 2026 to 2030.
This nominal GDP growth will stem from the combined impact of the increase in real economic activity and the GDP deflator, which measures price changes in the overall economy.
— Real GDP growth is expected to stand at 0.7% in 2026, then 1.4% in 2027, before rising slightly to an annual average of 1.4% from 2028 to 2030-a rate of growth closer to its potential.
— Meanwhile, the GDP deflator is expected to slow, falling from 4.1% in 2025 to 2.7% in 2026, then to 2.0% in 2027 and 1.9% on average from 2028 to 2030.
— In general, over the next five years, the increase in the prices of Québec's exports will be slightly lower than the growth in import prices, due, in particular, to changes in energy prices. In fact, since Québec imports a significant portion of its energy products, high oil prices will further drive up the cost of imports. As a result, the terms of trade will not contribute to an increase in the GDP deflator.
— Moreover, the increase in the consumer price index (CPI) is expected to gradually slow, falling from 3.0% in 2026 to 2.1% in 2027, before returning to the 2.0% target from 2028 to 2030.
TABLE 4
Nominal GDP in Québec
| (percentage change) | ||||||||||||||||||
| 2025 | 2026 | 2027 | 2028 | 2029 | 2030 | |||||||||||||
| Real GDP | 0.6 | 0.7 | 1.4 | 1.5 | 1.5 | 1.4 | ||||||||||||
| Prices - GDP deflator | 4.1 | 2.7 | 2.0 | 1.9 | 1.9 | 1.9 | ||||||||||||
| - Consumer price index | 2.4 | 3.0 | 2.1 | 2.0 | 2.0 | 2.0 | ||||||||||||
| - Terms of trade | 0.8 | −0.8 | −0.2 | 0.2 | 0.0 | −0.1 | ||||||||||||
| NOMINAL GDP | 4.7 | 3.4 | 3.4 | 3.4 | 3.4 | 3.3 | ||||||||||||
Note: Totals may not add due to rounding.
Sources: Institut de la statistique du Québec, Statistics Canada and Ministère des Finances du Québec.
❏ Forecasts comparable to those of the private sector
The economic and financial forecasts incorporate the uncertainties and risks inherent in the particular context in which Québec is evolving. They are balanced, meaning that they incorporate both upward and downward risks.
— In 2026, the Ministère des Finances forecasts an increase in economic activity (+0.7%) that is slightly higher than that anticipated on average by private sector forecasters (+0.5%).
— In 2027, the Ministère des Finances estimates that the increase in economic activity (+1.4%) will be slightly lower than that expected on average by private sector forecasters (+1.6%).
The variation among private sector forecasts reflects the uncertainty arising from the current economic situation, with estimates ranging from 0.2% (the lowest forecast) to 0.8% (most optimistic forecast) for 2026.
| CHART 8 Economic growth in Québec in 2026 |
CHART 9 Economic growth in Québec in 2027 |
|
| (real GDP, percentage change) | (real GDP, percentage change) | |
 |
 |
|
|
Source: Ministère des Finances du Québec survey as at June 18, 2026, which includes the forecasts of 10 private sector institutions. |
Source: Ministère des Finances du Québec survey as at June 18, 2026, which includes the forecasts of 10 private sector institutions. |
❏ Private sector five-year economic outlook
Over a five-year horizon, that is, from 2026 to 2030:
— the expected average growth is 1.3% for real GDP, equivalent to that expected by the private sector (+1.3%);
— the average annual increase expected is 3.4% for nominal GDP, which is slightly lower than that expected by the private sector (+3.5%).
TABLE 5
| Economic outlook for Québec - Comparison with the private sector (percentage change) |
|||||||||||||||||||||
| 2025 | 2026 | 2027 | 2028 | 2029 | 2030 | Average 2026-2030 |
|||||||||||||||
| Real GDP | |||||||||||||||||||||
| - Ministère des Finances du Québec | 0.6 | 0.7 | 1.4 | 1.5 | 1.5 | 1.4 | 1.3 | ||||||||||||||
| - Private sector average | - | 0.5 | 1.6 | 1.6 | 1.5 | 1.5 | 1.3 | ||||||||||||||
| Prices - GDP deflator | |||||||||||||||||||||
| - Ministère des Finances du Québec | 4.1 | 2.7 | 2.0 | 1.9 | 1.9 | 1.9 | 2.1 | ||||||||||||||
| - Private sector average | - | 2.8 | 2.2 | 1.8 | 1.9 | 1.9 | 2.1 | ||||||||||||||
| Nominal GDP | |||||||||||||||||||||
| - Ministère des Finances du Québec | 4.7 | 3.4 | 3.4 | 3.4 | 3.4 | 3.3 | 3.4 | ||||||||||||||
| - Private sector average | - | 3.3 | 3.8 | 3.4 | 3.4 | 3.4 | 3.5 | ||||||||||||||
Sources: Ministère des Finances du Québec and Ministère des Finances du Québec survey as at June 18, 2026, which includes the forecasts of 10 private sector institutions.
1.2 Assumptions, risks and sensitivity analysis
❏ Assumptions
The forecast scenario assumptions are based on various external factors, including changes in the economic situation of Québec's main trading partners, monetary policies, financial markets and oil prices, as well as internal factors.
The baseline economic scenario is based on the premise that the average effective tariff rate will remain relatively stable over the next few years. Note that, due to the protections provided under CUSMA, the average effective tariff rate stood at 3.6% in Canada in April 2026. In Québec, it stood at 7.7%, reflecting, in particular, the greater weight of the manufacturing sector in the Québec economy. Furthermore, progress in the CUSMA negotiations will reduce the uncertainty that has shaken consumer and business confidence. This trend will allow for a return to more sustained economic growth starting in 2027.
The baseline scenario also factors in the gradual resumption, beginning in summer 2026, of oil flows through the Strait of Hormuz, a vital waterway through which approximately 20% of the world's crude oil passes. However, the full normalization of shipments and production in the region will happen gradually over the coming quarters, due to the time required to restore production capacity at certain energy infrastructure facilities and to resolve maritime shipping bottlenecks.
■ External factors
■ The economic situation of Québec's main trading partners
Québec is an economy open to the world. In 2025, total exports accounted for 44% of Québec's nominal GDP. Consequently, growth trends in Québec, particularly in exports, are largely influenced by the economic position of its main trading partners.
In Canada, real GDP growth is expected to reach 0.8% in 2026, 1.7% in 2027 and 1.8% per year on average from 2028 to 2030.
— In particular, in 2026, the sharp rise in oil prices in the first half of the year will boost the terms of trade and business profits, as Canada is a net exporter. However, the positive repercussions on the real economy are expected to be limited. Furthermore, economic growth will be limited by population decline.
TABLE 6
| Economic growth (real GDP, percentage change) |
||||||||||||||||||
| 2025 | 2026 | 2027 | 2028 | 2029 | 2030 | |||||||||||||
| Québec | 0.6 | 0.7 | 1.4 | 1.5 | 1.5 | 1.4 | ||||||||||||
| Ontario(1) | 1.3 | 0.6 | 1.8 | - | - | - | ||||||||||||
| Canada | 1.9 | 0.8 | 1.7 | 1.7 | 1.8 | 1.8 | ||||||||||||
| United States | 2.1 | 2.2 | 1.9 | 1.9 | 1.9 | 1.8 | ||||||||||||
| World | 3.5 | 3.0 | 3.2 | 3.2 | 3.2 | 3.1 | ||||||||||||
(1) Ontario's real GDP growth in 2026 and 2027 corresponds to the average forecast of eight private sector institutions as at June 18, 2026.
Sources: Institut de la statistique du Québec, Ontario Ministry of Finance, Statistics Canada, International Monetary Fund, S&P Global, LSEG Datastream, Bloomberg, Eurostat and Ministère des Finances du Québec.
In the United States, real GDP growth is expected to go from 2.1% in 2025 to 2.2% in 2026 and 1.9% in 2027. It is expected to stabilize at 1.9%, on average, from 2028 to 2030.
In 2026, economic activity will be slowed by trade tensions and the conflict in the Middle East. These developments, which have exacerbated inflationary pressures and weighed on consumer and business confidence, are expected to weaken household purchasing power and dampen consumption.
— In fact, the energy shock led, in particular, to an increase of approximately 30% in gasoline prices between the start of the war in late February and late June.
Furthermore, the demographic slowdown, driven by an aging population and the effects of which are exacerbated by the restrictive immigration policy in effect since 2025, is also expected to limit economic activity.
However, the U.S. economy will continue to show some resilience in the face of various sources of uncertainty. In the short term, it will be supported by the sweeping 2025 budget plan, the One Big Beautiful Bill Act (OBBBA), and by substantial investments in artificial intelligence.
— For its part, productivity is expected to remain high and maintain growth in economic activity close to its potential over the medium term.
Budget issues will, however, limit the federal government's leeway. In April 2026, the International Monetary Fund reported that the budgetary deficit could go from 6.8% of GDP in 2025
to 7.5% of GDP in 2026, and then to 7.4% of GDP in 2027. As a result, it will continue to drive up public debt, which could reach 125.8% of GDP in 2026 and 128.6% of GDP in 2027.
After reaching 3.5% in 2025, growth in global economic activity is expected to slow to 3.0% in 2026, the lowest level since 2020. It is then expected to rise to 3.2% in 2027 and stabilize at that level on average annually from 2028 to 2030.
The global economy demonstrated resilience in 2025 despite the tariffs introduced by the U.S. administration. However, in 2026, the closure of the Strait of Hormuz disrupted global supply chains for several essential goods, such as fertilizers, aluminum, as well as oil and natural gas, triggering a historic energy shock.
— This shock has driven up inflation and weighed on economic activity in several economies, particularly in Europe and Asia. However, since the oil market is global, households and businesses in other economies have also felt the effects of rising gasoline prices, among other things.
— Furthermore, emerging and developing economies-whose GDP tends to be more dependent on oil inputs-have been more severely affected by the conflict in the Middle East than advanced economies.
The fiscal measures and budgetary initiatives implemented by several governments have partially mitigated the impact of rising energy prices, but the growing public debt of recent years is limiting their leeway.
For its part, global trade growth was high in early 2026 due to robust demand in the technology sector, which supported growth in several economies, particularly in Asia.
■ Monetary policies and financial markets
The Bank of Canada has kept its policy interest rate unchanged since October 2025. It stood at 2.25% in summer 2026, its lowest level since July 2022.
— Given that inflation has risen above the 2% target and the economic uncertainty in Canada stemming from the trade dispute with the United States, the policy interest rate is expected to remain unchanged for the remainder of 2026.
— However, it is expected to rise by 25 basis points in early 2027 to reach 2.50%-which is within the Bank of Canada's neutral rate estimate range (between 2.25% and 3.25%).
For its part, the U.S. Federal Reserve paused its monetary easing in the first half of 2026, after cutting its policy interest rate three times in 2025 to bring it within the 3.50%-3.75% range. In addition, it underscored that inflation remains elevated and that there is a high degree of uncertainty surrounding the economic outlook in the United States.
— As a result, the Federal Reserve remains vigilant regarding the risks to its dual mandate: stable prices and maximum employment. It will be patient in order to assess the past effects of the energy shock caused by the conflict in the Middle East on inflation expectations. In the medium term, the U.S. policy interest rate is expected to approach 3%, which is roughly the level of the neutral interest rate for the U.S. economy as estimated by the Federal Reserve.
Bond yields have risen sharply in most advanced economies since the conflict in the Middle East broke out. In Canada, in the first half of 2026, they reached their highest level in two years.
— Rising inflationary risk has led to a shift in market expectations. It is anticipated that several central banks will adopt less accommodative monetary policies this year, which has supported the rise in bond yields.
— In Canada, the yield on 10-year federal bonds has risen sharply, driven by accelerating inflation, as expectations of a rise in the Bank of Canada's policy interest rate have increased.
Bond yields will decrease in the second half of the year as global inflationary pressures gradually ease due to falling oil prices.
— Nevertheless, bond yields remain volatile and could settle at higher levels than expected, particularly given the risks associated with public finances and the political situation in certain advanced economies.
Oil prices have risen sharply since the war in the Middle East broke out in late February 2026, as the closure of the Strait of Hormuz and the decline in the oil production of the Persian Gulf countries have triggered an oil shock.
— In particular, the price of West Texas Intermediate (WTI) averaged close to US$100 per barrel in April and May 2026, a nearly four-year high. However, it subsequently fell to close to US$70 per barrel in early July 2026.
In its June 2026 report, the International Energy Agency (IEA) estimated that, in May 2026, global oil supply was 13.6 million barrels per day (mb/d) below its pre-conflict level.
— According to the IEA, global oil supply is expected to decline by 3.9 mb/d in 2026 before rebounding by 8.0 mb/d in 2027, reaching more than 110 mb/d, supported by the projected recovery in oil exports from the Middle East.
For its part, global oil demand is expected to decline by 1.1 mb/d in 2026 before growing by 2.0 mb/d the following year, due, in particular, to the normalization of oil flows, the replenishment of global inventories, and the improvement in the global economic situation.
— Furthermore, in June 2026, the IEA projected that the oil market would face a slight global supply shortfall of just under 1.0 mb/d in 2026, which would represent a reversal from the significant surplus that had been expected before the conflict began (3.7 mb/d).
The gradual resumption of maritime traffic in the Strait of Hormuz in summer 2026 is expected to help drive down oil prices following a difficult first half of the year in the oil market.
— Oil prices are nevertheless expected to remain volatile during this period of normalization, and episodes of sharp fluctuations-both upward and downward-are expected to continue in the coming quarters. In this context of ongoing uncertainty, prudence is in order, and the WTI price is expected to average nearly US$80 per barrel in 2026.
TABLE 7
| Canadian financial markets (average annual percentage rate, unless otherwise indicated; end-of-year data in brackets) |
||||||||||||||||||
| 2025 | 2026 | 2027 | 2028 | 2029 | 2030 | |||||||||||||
| Overnight rate target | 2.6 (2.3 | ) | 2.3 (2.3 | ) | 2.5 (2.5 | ) | 2.5 (2.5 | ) | 2.5 (2.5 | ) | 2.5 (2.5 | ) | ||||||
| 3-month Treasury bill | 2.6 (2.2 | ) | 2.3 (2.5 | ) | 2.5 (2.5 | ) | 2.5 (2.5 | ) | 2.5 (2.5 | ) | 2.5 (2.5 | ) | ||||||
| 10-year bond | 3.2 (3.4 | ) | 3.5 (3.5 | ) | 3.4 (3.4 | ) | 3.4 (3.4 | ) | 3.4 (3.4 | ) | 3.4 (3.4 | ) | ||||||
| Canadian dollar (in U.S. cents) | 71.5 (72.9 | ) | 72.6 (72.9 | ) | 74.4 (75.7 | ) | 77.2 (78.0 | ) | 78.1 (78.1 | ) | 78.1 (78.1 | ) | ||||||
| U.S. dollar (in Canadian dollars) | 1.40 (1.37 | ) | 1.38 (1.37 | ) | 1.34 (1.32 | ) | 1.30 (1.28 | ) | 1.28 (1.28 | ) | 1.28 (1.28 | ) | ||||||
| Brent crude oil (in U.S. dollars per barrel) | 68 (62 | ) | 85 (80 | ) | 75 (72 | ) | 70 (70 | ) | 71 (73 | ) | 75 (76 | ) | ||||||
| West Texas Intermediate (WTI) oil (in U.S. dollars per barrel) | 65 (58 | ) | 81 (77 | ) | 71 (68 | ) | 66 (66 | ) | 67 (69 | ) | 71 (72 | ) | ||||||
| Western Canadian Select (WCS) oil (in U.S. dollars per barrel) | 53 (45 | ) | 65 (63 | ) | 58 (55 | ) | 52 (52 | ) | 53 (55 | ) | 57 (58 | ) | ||||||
Sources: Statistics Canada, Bloomberg and Ministère des Finances du Québec.
■ Factors internal to the Québec economy
Economic forecasts are based on the assessment of the components of aggregate domestic demand as well as the external sector. The latter reflects, among other things, the ability of Québec businesses to take advantage of demand from Québec's main trading partners. Furthermore, the labour market situation and shift in inflation are key determinants of real GDP growth in Québec.
■ Domestic demand
Domestic demand consists of the sum of the following components:
— household consumption expenditure;
— residential investment;
— non-residential business investment;
— government expenditure on goods and services and investments.
After growing by 1.9% in real terms in 2025, domestic demand is expected to increase by 0.5% in 2026 and by 1.0% in 2027. Growth will stabilize at 1.1% on average annually from 2028 to 2030.
After rising 1.8% in 2025, growth in consumption expenditure will slow to 1.1% in 2026. It will then increase to 1.6% in 2027. From 2028 to 2030, growth in these expenditures is expected to be 1.5% on average annually.
— The increase in households' consumption will be supported in part by their favourable financial position, characterized in particular by a high savings rate (7.8% in 2025), which will allow them to draw on their accumulated savings to fund their purchases. In addition, the debt ratio, which corresponds to the total value of liabilities divided by household disposable income, is down, falling from 158.6% in 2010 to 143.9% in 2025. This decline reflects the fact that households have some leeway in managing their finances. Consumers will also continue to benefit from relatively low interest rates, particularly when purchasing durable goods.
— Nevertheless, the expected population decline through 2029 will dampen demand for goods and services.
After growing by 12.9% between 2023 and 2025, residential investment in real terms is expected to decline by 1.9% in 2026 and 1.7% in 2027. Despite these declines, the level of investment will remain high from a historical perspective. From 2028 to 2030, residential investment is expected to continue to fall (−2.6% on average annually).
— It bears noting that after significant declines in 2022 (−8.9%) and 2023 (−14.6%), residential investment has rebounded. This change was explained by latent demand for housing, resulting from strong population growth in 2023 and 2024, the fall in mortgage interest rates and by government initiatives aimed at increasing the housing stock.
— Over the next few years, the declining population will limit demand for housing. In a residential market that is already approaching equilibrium, this trend is expected to ease upward pressure on home prices and slow the pace of housing starts.
After a decline of 0.8% in 2025, non-residential business investment is expected to grow slightly in 2026 (+0.2%).
— Note that in 2025, the trade dispute led to the postponement, or even cancellation, of certain investment projects. Investments in machinery and equipment (−2.4%), whose components are mainly imported, were particularly affected.
As uncertainty surrounding the renegotiation of CUSMA subsides and export growth strengthens, the growth of these investments will accelerate. It is expected to rise to 1.7% in 2027, then average 2.4% annually from 2028 to 2030.
— In particular, investment in artificial intelligence is expected to intensify, driven by digital transformation and the search for productivity gains.
— In addition, despite the unstable trade environment, many projects are continuing, particularly in public transit and the mining sector. For its part, Hydro-Québec's Action Plan 2035 - Towards a Decarbonized and Prosperous Québec includes massive investments by 2035.
After increasing by 9.5% in 2025, the value of governments' investments is expected to increase by 3.3% in 2026 and 2.3% in 2027. Their growth will continue over the next few years (+1.7% in 2028, +2.2% in 2029 and +2.9% in 2030). The value of these investments, which include investments by the Québec government, the federal government, local public administrations and Indigenous public administrations, is therefore expected to reach $33.9 billion in nominal terms in 2030.
— In particular, investments under the 2026-2036 Québec Infrastructure Plan (QIP)7 will amount to $167 billion, of which $87 billion is planned for the first five years, that is, from 2026-2027 to 2030-2031.
— The agreement reached between the federal and provincial governments as part of the implementation of the Canadian Housing Infrastructure Fund (CHIF) to finance the construction and upgrading of municipal water infrastructure will also contribute to the growth of these investments.
— In addition, increases in the federal government's defence spending and investments are expected to help support public spending in the coming years.
Through their purchases of goods and services, the various levels of government will also support economic activity.
• Job creation, unemployment and the workforce
Over the next few years, the anticipated reduction in the labour force, due to the combined effects of population aging and declining immigration, is expected to result in a more moderate rise in employment.
_______________________________________
7 The 2026-2036 Québec Infrastructure Plan is available on Québec.ca at: https://cdn-contenu.quebec.ca/cdn-contenu/adm/min/secretariat-du-conseil-du-tresor/publications-adm/budgets/2026-2027/en/6_quebec_infrastructure_plan.pdf.
— The labour force, defined as the number of people aged 15 and over who are looking for work or are employed, will decline through 2028 (−0.4% in 2026, −0.2% in 2027 and −0.3% in 2028), before returning to growth in 2029 (+0.1%) and posting a 0.3% increase in 2030.
The shrinking labour pool will dampen job creation. Furthermore, in the short term, the decline in overall demand for goods and services resulting, in particular, from the trade dispute and a high degree of uncertainty will continue to limit hiring.
— Accordingly, 15 400 jobs will be shed in 2026 (−0.3%). Job creation should resume in 2027 (+22 600 jobs, +0.5%). From 2028 to 2030, an additional 15 000 jobs are expected on average annually.
Since employers will have to deal with a smaller labour pool to fill their available positions, the unemployment rate is expected to remain relatively low in 2026 (5.6%). Subsequently, it is expected to resume a downward trend, averaging 4.9% in 2027, 4.3% in 2028 and then 4.1% in both 2029 and 2030. Against this backdrop, Québec will continue to move close to full employment.
■ Inflation
Despite rising protectionism in the United States and the introduction of high tariffs, inflationary pressures remained relatively contained in 2025, and CPI growth was 2.4% in Québec.
CPI growth is expected to accelerate and reach 3.0% in 2026.
— The conflict in the Middle East led to a surge in commodity prices, which increased pressure on production and transportation costs in the first half of 2026. The easing of geopolitical tensions is expected to gradually slow the rise in prices, particularly those of petroleum products, in the second half of 2026.
Starting in 2027, inflation is expected to return to close to the Bank of Canada's 2.0% target, due in part to the decline in oil prices and the slowing growth in housing prices. In Québec, inflation is expected to average 2.1% in 2027, and then 2.0% from 2028 to 2030.
■ External sector
In 2025, the imposition of tariffs on certain Canadian products, including aluminum and lumber, made Québec products more expensive for U.S. buyers. In this context, Québec's exports in real terms fell by 1.2%.
— This decline is due, in particular, to the drop in exports to the United States, the value of which fell by 7.0% over the course of the year. Conversely, the value of international exports to markets other than the United States rose by 10.8%, reflecting companies' efforts to diversify their export markets.
The persistence of the trade dispute and high levels of uncertainty will continue to dampen foreign trade, particularly with the United States. Québec's export volume is therefore expected to decline again in 2026 (−0.4%).
It will return to growth in 2027 (+1.9%), as uncertainty eases and companies continue their efforts to increase exports outside the United States. Total export growth is expected to stabilize thereafter to 2.0% on average annually from 2028 to 2030.
Like exports, imports are expected to decline by 0.5% in 2026, before rebounding and growing by 1.4% in 2027 and 2028, and then 1.2% in both 2029 and 2030.
— The weakness of imports in 2026 is partly due to the decline in investment in machinery and equipment (−1.5%), whose components are mainly purchased from abroad. Additionally, trade tensions are prompting Québec businesses to become less dependent on U.S. imports.
❏ Risks and sensitivity analysis for economic forecasts
■ Risks
The financial market and economic forecasts are based on several assumptions. Associated with some of these are risks that could affect the forecast scenario and, as a result, the expected changes in the Québec economy.
The risks described in Budget 2026-2027 remain present.8
— Given the Québec economy's high degree of openness to trade, Québec's economic variables could be influenced by several external factors, such as:
— changes in U.S. economic and trade policies;
— a worsening of geopolitical tensions;
— a broad-based weakening of the global economy;
— a different evolution of oil prices;
— potential disruptions in financial markets, stemming in particular from an excessive increase in debt levels in advanced economies, or from overestimated earnings growth expectations for certain technology companies whose market capitalization is already at very high levels.
— Other risks or events are internal. They could lead to changes in certain economic variables in Québec other than what was forecast, such as:
— a significant price correction in the real estate sector in Québec and Canada;
— population growth that differs from what was expected;
— persistent weakness in non-residential business investment;
— high inflation, which would persist longer than expected.
The baseline economic scenario is balanced. Nevertheless, it is not shielded from events that could impact economic activity, both on the downside and the upside.
— Specifically, a recession could arise, for example, in the event of an escalation of the trade dispute, complications in the CUSMA negotiations or worsening geopolitical tensions, in particular in the Middle East. Conversely, if a trade agreement were to be reached between Canada and the United States or certain sectoral tariffs were to be withdrawn, this would reduce uncertainty and lead to stronger economic growth. The effects of these various scenarios are presented in Section 7.
_______________________________________
8 The main risks that may influence the economic forecast scenario are outlined in Budget 2026-2027, p. E.59-E.60.
■ Sensitivity analysis
Economic forecasts take into account certain elements of uncertainty. The realization of these uncertainties may lead to different results than those forecast.
■ Impacts of external variables on the Québec economy
The results of a sensitivity analysis conducted with a structural vector autoregression model9 on the basis of historical data show that a 1% variation in U.S. real GDP entails, on average, a change of 0.45% in Québec's real GDP.
— The maximum effect occurs two quarters later.
Moreover, this model shows that a 1% variation in Ontario's real GDP gives rise on average to a change of 0.42% in Québec's real GDP.
— The maximum effect is felt one quarter later.
Ontario is the Canadian province with which Québec has the most commercial ties. Furthermore, the two provinces have a similar economic structure.
In 2022, exports to Ontario accounted for 58.9% of Québec's interprovincial exports. Also, the effects measured for Ontario and the United States are not additive.
TABLE 8
Impact of external shocks on Québec's real GDP growth rate
| External shocks of 1% | Maturity(1) (quarters) |
Impact on Québec's real GDP (percentage points) |
||||
| U.S. real GDP | 2 | 0.45 | ||||
| Ontario real GDP | 1 | 0.42 |
(1) Maturity corresponds to the number of quarters needed to record the greatest impact on Québec's real GDP, presented in the right-hand column.
Sources: Institut de la statistique du Québec, Statistics Canada, Ontario Ministry of Finance, S&P Global, Bloomberg and Ministère des Finances du Québec.
_______________________________________
9 This is an econometric technique used to estimate, from a large number of observations, the extent to which fluctuations in one economic variable influence another.
1.3 Main adjustments since March 2026
Overall, from 2026 to 2030, the economic forecasts underlying the financial framework in the pre-election report are comparable to those in Budget 2026-2027.
— Economic growth in Québec is expected to reach 0.7% in 2026 and 1.4% in 2027.
— For 2026, this is a downward adjustment of 0.4 percentage points from the March 2026 forecast. The growth forecast for 2027 to 2030 remains unchanged.
— In particular, the forecast in the pre-election report factors in the gradual resumption of maritime shipping in the Strait of Hormuz in summer 2026. However, the full normalization of shipments and production in this region will happen gradually over the coming quarters.
— Changes to certain tariffs, particularly those that came into force on April 6, 2026 targeting metal products, as well as a more pronounced population decline in 2026, are also behind this downward adjustment.
Since March, like the Ministère des Finances, the private sector has made a downward adjustment to its economic forecast for 2026.
— As at June 18, 2026, private sector economists anticipate, on average, an increase in real GDP of 0.5% for 2026. This is a downward adjustment of 0.5 percentage points compared to what they had forecast in March 2026 (+1.0%).
— Note that this forecast is slightly lower than that of the Ministère des Finances (+0.7%). The discrepancy between private sector forecasts reflects the uncertainty surrounding the current economic situation, with the lowest forecast at 0.2% and the most optimistic at 0.8%.
— For 2027, private sector economists expect, on average, an increase in real GDP of 1.6%, a forecast that remains unchanged from March 2026.
— This forecast is slightly higher than that of the Ministère des Finances (+1.4%).
TABLE 9
Economic outlook for Québec - Comparison with the private sector
| (real GDP, annual percentage change) | |||||||
| 2025 | 2026 | 2027 | 2028 | 2029 | 2030 | Average 2026-2030 |
|
| Ministère des Finances | |||||||
| - Budget 2026-2027 | 0.8 | 1.1 | 1.4 | 1.5 | 1.5 | 1.4 | 1.4 |
| - 2026 pre-election report | 0.6 | 0.7 | 1.4 | 1.5 | 1.5 | 1.4 | 1.3 |
| Private sector average | |||||||
| - March 2026(1) | 0.9 | 1.0 | 1.6 | 1.5 | 1.5 | 1.5 | 1.4 |
| - June 2026(2) | - | 0.5 | 1.6 | 1.6 | 1.5 | 1.5 | 1.3 |
Note: Averages may not add due to rounding.
(1) Ministère des Finances du Québec survey as at March 9, 2026, which includes the forecasts of 10 private sector institutions.
(2) Ministère des Finances du Québec survey as at June 18, 2026, which includes the forecasts of 10 private sector institutions.
Source: Ministère des Finances du Québec.
2. FINANCIAL FRAMEWORK
2.1 Multi-year budgetary outlook
The Pre-election Report on the State of Québec's Public Finances - August 2026 presents the revenue and expenditure outlook for the Québec government until 2030-2031.
Revenue will amount to $168.4 billion in 2026-2027, with growth of 5.0%. Growth will decrease to 3.5% in 2027-2028.
— Over the period covered by the financial framework, that is, until 2030-2031, annual revenue growth will average 3.3%.
In 2026-2027, growth in portfolio expenditures will reach 3.4%, compared to 3.0% in 2025-2026.
— The slowdown in growth in 2028-2029 and 2029-2030 is due to the impact of the stabilization of investments for infrastructure belonging to third parties and initiatives stemming from the expenditure review. Excluding these elements, growth would be 2.2% and 2.0%, respectively.
Total expenditure, including debt service, will stand at $171.6 billion in 2026-2027, with growth of 3.4%. Growth will be 2.5% in 2027-2028.
— From 2026-2027 to 2030-2031, annual growth in total expenditure will average 2.3%.
The change in revenue and expenditure takes into account the fiscal measures and budgetary initiatives that have been announced since the release of Budget 2026-2027.
The financial framework includes a total contingency reserve of $8.0 billion, with $2.0 billion in 2026-2027 and $1.5 billion per year as of 2027-2028, which could be used, in particular, to cover unforeseen expenditures or mitigate the effects of more-moderate-than-anticipated economic growth.
— The $2.0 billion contingency reserve that was provided for 2025-2026 was not used, as was also the case in 2024-2025.
The financial framework still includes gaps to be bridged of $1.9 billion in 2028-2029 and then $2.0 billion per year as of 2029-2030.
TABLE 10
Multi-year financial framework
| (millions of dollars, unless otherwise indicated) | |||||||||||||||||||||
| 2025- 2026 |
2026- 2027 |
2027- 2028 |
2028- 2029 |
2029- 2030 |
2030- 2031 |
AAGR(1) | |||||||||||||||
| Revenue | |||||||||||||||||||||
| Personal income tax | 48 969 | 50 942 | 52 841 | 54 861 | 56 867 | 59 006 | |||||||||||||||
| Contributions for health services | 9 304 | 9 538 | 9 876 | 10 327 | 10 628 | 10 962 | |||||||||||||||
| Corporate taxes | 14 599 | 14 698 | 15 252 | 15 240 | 15 835 | 16 875 | |||||||||||||||
| School property tax | 1 243 | 1 301 | 1 367 | 1 426 | 1 479 | 1 531 | |||||||||||||||
| Consumption taxes | 29 639 | 30 682 | 31 632 | 32 416 | 33 206 | 34 035 | |||||||||||||||
| Duties, permits and royalties | 6 708 | 6 484 | 6 928 | 7 278 | 7 586 | 7 823 | |||||||||||||||
| Miscellaneous revenue | 14 922 | 15 790 | 16 110 | 16 744 | 17 385 | 17 988 | |||||||||||||||
| Government enterprises | 5 241 | 5 908 | 6 208 | 6 909 | 6 653 | 7 035 | |||||||||||||||
| Own-source revenue | 130 625 | 135 343 | 140 214 | 145 201 | 149 639 | 155 255 | |||||||||||||||
| % change | 4.0 | 3.6 | 3.6 | 3.6 | 3.1 | 3.8 | 3.5 | ||||||||||||||
| Federal transfers | 29 803 | 33 046 | 34 011 | 33 643 | 32 802 | 33 757 | |||||||||||||||
| % change | −2.3 | 10.9 | 2.9 | −1.1 | −2.5 | 2.9 | 2.5 | ||||||||||||||
| Total revenue | 160 428 | 168 389 | 174 225 | 178 844 | 182 441 | 189 012 | |||||||||||||||
| % change | 2.8 | 5.0 | 3.5 | 2.7 | 2.0 | 3.6 | 3.3 | ||||||||||||||
| Expenditure | |||||||||||||||||||||
| Portfolio expenditures | −155 782 | −161 081 | −165 049 | −166 666 | −168 291 | −173 584 | |||||||||||||||
| % change(2) | 3.0 | 3.4 | 2.5 | 1.0 | 1.0 | 3.1 | 2.2 | ||||||||||||||
| Debt service | −10 148 | −10 516 | −10 870 | −11 402 | −11 860 | −12 749 | |||||||||||||||
| % change | 1.8 | 3.6 | 3.4 | 4.9 | 4.0 | 7.5 | 4.7 | ||||||||||||||
| Total expenditure | −165 930 | −171 597 | −175 919 | −178 068 | −180 151 | −186 333 | |||||||||||||||
| % change | 2.9 | 3.4 | 2.5 | 1.2 | 1.2 | 3.4 | 2.3 | ||||||||||||||
| Contingency reserve | - | −2 000 | −1 500 | −1 500 | −1 500 | −1 500 | |||||||||||||||
| ACCOUNTING SURPLUS (DEFICIT) - BEFORE GAP TO BE BRIDGED(3) | −5 502 | −5 208 | −3 194 | −724 | 790 | 1 179 | |||||||||||||||
| % of GDP | 0.9 | 0.8 | 0.5 | 0.1 | 0.1 | 0.2 | |||||||||||||||
| Gap to be bridged | - | - | - | 1 850 | 2 000 | 2 000 | |||||||||||||||
| Deposits of dedicated revenues in the Generations Fund |
−2 289 | −2 482 | −2 501 | −2 626 | −2 790 | −2 929 | |||||||||||||||
| BUDGETARY BALANCE | −7 791 | −7 690 | −5 695 | −1 500 | - | 250 | |||||||||||||||
| % of GDP | 1.2 | 1.2 | 0.8 | 0.2 | - | - | |||||||||||||||
Note: Totals may not add due to rounding.
(1) Average annual growth rate, corresponding to the geometric mean over five years, from 2026-2027 to 2030-2031.
(2) Growth in 2028-2029 and 2029-2030 is affected by the impact of the stabilization of investments for infrastructure belonging to third parties and by initiatives stemming from the expenditure review. Excluding these elements, growth would be 2.2% and 2.0%, respectively.
(3) The accounting surplus (deficit) before the gap to be bridged corresponds to the accounting surplus (deficit) presented in the budget documents. In accordance with the presentation requirements of the public sector accounting standards applied in preparing the public accounts, an illustration of the accounting surplus (deficit) once the gaps have been bridged is provided in Section 3.1. For example, in 2028-2029, once the gap has been bridged, the accounting surplus will amount to $1 126 million.
2.2 Main variables of the financial framework
TABLE 11
Main variables of Québec's financial framework and debt
| REVENUE | |
| Own-source revenue excluding revenue from government enterprises | |
| - Personal income tax | - Wages and salaries - Employment insurance - Pension income - Self-employed income - Capital gains - Interest income |
| - Contributions for health services | - Wages and salaries |
| - Corporate taxes | - Net operating surplus of corporations - Gross operating surplus of corporations - Consumer price index |
| - Sales tax | - Consumption excluding food expenditures and shelter - Residential investment |
| - Specific taxes (fuel, tobacco products and alcoholic beverages) |
- Per capita household disposable income - Consumer price index - Gas prices |
| Own-source revenue from government enterprises | |
| - Hydro-Québec | - Normal winter temperatures and price of energy on external markets |
| - Loto-Québec | - Consumption patterns of customers |
| - Société des alcools du Québec | - Consumption patterns of customers |
| - Société québécoise du cannabis | - Consumption patterns of customers |
| - Investissement Québec | - Economic situation and anticipated returns on investment projects |
| Revenue from federal transfers | |
| - Equalization | - Canada's nominal GDP - Population of the provinces - Basic federal tax - Corporate taxable income - Revenue from natural resources |
| - Health transfers | - Canada's nominal GDP - Population of the provinces - Basic federal tax |
| - Transfers for post-secondary education and other social programs |
- Population of the provinces - Basic federal tax |
| - Other programs | - Agreements with the federal government (e.g., labour market agreements and infrastructure agreements) |
| EXPENDITURE | - Budgetary policy directions, including budgetary initiatives - Program renewal costs, where applicable: ▪ demographics ▪ prices (inflation, salary increases for government employees) - Infrastructure investments |
| DEBT SERVICE | - Debt level - Interest rate - Returns on the Retirement Plans Sinking Fund (RPSF) |
| DEBT | - Accounting balance - Net capital investments stemming from the Québec Infrastructure Plan (QIP) - Loans, investments and advances - Deposits made annually in the Generations Fund |
2.3 Assumptions, risks and margins for prudence of the financial framework
The Ministère des Finances' forecasts rely on economic and budgetary assumptions.
For example, Québec's real GDP forecast takes into account certain external factors, such as the economic growth of Québec's major trading partners, exchange rates and oil prices, as well as internal factors, such as changes in domestic demand.
Certain risks are associated with taking into account these assumptions. The sensitivity analysis is carried out to evaluate the impact of those risks on the forecasts and to present the estimated repercussions of a variation in any of the assumptions used to establish the financial framework.
TABLE 12
Main assumptions of Québec's financial framework
| Assumptions | |
| ECONOMIC GROWTH |
- The pre-election report is based on the premise that the average effective tariff rate will remain relatively stable over the next few years. Furthermore, progress in the CUSMA negotiations is expected to reduce the uncertainty that has shaken consumer and business confidence. This trend will allow for a return to more sustained economic growth starting in 2027. - Growth in domestic demand will moderate, due, in particular, to the declining population, which will limit expenditure on goods and services and residential investment. ▪ Nevertheless, household consumption will remain the main driver of growth, and governments will continue to support economic activity. ▪ Non-residential business investment will resume an upward trajectory as uncertainties subside. - Population decline and an aging population will lead to a tighter labour pool, which will limit job creation and put downward pressure on the unemployment rate. - As companies continue to adapt to the new trade environment marked by tariff measures, the external sector will recover. - Canada's policy interest rate will remain stable at 2.25% for the remainder of 2026. - Canadian and U.S. bond yields will decrease over the next few quarters. - Oil prices will decline starting in the second half of 2026 with the gradual normalization of maritime traffic in the Strait of Hormuz. - The Canadian dollar will gradually appreciate against the U.S. dollar. - Global economic growth will moderate in 2026 compared to 2025, then pick up slightly in 2027. |
❏ Risks and sensitivity analysis
While the economic forecast under the Ministère des Finances baseline scenario is balanced, it is not shielded from events that could influence changes in economic activity, both on the downside and the upside.
Developments in the trade dispute with the United States constitute the main risk to the baseline scenario. Other risks could also cause Québec's economy to deviate from the expected trajectory. In particular, a shift in inflation from that expected in the baseline scenario, as a result of an escalation in tensions in the Middle East, for instance, would have effects on the parameters and assumptions underpinning the forecasts for the components of the financial framework. Consequently, the sensitivity analysis results could be substantially different from those initially anticipated.
| TABLE 13 Main risks to Québec's financial position |
| Margins for prudence | Risks | Estimated impact(1) |
|
Financial framework |
Economic variables |
|
|
Contingency reserve: - $2.0 billion in 2026-2027 - $1.5 billion per year from 2027-2028 to 2030-2031 |
Impact of external variables on the Québec economy: |
|
|
- variation of 1 percentage point in U.S. real GDP - variation of 1 percentage point in Ontario's real GDP |
Impact of 0.45 percentage points on Québec's real GDP Impact of 0.42 percentage points on Québec's real GDP |
|
|
Own-source revenue |
||
| Global slowdown: | ||
|
- variation of 1 percentage point in Québec nominal GDP (equivalent to a 1-percentage point variation in growth in the Consumer Price Index) |
Impact of $1.2 billion on own-source revenue(2) |
|
|
- typical recession(3) |
Impact of $10.8 billion on own-source revenue(2) over five years | |
|
Government enterprises |
||
|
Variation of 1 °C in winter temperatures compared to normal temperatures |
Impact of $25 million on Hydro-Québec's net earnings | |
|
Federal transfers |
||
| Variation of 0.1 percentage points in Québec's share of Canada's population | Impact of $255 million on federal transfer revenues | |
|
Portfolio expenditures |
||
|
Contingency Fund reserve: - $200 million per year from 2026-2027 to 2030-2031 |
Unforeseen expenditure under government programs |
Undetermined impact |
|
Variation of 1 percentage point in the total population |
Impact of $1 270 million on expenditure | |
|
Variation of 1 percentage point in the general level of prices |
Impact of $760 million on expenditure | |
|
Natural disaster(4) |
Undetermined impact | |
|
Public capital investment completion rate for a given year (5% difference) |
Impact of $331 million on spending (depreciation, non-government-owned infrastructure grants and interest) | |
| Debt service | ||
|
Variation of 1 percentage point in interest rates |
Impact of $640 million on debt service(5) | |
|
Variation of 1 percentage point in the return on the RPSF |
Impact of $35 million on debt service(6) |
(1) Unless otherwise indicated, this is the annual financial impact.
(2) Own-source revenue excluding revenue from government enterprises.
(3) The alternative scenarios are presented in Section 7.
(4) Natural disasters include, in particular, impacts linked to climate change.
(5) Ultimately, in the fifth year, a higher-than-anticipated rise in interest rates of 1 percentage point would increase debt service by $1.8 billion.
(6) Ultimately, in the fifth year, a lower-than-anticipated return on the RPSF of 1 percentage point would increase debt service by $209 million.
❏ Margins of prudence in the financial framework
The provisions included in the financial framework total $9.0 billion through 2030-2031:
— a Contingency Fund reserve of $1.0 billion over five years, namely $200 million per year from 2026-2027 to 2030-2031 to respond to an unexpected increase in expenditures;
— a contingency reserve of $8.0 billion over five years-$2.0 billion in 2026-2027 and $1.5 billion per year thereafter-which could be used, in particular, to cover unforeseen expenditures or to mitigate the effects of more-moderate-than-anticipated economic growth.
TABLE 14
| Margins of prudence (millions of dollars) |
||||||||||||||||||
| 2026-2027 | 2027-2028 | 2028-2029 | 2029-2030 | 2030-2031 | Total | |||||||||||||
| Contingency Fund reserve | 200 | 200 | 200 | 200 | 200 | 1 000 | ||||||||||||
| Contingency reserve | 2 000 | 1 500 | 1 500 | 1 500 | 1 500 | 8 000 | ||||||||||||
| TOTAL | 2 200 | 1 700 | 1 700 | 1 700 | 1 700 | 9 000 | ||||||||||||
2.4 Main adjustments since March 2026
This section summarizes the main adjustments of the financial framework since the publication of Budget 2026-2027, in March 2026.
❏ Change in the budgetary situation in 2025-2026
The Public Accounts 2025-2026 show a decrease in the budgetary deficit of $2.2 billion compared to what was forecast in March 2026. These adjustments stem mainly from:
— a $779-million increase in own-source revenue excluding revenue from government enterprises, resulting mainly from tax revenues due to better-than-expected results at the end of 2025-2026, tied to the upward adjustment to nominal GDP growth of 0.2 percentage points in 2025 and the impact on corporate taxes of the strong performance of gold mining companies in 2025;
— a $106-million decrease in revenue from government enterprises, mainly due to decreased revenue from Hydro-Québec as a result of cold winter temperatures, which led to a decline in short-term sales on export markets and an increase in electricity purchases to meet high demand;
— a $774-million decrease in revenue from federal transfers, resulting from the pace of completion of projects receiving federal funding10 and from the upward adjustment of the value of the special Québec abatement, which reduces Québec's cash transfers;11
— planned but unrealized portfolio expenditures totalling $2.2 billion, primarily due to lower operating expenses and, to a lesser extent, the slower-than-expected pace of completion of subsidized infrastructure projects.
As a result of these improvements, the budgetary deficit within the meaning of the Balanced Budget Act, after taking into account deposits of dedicated revenues in the Generations Fund, stands at $7.8 billion for 2025-2026, according to the final results published on July 17, 2026 in the Public Accounts 2025-2026.
_______________________________________
10 Adjustments to revenue from federal transfers stemming from the pace of realization of federally funded infrastructure projects have no impact on the budgetary balance, as a corresponding entry is recorded in expenditure.
11 The amount of the special Québec abatement is shown as a deduction from federal transfers.
TABLE 15
| Adjustments to the 2025-2026 financial framework since March 2026 (millions of dollars) |
|||
| 2025-2026 | |||
| BUDGETARY BALANCE - MARCH 2026 | −9 944 | ||
| Own-source revenue excluding revenue from government enterprises | |||
| − Tax revenue | 855 | ||
| − Other revenue | −76 | ||
| Subtotal | 779 | ||
| Revenue from government enterprises | −106 | ||
| Subtotal - Own-source revenue | 673 | ||
| Federal transfers | −774 | ||
| Subtotal - Adjustments to revenue | −101 | ||
| Portfolio expenditures | 2 247 | ||
| Debt service | 7 | ||
| Subtotal - Adjustments to expenditure | 2 254 | ||
| Contingency reserve | - | ||
| Deposits of dedicated revenues in the Generations Fund | - | ||
| TOTAL ADJUSTMENTS | 2 153 | ||
| BUDGETARY BALANCE - PUBLIC ACCOUNTS 2025-2026 | −7 791 | ||
Note: Totals may not add due to rounding.
| Comparison of deficits in Canada |
|
In 2025-2026, all Canadian provinces showed budgetary deficits. On a comparable basis to the budgetary balances of other Canadian provinces, that is, before deposits of dedicated revenues in the Generations Fund, Québec's deficit stands at $5.5 billion in 2025-2026, or 0.9% of GDP. This is one of the lowest deficits among Canadian provinces, according to information available as at July 17, 2026. Like most Canadian provinces, Québec must rectify its fiscal deficit situation in the medium term. However, it stands out for having a law that, like in Ontario and Alberta, requires a plan or timeline for restoring balance when a deficit occurs. - However, this law requires a return to a balanced budget after deposits of dedicated revenues in the Generations Fund, which imposes an additional constraint for Québec compared to other provinces. Québec is aiming to return to a balanced budget by 2029-2030, while several other provinces with deficits have not set a date. |
| 2025-2026 budgetary balance |
| (percentage of GDP) |
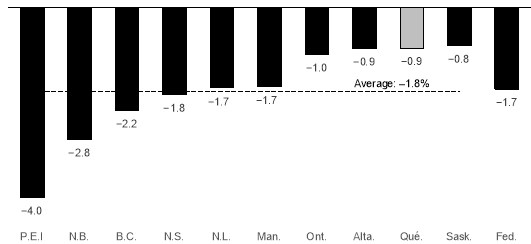 |
|
Notes: For Québec, this is the accounting deficit, that is, before deposits of dedicated revenues in the Generations Fund. This deficit is comparable to that of other provinces. The data are from the 2026-2027 budgets, with the exception of Québec and Saskatchewan; the figures for those two provinces are from their public accounts 2025-2026. For the federal government, this is the balance presented in the March 2026 Fiscal Monitor published on May 29, 2026. |
❏ Adjustments in the financial framework from 2026-2027 to 2028-2029
This section presents the recent developments in Québec's budgetary situation as well as the main adjustments to the forecasts from 2026-2027 to 2028-2029.
Higher-than-expected revenue and the directions taken since the release of Budget 2026-2027 result in upward adjustments to the government's financial situation totalling $922 million
in 2026-2027, followed by budgetary balances that are projected to remain unchanged in 2027-2028 and 2028-2029.
The financial framework presented takes into account the risks associated with the economic situation, including the trade dispute with the United States and the conflict in the Middle East, the impact of higher-than-expected inflation on collective bargaining agreements for government employees and government decisions made since the release of Budget 2026-2027.
— Given the economic environment, the government is maintaining an $8.0-billion contingency reserve over the period covered by the financial framework, including $2.0 billion in 2026-2027. This reserve could be used, in particular, to cover unforeseen expenditures or mitigate the effects of more-moderate-than-expected economic growth.
■ Adjustments in the economic and budgetary situation
Overall, changes in the economic and budgetary situation result in positive adjustments totalling $1.7 billion in 2026-2027, $1.2 billion in 2027-2028 and $751 million in 2028-2029. In particular, these are attributable to:
— positive adjustments to own-source revenue excluding revenue from government enterprises of $1.2 billion in 2026-2027, $877 million in 2027-2028 and $852 million in 2028-2029, primarily due to the recurrence of the more favourable results observed in 2025-2026, the upward adjustment to household consumption12 of 0.8 percentage points in 2026, and the upward adjustment to the Generations Fund's investment income in 2026-2027, the effect of which is partially offset by the downward adjustment to school property tax revenue starting in 2026-2027. More specifically, these adjustments concern mainly:
— personal income tax, for which the $143-million adjustment in 2026-2027 is due, in particular, to the 0.3-percentage-point upward adjustment to wages and salaries in 2026. Adjustments will decrease to $71 million in 2027-2028 and to $106 million in 2028-2029, due, in particular, to the upward adjustment of the tax system's indexation in 2027 in connection with the higher inflation projected for 2026;
— corporate taxes, for which the $201-million adjustment in 2026-2027 is due, in particular, to the recurrence of some of the better-than-expected results in 2025-2026 and by the downward adjustment of total exports by 0.3 percentage points in 2026. Adjustments will decrease to $82 million in 2027-2028 and to $34 million in 2028-2029, due, in particular, to downward adjustments of 2.0 percentage points in the net operating surplus of corporations and 0.4 percentage points to total exports in 2027;
— consumption taxes, for which the $744-million adjustment in 2026-2027 is due, in particular, to the recurrence of better-than-expected results in 2025-2026 and to the upward adjustment of household consumption by 0.8 percentage points in 2026. The adjustments are then stable, reaching $759 million in 2027-2028 and $737 million in 2028-2029;
_______________________________________
12 Household consumption excluding food expenditures and shelter.
— an increase in revenue from government enterprises of $55 million in 2026-2027 and downward adjustments of $234 million in 2027-2028 and $75 million in 2028-2029, primarily due to changes in Hydro-Québec's results, resulting in particular from the postponement of the anticipated date for signing the agreement with Churchill Falls, as well as recent decisions issued by the Régie de l'énergie;
— an increase in federal transfers of $915 million in 2026-2027, $1.1 billion in 2027-2028 and $621 million in 2028-2029;
— Since the publication of Québec's March 2026 budget, the federal government has announced funding for the provinces to support childcare services and boost the housing supply. Québec has also entered into agreements with the federal government as part of the implementation of the Canada Public Transit Fund and the Build Communities Strong Fund.13
— an increase in portfolio expenditures of $47 million in 2026-2027, $569 million in 2027-2028 and $575 million in 2028-2029;
— The adjustments are primarily due to an increase in expenditures funded by the federal government in public transit and water infrastructure projects for municipalities and, for 2027-2028 and 2028-2029, to higher remuneration expenditures resulting from the potential application of the salary adjustment clause for government employees in 2026-2027, which depends on current inflation rate forecasts. These upward adjustments are mitigated by the reversal of the initiative reserve provided for in the financial framework of the last budget.14
— an increase in debt service of $248 million in 2026-2027, a decrease of $61 million in 2027-2028 and an increase of $62 million in 2028-2029;
— The upward adjustment in 2026-2027 is due to higher-than-expected interest rates, resulting in losses on the disposal of assets as part of the Sinking Fund's investment activities related to government borrowings. Debt service will be lower in 2027-2028 due to the smaller deficit in 2025-2026, which has a permanent downward effect on debt service. The upward adjustment in 2028-2029 stems from the impact-which increases over time-of the lower return on the RPSF in 2025-2026, which more than offsets the impact of the smaller deficit in 2025-2026.
— an increase in deposits of dedicated revenues in the Generations Fund of $135 million in 2026-2027, followed by $10 million in both 2027-2028 and 2028-2029.
_______________________________________
13 On June 2, 2026, nearly $10 billion over 10 years in federal transfers for infrastructure in Québec were announced: $1.3 billion under the Baseline Funding stream of the Canada Public Transit Fund, $4.4 billion for strategic projects under the Canada Public Transit Fund, $1 billion for infrastructure in the health sector under the Build Communities Strong Fund, nearly $2.7 billion for infrastructure related to housing and post-secondary education under the Build Communities Strong Fund, of which $1 billion was allocated to water infrastructure on June 16, 2026, and $400 million for 11 projects under the Zero Emission Transit Fund. These revenues have been incorporated into the financial framework, with the exception of the $4.4 billion for strategic projects under the Canada Public Transit Fund and a portion ($1.7 billion) of the envelope for infrastructure related to housing and post-secondary education under the Build Communities Strong Fund, which has not yet been allocated. These will be incorporated once the projects to be funded are known. It should be noted that a corresponding entry will be recorded in expenditures, and therefore the incorporation of these revenues will have no effect on the budgetary balance.
14 The financial framework for Budget 2026-2027 included a provision of $250 million per year, or $1.25 billion over five years, to fund new initiatives. In addition, the upward adjustments to the budgetary situation make it possible to fund new initiatives totalling $2.3 billion over five years while presenting a more favourable path for returning to a balanced budget than forecast in Budget 2026-2027.
■ Initiatives and other adjustments incorporated into the financial framework
The financial framework incorporates the various initiatives announced since the publication of Budget 2026-2027, whose total financial impact amounts to $799 million in 2026-2027, $438 million in 2027-2028 and $351 million in 2028-2029.
The financial framework also includes the elimination of the $750 million gap to be bridged in 2027-2028, as well as a $400 million reduction in the gap in 2028-2029.
TABLE 16
| Adjustments in the financial framework since March 2026 (millions of dollars) |
|||||||||
| 2026-2027 | 2027-2028 | 2028-2029 | |||||||
| BUDGETARY BALANCE − MARCH 2026 | −8 612 | −5 695 | −1 500 | ||||||
| ECONOMIC AND BUDGETARY SITUATION | |||||||||
| Own-source revenue excluding revenue from government enterprises | |||||||||
| - Personal income tax | 143 | 71 | 106 | ||||||
| - Contributions for health services | 126 | 127 | 129 | ||||||
| - Corporate taxes | 201 | 82 | 34 | ||||||
| - Consumption taxes | 744 | 759 | 737 | ||||||
| - Other revenue(1),(2) | −33 | −162 | −154 | ||||||
| Subtotal | 1 181 | 877 | 852 | ||||||
| Revenue from government enterprises | 55 | −234 | −75 | ||||||
| Subtotal - Own-source revenue | 1 236 | 643 | 777 | ||||||
| Federal transfers | 915 | 1 063 | 621 | ||||||
| Subtotal - Revenue | 2 151 | 1 706 | 1 398 | ||||||
| Portfolio expenditures | −47 | −569 | −575 | ||||||
| Debt service | −248 | 61 | −62 | ||||||
| Subtotal - Expenditure | −295 | −508 | −637 | ||||||
| Deposits of dedicated revenues in the Generations Fund | −135 | −10 | −10 | ||||||
| TOTAL ADJUSTMENTS IN THE ECONOMIC AND BUDGETARY SITUATION | 1 721 | 1 188 | 751 | ||||||
| INITIATIVES SINCE MARCH 2026 | −799 | −438 | −351 | ||||||
| SUBTOTAL | −799 | −438 | −351 | ||||||
| Contingency reserve | - | - | - | ||||||
| Gap to be bridged | - | −750 | −400 | ||||||
| TOTAL ADJUSTMENTS | 922 | - | - | ||||||
| BUDGETARY BALANCE - AUGUST 2026 | −7 690 | −5 695 | −1 500 | ||||||
Note: Totals may not add due to rounding.
(1) Other revenue includes school property tax, revenue from duties, permits and royalties, as well as miscellaneous revenue.
(2) The downward adjustment in other revenue is primarily due to a decrease in revenue from the school property tax starting in 2026-2027.
|
Information incorporated into the financial framework |
|
The financial framework presented in the Pre-election Report on the State of Québec's Public Finances - August 2026 integrates all the information available since the publication of the Québec Budget Plan - March 2026. More specifically, the adjustments to revenue and expenditure take into account, among other things: — public accounts data for the 2025-2026 fiscal year; — recent changes in the economic and budgetary situation in Québec; — the recent change in revenue from federal transfers, particularly in connection with housing and infrastructure agreements; — the financial impact of the initiatives announced in the information bulletins, which include, among other things, measures to align with the federal government, such as the extension of the grace period for the Home Buyers' Plan; — the financial impact of the initiatives announced by the Québec government since the release of Budget 2026-2027, in particular those announced to help address the rising cost of living. The financial impact of the initiatives announced since March 2026 totals $799 million in 2026-2027, $438 million in 2027-2028 and $351 million in 2028-2029. |
| Information incorporated into the financial framework (cont.) | ||||||
| Financial impact of the initiatives announced and incorporated into the financial framework since the publication of the Québec Budget Plan - March 2026 | ||||||
| (millions of dollars) | ||||||
| 2026- 2027 |
2027- 2028 |
2028- 2029 |
2029- 2030 |
2030- 2031 |
Total | |
| Initiatives announced and incorporated into the financial framework |
||||||
| Introducing a refundable tax credit for homeownership | −148 | −141 | −141 | −140 | −139 | −708 |
| Zero-rating of specific food and hygiene products | −70 | −102 | −105 | −108 | −111 | −497 |
| Introducing a special payment for groceries and energy costs |
−335 | - | - | - | - | −335 |
| Introducing a rebate on the registration fee for passenger vehicles |
−153 | −92 | - | - | - | −244 |
| Reducing the tax rate for SMBs from 3.2% to 2.2% and adjusting the dividend tax credit |
−30 | −37 | −56 | −55 | −53 | −230 |
| Adding one million hours of home care | −22 | −22 | −22 | −22 | −22 | −110 |
| Supporting aspiring farmers (PAFRA)(1) | −6 | −6 | −6 | −6 | −6 | −28 |
| Implementing the Act respecting the communication of information for the purpose of protecting against intimate partner violence (the Gabie Renaud law) | −5 | −6 | −5 | −6 | −6 | −28 |
| Enhancing funding for the 2026-2031 Québec Audiovisual Strategy |
−10 | −10 | - | - | - | −20 |
| Advancing the conversion of 5 000 childcare spaces(2) | - | - | - | - | - | - |
| Granting 1 000 new units under Québec's Rent Supplement Program (PSLQ) | −3 | −7 | −8 | - | - | −18 |
| Protecting youth and vulnerable individuals | −9 | −9 | - | - | - | −17 |
| Adapting the homelessness, mental health and addiction reintegration program (PRISMD) to address substance abuse issues | −7 | - | - | - | - | −7 |
| Preventing homelessness by supporting vulnerable individuals benefiting from the PSLQ | −1 | −1 | −1 | - | - | −3 |
| Compensating farmers for the carbon tax they pay(3) | - | - | - | - | - | - |
| Reopening the Québec Experience Program (PEQ) for a period of two years(4) |
- | - | - | - | - | - |
| Supporting business succession through the Québec Enterprise Growth Fund(5) | - | - | - | - | - | - |
| Subtotal | −798 | −432 | −343 | −336 | −336 | −2 245 |
| Measures to harmonize with the federal budget | −1 | −7 | −8 | −14 | −21 | −49 |
| TOTAL | −799 | −438 | −351 | −349 | −357 | −2 295 |
|
Note: Totals may not add due to rounding. (1) The financial impact of the increase in the envelope of the Financial Support Program for Aspiring Farmers (PAFRA), which amounts to $8.8 million per year, is partially offset by $3.3 million per year from the biofood policy of the Ministère de l'Agriculture, des Pêcheries et de l'Alimentation. (2) The amounts will be drawn from the available budgetary resources of the Ministère de la Famille. (3) Funding for this initiative, totalling $87 million over two years, will be drawn from the Electrification and Climate Change Fund. (4) The funds will be drawn from the budgetary resources of the Ministère de l'Immigration, de la Francisation et de l'Intégration. (5) This initiative aims to set aside $150 million from the Québec Enterprise Growth Fund and to review its investment policy with the aim of providing greater flexibility in supporting business succession projects. |
||||||
3. PLAN TO RESTORE FISCAL BALANCE
The purpose of the Balanced Budget Act is to balance the government's budget. In particular, the Act provides for the presentation of a plan to restore fiscal balance when the budgetary deficit reported for a given fiscal year exceeds the dedicated revenues in the Generations Fund for that year.
— Like Québec, three other provinces expect to return to a balanced budget within the period covered by the financial framework: Manitoba in 2027-2028, Ontario in 2028-2029, and Saskatchewan in 2030-2031. Furthermore, in accordance with current law, Alberta is expected to return to a balanced budget in 2029-2030.
— However, Québec legislation requires a return to a balanced budget after deposits of dedicated revenues in the Generations Fund, which imposes an additional constraint for Québec compared to other provinces.
Since the budgetary deficit within the meaning of the Act, as established based on the Public Accounts 2022-2023, tabled on December 11, 2023, was $6.1 billion and exceeded the dedicated revenues in the Generations Fund, which amounted to $3.1 billion, the government tabled, in Budget 2025-2026, a plan to restore fiscal balance that meets the following objectives:
— returning to a balanced budget over a maximum period of five years, namely by 2029-2030;
— shrinking deficits over the period covered by the financial framework;
— a maximum deficit of $1.5 billion in 2028-2029, corresponding to 25% of the $6.1-billion budgetary deficit reported in the Public Accounts 2022-2023.
The Balanced Budget Act requires a return to a balanced budget by 2029-2030. Large deficits, if not eliminated, limit the government's long-term ability to deliver public services, ensure intergenerational equity and respond to unforeseen economic shocks.
— This return to a balanced budget must, however, be achieved at a pace compatible with the current economic situation.
The restoration plan tabled as part of Budget 2025-2026 is thus in line with the following key policy directions:
— achieving and then maintaining a balanced budget;
— reducing the share of expenditure in the economy to a level similar to the pre-pandemic level;
— maintaining deposits of dedicated revenues in the Generations Fund and a long-term debt reduction objective;
— stimulating economic growth and narrowing the wealth gap with Ontario;
— providing predictable funding for the government's missions;
— continuing to make infrastructure investments.
The favourable change in revenue observed since the release of Budget 2026-2027 makes it possible to report results that are better than those forecast in March 2026.
3.1 Path for returning to a balanced budget
In Budget 2025-2026, the government presented a plan to gradually eliminate, by 2029-2030, the deficit of $13.6 billion projected for 2025-2026, after deposits of dedicated revenues in the Generations Fund. Budget 2026-2027 marked the second year of implementation of this five-year plan and allowed the presentation of better-than-expected results.
This improvement in the path for returning to a balanced budget continues in the Pre-election Report on the State of Québec's Public Finances - August 2026.
Compared to Budget 2026-2027, the budgetary deficit within the meaning of the Balanced Budget Act, after deposits of dedicated revenues in the Generations Fund, is adjusted downward by $2.2 billion in 2025-2026 and $922 million in 2026-2027.
— The budgetary deficit is $7.8 billion in 2025-2026, an improvement of $5.8 billion compared to the $13.6-billion deficit projected in the March 2025 budget.
Starting in 2027-2028, the balances forecast in Budget 2026-2027 remain unchanged, but include the elimination of the $750-million gap to be bridged forecast for 2027-2028 as well as a $400-million reduction in the gap forecast for 2028-2029.
The budgetary balance presented in the Pre-election Report on the State of Québec's Public Finances - August 2026 complies with the Act, as the projected deficits are less than or equal to those in the plan to restore fiscal balance tabled in March 2025.
The government is continuing its efforts and staying on track to return to a balanced budget by 2029-2030.
| CHART 10 Path for returning to a balanced budget |
| (billions of dollars) |
|
|
❏ Gaps to be bridged
The plan to restore fiscal balance was developed against the backdrop of an economy weakened by the trade dispute with the United States, which prompted the government to outline a gradual plan over five years and to refrain from specifying all the measures needed to restore fiscal balance.
— As this uncertain situation has yet to subside, the financial framework still includes gaps to be bridged of $1.9 billion in 2028-2029 and $2.0 billion in 2029-2030, which will need to be eliminated in order to achieve a balanced budget after deposits of dedicated revenues in the Generations Fund.
Furthermore, a return to more favourable economic conditions, as illustrated in the stronger growth scenario,15 would further stimulate economic activity and allow the gaps to be fully bridged.
This situation could occur, for example, if the United States were to remove tariffs on imports as part of CUSMA renewal negotiations.
The government also has different levers that would allow it to fully bridge the gap.
— It is continuing its initiatives aimed at creating more wealth and increasing Québec's economic potential.
— It will continue its representations to the federal government to obtain additional federal transfers, particularly for health and infrastructure.
— It could benefit from the non-utilization of the contingency reserve.
— It is committed to promoting efficiency and productivity gains for the delivery of public services.
_______________________________________
15 The effects of such a scenario are presented in Section 7.
| Impact of the gap to be bridged in the accounting balance in the public accounts | |||||||||||||||||||
|
The inclusion of the gap to be bridged in the plan to restore fiscal balance reflects the government's gradual approach to adapting the financial framework in line with changes in the budgetary situation. Since the levers to be used for bridging the gap have not yet been determined, the government has chosen, starting with Budget 2025-2026, to report the accounting surplus (deficit) before the gap to be bridged. — Since the initial release of the plan to restore fiscal balance, the gaps for each year have already been bridged or reduced without requiring any additional measures. — This presentation highlights the remaining gaps to be bridged in order to achieve a balanced budget. To ensure the comparability of budget documents, this presentation of the accounting balance has been maintained in the financial framework of the Pre-election Report on the State of Québec's Public Finances - August 2026. However, in accordance with the presentation requirements of the public sector accounting standards applied in preparing the public accounts, an illustration of the accounting balance, as it will be presented in the financial statements, is provided below in grey. — Starting in 2028-2029, the gaps to be bridged will be reflected either in revenue or in expenditure, or through the non-use of the contingency reserve, thereby having a positive impact on the accounting balance. The budgetary balance within the meaning of the Balanced Budget Act, that is, after deposits of dedicated revenues in the Generations Fund, remains unchanged, however, regardless of adjustments made to the presentation of the accounting balance. |
|||||||||||||||||||
| ILLUSTRATION OF THE IMPACT OF THE GAP TO BE BRIDGED ON THE ACCOUNTING BALANCE IN THE PUBLIC ACCOUNTS | |||||||||||||||||||
| (millions of dollars, unless otherwise indicated) | |||||||||||||||||||
| 2025- 2026 |
2026- 2027 |
2027- 2028 |
2028- 2029 |
2029- 2030 |
2030- 2031 |
||||||||||||||
| ACCOUNTING SURPLUS (DEFICIT) - BEFORE GAP TO BE BRIDGED (1) | −5 502 | −5 208 | −3 194 | −724 | 790 | 1 179 | |||||||||||||
| % of GDP | 0.9 | 0.8 | 0.5 | 0.1 | 0.1 | 0.2 | |||||||||||||
| Gap to be bridged | - | - | - | 1 850 | 2 000 | 2 000 | |||||||||||||
| ACCOUNTING SURPLUS (DEFICIT) - AS PRESENTED IN THE FINANCIAL STATEMENTS | −5 502 | −5 208 | −3 194 | 1 126 | 2 790 | 3 179 | |||||||||||||
| % of GDP | 0.9 | 0.8 | 0.5 | 0.2 | 0.4 | 0.4 | |||||||||||||
| Deposits of dedicated revenues in the Generations Fund | −2 289 | −2 482 | −2 501 | −2 626 | −2 790 | −2 929 | |||||||||||||
| BUDGETARY BALANCE | −7 791 | −7 690 | −5 695 | −1 500 | - | 250 | |||||||||||||
| % of GDP | 1.2 | 1.2 | 0.8 | 0.2 | - | - | |||||||||||||
|
Note: Totals may not add due to rounding. (1) The accounting surplus (deficit) before the gap to be bridged corresponds to the accounting surplus (deficit) presented in the budget documents. |
|||||||||||||||||||
3.2 Continuity of services and sustainability of public finances
Returning to a balanced budget contributes to the preservation of intergenerational equity and to the government's long-term ability to ensure the delivery of public services. Thus, achieving a balanced budget is an essential condition for the long-term sustainability of public finances and for controlling the change in the debt burden.
— This process is subject to the Balanced Budget Act and the Act to reduce the debt and establish the Generations Fund.
❏ Benefits of sound management of public finances
The sound management of public finances fosters a climate of confidence conducive to private investment, economic growth and higher productivity. Achieving a balanced budget is essential to the government's debt burden reduction strategy and to public and investor confidence.
In addition to ensuring greater intergenerational equity, reducing the debt burden contributes,
in particular, to sustainable funding for essential government missions, such as health and social services and education, while meeting the challenges of an aging population and climate change.
Moreover, it allows for investments in public infrastructure and strengthens Québec's ability to cope with economic crises. The sound management of public finances thus provides a solid foundation for collective wealth and sustainable prosperity.
■ Maintenance of deposits in the Generations Fund
Specific to Québec, the Generations Fund is a fiscal policy instrument that imposes a stricter definition of budgetary balance compared to other provinces. Deposits of dedicated revenues in the Generations Fund help reduce debt and its burden over time.
— Despite the deficit, Québec is maintaining these deposits. These deposits will amount to $2.5 billion in 2026-2027 and will total $12.7 billion over the five-year period of the return to a balanced budget, from 2025-2026 to 2029-2030.
❏ Impact of the plan to restore fiscal balance on the sustainability of public finances
In accordance with the Balanced Budget Act, in Budget 2025-2026, the government tabled a plan to restore fiscal balance, according to which balance will be achieved by 2029-2030 at the latest, after deposits of dedicated revenues in the Generations Fund.
Fiscal 2026-2027 marks the second year of implementation of this plan. Trends in the various indicators of public finance sustainability show that the plan to restore fiscal balance will have a favourable impact on Québec's public finances, allowing for advantageous comparison, in the future, with the pre-pandemic situation.
In the Pre-election Report on the State of Québec's Public Finances - August 2026, the government is maintaining its path for restoring balance, and it is on track to improve many sustainability indicators, as projected during the development of the plan to restore fiscal balance.
— The share of revenue as a proportion of GDP will be lower in 2029-2030 (24.7%) than it was in 2018-2019 (26.1%).
The plan to restore fiscal balance will also make it possible to reduce the share of expenditure as a proportion of GDP, and to return to a level similar to that before the pandemic. The initiatives taken as part of the plan to restore fiscal balance will help reduce the debt burden as a proportion of GDP and keep debt-servicing costs as a proportion of revenue at historically low levels.
— A low debt-servicing cost as a proportion of revenue provides leeway to better fund public services. Through these initiatives in particular, the proportion of revenues devoted to debt service will remain at historically low levels (6.5% in 2029-2030), thus preserving the government's budgetary flexibility.
TABLE 17
| Impact of the plan to restore fiscal balance on indicators of public finance sustainability, viability and budgetary flexibility (per cent, gap and change in percentage points) |
|||||||||||||||
| 2018-2019 | 2029-2030 | Change compared to 2018-2019 |
|||||||||||||
| Without restoration plan |
With restoration plan(1) |
Gap | |||||||||||||
| Revenue as a proportion of GDP | 26.1 | 24.5 | 24.7 | 0.2 | −1.4 | ||||||||||
| Expenditure as a proportion of GDP | 24.4 | 25.0 | 24.4 | −0.6 | 0.0 | ||||||||||
| Debt-servicing costs as a proportion of revenue |
7.7 | 6.9 | 6.5 | −0.4 | −1.2 | ||||||||||
| Net debt as a proportion of GDP | 42.9 | 39.6 | 37.0 | −2.6 | −5.9 | ||||||||||
Notes: Differences may not add due to rounding.
The grey boxes are those showing a favourable impact on sustainability indicators.
(1) The gap to be bridged and the contingency reserve are not included in the calculation of ratios of revenue and expenditure as a proportion of GDP.
❏ Shares of revenue and expenditure in the economy
The shares of government revenue and expenditure in the economy generally follow similar paths.
In 2026-2027, the share of revenue in the economy stands at 25.2%, below the share of expenditure, which represents 25.7% of GDP.
— The decline in the share of revenue in the economy, from 26.1% in 2018-2019 to 25.2%
in 2026-2027, is due, in particular, to initiatives aimed at reducing the tax burden on Quebecers, such as the tax reduction announced in Budget 2023-2024 and government contributions to limit school tax increases.
— The increase in the share of expenditure in the economy, from 24.4% in 2018-2019 to 25.7%
in 2026-2027, results from one-time pandemic-related expenditures, the perpetuation of some of them, and government investments to fund public services, such as health and social services and education. It is also linked to actions taken reduce Quebecers' tax burden, such as the increases in the senior assistance amount announced in 2021 and 2022.
This gap will gradually be eliminated to maintain sound public finances over the long term.
— With the plan to restore fiscal balance, including actions having an influence on revenue and expenditure, the share of expenditure in the economy will gradually decline to 24.4% in 2029-2030, while that of revenue will stand at 24.7% over the same period.
| CHART 11 Shares of revenue and expenditure in the economy |
| (percentage of GDP) |
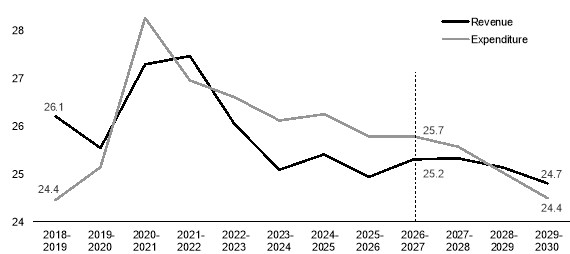 |
|
Chantier gouvernemental de l'efficacité de l'État |
|
The government launched a review of budget expenditures as part of the tabling of its plan to restore fiscal balance. The review identified measures to reduce expenditures that will extend over several years and will have a total impact of $3.0 billion in 2029-2030. These actions fall into four broad categories, namely: — optimization of administrative expenditures and processes; — capping independent labour rates in the health and social services sector; — updating of certain programs; — transforming the way the government operates. In the 2026-2027 Expenditure Management Strategy, the government is going further by implementing the Chantier gouvernemental de l'efficacité de l'État. The purpose of the project is not only to reduce public spending, but also to optimize the use of resources in order to preserve and strengthen public services. To achieve these objectives, the following orientations are recommended: — improve the value of public services by reallocating investments and resources to where they have the greatest public impact; — optimize and better control the costs of indirect services, in particular those related to administrative services and support for public service delivery; — carry out an orderly and rigorous review of the service offering to ensure its relevance and efficiency. In addition, in 2026-2027, the government will continue to implement initiatives aimed at controlling spending, such as extending the suspension of financial assistance payments, combined with a review of operating expenditures, in order to ensure that departments and bodies better prioritize their actions with the goal of ensuring sound and prudent management of public finances. Furthermore, given the share of remuneration in government expenditures, the government has committed to reducing the size of the government through a gradual and responsible approach that began to be implemented in fiscal year 2025-2026. A target reduction of 5 0001 full-time equivalents (FTEs) has been set compared to the 2024-2025 fiscal year, with a reduction of 3 540 FTEs anticipated in 2025-2026. These actions will help improve government efficiency, maintain sustainable growth in spending, and allow a gradual return to a balanced budget by 2029-2030. |
|
1 Excluding Santé Québec, health and social service institutions serving northern and Indigenous populations, education and higher education networks and government enterprises. |
|
Review of tax expenditures |
|
When Budget 2024-2025 was published, the government announced that it would conduct a rigorous review of tax expenditures, covering measures related to personal and corporate income taxes, as well as consumption taxes. Accordingly, nearly 170 tax measures were reviewed to improve the efficiency of Québec's tax system as well as to ensure that existing measures are achieving their objectives and that the increase in their costs is consistent with Quebecers' ability to pay. The improvements identified during this review will have enabled: — optimizing tax assistance for businesses; — simplifying the tax system; — updating the tax system; — fostering the funding of public services. Overall, this review of tax expenditures will free up nearly $1.9 billion in 2029-2030 and help return to a balanced budget and reduce the debt burden. Optimizing tax assistance for businesses To boost the productivity of Québec businesses and achieve its wealth creation goals, the government has taken the following actions: — establishing the tax credit for research, innovation and commercialization to replace eight tax measures; — adjusting tax credits supporting labour-intensive information technology sectors. Simplifying the tax system The review of tax expenditures made it possible to assess the consistency of the tax system's components, which enabled the following: — harmonizing the rate of the tax on insurance premiums with the Québec sales tax; — adjusting the flow-through share regime. Updating the tax system The review of tax expenditures provided an opportunity to adapt the tax system to changing economic and social conditions. The changes made were aimed at: — adapting tax assistance to new economic and social realities, in particular by optimizing the tax credit for career extension; — enhancing tax system fairness, in particular by gradually restoring the balance between the property tax and the public utilities tax; — eliminating inefficient or little-used tax expenditures. Fostering the funding of public services In order to increase government revenue and support public services, the government announced: — ending indexation of the eligibility threshold for reduced rates of employer contribution to the Health Services Fund; — ensuring the sustainable funding of transportation infrastructure and services; — revising the land register consultation fee. |
4. DETAILED REVENUE AND EXPENDITURE FORECASTS
4.1 Change in revenue
This section presents the government's revenue for 2025-2026 to 2028-2029. Government revenue totals $168.4 billion in 2026-2027, or $135.3 billion in own-source revenue and $33.0 billion from federal transfers.
— Revenue will total $174.2 billion in 2027-2028 and $178.8 billion in 2028-2029.
— Revenue growth is forecast at 5.0% in 2026-2027, 3.5% in 2027-2028 and 2.7% in 2028-2029.
TABLE 18
Change in revenue
| (millions of dollars, unless otherwise indicated) | |||||||||||||||
| 2025-2026 | 2026-2027 | 2027-2028 | 2028-2029 | AAGR(1) | |||||||||||
| Own-source revenue | |||||||||||||||
| Own-source revenue excluding revenue from government enterprises | 125 384 | 129 435 | 134 006 | 138 292 | |||||||||||
| % change(2),(3) | 4.6 | 3.2 | 3.5 | 3.2 | 3.3 | ||||||||||
| Revenue from government enterprises | 5 241 | 5 908 | 6 208 | 6 909 | |||||||||||
| % change(4) | −7.9 | 12.7 | 5.1 | 11.3 | 9.6 | ||||||||||
| Subtotal | 130 625 | 135 343 | 140 214 | 145 201 | |||||||||||
| % change | 4.0 | 3.6 | 3.6 | 3.6 | 3.6 | ||||||||||
| Federal transfers | 29 803 | 33 046 | 34 011 | 33 643 | |||||||||||
| % change | −2.3 | 10.9 | 2.9 | −1.1 | 4.1 | ||||||||||
| TOTAL | 160 428 | 168 389 | 174 225 | 178 844 | |||||||||||
| % change | 2.8 | 5.0 | 3.5 | 2.7 | 3.7 | ||||||||||
(1) Average annual growth rate, corresponding to the geometric mean over three years, from 2026-2027 to 2028-2029.
(2) In 2026-2027, the growth in own-source revenue excluding revenue from government enterprises is due, in particular, to the 3.4% change in nominal GDP in 2026. It is mitigated by the impact of implementing a temporary sectoral exemption from contributions to the Health Services Fund in 2026 and 2027 and by the impact of zero-rating specific food and hygiene products starting July 15, 2026.
(3) In 2027-2028, the growth in own-source revenue excluding revenue from government enterprises is primarily due to the 3.4% change in nominal GDP in 2027 and the impact of harmonization with the accelerated depreciation and expensing measures announced in the 2024 federal budget.
(4) The increases in revenue from government enterprises between 2026-2027 and 2028-2029 are mainly due to the increase in Hydro-Québec's results, stemming, in particular, from higher export volumes with the commissioning of infrastructure related to two major export contracts to the United States.
4.1.1 Own-source revenue excluding revenue from government enterprises
Own-source revenue excluding revenue from government enterprises consists mainly of tax revenue, including personal income tax, contributions for health services, corporate taxes, the school property tax, and consumption taxes.
— How it changes generally reflects change in economic activity in Québec and changes in the tax systems.
Own-source revenue also includes duties, permits and royalties, in particular, revenue from the carbon market, as well as miscellaneous revenue such as investment income, revenue from services rendered, and penalties, fines and recoveries.
Own-source revenue excluding revenue from government enterprises is expected to grow by 3.2% in 2026-2027. It will stand at 3.5% in 2027-2028 and 3.2% in 2028-2029.
TABLE 19
| Change in own-source revenue excluding revenue from government enterprises (millions of dollars, unless otherwise indicated) |
|||||||||||||||
| 2025-2026 | 2026-2027 | 2027-2028 | 2028-2029 | AAGR(1) | |||||||||||
| Tax revenue | |||||||||||||||
| Personal income tax | 48 969 | 50 942 | 52 841 | 54 861 | |||||||||||
| % change(2) | 7.2 | 4.0 | 3.7 | 3.8 | 3.9 | ||||||||||
| Contributions for health services | 9 304 | 9 538 | 9 876 | 10 327 | |||||||||||
| % change(3) | 5.1 | 2.5 | 3.5 | 4.6 | 3.5 | ||||||||||
| Corporate taxes | 14 599 | 14 698 | 15 252 | 15 240 | |||||||||||
| % change(4),(5),(6) | 9.4 | 0.7 | 3.8 | −0.1 | 1.4 | ||||||||||
| School property tax | 1 243 | 1 301 | 1 367 | 1 426 | |||||||||||
| % change | 3.9 | 4.7 | 5.1 | 4.3 | 4.7 | ||||||||||
| Consumption taxes | 29 639 | 30 682 | 31 632 | 32 416 | |||||||||||
| % change(7) | 4.4 | 3.5 | 3.1 | 2.5 | 3.0 | ||||||||||
| Subtotal | 103 754 | 107 161 | 110 968 | 114 270 | |||||||||||
| % change | 6.5 | 3.3 | 3.6 | 3.0 | 3.3 | ||||||||||
| Other revenue | |||||||||||||||
| Duties, permits and royalties | 6 708 | 6 484 | 6 928 | 7 278 | |||||||||||
| % change(8),(9) | 8.4 | −3.3 | 6.8 | 5.1 | 2.8 | ||||||||||
| Miscellaneous revenue | 14 922 | 15 790 | 16 110 | 16 744 | |||||||||||
| % change(10) | −8.2 | 5.8 | 2.0 | 3.9 | 3.9 | ||||||||||
| Subtotal | 21 630 | 22 274 | 23 038 | 24 022 | |||||||||||
| % change | −3.6 | 3.0 | 3.4 | 4.3 | 3.6 | ||||||||||
| TOTAL | 125 384 | 129 435 | 134 006 | 138 292 | |||||||||||
| % change | 4.6 | 3.2 | 3.5 | 3.2 | 3.3 | ||||||||||
(1) Average annual growth rate, corresponding to the geometric mean over three years, from 2026-2027 to 2028-2029.
(2) In 2025-2026, the growth in revenue from personal income tax is due to the 4.5% increase in wages and salaries in 2025 and to the impact of 2025 financial market performance on capital gains realized by taxpayers.
(3) In 2026-2027, the growth in contributions for health services is due to the 3.3% increase in wages and salaries in 2026 and the impact of implementing a temporary exemption from contributions to the Health Services Fund in 2026 and 2027 to support the agricultural, forestry and fishing sectors.
(4) In 2025-2026, the growth in revenue from corporate taxes is due to the 3.5% increase in the net operating surplus of corporations in 2025 and to the impact of 2025 financial market performance on capital gains realized by corporations.
(5) In 2026-2027, the growth in revenue from corporate taxes is due to the 1.9% increase in the net operating surplus of corporations in 2026 and the impact of harmonization with the expensing measures announced in the fall 2025 federal budget.
(6) In 2028-2029, the change in revenue from corporate taxes is due, in particular, to the 3.3% increase in the net operating surplus of corporations in 2028 and the impact of harmonization with the accelerated depreciation and expensing measures announced in the 2024 federal budget.
(7) In 2026-2027, the growth in consumption taxes is due to the 3.5% increase in household consumption, excluding food expenditures and shelter in 2026. It is mitigated by a return to normal input tax refunds, due to the recovery in the production pace of businesses, and the impact of zero-rating specific food and hygiene products starting July 15, 2026.
(8) In 2025-2026, the growth in revenue from duties, permits and royalties is due, in particular, to the expected increase in revenue from natural resources, mainly mining revenue, the effect of which is partially offset by the decline in revenue from the carbon market.
(9) In 2026-2027, the change in revenue from duties, permits and royalties is due, in particular, to the implementation of a temporary reduction in passenger vehicle registration fees and the non-recurrence of a portion of the higher mining revenue observed in 2025-2026.
(10) In 2025-2026, the change in miscellaneous revenue is due, in particular, to the non-recurrence of a significant portion of the amount of $1.7 billion received in 2024-2025 to offset smoking-related health costs under the plan of arrangement between tobacco companies and their creditors.
❏ Tax revenue
Revenue from personal income tax, the government's largest revenue source, will stand at $50.9 billion in 2026-2027, up 4.0% compared to 2025-2026. It will reach $52.8 billion in 2027-2028 and $54.9 billion in 2028-2029, representing a growth of 3.7% and 3.8% respectively.
— This growth reflects, among other things, the increase in household income, including wages and salaries, which will grow by 3.3% in 2026, 3.5% in 2027 and 3.3% in 2028.
— It also reflects the change in all the parameters of the personal income tax system, such as indexation and the progressive nature of the tax system.
Contributions for health services will stand at $9.5 billion in 2026-2027, $9.9 billion in 2027-2028 and $10.3 billion in 2028-2029, an increase of 2.5%, 3.5% and 4.6% respectively. Among other things, this change in contributions for health services reflects:
— the growth in wages and salaries, which is expected to stand at 3.3% in 2026, 3.5% in 2027 and 3.3% in 2028;
— the impact of implementing a temporary exemption from contributions to the Health Services Fund in 2026 and 2027 to support the agricultural, forestry and fishing sectors, which are essential to the vitality of the regions.
Corporate tax revenue will reach $14.7 billion in 2026-2027, which represents growth of 0.7% compared to 2025-2026. It will reach $15.3 billion in 2027-2028 and $15.2 billion in 2028-2029, a change of 3.8% and −0.1% respectively.
— This change is influenced by the projected change in the net operating surplus of corporations of 4.8% in 2026, 1.1% in 2027 and 3.3% in 2028.16
— The decrease in 2026-2027 is due, in particular, to the non-recurrence of some of the impact on corporate taxes resulting from the strong performance of gold mining companies in 2025.
— It also reflects the reduction in the tax rate for SMBs from 3.2% to 2.2%, effective April 30, 2026.17
— Harmonization with the accelerated depreciation measures announced by the federal government since the release of the 2024 budget has a downward effect on corporate tax revenue growth in 2026-2027 and 2028-2029.
_______________________________________
16 The change in revenue from corporate taxes also reflects the growth in total exports, which stands at 1.9% in 2026, 3.1% in 2027 and 3.4% in 2028.
17 This measure to ease the financial burden on SMBs was announced on April 29, 2026.
Revenue from the school property tax will stand at $1.3 billion in 2026-2027, up 4.7% compared to 2025-2026. It will reach $1.4 billion in 2027-2028 and $1.4 billion in 2028-2029, an increase of 5.1% and 4.3% respectively.
— This increase is influenced by changes in the amount for the funding of local needs, which considers the projected growth in the student population and in the cost of goods and services funded by the school property tax.
— It also reflects the impact of the additional contribution from the Québec government to limit the increase in school taxes to 3% on average for 2026-2027.
Consumption tax revenue will total $30.7 billion in 2026-2027, up 3.5% compared to 2025-2026. It will reach $31.6 billion in 2027-2028 and $32.4 billion in 2028-2029, a growth of 3.1% and 2.5% respectively.
The change in revenue from consumption taxes reflects, in particular:
— the increase in household consumption,18 which is expected to stand at 3.5% in 2026, 3.4% in 2027 and 3.1% in 2028;
— the change in residential construction investment, which is expected to stand at 3.1%
in 2026, 0.7% in 2027 and −0.6% in 2028;
— targeted zero-rating of certain food and hygiene products starting July 15, 2026;19
— the harmonization of the tax rate on insurance premiums and that of the Québec sales tax (QST) starting on January 1, 2027, announced in Budget 2025-2026.
_______________________________________
18 Household consumption excluding food expenditures and shelter.
19 This change to Québec's sales tax system was announced on May 25, 2026. It specifically targets ready-to-serve fruits and vegetables, certain single-serve products, toilet paper and tissues.
| Main Québec payroll deductions for employers | |||
|
In addition to the contribution to the Health Services Fund, employers with an establishment in Québec must pay various social security contributions on their employees' payroll intended for different plans and entities, including: — the Québec Pension Plan; — the Commission des normes, de l'équité, de la santé et de la sécurité du travail; — the Québec Parental Insurance Plan; — the Workforce Skills Development and Recognition Fund (WSDRF). In 2023, the main Québec payroll taxes levied on employers-excluding public administrations-totalled nearly $17 billion. — The effective WSDRF rate for subject non-public employers is 0.05%, while the statutory rate is 1%.1 Main Québec payroll deductions for employers - 2023 |
|||
| Contribution | Effective rate | ||
| $million | % | % | |
| Payroll tax | |||
| - Health Services Fund | 6 741 | 40.2 | 3.40 |
| Social security contributions | |||
| - Québec Pension Plan | 8 740 | 52.1 | 4.40 |
| - Québec Parental Insurance Plan | 1 137 | 6.8 | 0.57 |
| - Commission des normes, de l'équité, de la santé et de la sécurité du travail |
87 | 0.5 | 0.06 |
| - Workforce Skills Development and Recognition Fund | 67 | 0.4 | 0.05 |
| TOTAL | 16 773 | 100.0 | 8.49 |
| Note: Estimates based on payroll deductions and employer contributions in Québec for the year 2023. Public administrations are excluded. | |||
1 Only employers whose payroll exceeds $2 million and who allocate an amount representing less than 1% of their payroll to eligible training expenditures are required to contribute to the WSDRF.
❏ Other revenue
Revenue from duties, permits and royalties20 will total $6.5 billion in 2026-2027, a change of −3.3% compared to 2025-2026. It will reach $6.9 billion in 2027-2028 and $7.3 billion in 2028-2029, a growth of 6.8% and 5.1% respectively. The change in revenue from duties, permits and royalties is due to:
— a −12.7% change in revenue from natural resources in 2026-2027, given the non-recurrence of a portion of the higher mining revenue observed in 2025-2026. Subsequently, revenue from natural resources will increase by 2.7% and 1.8%, respectively, in 2027-2028 and 2028-2029;
— revenue growth in the carbon market, given the expected rise in prices, due, in particular, to the decrease in the number of available units;
— the initiative to grant a $50 reduction in registration fees for passenger vehicles.21
Miscellaneous revenue22 will stand at $15.8 billion in 2026-2027, which represents growth of 5.8% compared to 2025-2026. It will reach $16.1 billion in 2027-2028 and $16.7 billion in 2028-2029, which represents an increase of 2.0% and 3.9% respectively.
The change in miscellaneous revenue reflects, in particular:
— the growth in investment income of the Generations Fund;
— the change in anticipated revenue of special funds, non-budget-funded bodies, and bodies in the education and higher education networks.
— For example, the growth in the revenue of the higher education networks is influenced by, among other things, the change in clientele.
❏ Assumptions, risks and sensitivity analysis for own-source revenue
■ Assumptions
The own-source revenue forecasts excluding revenue from government enterprises is based on a number of assumptions, data elements and forecast models that take into account the economic outlook established by the Ministère des Finances.
These models reflect the relations between a revenue source and its key economic determinants. For example:
— the personal income tax estimate is closely tied to changes in wages and salaries, employment insurance, pension income, self-employed income, capital gains and interest income;
— contributions for health services forecasts are directly affected by changes in wages and salaries;
— the corporate taxes estimate depends in large part on changes in the net operating surplus of corporations and total exports;
_______________________________________
20 The detail of revenues from duties, permits and royalties is presented in Appendix 1.
21 This initiative, announced on May 25, 2026, is intended to help Quebecers cope with the rising cost of gasoline due to the conflict in the Middle East.
22 The detail of miscellaneous revenue is presented in Appendix 1.
— the QST forecasts hinge primarily on the growth outlook for household consumption (excluding food expenditures and shelter) and residential investment;
— the specific taxes (fuel, tobacco products and alcoholic beverages) estimate reflects changes in the CPI and various economic indicators, such as gas prices and per capita household disposable income.
In addition, the own-source revenue forecasts rely on the most recent data available during the establishment of the financial framework, such as Revenu Québec data from tax returns and tax bases.
Estimates take into account the existing tax system and the anticipated financial impact of the fiscal measures and budgetary initiatives announced by the Québec government since the release of the March 2026 budget.
■ Risks
The forecasts carry a level of risk and uncertainty, given that they are based on assumptions concerning future events, in particular changes in the economic situation.
For example, the forecast for corporate tax revenue is marked by a considerable level of uncertainty owing to a combination of several economic, decision-making and administrative factors, which may lead to a different change in revenue, such as:
— the legal framework allowing businesses to make tax-related choices, in particular the use of deferred losses;
— the possibility of adjusting installment payments over the course of the year;
— the deadline for filing and processing tax returns, which affects the recognition of corporate taxes;
— the evolution of the results of tax audit activities.
Moreover, several risks continue to weigh on own-source revenue forecasts. For example:
— developments in the trade dispute with the United States. Reduced tariffs could further stimulate economic growth and thus lead to higher-than-expected own-source revenue. However, an increase in duties would have the opposite effect;
— inflationary pressures, stemming from tensions in the Middle East, could have a greater-than-expected impact on commodity prices and affect both household purchasing power and businesses' production costs. Such a development would pose a risk to revenue forecasts for consumption taxes and corporate taxes;
— a demographic trend that differs from the one expected over the next few years could, for example, alter the path of household consumption expenditure, which would affect own-source revenue forecasts. Population decline could lead to a tightening of the labour pool, which would limit job creation and put downward pressure on the unemployment rate.
■ Sensitivity analysis
In general, the nominal GDP forecast is a good indicator of growth in own-source revenue, given the direct link between tax bases and nominal GDP.
— The Ministère des Finances estimates that a change of 1 percentage point in nominal GDP has an impact of approximately $1.2 billion on the government's own-source revenue.
This sensitivity analysis is based on an adjustment of each taxable base in proportion to the adjustment of nominal GDP.
— In reality, different developments in economic growth and the geopolitical context can have a greater impact on certain variables, affecting some tax bases more than others.
The sensitivity analyses set an average historical relationship between the change in own-source revenue and growth in nominal GDP. However, although this relationship remains generally reliable, it may not be confirmed for a specific period due to exceptional events or particular economic circumstances.
— Indeed, economic fluctuations may have different impacts on revenue because of changes in the behaviour of economic agents.
— In these situations, the change in own-source revenue can be higher or lower compared to the change in nominal GDP.
TABLE 20
Sensitivity of own-source revenue excluding revenue from government enterprises to major economic variables
| Variables | Growth forecasts for 2026 |
Impacts for fiscal 2026-2027 |
| Nominal GDP | 3.4% | A variation of 1 percentage point changes own-source revenue(1) by approximately $1.2 billion. |
| Wages and salaries | 3.3% | A variation of 1 percentage point changes personal income tax revenue by approximately $500 million. |
| Employment insurance | 12.4% | A variation of 1 percentage point changes personal income tax revenue by approximately $10 million. |
| Pension income | 4.5% | A variation of 1 percentage point changes personal income tax revenue by approximately $70 million. |
| Net operating surplus of corporations | 4.8% | A variation of 1 percentage point changes corporate tax revenue by approximately $70 million. |
| Consumption excluding food expenditures and shelter | 3.5% | A variation of 1 percentage point changes QST revenue by approximately $240 million. |
| Residential investment | 3.1% | A variation of 1 percentage point changes QST revenue by approximately $50 million. |
| (1) Own-source revenue excluding revenue from government enterprises. | ||
4.1.2 Revenue from government enterprises
Government enterprises consist of commercial corporations held by the government, which have managerial autonomy and are financially self-sufficient. The revenue from government enterprises corresponds in large part to the net earnings of these corporations.
This revenue will stand at $5.9 billion in 2026-2027, up 12.7%, to $6.2 billion in 2027-2028, representing a 5.1% increase, and at $6.9 billion in 2028-2029, representing an 11.3% increase.
This growth is mainly due to the increase in Hydro-Québec's results, stemming, in particular, from higher export volumes with the commissioning of infrastructure related to two major contracts for the sale of electricity to the United States.
— Growth in 2028-2029 is also linked to Loto-Québec's improved financial results, due, in particular, to its capturing more of the online gaming sector market and the optimization of its real estate portfolio.
TABLE 21
| Change in revenue from government enterprises (millions of dollars, unless otherwise indicated) |
|||||||||||||||
| 2025-2026 | 2026-2027 | 2027-2028 | 2028-2029 | AAGR(1) | |||||||||||
| Hydro-Québec | 1 818 | 2 525 | 2 685 | 3 114 | |||||||||||
| Loto-Québec | 1 523 | 1 557 | 1 643 | 1 822 | |||||||||||
| Société des alcools du Québec | 1 389 | 1 399 | 1 382 | 1 414 | |||||||||||
| Investissement Québec | 367 | 280 | 344 | 381 | |||||||||||
| Société québécoise du cannabis(2) | 132 | 146 | 147 | 160 | |||||||||||
| Other(3) | 12 | 1 | 7 | 18 | |||||||||||
| TOTAL | 5 241 | 5 908 | 6 208 | 6 909 | |||||||||||
| % change | -7.9 | 12.7 | 5.1 | 11.3 | 9.6 | ||||||||||
(1) Average annual growth rate, corresponding to the geometric mean over three years, from 2026-2027 to 2028-2029.
(2) Revenue is allocated to the Fund to Combat Addiction.
(3) The other government enterprises are the Société ferroviaire et portuaire de Pointe-Noire S.E.C., Capital Financière agricole inc., the Fonds d'investissement Eurêka S.E.C., the Fonds Impulsion S.E.C. and the Société du parc industriel et portuaire de Bécancour.
❏ Assumptions, risks and sensitivity analysis for government enterprises
■ Assumptions
Forecasts for revenue from government enterprises vary mainly depending on the context in which each enterprise operates.
— Hydro-Québec considers, in particular, normal winter temperatures and prices on external markets to determine its forecasts.
— Revenue from Loto-Québec, the Société des alcools du Québec and the Société québécoise du cannabis is estimated, in particular, according to the consumption habits of their customers.
— Revenue from Investissement Québec depends on economic conditions and the anticipated returns from various investment projects.
■ Risks
The forecasts of government enterprises depend on the information available when they are produced. As a result, updating information may have an impact on forecasts.
In addition, it should be noted that certain assumptions, such as weather conditions and runoff, are hard to forecast.
❏ Sensitivity analysis
For Hydro-Québec, a variation of:
— 1.0 ¢US/kWh in the price of energy on foreign markets changes its annual net earnings by $97 million;
— 1 °C in winter temperatures compared to normal temperatures changes its net earnings by $25 million.
For Loto-Québec, a 1% variation in sales changes its net earnings by $15 million.
For the Société des alcools du Québec, a 1% variation in sales changes its net earnings by $16 million.
For Investissement Québec, a variation of 1 percentage point in interest rates changes its net earnings by $8 million.
For the Société québécoise du cannabis, a 1% variation in sales changes its net earnings by $3 million.
|
Agreement regarding Churchill Falls |
|
In December 2024, Québec and Newfoundland and Labrador signed an agreement in principle for the generation of hydroelectricity by the Churchill Falls power plant in Labrador, which currently supplies approximately 15% of the electricity consumed in Québec. — Under this agreement, the contract, which was set to expire in 2041, would thus be extended until 2075. This partnership would generate an increase in short-term value for Newfoundland and Labrador while also contributing significantly to its energy security, in exchange for a competitive price paid by Québec after 2041. — Hydro-Québec would make payments to Churchill Falls (Labrador) Corporation with a present value of $33.8 billion over the period from 2025 to 2075. Hydro-Québec owns 34.2% of this corporation. — Under the agreement, the average price paid for electricity generated at Churchill Falls would be approximately 6 cents per kilowatt-hour (cents/kWh). As a shareholder in the power plant, Hydro-Québec would use the revenue from its stake to reduce the impact on its customers to 4 cents/kWh. — In addition to guaranteeing a competitive price until 2075, this agreement would add 2 400 megawatts of capacity, a 50% increase over Churchill Falls' current capacity, thanks in large part to the construction of the Gull Island hydroelectric power plant. In December 2025, the government of Newfoundland and Labrador established an independent committee tasked with assessing whether the memorandum of understanding truly served the province's long-term interests. Following the release of the committee's report, the government of Newfoundland and Labrador indicated that it wanted to renegotiate certain key elements of the agreement before giving its final approval. — Since then, the Newfoundland and Labrador and Québec governments have been continuing negotiations to amend this agreement so that it serves both parties' interests. The revenue from Hydro-Québec presented in the Pre-election Report on the State of Québec's Public Finances - August 2026 includes the financial impacts based on the agreement in principle reached in December 2024, which implies a decrease in revenue from Hydro-Québec of nearly $1 billion by 2028-2029. — The impacts associated with the Gull Island power plant are not included in the financial framework, as the plant is scheduled to be commissioned in 2035. — Should a new agreement in principle be reached, the Hydro-Québec revenue forecasts presented in the pre-election report could have to be reviewed and incorporated into the financial framework once the agreement has been approved by both governments. |
4.1.3 Federal transfers
Revenue from federal transfers is expected to increase by 10.9% in 2026-2027 and 2.9% in 2027-2028. Growth in 2026-2027 is due in particular to the minimal 5.0% increase in the Canada Health Transfer (CHT) at the national level and the federal government's March 2026 announcement of one-time funds allocated to the provinces to boost the housing supply. In June 2026, the federal government also announced additional funding for the provinces for childcare services for two years: 2026-2027 and 2027-2028.
Equalization revenue will increase across the entire period due to the increase in the envelope across Canada, which grows in line with Canadian nominal GDP.
A decrease in revenue from other programs is also expected, beginning in 2027-2028, due to the discontinuation of certain grants from the federal government, including those resulting from the agreement on the Housing Accelerator Fund, signed in 2023.
TABLE 22
| Change in federal transfers (millions of dollars, unless otherwise indicated) |
|||||||||||||||
| 2025-2026 | 2026-2027 | 2027-2028 | 2028-2029 | AAGR(1) | |||||||||||
| Equalization | 13 567 | 13 907 | 14 968 | 15 135 | |||||||||||
| % change | 1.9 | 2.5 | 7.6 | 1.1 | 3.7 | ||||||||||
| Health transfers | 8 444 | 9 107 | 9 255 | 9 403 | |||||||||||
| % change | 0.1 | 7.9 | 1.6 | 1.6 | 3.7 | ||||||||||
| Transfers for post-secondary education and other social programs | 1 168 | 1 292 | 1 297 | 1 301 | |||||||||||
| % change | −13.5 | 10.6 | 0.4 | 0.3 | 3.7 | ||||||||||
| Other programs(2) | 6 624 | 8 740 | 8 491 | 7 804 | |||||||||||
| % change | −10.5 | 31.9 | −2.8 | −8.1 | 5.6 | ||||||||||
| TOTAL | 29 803 | 33 046 | 34 011 | 33 643 | |||||||||||
| % change | −2.3 | 10.9 | 2.9 | −1.1 | 4.1 | ||||||||||
(1) Average annual growth rate, corresponding to the geometric mean over three years, from 2026-2027 to 2028-2029.
(2) Other programs include revenue from transfers under Canada-Québec agreements, in particular the Canada-Québec immigration agreement, the early learning and childcare agreement, labour market transfer agreements, as well as the compensation Québec receives related to the Canada Student Financial Assistance Program and revenue from federal transfers related to housing and infrastructure agreements.
The share of federal transfers in Québec's total revenue is projected to decrease by 2030-2031. This share is expected to decrease, falling from 19.6% in 2026-2027 to 17.9% in 2030-2031.
| CHART 12 Federal transfers as a percentage of Québec's total revenue |
| (per cent) |
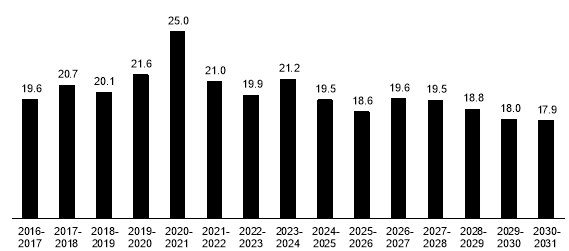 |
| A decrease in Québec's share of the equalization envelope |
| Québec's share of the equalization envelope has been decreasing since 2020-2021, particularly due to Québec's improved economic situation in comparison with the rest of Canada. Québec's share of the equalization envelope, which peaked at 66.2% in 2019-2020, is expected to decline to 49.5% in 2030-2031. |
| Expected change in Québec's share of the equalization envelope |
| (per cent) |
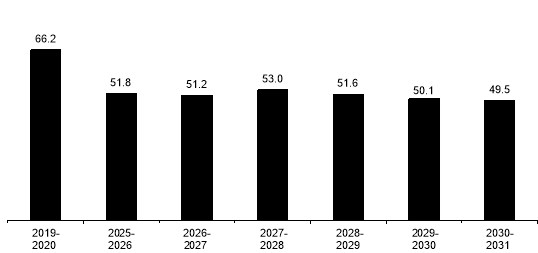 |
|
Note: A smoothing mechanism with lag is applied to determine equalization payments. For example, the equalization payments for the provinces for 2026-2027 are based on data for 2022-2023 (25%), 2023-2024 (25%) and 2024-2025 (50%). Sources: Department of Finance Canada and Ministère des Finances du Québec. |
❏ Assumptions, risks and sensitivity analysis for federal transfers
■ Assumptions
Revenue from federal transfers consists of federal government revenue paid to Québec under the Federal-Provincial Fiscal Arrangements Act, to which is added revenue from other programs under bilateral agreements.
It mainly includes equalization revenue and revenue from the CHT and the Canada Social Transfer (CST).
Moreover, the main risks associated with the forecasts for revenue from the CHT and the CST concern the estimation of the value of the special Québec abatement and of the population of the provinces and territories.
■ Equalization
The equalization program is intended to make up the differences in the fiscal capacity of the provinces in relation to the average for the 10 provinces, thereby enabling the equalization-receiving provinces to offer public services at reasonably comparable levels of quality and taxation.
— Since 2009-2010, the equalization envelope no longer corresponds to differences in fiscal capacity because it grows at the same pace as Canada's nominal GDP.
The calculation of equalization payments is based on the per capita fiscal capacity of a province, which is defined as the revenue that the province would obtain if it applied the average tax rates in effect in the 10 provinces to its own tax bases.
— To establish Québec's payments, the fiscal capacity of each of the provinces, based on economic and fiscal data, must be considered.
■ Canada Health Transfer and Canada Social Transfer
Health transfers consist primarily of revenue from the CHT. They also include revenue from bilateral health agreements. These agreements are fixed in duration.
Transfers for post-secondary education and other social programs are determined according to revenue from the CST.23
— The CHT envelope at the national level grows in line with Canada's nominal GDP, subject to a 5% floor through 2027-2028, which will decrease to 3% starting in 2028-2029, while the CST envelope grows by 3% per year.
— These budgets are distributed based on population size.
■ Other programs
Revenue from other programs stems, for the most part, from agreements with the federal government that have different objectives, such as the integration of immigrants, labour market agreements, and infrastructure agreements (see details in Appendix 2).
_______________________________________
23 Québec's CHT and CST revenues are deducted from a portion of the value of the special Québec abatement.
■ Risks
■ Equalization
The main risk with respect to equalization forecasts concerns the estimation of the fiscal capacity of each of the provinces, since the federal government does not release forecasts for equalization payments by province.
The federal government publishes only the equalization payments of each of the provinces for the current year and a five-year projection of the overall equalization envelope.
Provinces receiving equalization must therefore make their own equalization revenue forecast using a detailed formula.
— In particular, estimating Québec's equalization revenue involves forecasting the fiscal capacity of each of the provinces, which requires many variables to be taken into account, such as the basic federal tax (BFT) for the personal income tax base and the net operating surplus for the corporate income tax base.
— The equalization program is reviewed every five years. A review can result in changes to the equalization formula.
■ Canada Health Transfer and Canada Social Transfer
The main risks with respect to forecasting CHT and CST revenues concern the estimation of the value of the special Québec abatement, which is based on Québec's economic variables and the impact of any fiscal changes to the BFT by the federal government, and on the estimated population of the provinces and territories.
■ Sensitivity analysis
Equalization, CHT and CST revenue forecasts are primarily based on the following economic and demographic variables:
— Canada's nominal GDP;
— wages and salaries used in the forecast for basic federal income tax;
— the net operating surplus of corporations used in the forecast for taxable corporate income;
— Québec's share of the population among the provinces as a whole.
Sensitivity analyses may not apply for a specific year because of special economic conditions or changes by the federal government to the operation of equalization, the CHT or the CST.
Moreover, the sensitivity analysis of equalization revenue is based on an increase of 1 percentage point in the growth of Québec's economic variables, without any impact on growth of those variables in the other provinces.
| TABLE 23 Sensitivity of federal transfer revenue to major economic and demographic variables |
||
| Variables | Forecasts for 2026 | Impacts for fiscal 2026-2027 |
| Growth in Canada's nominal GDP | 4.5% | An increase of 1 percentage point raises equalization revenue(1) by approximately $30 million. |
| Growth in wages and salaries in Québec | 3.3% | An increase of 1 percentage point reduces equalization revenue(2) by approximately $120 million. |
| An increase of 1 percentage point reduces CHT and CST revenues by approximately $60 million. |
||
| Growth in the net operating surplus of corporations in Québec |
4.8% | An increase of 1 percentage point reduces equalization revenue(2) by approximately $20 million. |
| Québec's share of the population in Canada | 21.7% | An increase of 0.1 percentage points increases equalization revenue(2) by approximately $180 million. |
| An increase of 0.1 percentage points raises CHT and CST revenues by approximately $75 million. | ||
(1) The equalization envelope for 2026-2027 was determined in December 2025 by the federal government and will not be adjusted. Increased growth in 2026 would have an impact as of 2027-2028.
(2) Due to the two-year lag in the equalization formula, increased growth in 2026 would have an impact as of 2028-2029. The impact of this increase for 2026-2027 and 2027-2028 would be nil.
4.2 Change in expenditure
Expenditure consists, on the one hand, of portfolio expenditures tied to the delivery of public services, which are influenced mainly by demographics and prices and, on the other hand, debt service, which is mainly driven by the debt level and interest rates.
Expenditure totals $171.6 billion in 2026-2027, with $161.1 billion in portfolio expenditures and $10.5 billion in debt service.
— It will stand at $175.9 billion in 2027-2028 and $178.1 billion in 2028-2029.
The growth in portfolio expenditures stands at:
— 3.4% in 2026-2027, reflecting the expected increase in costs associated with the delivery of government services as well as the introduction of new initiatives, including the one-time energy and grocery payment;
— 2.5% in 2027-2028, reflecting the expected increase in costs associated with the optimized delivery of government services and increased investments for infrastructure belonging to third parties, offset by the impact of the one-time energy and grocery payment in 2026-2027;
— 1.0% in 2028-2029, due, in particular, to the stabilization of investments for infrastructure belonging to third parties, by initiatives stemming from the expenditure review and the expiration of funding for certain initiatives.
Debt service represents approximately 6% of the government's overall expenditure.
From 2026-2027 to 2028-2029, the annual growth in expenditure will reach 2.4% on average.
TABLE 24
Change in expenditure
| (millions of dollars, unless otherwise indicated) | |||||||||||||||
| 2025-2026 | 2026-2027 | 2027-2028 | 2028-2029 | AAGR(1) | |||||||||||
| Portfolio expenditures | 155 782 | 161 081 | 165 049 | 166 666 | |||||||||||
| % change(2) | 3.0 | 3.4 | 2.5 | 1.0 | 2.3 | ||||||||||
| Debt service | 10 148 | 10 516 | 10 870 | 11 402 | |||||||||||
| % change | 1.8 | 3.6 | 3.4 | 4.9 | 4.0 | ||||||||||
| TOTAL | 165 930 | 171 597 | 175 919 | 178 068 | |||||||||||
| % change | 2.9 | 3.4 | 2.5 | 1.2 | 2.4 | ||||||||||
(1) Average annual growth rate, corresponding to the geometric mean over three years, from 2026-2027 to 2028-2029.
(2) Growth in 2028-2029 is affected by the impact of stabilizing investments for infrastructure belonging to third parties and by measures resulting from the expenditure review. Excluding these elements, growth would be 2.2%.
4.2.1 Portfolio expenditures
To achieve its objectives and carry out its activities, the government sets up programs that are administered by government entities, including departments and bodies. The set of entities under the responsibility of a minister constitutes a portfolio.[24],[25]
TABLE 25
| Change in portfolio expenditures (millions of dollars, unless otherwise indicated) |
|||||||||||||||
| 2025-2026 | 2026-2027 | 2027-2028 | 2028-2029 | AAGR(1) | |||||||||||
| Santé et Services sociaux | 65 945 | 69 991 | 72 744 | 75 389 | |||||||||||
| % change(2) | 2.7 | 6.1 | 3.9 | 3.6 | 4.6 | ||||||||||
| Éducation | 23 541 | 24 411 | 25 068 | 25 561 | |||||||||||
| % change(3) | 0.8 | 3.7 | 2.7 | 2.0 | 2.8 | ||||||||||
| Enseignement supérieur | 11 183 | 11 847 | 12 339 | 12 588 | |||||||||||
| % change(4) | −1.8 | 5.9 | 4.2 | 2.0 | 4.0 | ||||||||||
| Famille | 9 633 | 10 067 | 10 282 | 10 238 | |||||||||||
| % change(5) | 6.9 | 4.5 | 2.1 | −0.4 | 2.1 | ||||||||||
| Transports et Mobilité durable | 9 176 | 7 869 | 8 843 | 8 516 | |||||||||||
| % change(6) | 19.4 | −14.2 | 12.4 | −3.7 | −2.5 | ||||||||||
| Emploi et Solidarité sociale | 5 811 | 6 358 | 5 939 | 5 808 | |||||||||||
| % change(7) | 1.8 | 9.4 | −6.6 | −2.2 | −0.0 | ||||||||||
| Affaires municipales et Habitation | 5 253 | 5 863 | 5 442 | 4 794 | |||||||||||
| % change(8) | 5.0 | 11.6 | −7.2 | −11.9 | −3.0 | ||||||||||
| Économie, Innovation et Énergie | 4 365 | 4 506 | 4 165 | 3 566 | |||||||||||
| % change(9) | −8.5 | 3.2 | −7.6 | −14.4 | −6.5 | ||||||||||
| Environnement, Lutte contre les changements climatiques, Faune et Parcs | 1 802 | 1 979 | 2 168 | 2 131 | |||||||||||
| % change(10) | −17.4 | 9.8 | 9.6 | −1.7 | 5.7 | ||||||||||
| Other portfolios | 19 073 | 18 790 | 18 659 | 18 675 | |||||||||||
| % change(11) | 6.1 | −1.5 | −0.7 | 0.1 | −0.7 | ||||||||||
| Reallocation of expenditures during the fiscal year(12) |
- | −600 | −600 | −600 | |||||||||||
| TOTAL | 155 782 | 161 081 | 165 049 | 166 666 | |||||||||||
| % change | 3.0 | 3.4 | 2.5 | 1.0 | 2.3 | ||||||||||
_______________________________________
24 The budgetary structure of forecasts in the pre-election report does not take into account changes resulting from the April 2026 cabinet shuffle, with the exception of the change concerning the Ministère de la Sécurité publique, which became the Ministère de la Sécurité intérieure.
25 Expenditures for all portfolios are presented in Appendix 3. The entities in each departmental portfolio are presented in Appendix 4.
TABLE 25
Change in portfolio expenditures (cont.)
(1) Average annual growth rate, corresponding to the geometric mean over three years, from 2026-2027 to 2028-2029.
(2) The portfolio growth reflects the expected rise in costs, due, in particular, to the agreements reached with the doctors' federations, while the arrival of Santé Québec is intended to modernize the governance of the health and social services network, in particular by optimizing the management of its activities through efficiency gains.
(3) The average annual growth in expenditures from 2026-2027 to 2028-2029 reflects the expected increase in costs associated with service delivery in the education sector, which takes into account, in particular, changes in the indexation provisions set forth in staff collective bargaining agreements and the projected decrease in the population aged 5 to 16.
(4) In 2026-2027 and 2027-2028, expenditure growth is primarily due to the rise in the number of students attending higher education institutions, and, in 2027-2028, an increase in infrastructure investments for chartered universities, mitigated by the gradual phasing out of the Perspective Québec scholarship program. In 2028-2029, expenditure growth is primarily due to the stabilization of infrastructure investments for chartered universities, following a sharp rise until 2027-2028.
(5) In 2026-2027, expenditure growth reflects, in particular, the increase in costs for the delivery of educational childcare services, and for funding new subsidized childcare spaces as part of the initiatives in the action plan for completing the educational childcare services network, the Grand chantier pour les familles. The changes in expenditures in 2027-2028 and 2028-2029 are primarily due to reduced investments in educational childcare services infrastructure-for which significant investments have been made in recent years-and to a decline in the population under the age of 18.
(6) In 2026-2027, the change in expenditures is primarily due to advance payments in 2025-2026 for public transit infrastructure projects, namely the extension of the Montréal metro blue line and Québec City's strategic public transit system, and for the assistance program for public transit development. In 2027-2028 and 2028-2029, the changes in expenditures are primarily due to the pace of infrastructure investments, in particular for public transit projects.
(7) In 2026-2027, expenditure growth is primarily due to the one-time special payment for groceries and energy. In 2027-2028 and 2028-2029, the changes in expenditures are related, among other things, to the completion of certain initiatives, the implementation of optimization measures, and-for 2027-2028-the impact of the one-time special payment for groceries and energy in 2026-2027. Excluding the one-time special payment for groceries and energy in 2026-2027, the change in expenditures for 2027-2028 is −1.4%.
(8) In 2026-2027, the change in expenditures is due, in particular, to the introduction of the refundable tax credit for home ownership, the announced funding for the maintenance of water infrastructure for municipalities, and increased expenditures under the Québec affordable housing program. In 2027-2028 and 2028-2029, the changes in expenditures are primarily due to expenditures on housing, in particular the planned sequence for building units under the AccèsLogis Program, units planned under the Québec affordable housing program, those completed in partnership with tax-advantaged funds, and those planned under the low-rental housing renovation program, as well as expenditures stemming from the non-profit housing program and, for 2028-2029, those under the Shelter Allowance Program.
(9) In 2026-2027, the change in expenditures reflects the expected increase in costs associated with funding economic development projects. In 2027-2028, the change in expenditures is primarily due to the end of the two-year initiatives announced in Budget 2025-2026 to help businesses cope with U.S. tariffs. In 2028-2029, the change in expenditures is primarily due to a significant decrease in the financial impacts of currently planned government financial interventions and to certain initiatives that will end in 2027-2028.
(10) In 2026-2027, expenditure growth results from lower-than-expected expenditures in 2025-2026 under the Electrification and Climate Change Fund, in particular under the Roulez vert program, as well as the addition of initiatives in 2026-2027 such as the expansion of the LogisVert Program and the implementation of Rénoclimat - Adaptation announced in the March 2026 budget. In 2027-2028, expenditure growth is due, in particular, to the increase in expenditures under the 2030 Plan for a Green Economy, resulting from the expected increase in revenue from the carbon market. In 2028-2029, the change in expenditures is due, in particular, to the end of the action plan related to the 2030 Nature Plan and the reduction in Blue Fund expenditures.
(11) In 2026-2027, the change in expenditures is due in particular to the impact of non-recurring adjustments of provisions for litigation in 2025-2026 as well as the decrease in bad tax debts. This change is mitigated in particular by targeted assistance for the forestry sector and for the costs associated with the general election in October 2026. In 2027-2028 and 2028-2029, changes in expenditures are attributable to reduced funding for certain initiatives, most of which are expiring, as well as the stabilization of investments for infrastructure belonging to third parties, the initiatives stemming from the expenditure review, and, for 2027-2028, the impact of expenditures in 2026-2027 related to the general election in October 2026. These changes are partially offset by increased expenditures on local infrastructure funded by federal transfers.
(12) Spending management gives the government the leeway needed to invest in priority sectors. By rigorously monitoring the budgetary envelopes allocated to departments and bodies, the government promotes compliance with the objectives set and allows budgetary resources of approximately 1% of program expenditures to be made available and reallocated during the fiscal year. Based on the reinvestments seen in recent years, the 2026 pre-election report provides a reallocation of $600 million in government expenditures for each year. These reallocations correspond in part to the leeway projected for these fiscal years and help maintain the level of services to the public.
❏ Santé et Services sociaux
The expenditures of the Santé et Services sociaux portfolio primarily cover the activities of Santé Québec, which coordinates the operations of the Québec health and social services network, as well as programs administered by the Régie de l'assurance maladie du Québec. They also cover those of other government bodies, such as Héma-Québec and Urgences-santé.
These expenditures are influenced in particular by demographics, the delivery of care and services, remuneration, and technological developments.
The expenditure growth of 6.1% in 2026-2027, 3.9% in 2027-2028 and 3.6% in 2028-2029 reflects the expected rise in costs, due, in particular, to the agreements reached with the doctors' federations, while the arrival of Santé Québec is intended to modernize the governance of the health and social services network by, in particular, optimizing management of its activities through efficiency gains, ensuring that every dollar invested generates better delivery of care and services.
❏ Éducation
Expenditures in the Éducation portfolio are primarily directed to the activities of pre-school, elementary and secondary educational institutions. This portfolio also includes programs to promote sports and recreation and to manage national parks.
In general, this portfolio's expenditures vary according to the change in clientele and the remuneration of personnel of the school service centres and school boards.
The average annual growth in expenditures of 2.8% from 2026-2027 to 2028-2029 reflects the expected increase in costs associated with service delivery in the education sector, which takes into account, in particular, changes in the indexation provisions set forth in staff collective bargaining agreements and the projected decrease in the population aged 5 to 16.
❏ Enseignement supérieur
The expenditures of the Enseignement supérieur portfolio are mainly devoted to the activities of college and university educational institutions. This portfolio also includes student financial assistance. In general, this portfolio's expenditures vary according to changes in clientele and in the remuneration of college and university network personnel, as well as changes in infrastructure investments for chartered universities.
The expenditure growth of 5.9% in 2026-2027 and 4.2% in 2027-2028 is primarily due to the rise in the number of students attending higher education institutions, and, for 2027-2028, an increase in infrastructure investments for chartered universities, mitigated by the gradual phasing out of the Perspective Québec scholarship program.
— Excluding the impact of the phased-out Perspective Québec scholarship program, expenditure growth stands at 6.7% in 2026-2027.
For 2028-2029, the expenditure growth of 2.0% is primarily due to the stabilization of infrastructure investments, following a sharp rise until 2027-2028.
❏ Famille
The expenditures of the Famille portfolio primarily include funding for educational childcare services and financial assistance for families.
In 2026-2027, expenditure growth of 4.5% reflects, in particular, the increase in costs for the delivery of educational childcare services, and for funding new subsidized childcare spaces as part of the initiatives in the action plan for completing the educational childcare services network, the Grand chantier pour les familles.
The changes in expenditures of 2.1% in 2027-2028 and −0.4% in 2028-2029 are primarily due to reduced investments in educational childcare services infrastructure, for which significant investments have been made in recent years, and to a decline in the population under the age of 18.
❏ Transports et Mobilité durable
The expenditures of the Transports et Mobilité durable portfolio primarily include the construction, maintenance and operation of road infrastructure as well as the funding of public transit services. They also include the management of the government's rolling stock, air fleet and ferry services.
The change in expenditures of −14.2% in 2026-2027 is primarily due to advance payments in 2025-2026 for public transit infrastructure projects, namely the extension of the Montréal metro blue line and Québec City's strategic public transit system, and for the assistance program for public transit development.
In 2027-2028 and 2028-2029, the changes in expenditures of 12.4% and −3.7%, respectively, are primarily due to the pace of infrastructure investments, in particular for public transit projects.
❏ Emploi et Solidarité sociale
The expenditures of the Emploi et Solidarité sociale portfolio mainly include financial assistance programs for individuals, including last resort financial assistance and employment assistance programs. They also include the activities of Services Québec, the Directeur de l'état civil and the Registraire des entreprises.
The expenditure growth of 9.4% in 2026-2027 is primarily due to the one-time special payment for groceries and energy.
In 2027-2028 and 2028-2029, the changes in expenditures of −6.6% and −2.2% are due, among other things, to the completion of certain initiatives, the implementation of budget optimization measures, and, for 2027-2028, the impact of the one-time special payment for groceries and energy in 2026-2027.
— Excluding the one-time special payment for groceries and energy in 2026-2027, the change in expenditures for 2027-2028 is −1.4%.
❏ Affaires municipales et Habitation
The expenditures of the Affaires municipales et Habitation portfolio primarily consist of financial support for municipalities, in particular for infrastructure, social housing and compensations in lieu of taxes, as well as initiatives related to the development of the regions, the Capitale-Nationale and the metropolitan area.
In 2026-2027, the 11.6% change in expenditures is due, in particular, to the introduction of the refundable tax credit for home ownership, the announced funding for the maintenance of water infrastructure for municipalities, and increased expenditures in the Québec affordable housing program.
In 2027-2028 and 2028-2029, the changes in expenditures of −7.2% and −11.9%, are primarily due to expenditures on housing, in particular the planned sequence for building units under the AccèsLogis Program, units planned under the Québec affordable housing program, those completed in partnership with tax-advantaged funds, and those planned under the low-rental housing renovation program, as well as expenditures stemming from the non-profit housing program and, for 2028-2029, those under the Shelter Allowance Program.
❏ Économie, Innovation et Énergie
The expenditures of the Économie, Innovation et Énergie portfolio are mainly devoted to the funding of economic development projects and support for research, innovation and development of energy resources. They also cover youth programs.
In 2026-2027, the change in expenditures of 3.2% reflects the expected increase in costs associated with funding economic development projects.
In 2027-2028, the −7.6% change is primarily due to the end of the two-year initiatives announced in Budget 2025-2026 to help businesses cope with U.S. tariffs.
In 2028-2029, the change in expenditures of −14.4% is primarily due to a significant decrease in the financial impacts of currently planned government financial interventions and to certain initiatives that will end in 2027-2028.
❏ Environnement, Lutte contre les changements climatiques, Faune et Parcs
The expenditures of the Environnement, Lutte contre les changements climatiques, Faune et Parcs portfolio are primarily devoted to funding initiatives to combat climate change, protect the environment and preserve biodiversity. These expenditures also include the operation of public dams, land management of the state's water domain and conservation of wildlife resources and habitats.
The expenditure growth of 9.8% in 2026-2027 results from lower-than-expected expenditures in 2025-2026 under the Electrification and Climate Change Fund, in particular under the Roulez vert program, as well as the addition of initiatives in 2026-2027 such as the expansion of the LogisVert Program and the implementation of Rénoclimat - Adaptation announced in the March 2026 budget.
In 2027-2028, the 9.6% growth is due, in particular, to the increase in expenditures under the 2030 Plan for a Green Economy, resulting from the expected increase in revenue from the carbon market.
In 2028-2029, the −1.7% change is due, in particular, to the end of the action plan related to the 2030 Nature Plan and the reduction in Blue Fund expenditures.
❏ Other portfolios
Expenditures in the other portfolios include expenditures in all other portfolios, which include programs in the culture, immigration, tourism and natural resources sectors, as well as the activities of the judicial system, domestic security, international relations, the legislative branch and central agencies.26
In 2026-2027, the −1.5% change in expenditures is due in particular to the impact of non-recurring adjustments to provisions for litigation in 2025-2026 as well as the decrease in bad tax debts. This change is mitigated in particular by targeted assistance for the forestry sector and for the costs associated with the general election in October 2026.
In 2027-2028 and 2028-2029, the change in expenditures of −0.7% and 0.1%, respectively, is attributable to reduced funding for certain initiatives, most of which are expiring, as well as the stabilization of investments for infrastructure belonging to third parties, the initiatives stemming from the expenditure review, and, for 2027-2028, the impact of expenditures in 2026-2027 related to the general election in October 2026. These changes are partially offset by increased expenditures on local infrastructure funded by federal transfers.
The decision to continue funding several initiatives is subject to the government's assessment, based, in particular, on its priorities and the available budgetary resources. Therefore, funding for the initiatives listed below could be extended before they expire.
TABLE 26
Key initiatives for which current funding is decreasing or ending in 2027-2028 or in 2028-2029 in other portfolios
| 2027-2028 | 2028-2029 |
|
— One-time assistance for the forestry sector (Ressources naturelles et Forêts) — Support for Indigenous economic, social and community initiatives (Conseil exécutif) — Promotion of Québec as a tourist destination and agreements on regional partnerships and digital transformation (Tourisme) — Modernization of the justice system (Justice et Sécurité intérieure) — Improvements to services related to francization and attracting immigrants to the regions (Immigration, Francisation et Intégration) |
— One-time assistance for the forestry sector (Ressources naturelles et Forêts) — Enhancing the competitiveness of the biofood sector (Agriculture, Pêcheries et Alimentation) — Reaffirmation of Télé-Québec's role in youth and cultural programming, affirmation of an online presence for Québec cultural content, continuation and adaptation of the government's culture action plan, and increased funding for the 2026-2031 Québec Audiovisual Strategy (Culture et Communications) — Enhancing support for French language learning through the rollout of Francisation Québec (Immigration, Francisation et Intégration) |
| Note: The selection of initiatives is based on the relative weight of each portfolio. | |
_______________________________________
26 These are the Ministère des Finances, the Ministère du Conseil exécutif and the Secrétariat du Conseil du trésor.
❏ Assumptions, risks and sensitivity analysis for portfolio expenditures
■ Assumptions
The Ministère des Finances sets the multi-year expenditure target for the period covered by the financial framework. It is essentially established according to the government's budgetary policy directions.
— This target is dependent, among other things, on program renewal costs and revenue trends, as well as on the analysis and monitoring during the year of the government's revenue and expenditure.
The Secrétariat du Conseil du trésor, in collaboration with government departments, estimates the cost of renewing government programs. These costs represent a comprehensive assessment of the expenditures associated with the continued delivery of existing services and programs.
— Given the sensitivity of expenditures to certain economic and demographic parameters, the renewal cost calculation considers elements such as changes in the price of goods and services, population change, an aging population and variations in clienteles.
— It also takes into account the impact of government decisions, such as the cost of past commitments and collective agreements.
TABLE 27
Factors affecting government program renewal costs and the multi-year expenditure target
| Government portfolio renewal costs | Multi-year expenditure target |
|
— Change in clienteles — Change in prices — Population change — Past commitments — Discount rates related to certain liabilities |
— Financing capacity that depends, in particular, on revenue trends — Fiscal and budgetary policy — Budgetary guidelines, including new initiatives in the budget — Monitoring during the year of revenue and expenditure |
The multi-year expenditure target is compared with the cost of renewing government programs, in order to manage potential observed gaps.
In cases where the cost of renewing government programs exceeds the multi-year expenditure target, priorities must be established and choices involving spending control initiatives, reallocation or target increases can be made to reduce or eliminate the gap between renewal costs and the expenditure target.
— Departments and public bodies are responsible for identifying measures that should be put in place to ensure that their expenditure target is met, under the coordination of the Secrétariat du Conseil du trésor.
TABLE 28
Managing gaps between the cost of renewing government programs and the multi-year expenditure target
| Overall expenditure target | < | Renewal costs | ➡ | Saving measures to be determined, reallocation or spending increases |
| Overall expenditure target | > | Renewal costs | ➡ | Fiscal space for new initiatives or reduction of the expenditure target |
In order to ensure full funding of existing public services, the gap between government program renewal costs and the expenditure target must be closed for the fiscal year covered by the budget.
For subsequent fiscal years, shortfalls can remain. In the next update of government program renewal costs, the existing gap for the year covered by the budget must in turn be closed.
■ Demographics
Changes in the size and structure of the population based on the various age groups comprising it affect the level and composition of public spending. Demographic forecasts are therefore taken into account when estimating the costs of continuing programs for portfolios that provide services to specific clienteles.
— The type and cost of public services differ depending on the age group. In particular:
— children under 5 years of age have access to daycare places;
— children aged 5 to 16 receive education services at the elementary and secondary levels;
— a proportion of young adults aged 17-to-24 attend higher education institutions.
Over the next few years, among people aged 24 and under, only the number of people aged 17 to 24 will see growth, at an average of 1.1% per year.
| CHART 13 Change in Québec's population aged 24 and under from 2016 to 2031 |
| (population in thousands and average annual growth rate in per cent) |
|
|
| Sources: Institut de la statistique du Québec, Statistics Canada and Ministère des Finances du Québec. |
Moreover, the rise in the population aged 65 and over affects expenditure in the Santé et Services sociaux portfolio.
— This factor will also influence the renewal costs of programs in this portfolio.
From 2016 to 2026, the percentage of individuals aged 65 and over rose from 18.0% to 22.3% of the total population.
| CHART 14 Change in the population aged 65 and over from 2016 to 2031 |
| (as a percentage of the total population) |
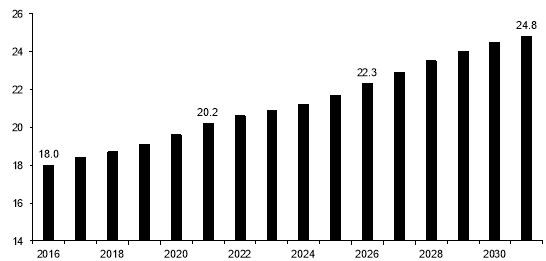 |
| Sources: Institut de la statistique du Québec, Statistics Canada and Ministère des Finances du Québec. |
■ Remuneration of government employees
Prices for public services as a whole also take into consideration the impact of salary increases and of higher costs for pay equity maintenance and special agreements.
Remuneration agreements were entered into with almost all government employees, facilitating the predictability of government spending until 2027-2028. In particular, the agreements provide for:
— annual increases of 6.0% in 2023-2024, 2.8% in 2024-2025, 2.6% in 2025-2026, 2.5% in 2026-2027, and 3.5% in 2027-2028;
— a salary adjustment clause linked to the Québec CPI for the years 2025-2026, 2026-2027, and 2027-2028, of up to 1%.
The financial framework for the negotiations includes wage increases totalling 17.40% spread over five years, plus a salary adjustment clause estimated at 0.70%.
TABLE 29
| Negotiated salary increases for the period 2023-2028 (per cent) |
||||||||||||||||||
| 2023-2024 | 2024-2025 | 2025-2026 | 2026-2027 | 2027-2028 | Total 5 years |
|||||||||||||
| Salary parameters | 6.00 | 2.80 | 2.60 | 2.50 | 3.50 | 17.40 | ||||||||||||
| Salary adjustment clause(1) | n/a | n/a | 0.11 | 0.59 | - | 0.70 | ||||||||||||
| TOTAL | 6.00 | 2.80 | 2.71 | 3.09 | 3.50 | 18.10 | ||||||||||||
Note: The wage increases represent those negotiated with the Common Front and many other unions.
(1) The rate for the salary adjustment clause for 2025-2026 is confirmed. For 2026-2027 and 2027-2028, the rates are forecasts based on economic data from the Ministère des Finances du Québec as at June 26, 2026.
|
Agreements with doctors' federations |
|
On April 23, 2026, the agreement in principle between the Québec government and the Fédération des médecins spécialistes du Québec (FMSQ) was ratified. This agreement provides for a 9% increase in the overall budget allocation for medical specialists, to which an additional 2% may be added, subject to the achievement of performance targets. The agreement also includes significant commitments by the government to increase operational capacity and fund projects that promote access to specialized medical care. As a reminder, in December 2025, the Québec government reached an agreement with the Fédération des médecins omnipraticiens du Québec (FMOQ) that provides for a 14.5% increase in the overall budget over five years, plus an additional 2.5% contingent on meeting a patient intake target. The framework agreement had expired on March 31, 2023 for both the FMOQ and the FMSQ. The negotiated agreements cover the period from April 1, 2023 to March 31, 2028. |
■ Risks
Changes in target clienteles can have an impact on the expenditures of a departmental portfolio.
— A change in the number of last resort financial assistance recipients, for example due to an economic slowdown, could pose a risk and affect the expenditure forecasts for the Emploi et Solidarité sociale portfolio.
— An unforeseen change in staffing at elementary and secondary schools, CEGEPs or universities could affect the expenditures of the Éducation and Enseignement supérieur portfolios.
— Expenditure in the Famille portfolio may vary as a result of a change in the subsidized childcare services clientele.
A change in the general level of prices can have an impact on public spending as a whole. The risk affects the portfolios differently.
Technological change can also cause spending changes in certain sectors.
— Expenditure in health and social services, for example, is in large part tied to the cost of prescription drugs and diagnostic equipment, which are technology intensive.
In general, expenditures can be changed, for example when new, specific needs arise in the population.
The accuracy of forecast remuneration expenditures is improved when the remuneration of government employees is governed by agreements. Agreements were reached with almost all government employees until 2027-2028. There is still some volatility, as negotiations are ongoing for certain groups and most agreements include a salary adjustment clause that varies based on the CPI at the end of certain years.
Climate change can have significant economic repercussions for the government by, for example, affecting product prices, the value of non-financial assets when infrastructure is damaged, or relief measures for citizens and businesses in the event of disasters.27
■ Sensitivity analysis
The financial framework forecast takes into account:
— the government's budgetary choices, which stem from prioritizing certain sectors over others in allocating spending;
— socioeconomic variables, which are tied to price factors (inflation) and demographic factors (changes in population).
The following two tables show the sensitivity of portfolio expenditures according to budgetary choices and socioeconomic factors.
— It should be noted that the data included in these tables are indications and that impacts may differ based on the nature and interaction of risk factors.
_______________________________________
27 More examples of impacts are available on Québec.ca at:
https://www.quebec.ca/en/government/policies-orientations/plan-green-economy/understand-climate-change/impacts.
■ Budgetary choices
Expenditures may vary according to the government's choices in allocating its available budgetary resources. Therefore, for fiscal 2026-2027, a 1% variation in expenditures in the:
— Santé et Services sociaux portfolio would lead to a variation of about $700 million;
— Éducation portfolio would lead to a variation of about $240 million;
— Enseignement supérieur portfolio would lead to a variation of about $120 million.
TABLE 30
Sensitivity of expenditures to a variation of 1% in each departmental portfolio
| (millions of dollars) | |||
| Impacts for fiscal 2026-2027 |
|||
| Santé et Services sociaux | 700 | ||
| Éducation | 240 | ||
| Enseignement supérieur | 120 | ||
| Famille | 100 | ||
| Transports et Mobilité durable | 80 | ||
| Emploi et Solidarité sociale | 60 | ||
| Affaires municipales et Habitation | 60 | ||
| Économie, Innovation et Énergie | 50 | ||
| Environnement, Lutte contre les changements climatiques, Faune et Parcs | 20 | ||
| Other portfolios | 190 | ||
| TOTAL | 1 610 | ||
Note: Totals may not add due to rounding.
■ Socioeconomic factors
The analysis carried out also makes it possible to estimate the sensitivity of portfolio expenditures to certain socioeconomic factors.
Expenditure is also affected by changes in total population and in the size of the clientele for certain services.
For example, a 1% variation in the total population would change total spending by approximately $1 270 million, that is, 0.8 percentage points.
A 1% variation in the number of people aged 5-16, that is, the population that affects, in particular, the demand for educational services, would have a $300-million impact on total expenditure.
Public spending is influenced by the price of services offered by the government. The change in the price of such services is closely tied to the change in the general level of prices in the economy, that is, inflation. Accordingly, a variation in prices could lead to changes in portfolio expenditures.
The results show that a uniform variation of 1% in prices would lead to a variation of $760 million in spending, or 0.5 percentage points in total spending.
TABLE 31
Sensitivity of portfolio expenditures to a variation of 1% in socioeconomic variables
| Impacts for fiscal 2026-2027 |
|||||||
| Socioeconomic variables | $million | Percentage points |
|||||
| Demographics | |||||||
| Total population | Total expenditure | 1 270 | 0.8 | ||||
| Per portfolio: | |||||||
| - Santé et Services sociaux | 0.9 | ||||||
| - Éducation | 0.9 | ||||||
| - Enseignement supérieur | 1.0 | ||||||
| - Famille | 1.0 | ||||||
| - Other | 0.4 | ||||||
| 0-4 years | Total expenditure | 90 | 0.1 | ||||
| Per portfolio: | |||||||
| - Famille | 0.6 | ||||||
| 5-16 years | Total expenditure | 300 | 0.1 | ||||
| Per portfolio: | |||||||
| - Éducation | 0.9 | ||||||
| 17-24 years | Total expenditure | 150 | 0.1 | ||||
| Per portfolio: | |||||||
| - Enseignement supérieur | 0.9 | ||||||
| 65 years old and over | Total expenditure | 420 | 0.3 | ||||
| Per portfolio: - Santé et Services sociaux |
0.5 | ||||||
| Prices | |||||||
| Inflation | Total expenditure | 760 | 0.5 | ||||
| Per portfolio: | |||||||
| - Santé et Services sociaux | 0.4 | ||||||
| - Éducation | 0.3 | ||||||
| - Enseignement supérieur | 0.6 | ||||||
| - Famille | 1.0 | ||||||
| - Other | 0.6 | ||||||
4.2.2 Debt service
Debt service consists of interest on the direct debt as well as interest on the liability for the retirement plans and other future benefits of public and parapublic sector employees.
It will stand at $10.5 billion in 2026-2027, $10.9 billion in 2027-2028 and $11.4 billion in 2028-2029, which represents variations of 3.6%, 3.4% and 4.9% respectively.
In 2026-2027, 2027-2028 and 2028-2029, interest on the direct debt will change by 6.0%, 3.1% and 7.0% respectively, owing in particular to the increase in the debt level and the anticipated change in interest rates.
Interest on the liability for the retirement plans and other employee future benefits has been reducing debt service since 2025-2026 due to the investment income of the RPSF, which is deducted from debt service and which now exceeds interest on obligations relating to the retirement plans.
In 2025-2026, the RPSF generated a return of 7.06%. For 2026-2027, the expected long-term RPSF return, that is, 6.45% per year, is used to estimate RPSF investment income. It should be noted that return differences are gradually incorporated into the financial framework in accordance with generally accepted accounting principles (GAAP).
TABLE 32
| Change in debt service (millions of dollars, unless otherwise indicated) |
|||||||||||||||
| 2025-2026 | 2026-2027 | 2027-2028 | 2028-2029 | AAGR(1) | |||||||||||
| Interest on direct debt(2) | 10 591 | 11 225 | 11 572 | 12 386 | |||||||||||
| % change | 7.7 | 6.0 | 3.1 | 7.0 | 5.4 | ||||||||||
| Interest on the liability for retirement plans and other employee future benefits(3) |
−443 | −709 | −702 | −984 | |||||||||||
| TOTAL | 10 148 | 10 516 | 10 870 | 11 402 | |||||||||||
| % change | 1.8 | 3.6 | 3.4 | 4.9 | 4.0 | ||||||||||
(1) Average annual growth rate, corresponding to the geometric mean over three years, from 2026-2027 to 2028-2029.
(2) Interest on the direct debt includes the income of the Sinking Fund for Government Borrowing. This revenue, which is deducted from debt service, consists of interest generated on investments as well as gains and losses on disposal. The forecast for this revenue may be adjusted upward or downward since it is closely tied to changes in interest rates and market behaviour. This revenue totals $737 million in 2025-2026, $619 million in 2026-2027, $935 million in 2027-2028, and $970 million in 2028-2029.
(3) This interest corresponds to the interest on obligations relating to the retirement plans and other future benefits of public and parapublic sector employees, minus mainly the investment income of the RPSF.
❏ Assumptions, risks and sensitivity analysis
■ Assumptions
The debt service forecast is based primarily on the debt level, interest rate and RPSF return forecasts.
■ Risks
The main risks with respect to the debt service forecast are a higher-than-anticipated variation in interest rates and a different-than-expected return on the RPSF.
The RPSF is an asset that was created for payment of the retirement benefits of public and parapublic sector employees. It is managed by the Caisse de dépôt et placement du Québec.
The income of the RPSF is deducted from debt service. Accordingly, a lower (higher) return than expected would drive up (down) debt service.
■ Sensitivity analysis
A greater-than-anticipated rise in interest rates of 1 percentage point over a full year would result in a change in interest expenditure of $640 million in the first year and $1.8 billion in the fifth year.
A return of 1 percentage point lower (higher) than the anticipated return on the RPSF would lead to an increase (decrease) in debt service of approximately $35 million the following year and $209 million five years after.
Moreover, to neutralize the impact of exchange rate variations on debt service, the government maintains no exposure of its debt to foreign currency on financial markets.
5. QUÉBEC'S DEBT
Several different concepts of debt are used to measure a government's indebtedness. The Québec government presents information on each of these concepts in its budget documents.
— The gross debt burden stood at 41.1% as at March 31, 2026; it is projected to reach 41.5% as at March 31, 2031.
— The net debt burden stood at 38.1% as at March 31, 2026; it is projected to reach 36.0% as at March 31, 2031.
— The Act to reduce the debt and establish the Generations Fund stipulates that, for fiscal years 2032-2033 and 2037-2038, the net debt presented in the government's financial statements may not exceed 38.0% and 35.0% of GDP, respectively.
— The debt burden, representing accumulated deficits, stood at 19.7% as at March 31, 2026; it is projected to stand at 16.7% as at March 31, 2031.
TABLE 33
| Debt of the Québec government as at March 31 according to various concepts (millions of dollars, unless otherwise indicated) |
||||||||||||||||||
| 2026 | 2027 | 2028 | 2029 | 2030 | 2031 | |||||||||||||
| GROSS DEBT(1) | 265 547 | 280 807 | 295 462 | 305 967 | 311 817 | 316 499 | ||||||||||||
| % of GDP | 41.1 | 42.0 | 42.8 | 42.8 | 42.2 | 41.5 | ||||||||||||
| Less: Financial assets, net of other liabilities(2) | −19 640 | −27 351 | −30 396 | −35 265 | −38 616 | −41 514 | ||||||||||||
| NET DEBT | 245 907 | 253 456 | 265 066 | 270 702 | 273 201 | 274 985 | ||||||||||||
| % of GDP | 38.1 | 37.9 | 38.4 | 37.9 | 37.0 | 36.0 | ||||||||||||
| Less: Non-financial assets | −118 509 | −121 129 | −129 824 | −136 865 | −142 433 | −147 675 | ||||||||||||
| DEBT REPRESENTING ACCUMULATED DEFICITS | 127 398 | 132 327 | 135 242 | 133 837 | 130 768 | 127 310 | ||||||||||||
| % of GDP | 19.7 | 19.8 | 19.6 | 18.7 | 17.7 | 16.7 | ||||||||||||
Note: A new accounting standard (Section PS 1202 - Financial Statement Presentation) came into force on April 1, 2026. From that date, the concept of net debt is replaced by that of net financial liabilities. This change will be presented in the next public accounts. The adjustment relates to a liability item called deferred revenue. Non-financial liabilities, which correspond to deferred revenue, are no longer added to net debt, which formerly included all liabilities. However, it continues to be considered in the calculation of the debt representing accumulated deficits, which has been renamed "net liabilities." This change results in a 0.9 percentage point reduction in net debt to GDP in 2026-2027. However, it does not entail any changes with regard to gross debt or debt representing accumulated deficits.
(1) Gross debt excludes pre-financing and takes into account the amounts accumulated in the Generations Fund at book value. It should be noted that, as at March 31, 2026, the fair value of the Generations Fund was $3.8 billion (0.6% of GDP) higher than its book value.
(2) Financial assets include, in particular, participations in government enterprises (e.g. Hydro-Québec) and accounts receivable. Other liabilities (e.g. accounts payable) are subtracted. As of April 1, 2026, non-financial liabilities are no longer deducted from financial assets, net of other liabilities.
❏ Assumptions, risks and sensitivity analysis
■ Assumptions
The factors of the change in net debt are:
— accounting deficit (surplus);
— An accounting deficit increases the net debt. Conversely, an accounting surplus reduces the net debt.
— capital investments, which flow from the QIP and for which borrowings must be made;
— accounting adjustments.
Note that the main factors affecting the changes in gross debt include: the accounting deficit (surplus); government investments in enterprises-including government enterprises-which are referred to as investments, loans, and advances; and capital investments.
Debt representing accumulated deficits, on the other hand, is influenced by the accounting deficit (surplus) and accounting adjustments.
Over the next five years, from 2026-2027 to 2030-2031, the net debt is expected to increase by $35.0 billion, largely due to capital investments. However, net debt to GDP is projected to be lower as at March 31, 2031 than it was as at March 31, 2026.
TABLE 34
Factors responsible for the change in net debt
| (millions of dollars, unless otherwise indicated) | |||||||||||||||||||||
| Debt, beginning of year |
Accounting deficit (surplus)(1) |
Net capital investments |
Accounting adjustments(2) |
Total change |
Debt, end of year |
% of GDP |
|||||||||||||||
| 2025-2026 | 236 163 | 5 502 | 6 693 | −2 451 | 9 744 | 245 907 | 38.1 | ||||||||||||||
| 2026-2027 | 239 971 | (3) | 5 208 | 8 556 | −279 | 13 485 | 253 456 | 37.9 | |||||||||||||
| 2027-2028 | 253 456 | 3 194 | 8 695 | −279 | 11 610 | 265 066 | 38.4 | ||||||||||||||
| 2028-2029 | 265 066 | −1 126 | 7 041 | −279 | 5 636 | 270 702 | 37.9 | ||||||||||||||
| 2029-2030 | 270 702 | −2 790 | 5 568 | −279 | 2 499 | 273 201 | 37.0 | ||||||||||||||
| 2030-2031 | 273 201 | −3 179 | 5 242 | −279 | 1 784 | 274 985 | 36.0 | ||||||||||||||
(1) From 2028-2029 to 2030-2031, the accounting balance includes the gap to be bridged.
(2) Accounting adjustments include the impact of revaluation elements on net debt. In 2025-2026, the reduction in net debt is mainly due to revaluation gains related to government enterprises.
(3) As of April 1, 2026, the concept of net debt has been replaced by that of net financial liabilities. It is estimated that this change results in a $5.9-billion reduction in net debt in 2026-2027, or 0.9% of GDP.
The net debt burden stood at 38.1% of GDP as at March 31, 2026. It is projected to decline to 36.0% of GDP as at March 31, 2031. This will be much lower than the peak reached in the early 2010s.
It should also be noted that the net debt burden as at March 31, 2026 is lower than it was before the COVID-19 pandemic, which was declared in 2020.
| CHART 15 Net debt as at March 31 |
| (percentage of GDP) |
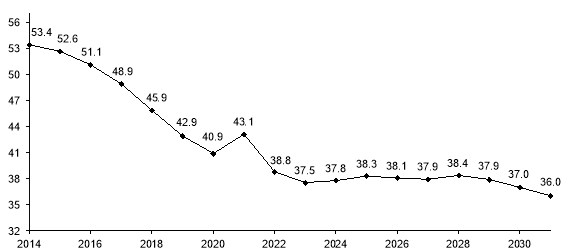 |
|
Note: Starting April 1, 2026, the concept of net debt has been replaced by that of net financial liabilities due to the new accounting standard on financial statement presentation coming into force. This change results in a 0.9 percentage point reduction in net debt to GDP in 2026-2027. |
|
Net debt of governments in Canada |
| As at March 31, 2026, Québec's net debt burden stood at 38.1% of GDP, compared to the provincial average of 30.2%.1 |
| Net debt of governments in Canada as at March 31, 2026 |
| (percentage of GDP) |
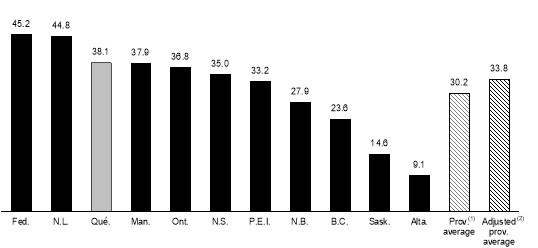 |
|
(1) GDP-weighted average. (2) GDP-weighted average excluding the least indebted province, Alberta, and the most indebted province, Newfoundland andLabrador. Sources: Governments' budget documents and public accounts. |
1 The provincial average as at March 31, 2025 was 28.9%.
■ Risks
Several risks can affect the net debt level. For example:
— accounting deficits further to an economic slowdown, for instance, would increase the net debt. Conversely, a stronger economy could lead to smaller deficits or accounting surpluses, which would reduce net debt;
— a potential increase in the level of QIP investments, for example to meet additional public infrastructure needs or to address rising construction costs, would result in an increase in the net debt through an increase in:
— net capital investments for government-owned infrastructure that are subject to depreciation,
— transfer payments, included in portfolio expenditures, for non-government-owned infrastructure;
— a lower rate of realization of QIP investments would in turn result in a smaller-than-expected increase in net debt.
■ Sensitivity analysis
If the deficit were higher than expected, the net debt would increase by an amount equal to the change in the deficit. Conversely, if the deficit were smaller, the net debt would decrease by an amount equal to the change in the deficit. The relationship is the same for every dollar change in the QIP.
6. REPORTS ON THE APPLICATION OF THE LEGISLATION RESPECTING A BALANCED BUDGET AND THE GENERATIONS FUND
6.1 The Balanced Budget Act
The purpose of this section is to present the extent to which the objectives of the Balanced Budget Act have been achieved and, where applicable, any variance recorded.
The purpose of the Balanced Budget Act is to balance the government's budget. To that end, the Act sets limits on the circumstances that can lead to a budget deficit being anticipated and provides for, in certain cases and in full transparency, a process for returning to a balanced budget.
|
The Balanced Budget Act |
|
The Balanced Budget Act was passed by the National Assembly in 1996 and modernized in December 2023. The Act specifies how the budgetary balance is calculated and sets out the applicable rules in the case of an actual or anticipated budgetary deficit. Pursuant to the Act, the government may not anticipate a budgetary deficit, except in one of the following three specific circumstances: — a disaster having a major impact on revenue or expenditure; — a significant deterioration of economic conditions; — a change in federal programs of transfer payments to the provinces, which would substantially reduce transfer payments to the government. The Act also provides for the presentation of a plan to restore fiscal balance when the budgetary deficit for a given fiscal year is greater than the revenues recorded in the Generations Fund for that year, and it specifies the cases in which such a plan may be replaced. The plan must present decreasing deficits over a maximum period of five years and anticipate, for the fiscal year preceding the return to a balanced budget, a deficit of 25% or less of the budget deficit referred to in the previous paragraph. |
❏ Budgetary balance within the meaning of the Balanced Budget Act
The objectives of the Balanced Budget Act are achieved if the budgetary balance, calculated in accordance with the Act, is zero or positive. Otherwise, the Minister must report on the circumstances causing the anticipated budgetary deficit. Table 35 shows the components for establishing the budgetary balance within the meaning of the Act.
Balanced budgets within the meaning of the Act were achieved for fiscal years 2017-2018 to 2019-2020. For 2020-2021, 2021-2022 and 2022-2023, the COVID-19 pandemic had a major impact on the government's financial framework. The Balanced Budget Act was amended to suspend the obligation to achieve a balanced budget in those years. However, a balanced budget was achieved in 2020-2021 and 2021-2022 through the use of the stabilization reserve. A plan to offset budget overruns was presented during Budget Speech 2023-2024 in accordance with the Balanced Budget Act in effect at that time.
In December 2023, the Act was modernized to make it simpler and more flexible, while keeping it equally binding in terms of the obligation to provide for a balanced budget. The Public Accounts 2022-2023, published after the Act was modernized and came into force, showed a deficit, within the meaning of the Act, of $6 084 million. Since this deficit exceeded the dedicated revenues in the Generations Fund, a plan to restore fiscal balance was presented in the Budget Speech 2025-2026.
The financial framework of the Pre-election Report on the State of Québec's Public Finances - August 2026 complies with the Act, as the projected deficits are less than or equal to those in the plan tabled in Budget 2025-2026.
| CHART 16 Budgetary balance from 2017-2018 to 2030-2031 |
| (millions of dollars) |
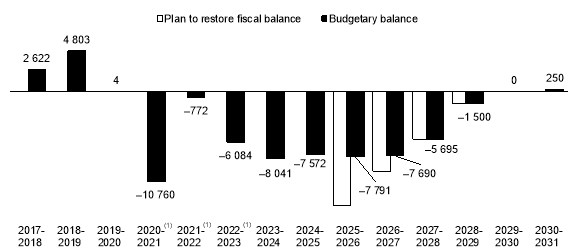 |
|
Note: Budgetary balance within the meaning of the Balanced Budget Act. (1) Before 2023-2024, the Act allowed the stabilization reserve to be taken into account in assessing whether a balanced budget had been achieved. The use of the stabilization reserve resulted in balanced budgets for 2020-2021 and 2021-2022, and a budget deficit balance of $5 635 million for 2022-2023 ($6 084 million being the budgetary balance before use of the stabilization reserve). The stabilization reserve was abolished in 2023-2024. |
|
Budgetary balance within the meaning of the Act |
|
The budgetary balance corresponds essentially to the surplus or the deficit presented in the public accounts (surplus or deficit from operations) reduced by the amount of revenues dedicated to the Generations Fund and adjusted to take certain accounting changes into consideration, if applicable. This definition of budgetary balance is more restrictive than in other provinces and reflects the government's determination to reduce the debt and preserve generational equity. Before 2023-2024, the Act allowed the stabilization reserve to be taken into account in assessing whether a balanced budget had been achieved. Where the calculated budgetary balance was a deficit, the government used an equivalent amount from the reserve to present a nil budgetary balance and achieve a balanced budget without having to implement an offsetting financial plan. The budgetary balance thus obtained corresponded to the budgetary balance within the meaning of the Act after taking into account the stabilization reserve, which was abolished as of 2023-2024. |
❏ Plan to restore fiscal balance
The policy directions governing the plan to restore fiscal balance, the monitoring of that plan, and the path for returning to a balanced budget are presented in Section 3.
TABLE 35
Budgetary balance within the meaning of the Balanced Budget Act
| (millions of dollars) | |||||||||||||||||||||
| Fiscal year | Accounting surplus (deficit)(2) |
Dedicated revenues in the Generations Fund |
Accounting and other changes(3) |
Budgetary balance within the meaning of the Act |
Stabilization reserve(1) | Budgetary balance within the meaning of the Act after reserve(4) |
|||||||||||||||
| Allocations | Uses | ||||||||||||||||||||
| 2015-2016 | 3 269 | −1 453 | 375 | 2 191 | −2 191 | - | - | ||||||||||||||
| 2016-2017 | 3 944 | −2 001 | 418 | 2 361 | −2 361 | - | - | ||||||||||||||
| 2017-2018 | 2 804 | −2 293 | 2 111 | 2 622 | −2 622 | - | - | ||||||||||||||
| 2018-2019 | 7 675 | −3 477 | 605 | 4 803 | −4 803 | - | - | ||||||||||||||
| 2019-2020 | 1 845 | −2 606 | 765 | 4 | −4 | - | - | ||||||||||||||
| 2020-2021 | −4 378 | −3 313 | −3 069 | −10 760 | - | 10 760 | - | ||||||||||||||
| 2021-2022 | 2 567 | −3 617 | 278 | −772 | - | 772 | - | ||||||||||||||
| 2022-2023 | −3 126 | −3 082 | 124 | −6 084 | - | 449 | −5 635(5 | ) | |||||||||||||
| 2023-2024 | −5 994 | −2 047 | - | −8 041(6 | ) | n/a | n/a | n/a | |||||||||||||
| 2024-2025 | −5 175 | −2 397 | - | −7 572(6 | ) | n/a | n/a | n/a | |||||||||||||
| 2025-2026 | −5 502 | −2 289 | - | −7 791(7 | ) | n/a | n/a | n/a | |||||||||||||
| 2026-2027 | −5 208 | −2 482 | - | −7 690(7 | ) | n/a | n/a | n/a | |||||||||||||
(1) The stabilization reserve was repealed on December 7, 2023.
(2) The annual surpluses (deficits) were restated to take into account, in particular, the accounting standards respecting transfer payments and asset retirement obligations.
(3) To comply with the Balanced Budget Act, adjustments are made to take into account restatements in the public accounts, including the change in the application of the accounting standard respecting transfer payments and its impact on the accumulated deficit in 2020-2021.
(4) The budgetary balance within the meaning of the Balanced Budget Act after reserve corresponds to the budgetary balance that takes into account allocations to the stabilization reserve and uses of it in order to maintain a balanced budget or reduce the budgetary deficit.
(5) The obligation to achieve a balanced budget was suspended from March 25, 2021 to March 31, 2023.
(6) Deficits are permitted in 2023-2024 and 2024-2025. Since the deficit for 2022-2023 exceeds the dedicated revenues in the Generations Fund, deficits are permitted for the following two years, before the plan to restore fiscal balance was tabled.
(7) A plan to restore fiscal balance was tabled in March 2025. During the execution of a plan, a deficit is permitted if it is equal or less than that of the plan.
6.2 The Act to reduce the debt and establish the Generations Fund
❏ Debt reduction objective
The Act to reduce the debt and establish the Generations Fund stipulates that, for fiscal years 2032-2033 and 2037-2038, the net debt presented in the government's financial statements may not exceed 38.0% and 35.0% of GDP, respectively.
These ratios correspond to the maximum limit of the respective targets of 35.5% and 32.5% of GDP, as reviewed by the government in the March 2025 budget speech. Developments in the budgetary situation since the March 2023 budget called for a review of these targets.
— Given the difficulty of forecasting how the economy will change over the long term, the government is continuing to provide an interval for these two targets.
TABLE 36
Debt reduction targets announced in the March 2025 budget
| Net debt by 2032-2033 (intermediate target) | 35.5% of GDP (±2.5% of GDP) |
| Net debt by 2037-2038 | 32.5% of GDP (±2.5% of GDP) |
The Ministère des Finances conducts detailed five-year debt forecasts. For information purposes, a projection of the net debt-to-GDP ratio has been carried out up to 2037-2038.
Based on this projection, it is expected that:
— net debt to GDP will stand at 34.5% as at March 31, 2033, below the maximum limit of 38.0% of GDP;
— net debt to GDP will stand at 30.8% as at March 31, 2038, below the maximum limit of 35.0% of GDP.
❏ Deposits in the Generations Fund
Three sources of revenue are dedicated to the Generations Fund:
— water-power royalties, which are paid by Hydro-Québec and private hydroelectricity producers;
— an additional contribution from Hydro-Québec, set at $650 million per year, taken from the dividend paid by Hydro-Québec to the government;
— income generated by the investment of the sums making up the Generations Fund.
In 2026-2027, revenues dedicated to the Generations Fund will stand at $2.5 billion. They will increase gradually each year, reaching $2.9 billion in 2030-2031.
As a reminder, in December 2023, amendments were made to the Act to reduce the debt and establish the Generations Fund with regard to dedicated revenues. Since 2023-2024, revenues resulting from the indexation of the price of heritage electricity, mining revenues, an annual sum of $500 million from the specific tax on alcoholic beverages and unclaimed property are no longer deposited in the Generations Fund. Moreover, gifts, legacies and other contributions received by the Minister of Finance continue to be deposited in the Generations Fund.
TABLE 37
Generations Fund
| (millions of dollars, unless otherwise indicated) | ||||||||||||||||||
| 2025- 2026 |
2026- 2027 |
2027- 2028 |
2028- 2029 |
2029- 2030 |
2030- 2031 |
|||||||||||||
| Book value, beginning of year | 16 855 | 16 644 | 18 541 | 21 042 | 23 668 | 26 458 | ||||||||||||
| Dedicated revenues | ||||||||||||||||||
| Water-power royalties | ||||||||||||||||||
| Hydro-Québec | 752 | 816 | 886 | 898 | 942 | 955 | ||||||||||||
| Private producers | 116 | 126 | 127 | 130 | 133 | 136 | ||||||||||||
| Subtotal | 868 | 942 | 1 013 | 1 028 | 1 075 | 1 091 | ||||||||||||
| Additional contribution from Hydro-Québec | 650 | 650 | 650 | 650 | 650 | 650 | ||||||||||||
| Investment income(1) | 771 | 890 | 838 | 948 | 1 065 | 1 188 | ||||||||||||
| Total dedicated revenues | 2 289 | 2 482 | 2 501 | 2 626 | 2 790 | 2 929 | ||||||||||||
| Deposit from the Electrification and Climate Change Fund |
- | 1 915 | - | - | - | - | ||||||||||||
| Total deposits | 2 289 | 4 397 | 2 501 | 2 626 | 2 790 | 2 929 | ||||||||||||
| Use of the Generations Fund to repay borrowings |
−2 500 | −2 500 | - | - | - | - | ||||||||||||
| Book value, end of year | 16 644 | 18 541 | 21 042 | 23 668 | 26 458 | 29 387 | ||||||||||||
| % of net debt | 6.8 | 7.3 | 7.9 | 8.7 | 9.7 | 10.7 | ||||||||||||
| % of GDP | 2.6 | 2.8 | 3.0 | 3.3 | 3.6 | 3.9 | ||||||||||||
(1) The investment income of the Generations Fund corresponds to realized investment income (interest income, dividends, gains on the disposition of assets, etc.). The forecast can therefore be adjusted upward or downward depending on the time at which the gains or losses are actually realized. An annual return of 4.4% is expected, corresponding to the historical average. Moreover, the expected long-term return, including unrealized revenue, is 6.2%.
As at March 31, 2026, the balance of the Generations Fund stood at $16.6 billion, which is 6.8% of net debt. The book value of the Generations Fund is expected to stand at $29.4 billion as at March 31, 2031. Pursuant to the Act to reduce the debt and establish the Generations Fund, this amount, which is deducted from the gross debt, can only be used to repay debt on the financial markets.
Withdrawals from the Generations Fund to repay borrowings stood at $2.5 billion in 2025-2026. Withdrawals of $2.5 billion are also planned in 2026-2027. These withdrawals serve to reduce the amounts allocated to the financing program and alleviate debt servicing.
It should also be noted that as at March 31, 2026, the fair value of the Generations Fund was $3.8 billion (0.6% of GDP) higher than its book value. This capital gain is not deducted from the debt level, because the book value is used to calculate the debt.
| CHART 17 Growth in the book value of the Generations Fund as at March 31 |
| (millions of dollars) |
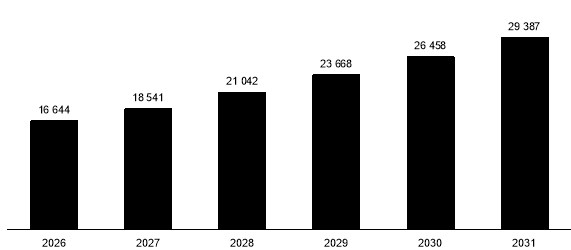 |
TABLE 38
Book value and fair value of the Generations Fund as at March 31
| (millions of dollars) | |||||||||
| Book value | Fair value(1) | Difference (unrealized gains) | |||||||
| 2015 | 6 938 | 8 271 | −1 333 | ||||||
| 2016 | 8 522 | 9 717 | −1 195 | ||||||
| 2017 | 10 523 | 12 324 | −1 801 | ||||||
| 2018 | 12 816 | 15 101 | −2 285 | ||||||
| 2019 | 8 293 | 9 882 | −1 589 | ||||||
| 2020 | 8 899 | 9 776 | −877 | ||||||
| 2021 | 12 212 | 13 687 | −1 475 | ||||||
| 2022 | 15 829 | 17 592 | −1 763 | ||||||
| 2023 | 18 911 | 20 542 | −1 631 | ||||||
| 2024 | 18 458 | 20 945 | −2 487 | ||||||
| 2025 | 16 855 | 19 929 | −3 074 | ||||||
| 2026 | 16 644 | 20 432 | −3 788 | ||||||
(1) The fair value includes the accounts receivable as at March 31, that is, dedicated revenues subsequently collected by the government and then paid to the Caisse de dépôt et placement du Québec.
7. ALTERNATIVE FORECAST SCENARIOS
Québec, like other regions elsewhere in the world, is facing a high degree of uncertainty, and a number of events could have an impact on the economic and fiscal outlook in the near future. In particular, developments in the trade dispute with the United States, as well as geopolitical tensions, especially in the Middle East, could have a different impact on Québec's GDP growth than forecast.
In this context, the Ministère des Finances is presenting two alternative economic forecast scenarios in the 2026 pre-election report to estimate the impact of a recession or stronger-than-expected economic growth on the financial framework and on the Québec government's debt.
7.1 Economic and budgetary outlook amid uncertainty
Numerous parameters are associated with the economic forecast scenario presented in the 2026 pre-election report, and this scenario reflects the expected changes in the economy as accurately as possible. While the baseline scenario is balanced, it is not shielded from events that could impact economic activity, both on the downside and the upside.28
— In particular, the materialization of certain downside risks could make budget planning and returning to a balanced budget by 2029-2030 more difficult.
Developments in the trade dispute with the United States, the CUSMA negotiations and worsening geopolitical tensions in the Middle East are the main risks to the baseline scenario.
— In particular, an increase in tariffs, the application of further sectoral tariffs or a possible withdrawal of the United States from CUSMA could exacerbate supply chain disruptions and cause a sharper slowdown in international trade, thus dampening economic growth, particularly in investment and exports.
Conversely, if a trade agreement were to be reached between Canada and the United States or certain sectoral tariffs were to be withdrawn, this would reduce uncertainty and stimulate economic growth.
Presenting alternative economic forecast scenarios helps put the baseline scenario into perspective. These scenarios do not correspond to specific events; rather, they are presented in general terms to illustrate a range of possible outcomes.
❏ Baseline economic forecast scenario
The baseline scenario is based on the premise that the effective tariff rate will remain relatively stable over the next few years and that oil flows through the Strait of Hormuz will gradually resume beginning in summer 2026. Furthermore, progress in the CUSMA negotiations is expected to help reduce uncertainty.
— Although tariffs are expected to remain in place for the long term, the initial shock of their introduction will gradually fade. The uncertainty that has shaken consumer and business confidence is also expected to diminish, which will allow for a return to stronger economic growth starting in 2027.
_______________________________________
28 The main risks associated with the baseline economic forecast scenario are presented in Section 1, "Economic and Financial Forecasts".
7.2 Two alternative economic forecast scenarios
❏ Recession scenario
The recession scenario could occur, for example, in the event of an escalation of the trade dispute, complications in the CUSMA negotiations or worsening geopolitical tensions, in particular in the Middle East. Such disruptions could dampen trade, investment and consumption.
Under this scenario, real GDP growth in 2026 would be 0.5%, a more moderate gain than that projected in the baseline scenario. Then, real GDP would contract in 2027 (−0.6%, compared to +1.4% under the baseline scenario).
In particular:
— exports and imports would be more heavily disrupted than under the baseline scenario, reducing business profits and having a greater negative effect on non-residential investment;
— the decline in demand would lead to a deterioration in the labour market. Job losses would be observed, which would adversely affect household consumption and residential investment;
— weaker growth than that expected in the baseline scenario would lead to downward pressure on price increases. Since a similar trend would be observed across the country, the Bank of Canada could have to reassess its monetary policy.
This scenario would result in a permanent output loss. Real GDP would not return to the level forecast under the baseline scenario.
— In comparison to the baseline scenario, economic activity would show a negative gap of 1.4% from 2029 onward.
TABLE 39
Real GDP in Québec - Baseline and recession scenarios
| (percentage change, shock in percentage points) | |||||||||
| Baseline scenario | Recession scenario | ||||||||
| Change | Shock | Change | |||||||
| 2025 | 0.6 | - | 0.6 | ||||||
| 2026 | 0.7 | −0.2 | 0.5 | ||||||
| 2027 | 1.4 | -2.0 | −0.6 | ||||||
| 2028 | 1.5 | +0.4 | 1.9 | ||||||
| 2029 | 1.5 | +0.3 | 1.8 | ||||||
| 2030 | 1.4 | - | 1.4 | ||||||
Note: Annual shock totals may differ from the cumulative shock indicated in the text due to rounding of change values.
In comparison to the baseline scenario:
— real and nominal GDP growth would show cumulative negative gaps of 2.2 and 2.3 percentage points, respectively, in 2027;
— approximately 56 100 jobs would be lost overall in 2026 and 2027;
— the average unemployment rate would stand at 5.6% in 2027, compared to 4.9% under the baseline scenario;
— the less tight labour market would result in more modest rises in wages and salaries (cumulative negative gap of 2.0 percentage points in 2027) and weaker growth in consumption excluding food expenditures and shelter (cumulative negative gap of 3.2 percentage points in 2027);
— growth in the net operating surplus of corporations would show a cumulative negative gap of 6.4 percentage points in 2027;
— the average increase in the CPI would be weaker than under the baseline scenario.
TABLE 40
Economic indicators in Québec in 2026 and 2027 -
Baseline and recession scenarios
| (in nominal terms, percentage change and shock in percentage points, unless otherwise indicated) | |||||||||||||||||||||
| 2026 | 2027 | Cumulative effects |
|||||||||||||||||||
| BL | Rec. | Shock | BL | Rec. | Shock | ||||||||||||||||
| GDP, in real terms | 0.7 | 0.5 | −0.2 | 1.4 | −0.6 | −2.0 | −2.2 | ||||||||||||||
| GDP | 3.4 | 3.2 | −0.2 | 3.4 | 1.3 | −2.1 | −2.3 | ||||||||||||||
| Consumer price index | 3.0 | 3.0 | - | 2.1 | 1.7 | −0.4 | −0.4 | ||||||||||||||
| Jobs (thousands) | −15.4 | −18.3 | −2.9 | 22.6 | −30.6 | −53.2 | −56.1 | ||||||||||||||
| Unemployment rate (per cent) |
5.6 | 5.6 | - | 4.9 | 5.6 | +0.7 | n/a | ||||||||||||||
| Wages and salaries | 3.3 | 3.1 | −0.2 | 3.5 | 1.7 | −1.8 | −2.0 | ||||||||||||||
| Net operating surplus of corporations |
4.8 | 4.2 | −0.6 | 1.1 | −4.7 | −5.8 | −6.4 | ||||||||||||||
| Consumption excluding food expenditures and shelter | 3.5 | 3.2 | −0.3 | 3.4 | 0.5 | −2.9 | −3.2 | ||||||||||||||
Note: "BL" means baseline scenario and "Rec." stands for recession scenario.
❏ Stronger growth scenario
The stronger growth scenario could materialize if, in particular, the United States were to lower or remove tariffs on imports as part of CUSMA renewal negotiations. This would help reduce uncertainty and improve the business climate. A smoother-than-expected recovery in maritime trade in the Middle East would also be a positive catalyst. Under this scenario, real GDP growth would be stronger than forecast under the baseline scenario.
Real GDP growth would reach 0.9% in 2026 and 2.1% in 2027, compared to gains of 0.7% in 2026 and 1.4% in 2027 expected under the baseline scenario.
— Renewed household and business confidence would support consumption and non-residential business investment, which would stimulate productivity and potential for growth.
— Exports would be stronger due to the increase in demand for goods and services, bolstering the net operating surplus of corporations.
— Higher demand for goods and services would encourage businesses to step up hiring. A more favourable labour market would lead to more robust wage gains.
Under this scenario, a rise in potential GDP would keep output at a higher level than the baseline scenario forecast.
— In comparison to the baseline scenario, economic activity would show a positive gap of 1.4% from 2029 onward.
TABLE 41
Real GDP in Québec - Baseline and stronger growth scenarios
| (percentage change, shock in percentage points) | |||||||||
| Baseline scenario | Stronger growth scenario | ||||||||
| Change | Shock | Change | |||||||
| 2025 | 0.6 | - | 0.6 | ||||||
| 2026 | 0.7 | +0.2 | 0.9 | ||||||
| 2027 | 1.4 | +0.7 | 2.1 | ||||||
| 2028 | 1.5 | +0.4 | 1.9 | ||||||
| 2029 | 1.5 | +0.1 | 1.6 | ||||||
| 2030 | 1.4 | - | 1.4 | ||||||
Note: Annual shock totals may differ from the cumulative shock indicated in the text due to rounding of change values.
In comparison to the baseline scenario:
— real and nominal GDP growth would show the same cumulative positive gap of 0.9 percentage points in 2027;
— approximately 23 100 additional jobs would be created overall in 2026 and 2027;
— the average unemployment rate would stand at 5.5% in 2026 and 4.6% in 2027;
— additional job gains would result in a larger increase in wages and salaries (cumulative positive gap of 0.8 percentage points in 2027) and stronger growth in consumption excluding food expenditures and shelter (cumulative positive gap of 1.4 percentage points in 2027);
— growth in the net operating surplus of corporations would show a cumulative positive gap of 2.6 percentage points in 2027;
— strong economic growth would support inflation, which would be slightly higher than under the baseline scenario but would nevertheless remain very close to the Bank of Canada's target range of 1% to 3%.
TABLE 42
Economic indicators in Québec in 2026 and 2027 -
Baseline and stronger growth scenarios
| (in nominal terms, percentage change and shock in percentage points, unless otherwise indicated) | |||||||||||||||||||||
| 2026 | 2027 | Cumulative effects | |||||||||||||||||||
| BL | Strong | Shock | BL | Strong | Shock | ||||||||||||||||
| GDP, in real terms | 0.7 | 0.9 | +0.2 | 1.4 | 2.1 | +0.7 | +0.9 | ||||||||||||||
| GDP | 3.4 | 3.6 | +0.2 | 3.4 | 4.1 | +0.7 | +0.9 | ||||||||||||||
| Consumer price index | 3.0 | 3.1 | +0.1 | 2.1 | 2.3 | +0.2 | +0.3 | ||||||||||||||
| Jobs (thousands) | −15.4 | −13.2 | +2.2 | 22.6 | 43.5 | +20.9 | +23.1 | ||||||||||||||
| Unemployment rate (per cent) |
5.6 | 5.5 | −0.1 | 4.9 | 4.6 | −0.3 | n/a | ||||||||||||||
| Wages and salaries | 3.3 | 3.5 | +0.2 | 3.5 | 4.1 | +0.6 | +0.8 | ||||||||||||||
| Net operating surplus of corporations |
4.8 | 5.3 | +0.5 | 1.1 | 3.2 | +2.1 | +2.6 | ||||||||||||||
| Consumption excluding food expenditures and shelter | 3.5 | 3.8 | +0.3 | 3.4 | 4.5 | +1.1 | +1.4 | ||||||||||||||
Note: "BL" corresponds to the baseline scenario while "Strong" corresponds to the stronger growth scenario.
❏ Two scenarios with asymmetrical impacts
The two alternative scenarios are not symmetrical in the short term, but become so after a few quarters. The asymmetry mainly results from the nature of the effects brought about by each situation.
From 2029 onward, the gap in real GDP between these two scenarios is around 1.4% in comparison to the baseline scenario.
| CHART 18 Change in real gross domestic product according to the scenarios in Québec |
| (millions of chained 2017 dollars) |
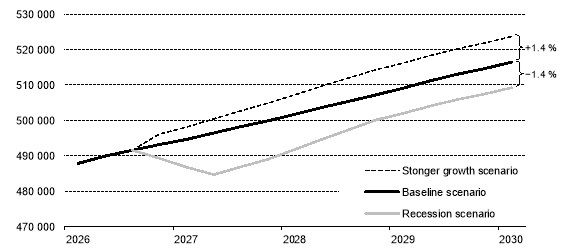 |
Sources: Institut de la statistique du Québec and Ministère des Finances du Québec.
7.3 Potential impacts on Québec's budgetary situation
The recession and stronger growth scenarios have an impact on the budgetary situation, mainly on own-source revenue and debt-servicing costs.
— Change in own-source revenue, particularly tax revenue, is closely tied to the one in the main economic indicators.
— Debt-servicing costs are linked, in particular, to budgetary deficits and interest rates.
If economic activity in Québec were to decline in the short term-for example, due to an escalation of the trade dispute with the United States-the budgetary balance would be expected to deteriorate by $11.9 billion over five years in comparison to the baseline scenario, resulting from:
— a $10.8-billion decrease in total own-source revenue;
— a $1.1-billion increase in debt-servicing costs.
Conversely, if the trade disputes were resolved and economic activity were to be stronger than that expected under the baseline scenario, an improvement in the budgetary balance of $9.0 billion over five years would be expected in comparison to the baseline scenario, resulting from:
— an $8.3-billion increase in total own-source revenue;
— a $0.7-billion decrease in debt-servicing costs.
TABLE 43
Additional impact of the alternative scenarios on the budgetary balance
| (millions of dollars) | |||||||||||||||||||||
| 2025- 2026 |
2026- 2027 |
2027- 2028 |
2028- 2029 |
2029- 2030 |
2030- 2031 |
Total | |||||||||||||||
| Budgetary balance(1) - Baseline scenario |
−7 791 | −7 690 | −5 695 | −1 500 | - | 250 | |||||||||||||||
| Additional impact of the recession scenario | |||||||||||||||||||||
| Own-source revenue | - | −729 | -3 150 | −2 428 | −2 214 | −2 300 | −10 821 | ||||||||||||||
| Debt service | - | −17 | −102 | −224 | −325 | −423 | −1 091 | ||||||||||||||
| Total additional impact | - | −746 | −3 252 | −2 652 | −2 539 | −2 723 | −11 912 | ||||||||||||||
| Adjusted budgetary balance(1),(2) | −7 791 | −8 436 | −8 947 | −4 152 | −2 539 | −2 473 | |||||||||||||||
| Additional impact of the stronger growth scenario | |||||||||||||||||||||
| Own-source revenue | - | 408 | 1 363 | 2 019 | 2 238 | 2 313 | 8 341 | ||||||||||||||
| Debt service | - | 9 | 48 | 122 | 215 | 314 | 708 | ||||||||||||||
| Total additional impact | - | 417 | 1 411 | 2 141 | 2 453 | 2 627 | 9 049 | ||||||||||||||
| Adjusted budgetary balance(1),(3) | −7 791 | −7 273 | −4 284 | 641 | 2 453 | 2 877 | |||||||||||||||
Note: Totals may not add due to rounding.
(1) Budgetary balance within the meaning of the Balanced Budget Act.
(2) The adjusted budgetary balance excludes the financial impacts of possible government intervention to stimulate economic recovery.
(3) The adjusted budgetary balance excludes the financial impacts of any additional initiatives that may be announced.
❏ Impacts on the budgetary balance and repercussions on the plan to restore fiscal balance
Presenting alternative scenarios helps illustrate how the budgetary balance could be affected if the economic situation were to take a different path than that expected.
If an escalation of the trade dispute with the United States were to occur, for example, it would significantly impact Québec's economic activity and, in turn, its budgetary forecasts.
— A downward impact on the budgetary balance of $2.6 billion per year, on average, would be expected in such a scenario as of 2028-2029.
Budgetary deficits would then be expected in all years of the financial framework and they would be higher than those expected until 2028-2029 under the baseline scenario.
— The budgetary deficit would be $4.2 billion in 2028-2029, exceeding the maximum deficit of $1.5 billion authorized by the Balanced Budget Act, and more than $2.5 billion in 2029-2030.
Use of the contingency reserve would limit the effects of any decline in economic activity and reduce pressure on the financial framework.
— However, this reserve would not be sufficient to ensure compliance with the requirements of the Balanced Budget Act, in particular the deficit target in 2028-2029, and to maintain the budgetary balance at equilibrium in 2029-2030.
— The government could then have to delay the return to a balanced budget or request a suspension of the application of the Balanced Budget Act to ensure public services continue to be delivered.
| CHART 19 Budgetary balance - Baseline and alternative scenarios |
| (billions of dollars) |
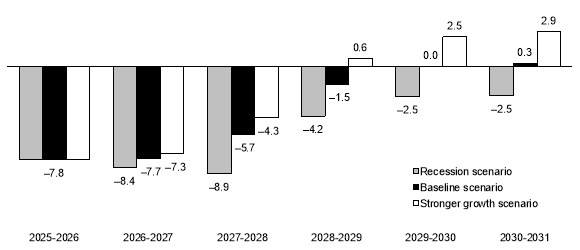 |
Notes: Budgetary balance within the meaning of the Balanced Budget Act.
These three scenarios include the gaps to be bridged included in the financial framework.
If, for example, trade disputes between the United States and Canada were resolved and economic activity in Québec was stronger than forecast under the baseline scenario, improvements would be expected in all years of the financial framework.
— Budgetary surpluses would be achieved starting in 2028-2029, owing to higher own-source revenue and lower debt service.
— An upward impact on the budgetary balance of $2.4 billion per year, on average, would be expected in such a scenario as of 2028-2029.
Deficits would be lower in the short term, and budget surpluses would be expected for the last three years of the financial framework.
— The budgetary surplus would be $641 million in 2028-2029 and $2.5 billion in 2029-2030.
Under this scenario, it would be possible to eliminate the gap to be bridged stated in the financial framework as of 2028-2029.
Use of the contingency reserve would not be necessary, since the expected deficits, after eliminating the gap to be bridged, would meet the requirements of the Balanced Budget Act.
— The deficit in 2028-2029 would be $1.2 billion, which is below the deficit target of $1.5 billion.
— The budgetary balance would remain in surplus starting in 2029-2030, after deposits of dedicated revenues in the Generations Fund.
The plan to restore fiscal balance by 2029-2030 would then be maintained.
TABLE 44
Maintaining a balanced budget - Stronger growth scenario
| (millions of dollars) | ||||||
| 2025-2026 | 2026-2027 | 2027-2028 | 2028-2029 | 2029-2030 | 2030-2031 | |
| Adjusted budgetary balance - Stronger growth scenario(1),(2) | −7 791 | −7 273 | −4 284 | 641 | 2 453 | 2 877 |
| Elimination of the gap to be bridged | - | - | - | −1 850 | −2 000 | −2 000 |
| Use of the contingency reserve | - | - | - | - | - | - |
| Budgetary balance with no gap to be bridged(1),(2) | −7 791 | −7 273 | −4 284 | −1 209 | 453 | 877 |
| Note: Totals may not add due to rounding. (1) Budgetary balance within the meaning of the Balanced Budget Act. (2) The budgetary balance excludes the financial impacts of any additional initiatives that may be announced. |
||||||
7.4 Potential impacts on Québec's net debt
Under the baseline scenario in the 2026 pre-election report, net debt will stand at $253.5 billion as at March 31, 2027, or 37.9% of GDP. Net debt to GDP is projected to decline to 36.0% as at March 31, 2031, tied, in part, to the improved budgetary situation and deposits of dedicated revenues in the Generations Fund. The net debt reduction targets, corresponding to a maximum limit of 38.0% of GDP by March 31, 2033 and 35.0% of GDP by March 31, 2038, would be met.
Under the recession scenario, net debt to GDP would be 2.1 percentage points higher as at March 31, 2031, bringing the ratio to 38.1%, or $11.9 billion higher than under the baseline scenario.
Under the stronger growth scenario, net debt to GDP would stand at 34.3% as at March 31, 2031, or 1.7 percentage points lower than under the baseline scenario.
— As under the baseline scenario, the net debt reduction targets would be met under both alternative scenarios.
| CHART 20 Net debt as at March 31 - Baseline and alternative scenarios |
| (percentage of GDP) |
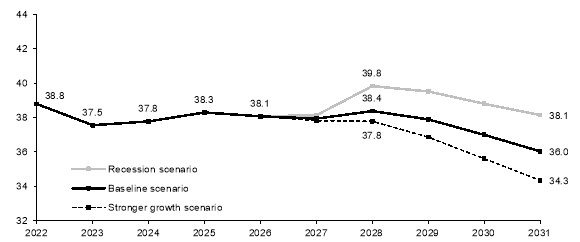 |
APPENDIX 1: DETAIL OF REVENUES FROM DUTIES, PERMITS AND ROYALTIES AS WELL AS MISCELLANEOUS REVENUE
❏ Detail of revenues from duties, permits and royalties
Revenues from duties, permits and royalties, which will average $6.9 billion from 2026-2027 to 2028-2029, include, in particular:
— driver's licence and registration revenues;
— revenue from natural resources;
— carbon market revenues.29
TABLE 45
Revenues from duties, permits and royalties
| (millions of dollars) | ||||||||||||
| 2025-2026 | 2026-2027 | 2027-2028 | 2028-2029 | |||||||||
| Motor vehicles(1) | 2 181 | 2 081 | 2 288 | 2 477 | ||||||||
| Natural resources(2) | 2 229 | 1 946 | 1 998 | 2 034 | ||||||||
| Greenhouse gas emissions(3) | 1 123 | 1 253 | 1 388 | 1 491 | ||||||||
| Other duties and permits(4) | 1 175 | 1 204 | 1 254 | 1 276 | ||||||||
| TOTAL | 6 708 | 6 484 | 6 928 | 7 278 | ||||||||
Note: Totals may not add due to rounding.
(1) These revenues mainly include fees for driver's licences and vehicle registrations.
(2) Corresponds primarily to revenues from mining, forest and water-power royalties.
(3) These revenues are those from the carbon market.
(4) Other duties and permits include, in particular, those of the Régie du bâtiment du Québec and the Autorité des marchés financiers (contributions, premiums, permits, licences, etc.) as well as royalties on the elimination of residual materials.
_______________________________________
29 Cap-and-trade system for greenhouse gas emission allowances.
❏ Miscellaneous revenue
Miscellaneous revenue, which will total on average $16.2 billion from 2026-2027 to 2028-2029, includes, in particular:
— revenue from services rendered, for example, health care facility accommodation fees, prescription drug insurance premiums and tuition fees;
— income on accounts receivable and loans, such as interest related to the main tax legislation;
— penalties, fines and recoveries, for example for violations of the Highway Safety Code;
— investment income from the Generations Fund.
TABLE 46
Miscellaneous revenue
| (millions of dollars) | ||||||||||||
| 2025-2026 | 2026-2027 | 2027-2028 | 2028-2029 | |||||||||
| Santé Québec(1) | 3 352 | 3 662 | 3 739 | 3 810 | ||||||||
| Bodies in the education and higher education networks(2) | 2 529 | 2 602 | 2 706 | 2 793 | ||||||||
| Prescription drug insurance fund(3) | 1 751 | 1 880 | 1 978 | 2 120 | ||||||||
| Interest, fines and recoveries of departments(4) | 2 155 | 2 337 | 2 220 | 2 217 | ||||||||
| Investment income of the Generations Fund | 771 | 890 | 838 | 948 | ||||||||
| Services rendered by departments | 441 | 484 | 534 | 576 | ||||||||
| Police Services Fund(5) | 454 | 467 | 481 | 493 | ||||||||
| Other miscellaneous revenue(6) | 3 469 | 3 468 | 3 613 | 3 786 | ||||||||
| TOTAL | 14 922 | 15 790 | 16 110 | 16 744 | ||||||||
Note: Totals may not add due to rounding.
(1) This revenue includes, in particular, revenue from places in CHSLDs, as well as parking and cafeteria revenues.
(2) This revenue includes, in particular, tuition fee and school transportation revenues.
(3) This revenue includes revenue from premiums paid by participants and persons aged 65 and over.
(4) This category includes other revenue, in particular that from unclaimed property turned over to the government.
(5) This revenue includes, in particular, revenue from the billing of municipalities.
(6) This revenue includes the miscellaneous revenue of nearly 90 other entities included in the government's reporting entity.
APPENDIX 2: DETAIL OF REVENUES FROM OTHER FEDERAL TRANSFER PROGRAMS
Revenues from other federal transfer programs, which will total on average $8.3 billion per year from 2026-2027 to 2028-2029, include revenue from federal transfers under Canada-Québec agreements,30 including:
— revenues from the Canada-Québec immigration agreement, the early learning and childcare agreement, and labour market transfer agreements, as well as the compensation Québec receives related to the Canada Student Financial Assistance Program;
— revenue from federal transfers related to housing and infrastructure agreements.
TABLE 47
Revenues from other federal transfer programs
| (millions of dollars) | ||||||||||||
| 2025-2026 | 2026-2027 | 2027-2028 | 2028-2029 | |||||||||
| General Fund, including: | 3 732 | 5 273 | 4 405 | 3 803 | ||||||||
| - asymmetrical childcare agreement | 1 732 | 1 725 | 1 724 | 1 765 | ||||||||
| - additional funding for childcare services | - | 515 | 662 | - | ||||||||
| - Canada-Québec immigration agreement | 867 | 897 | 934 | 949 | ||||||||
| - compensation related to the Canada Student Financial Assistance Program | 938 | 1 086 | 797 | 823 | ||||||||
| Special funds(1) | 586 | 912 | 1 326 | 1 428 | ||||||||
| Non-budget-funded bodies(2) | 1 677 | 1 569 | 1 774 | 1 677 | ||||||||
| Other(3) | 629 | 986 | 986 | 896 | ||||||||
| TOTAL | 6 624 | 8 740 | 8 491 | 7 804 | ||||||||
(1) These revenues include, in particular, federal transfer revenue of the Land Transportation Network Fund (LTNF).
(2) These revenues include, in particular, federal transfer revenue of the Société de financement des infrastructures locales du Québec (SOFIL) and the Société d'habitation du Québec (SHQ).
(3) These other revenues include, among other things, federal transfer revenue of specified purpose accounts and consolidation adjustments.
_______________________________________
30 On June 2, 2026, nearly $10 billion over 10 years in federal transfers for infrastructure in Québec were announced: $1.3 billion under the Baseline Funding stream of the Canada Public Transit Fund, $4.4 billion for strategic projects under the Canada Public Transit Fund, $1 billion for infrastructure in the health sector under the Build Communities Strong Fund, nearly $2.7 billion for infrastructure related to housing and post-secondary education under the Build Communities Strong Fund, of which $1 billion was allocated to water infrastructure on June 16, 2026, and $400 million for 11 projects under the Zero Emission Transit Fund. These revenues have been incorporated into the financial framework, with the exception of the $4.4 billion for strategic projects under the Canada Public Transit Fund and a portion ($1.7 billion) of the envelope for infrastructure related to housing and post-secondary education under the Build Communities Strong Fund, which has not yet been allocated. These will be incorporated once the projects to be funded are known. It should be noted that, as a corresponding entry will be recorded in expenditures, the incorporation of these revenues will have no effect on the budgetary balance.
APPENDIX 3: ADDITIONAL INFORMATION ON PORTFOLIO EXPENDITURE FORECASTS
TABLE 48
Change in expenditures by departmental portfolio
| (millions of dollars) | ||||||
| 2025-2026 | 2026-2027 | |||||
| National Assembly | 196 | 199 | ||||
| Officers of the National Assembly | 160 | 297 | ||||
| Affaires municipales et Habitation | 5 253 | 5 863 | ||||
| Agriculture, Pêcheries et Alimentation | 1 525 | 1 591 | ||||
| Conseil du trésor, Administration gouvernementale et Efficacité de l'État | 1 224 | 1 560 | ||||
| Conseil exécutif | 612 | 630 | ||||
| Culture et Communications | 2 149 | 2 043 | ||||
| Cybersécurité et Numérique | 345 | 353 | ||||
| Économie, Innovation et Énergie | 4 365 | 4 506 | ||||
| Éducation | 23 541 | 24 411 | ||||
| Emploi et Solidarité sociale | 5 811 | 6 358 | ||||
| Enseignement supérieur | 11 183 | 11 847 | ||||
| Environnement, Lutte contre les changements climatiques, Faune et Parcs | 1 802 | 1 979 | ||||
| Famille | 9 633 | 10 067 | ||||
| Finances | 4 267 | 4 048 | ||||
| Immigration, Francisation et Intégration | 529 | 563 | ||||
| Justice | 2 524 | 2 050 | ||||
| Langue française | 74 | 80 | ||||
| Relations internationales et Francophonie | 150 | 148 | ||||
| Ressources naturelles et Forêts | 1 293 | 1 514 | ||||
| Santé et Services sociaux | 65 945 | 69 991 | ||||
| Sécurité intérieure | 3 272 | 2 902 | ||||
| Tourisme | 529 | 552 | ||||
| Transports et Mobilité durable | 9 176 | 7 869 | ||||
| Travail | 224 | 260 | ||||
| Reallocation of expenditures during the fiscal year | - | −600 | ||||
| TOTAL | 155 782 | 161 081 | ||||
Note: Totals may not add due to rounding.
APPENDIX 4: LIST OF ENTITIES BY DEPARTMENTAL PORTFOLIO
The budgetary structure of forecasts in the pre-election report does not take into account changes resulting from the April 2026 cabinet shuffle, with the exception of the change concerning the Ministère de la Sécurité publique, which became the Ministère de la Sécurité intérieure.
TABLE 49
| Entities included in the government's reporting entity |
| Affaires municipales et Habitation | |
| Ministère des Affaires municipales et de l'Habitation | Dept |
| Commission municipale du Québec | BFB |
| Administrative Housing Tribunal | BFB |
| Commission de la Capitale-Nationale du Québec | NBFB |
| Société d'habitation du Québec | NBFB |
| Capitale-Nationale Region Fund | SF |
| Regions and Rurality Fund | SF |
| Agriculture, Pêcheries et Alimentation | |
| Ministère de l'Agriculture, des Pêcheries et de l'Alimentation | Dept |
| Commission de protection du territoire agricole du Québec | BFB |
| Régie des marchés agricoles et alimentaires du Québec | BFB |
| Institut de technologie agroalimentaire du Québec | NBFB |
| La Financière agricole du Québec | NBFB |
| National Assembly | |
| National Assembly | Other |
| Conseil du trésor, Administration | |
| gouvernementale et Efficacité de l'État | |
| Secrétariat du Conseil du trésor | Dept |
| Commission de la fonction publique | BFB |
| Autorité des marchés publics | NBFB |
| Centre d'acquisitions gouvernementales | NBFB |
| Société québécoise des infrastructures | NBFB |
| Conseil exécutif | |
| Ministère du Conseil exécutif | Dept |
| Commission d'accès à l'information | BFB |
| Culture et Communications | |
| Ministère de la Culture et des Communications | Dept |
| Conseil du patrimoine culturel du Québec | BFB |
| Bibliothèque et Archives nationales du Québec | NBFB |
| Conseil des arts et des lettres du Québec | NBFB |
| Conservatoire de musique et d'art dramatique du Québec | NBFB |
| Musée d'Art contemporain de Montréal | NBFB |
| Musée de la Civilisation | NBFB |
| Musée national de l'histoire du Québec | NBFB |
| Musée national des beaux-arts du Québec | NBFB |
| Société de développement des entreprises culturelles | NBFB |
| Société de la Place des Arts de Montréal | NBFB |
| Société de télédiffusion du Québec (Télé-Québec) | NBFB |
| Société du Grand Théâtre de Québec | NBFB |
| Avenir Mécénat Culture Fund | SF |
| Québec Cultural Heritage Fund | SF |
| Cybersécurité et Numérique | |
| Ministère de la Cybersécurité | |
| et du Numérique | Dept |
| Cybersecurity and Digital Technology Fund | SF |
| Économie, Innovation et Énergie | |
| Ministère de l'Économie, de l'Innovation et de l'Énergie | Dept |
| Commission de l'éthique en science | |
| et en technologie | BFB |
| Fonds de recherche du Québec | NBFB |
| Régie de l'énergie | NBFB |
| Natural Resources and Energy Capital Fund | SF |
| Natural Resources Fund (Fossil Energy Management component) | SF |
| Economic Development Fund | SF |
| Québec Enterprise Growth Fund | SF |
| Legend: Dept: department; BFB: budget-funded body; SF: special fund; NBFB: non-budget-funded body; HSSE: bodies in the health and social services, education and higher education networks. |
TABLE 49
| Entities included in the government's reporting entity (cont.) |
| Éducation | |
| Ministère de l'Éducation | Dept |
| Commission consultative de l'enseignement privé | BFB |
| Recreation and sports integrity ombudsman | BFB |
| National Student Ombudsman | BFB |
| Institut national des mines | NBFB |
| Institut national d'excellence en éducation | NBFB |
| Société des établissements de plein air du Québec | NBFB |
| Sports and Physical Activity Development Fund | SF |
| School service centres and school boards | HSSE |
| Emploi et Solidarité sociale | |
| Ministère de l'Emploi et de la Solidarité sociale | Dept |
| Commission des partenaires du marché du travail | BFB |
| Cree Hunters Economic Security Board | NBFB |
| Assistance Fund for Independent Community Action | SF |
| Labour Market Development Fund | SF |
| Goods and Services Fund | SF |
| Information Technology Fund of the Ministère de l'Emploi et de la Solidarité sociale | SF |
| Québec Fund for Social Initiatives | SF |
| Enseignement supérieur | |
| Ministère de l'Enseignement supérieur | Dept |
| Comité consultatif sur l'accessibilité financière aux études | BFB |
| Commission d'évaluation de l'enseignement collégial | BFB |
| Conseil de l'enseignement supérieur(1) | BFB |
| Institut de tourisme et d'hôtellerie | |
| du Québec | NBFB |
| University Excellence and Performance Fund | SF |
| General and vocational colleges (CEGEPs) | HSSE |
| Université du Québec and its constituents | HSSE |
| Environnement et Lutte contre les changements climatiques, Faune et Parcs |
|
| Ministère de l'Environnement, de la Lutte | |
| contre les changements climatiques, | |
| de la Faune et des Parcs | Dept |
| Bureau d'audiences publiques sur | |
| l'environnement | BFB |
| Fondation pour la biodiversité et | |
| la faune du Québec | NBFB |
| Société québécoise de récupération et | |
| de recyclage | NBFB |
| Blue Fund | SF |
| Electrification and Climate Change Fund | SF |
| Fund for the Protection of the Environment and | |
| the Waters in the Domain of the State | SF |
| Natural Resources Fund (Wildlife Conservation and | |
| Development component) | SF |
| Famille | |
| Ministère de la Famille | Dept |
| Public Curator | BFB |
| Educational Childcare Services Fund | SF |
| Finances | |
| Ministère des Finances | Dept |
| Agence du revenu du Québec | NBFB |
| Autorité des marchés financiers | NBFB |
| Institut de la statistique du Québec | NBFB |
| Société de financement des infrastructures | |
| locales du Québec | NBFB |
| Fonds d'aide à la clientèle domestique | |
| d'Hydro-Québec | SF |
| Financing Fund | SF |
| Special Contracts and Financial Assistance | |
| for Investment Fund | SF |
| Fund to Combat Addiction | SF |
| Generations Fund | SF |
| IFC Montréal Fund | SF |
| Northern Plan Fund | SF |
| Fund of the Financial Markets Administrative | |
| Tribunal | SF |
| Tax Administration Fund | SF |
| Government enterprises(2) | Other |
|
(1) The activities of the Conseil supérieur de l'éducation were transferred to the Conseil de l'enseignement supérieur and to the Institut national d'excellence en éducation on April 1, 2026. (2) From a financial perspective, the net income of government enterprises is charged to the Finances portfolio. However, the governance of a government enterprise may fall under another portfolio. |
TABLE 49
| Entities included in the government's reporting entity (cont.) |
| Immigration, Francisation et Intégration | |
| Ministère de l'Immigration, de la Francisation | |
| et de l'Intégration | Dept |
| Justice | |
| Ministère de la Justice | Dept |
| Committee on the remuneration of judges | BFB |
| Committee on the remuneration of criminal and | |
| penal prosecuting attorneys | BFB |
| Commission des droits de la personne et | |
| des droits de la jeunesse | BFB |
| Conseil de la justice administrative | BFB |
| Conseil de la magistrature | BFB |
| Director of Criminal and | |
| Penal Prosecutions | BFB |
| Office de la protection du consommateur | BFB |
| Human Rights Tribunal | BFB |
| Commission des services juridiques | NBFB |
| Fonds d'aide aux actions collectives | NBFB |
| Société québécoise d'information juridique | NBFB |
| Access to Justice Fund | SF |
| Fund dedicated to assistance for persons who are | |
| victims of criminal offences | SF |
| Register Fund of the Ministère de la Justice | SF |
| Fund of the Administrative Tribunal of Québec | SF |
| Langue française | |
| Ministère de la Langue française | Dept |
| Commission de toponymie | BFB |
| Office québécois de la langue française | BFB |
| Centre de la francophonie des Amériques | NBFB |
| Officers of the National Assembly | |
| French Language Commissioner | BFB |
| Ethics Commissioner | BFB |
| Commissioner for Children's | |
| Well-Being and Rights | BFB |
| Commissioner of Lobbying | BFB |
| Chief Electoral Officer | BFB |
| Public Protector | BFB |
| Auditor General | BFB |
| Relations internationales et Francophonie | |
| Ministère des Relations internationales et de la | |
| Francophonie | Dept |
| Office Québec-Monde pour la jeunesse | NBFB |
| Ressources naturelles et Forêts | |
| Ministère des Ressources naturelles | |
| et des Forêts | Dept |
| Société de développement de la Baie-James | NBFB |
| Société du Plan Nord | NBFB |
| Natural Resources Fund (Forestry, Sustainable Forest Development, Mining Heritage and Mining | |
| Activity Management components) | SF |
| Territorial Information Fund | SF |
| Santé et Services sociaux | |
| Ministère de la Santé et des Services sociaux | Dept |
| Health and Welfare Commissioner | BFB |
| Conseil du statut de la femme | BFB |
| Office des personnes handicapées du Québec | BFB |
| Prescription Drug Insurance Fund | NBFB |
| Héma-Québec | NBFB |
| Institut national de santé publique du Québec | NBFB |
| Institut national d'excellence en santé et | |
| en services sociaux | NBFB |
| Régie de l'assurance maladie du Québec | NBFB |
| Santé Québec | NBFB |
| Urgences-santé | NBFB |
| Cannabis Prevention and | |
| Research Fund | SF |
| Institutions serving northern and | |
| Indigenous communities | HSSE |
TABLE 49
| Entities included in the government's reporting entity (cont.) |
| Sécurité intérieure | |
| Ministère de la Sécurité intérieure | Dept |
| Bureau des enquêtes indépendantes | BFB |
| Bureau du coroner | BFB |
| Police Ethics Commissioner | BFB |
| Anti-Corruption Commissioner | BFB |
| Commission québécoise des libérations | |
| conditionnelles | BFB |
| Régie des alcools, des courses et des jeux | BFB |
| Tribunal administratif de déontologie policière | BFB |
| École nationale de police du Québec | NBFB |
| École nationale des pompiers du Québec | NBFB |
| Police Services Fund | SF |
| Tourisme | |
| Ministère du Tourisme | Dept |
| Société de développement et de mise | |
| en valeur du Parc olympique | NBFB |
| Société du Centre des congrès de Québec | NBFB |
| Société du Palais des congrès de Montréal | NBFB |
| Tourism Partnership Fund | SF |
| Transports et Mobilité durable | |
| Ministère des Transports et | |
| de la Mobilité durable | Dept |
| Commission des transports du Québec | BFB |
| Mobilité Infra Québec | NBFB |
| Société de l'assurance automobile | |
| du Québec | NBFB |
| Société des Traversiers du Québec | NBFB |
| Air Service Fund | SF |
| Rolling Stock Management Fund | SF |
| Highway Safety Fund | SF |
| Land Transportation Network Fund | SF |
| Travail | |
| Ministère du Travail | Dept |
| Office des professions du Québec | NBFB |
| Régie du bâtiment du Québec | NBFB |
| Administrative Labour Tribunal Fund | SF |
APPENDIX 5: UPCOMING CHANGES TO ACCOUNTING STANDARDS
The Public Sector Accounting Board (PSAB) has published two new accounting standards that will be effective for the government's consolidated financial statements beginning in fiscal 2026-2027 and 2029-2030.
❑ Financial statement presentation
Section PS 1202 - Financial Statement Presentation came into force on April 1, 2026. The financial impacts of its application are limited to the government's net debt indicator, which is replaced by net financial liability. Calculating the new indicator results in an estimated 0.9 percentage point reduction in net debt to GDP in 2026-2027. The coming into force of this new standard has no impact on the budgetary balance.
In addition, the accumulated deficit is renamed "net liabilities," but its calculation remains the same. Lastly, gross debt, a concept not standardized by the PSAB, continues to be calculated in the same way. The government will restate the figures for comparative fiscal 2025-2026 to meet the presentation requirements of the new standard.
❑ Employee benefits
Section PS 3251 − Employee Benefits will come into force on April 1, 2029. As for the financial impacts of this new standard, analyses were done but some elements are being finalized. Accordingly, no impacts were incorporated in the government's expenditure and debt forecasts.
In accordance with the Balanced Budget Act, the retroactive effect of any new accounting standard issued by the PSAB and applied directly to the accumulated deficits, that is, for the years preceding the year of its implementation as recommended by the PSAB, is excluded from the calculation of the budgetary balance of the fiscal year for the purposes of this Act. The government will apply this new standard retroactively.
APPENDIX 6: REQUIREMENTS UNDER THE ACT RESPECTING THE MINISTÈRE DES FINANCES AND THE AUDITOR GENERAL ACT
❑ Act respecting the Ministère des Finances (chapter M-24.01)
▪ Chapter III.1 Pre-election report
23.1. The Minister shall publish a pre-election report on the third Monday of August preceding the expiry of a Legislature as provided for in section 6 of the Act respecting the National Assembly (chapter A-23.1).
If a Legislature expires in February, the Minister shall publish a new pre-election report on the Monday immediately preceding the expiry.
The assurance report prepared in accordance with section 40.1 of the Auditor General Act (chapter V-5.01) must be attached to the pre-election report. It contains the Auditor General's conclusion on the plausibility, as at the last working day of the sixth week preceding the date of publication of the pre-election report or as at a later date if the Auditor General considers it appropriate, as well as forecasts, projections, estimates and assumptions referred to in sections 23.2 and 23.3.
23.2. The Minister shall include the following in the pre-election report, with any necessary revisions:
1° the economic forecasts and assumptions appearing in the Budget Plan presented in the most recent Budget Speech;
2° the projected components of the government's financial framework appearing in the Budget Plan;
3° the estimated expenditures, established in collaboration with the Chair of the Conseil du trésor and broken down by field of State activity;
4° the reports required under section 9 of the Balanced Budget Act (chapter E-12.00002) and section 11 of the Act to reduce the debt and establish the Generations Fund (chapter R-2.2.0.1).
23.3. The projected components of the government's financial framework must be presented for a period of five consecutive fiscal years, and the estimated expenditures, broken down by field of State activity, for a period of three consecutive fiscal years, beginning, in both cases, with the fiscal year that includes the date on which the report was published.
23.4. The Minister shall send the draft pre-election report to the Auditor General not later than the first working day of the ninth week preceding its publication date to enable the Auditor General to
prepare the assurance report required under section 40.1 of the Auditor General Act (chapter V-5.01).
23.4.1. The Minister may, until the last working day of the sixth week preceding the date of publication of the pre-election report, make changes to the draft pre-election report, especially on the basis of data available at the time of its updating.
23.4.2. A preliminary draft of the financial framework shall be sent to the Auditor General on:
1° in the case of the pre-election report referred to in the first paragraph of section 23.1, the fifth working day after the 20 June preceding the expiry of a Legislature as provided for in the first paragraph of section 6 of the Act respecting the National Assembly (chapter A-23.1);
or 2° in the case of the pre-election report referred to in the second paragraph of section 23.1, the first working day before 21 December preceding the expiry of a Legislature as provided for in the third paragraph of section 6 of the Act respecting the National Assembly.
The Minister shall inform the Auditor General of any change the Minister makes to a draft pre-election report under the first paragraph on or before the last working day of the sixth week preceding the date of publication of the pre-election report.
The Minister may also, after the time provided for in the second paragraph, make any other change to the draft pre-election report that arises from the Auditor General's work. Those changes are sent to the Auditor General without delay.
23.5. On the date the pre-election report is published, the Minister shall send it, with the Auditor
General's assurance report attached, to the President of the National Assembly, who shall table them before the National Assembly within three days after receiving it or, if the Assembly is not sitting, within three days of the opening of the next session or resumption.
As soon as the pre-election report and attached assurance report are sent to the President of the National Assembly, the Minister shall publish them by any means the Minister considers appropriate, without waiting for the President to table them.
❑ Auditor General Act (chapter V-5.01)
▪ Division III
Audit and reports
▪ 2.1. - Assurance reports on the pre-election report
40.1. The Auditor General shall prepare an assurance report giving his conclusion on the plausibility of the forecasts and assumptions presented in the pre-election report published by the Minister of Finance under section 23.1 of the Act respecting the Ministère des Finances (chapter M-24.01). The Auditor General may include in the report any comments he considers appropriate in connection with his work involving the pre-election report.
In his report, the Auditor General shall also indicate whether he received all requested information and documents for the preparation of the report.
40.2. The assurance report must cover at least the first three fiscal years reported on in the pre-election report.
However, with regard to the forecasts presented in a pre-election report published in February, the assurance report must cover at least the three fiscal years following the fiscal year that includes the date on which the pre-election report was published.
40.3. The Auditor General shall submit the assurance report to the Minister of Finance not later than the Monday preceding the date of publication of the pre-election report required under section 23.1 of the Act respecting the Ministère des Finances (chapter M-24.01).
40.4. The Auditor General may, if he considers it appropriate, prepare a report detailing his assurance work on the pre-election report.
On or before the date of publication of the pre-election report, the detailed report must be sent by the Auditor General to the President of the National Assembly, who shall table it before the National Assembly along with the pre-election report.
It is published by the Auditor General by any means he considers appropriate, following the publication of the pre-election report by the Minister of Finance, without waiting for the President of the National Assembly to table it.