PAY VERSUS PERFORMANCE
The following table presents certain information regarding compensation paid to Super League’s Principal Executive Officer (“PEO”) and other Named Executive Officers (“Other NEOs” or “Non-PEOs”), and certain measures of financial performance, for the years ended December 31, 2025, 2024 and 2023. The amounts shown below are calculated in accordance with Item 402(v) of Regulation S-K. The Compensation Committee believes that 2025 compensation decisions for the PEO and Non-PEOs are reflective of Super League’s overall operating, strategic, financial and stock price performance and thus aligned with stockholders.
Pay Versus Performance Table
|
Year |
Summary Compensation Table Total for PEO #1(1) |
Compensation Actually Paid to PEO #1(2) |
Summary Compensation Table Total for PEO #2(1) |
Compensation Actually Paid to PEO #2(2) |
Average Summary Compensation Total for Non- PEO Named Executive Officers (3) |
Average Compensation Actually Paid to Non-PEO Named Executive Officers (4) |
Value of Initial $100 Investment based on Total Shareholder Return |
Net Loss ($) (in thousands) |
||||||||||||||||||||||||
|
2025 |
$ | 2,241,000 | $ | 2,263,000 | $ | 482,000 | $ | 321,000 | 1,229,000 | $ | 1,273,000 | $ | 0.23 | $ | (20,717 | ) | ||||||||||||||||
|
2024 |
$ | 330,000 | $ | 330,000- | $ | 425,000 | $ | 425,000 | 323,000 | $ | 323,000 | $ | 9.18 | $ | (16,635 | ) | ||||||||||||||||
|
2023 |
$ | 485,000 | $ | 330,000- | $ | 1,373,000 | $ | 631,000 | 623,000 | $ | 435,000 | $ | 22.59 | $ | (30,330 | ) | ||||||||||||||||
|
(1) |
Matthew Edelman (PEO #1) served as our PEO during the year ended December 31, 2025, beginning April 2025. Ann Hand (PEO #2) served as our PEO from January 2025 through March 2025, and served as our PEO during the years ended December 31, 2024 and 2023. |
|
(2) |
The following amounts were added and deducted to the Summary Compensation Table (“SCT”) amount to determine the compensation actually paid to the PEO as determined in accordance with SEC regulations.
The amounts reflected in the tables below, similar to the equity award values reflected in the SCT, do not represent the actual value that may be realized by the individuals referenced in the table, as the fair value of equity awards is determined based on an estimate of fair value calculated in accordance with ASC 718. The fair value of restricted stock and restricted stock unit awards is determined by the product of the number of shares or units granted and the applicable measurement date market price of the underlying Common Stock. The fair value of stock option and common stock purchase warrant awards is estimated on the measurement date utilizing the Black-Scholes-Merton option pricing model. As such, the applicable amounts included in the tables below do not represent the actual value that may be realized by the Named Executive Officers. |
|
PEO #1 |
||||
|
|
2025 |
|||
| Adjustments to Determine Compensation “Actually Paid” | ||||
|
Reported Summary Compensation Table Total |
$ | 2,241,000 | ||
|
Less: Reported Fair Value of Equity Awards |
(1,895,000 | ) | ||
|
Add: Year End Fair Value of Equity Awards Granted During Year |
1,958,000 | |||
|
Add: Change in Fair Value of Outstanding and Unvested Equity Awards Granted in a Prior Year |
- | |||
|
Add: Fair Value as of Vesting Date of Equity Awards Granted and Vested in the Same Year |
(41,000 | ) | ||
|
Add: Change in Fair Value of Equity Awards Granted in Prior Years that Vested in the Year |
- | |||
|
Less: Fair Value at the End of the Prior Year of Equity Awards that Failed to Meet Vesting Conditions in the Year |
||||
|
Add: Dollar Value of Incremental Dividends or Earnings Paid on Equity Awards |
- | |||
| - | ||||
|
Total Compensation Actually Paid |
$ | 2,263,000 | ||
|
PEO #2 |
||||
|
|
2025 |
|||
| Adjustments to Determine Compensation “Actually Paid” | ||||
|
Reported Summary Compensation Table Total |
$ | 482,000 | ||
|
Less: Reported Fair Value of Equity Awards |
(80,000 | ) | ||
|
Add: Year End Fair Value of Equity Awards Granted During Year |
1,000 | |||
|
Add: Change in Fair Value of Outstanding and Unvested Equity Awards Granted in a Prior Year |
- | |||
|
Add: Fair Value as of Vesting Date of Equity Awards Granted and Vested in the Same Year |
(8,000 | ) | ||
|
Add: Change in Fair Value of Equity Awards Granted in Prior Years that Vested in the Year |
- | |||
|
Less: Fair Value at the End of the Prior Year of Equity Awards that Failed to Meet Vesting Conditions in the Year |
||||
|
Add: Dollar Value of Incremental Dividends or Earnings Paid on Equity Awards |
- | |||
| - | ||||
|
Total Compensation Actually Paid |
$ | 321,000 | ||
|
(3) |
For the year ended December 31, 2025, Mr. Haynes was our Other NEO. |
|
(4) |
For our other Named Executive Officers, the following amounts were added and deducted to the Summary Compensation Table amount to determine the compensation actually paid as determined in accordance with SEC regulations. |
|
NEO |
||||
|
|
2025 |
|||
| Adjustments to Determine Compensation “Actually Paid” | ||||
|
Reported Summary Compensation Table Total |
$ | 1,229,000 | ||
|
Less: Reported Fair Value of Equity Awards |
(929,000 | ) | ||
|
Add: Year End Fair Value of Equity Awards Granted During Year |
973,000 | |||
|
Add: Change in Fair Value of Outstanding and Unvested Equity Awards Granted in a Prior Year |
- | |||
|
Add: Fair Value as of Vesting Date of Equity Awards Granted and Vested in the Same Year |
- | |||
|
Add: Change in Fair Value of Equity Awards Granted in Prior Years that Vested in the Year |
- | |||
|
Less: Fair Value at the End of the Prior Year of Equity Awards that Failed to Meet Vesting Conditions in the Year |
||||
|
Add: Fair Value of Incremental Dividends or Earnings Paid on Equity Awards |
- | |||
| - | ||||
|
Total Compensation Actually Paid |
$ | 1,273,000 | ||
Analysis of the Information Presented in the Pay Versus Performance Table
We generally seek to incentivize long-term performance, and therefore do not specifically align our performance measures with “compensation actually paid” (as computed in accordance with Item 402(v) of Regulation S-K) for a particular year. In accordance with Item 402(v) of Regulation S-K, we are providing the following descriptions of the relationships between information presented in the Pay Versus Performance table.
The graphics below illustrate the relationship between the Compensation Actually Paid to the PEOs and the average of the non-PEO NEOs and (i) total shareholder return for Super League and (ii) net income (net loss), in each case, for fiscal year 2023, fiscal year 2024 and fiscal year 2025.
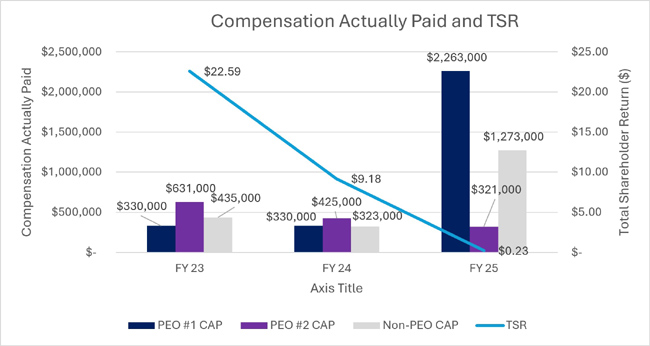
This graph compares Compensation Actually Paid to PEO #1 and PEO #2 and the average Compensation Actually Paid to the non-PEO NEOs with Super League’s total shareholder return. TSR assumes an initial fixed investment of $100 immediately prior to the beginning of fiscal year 2023 and reflects cumulative returns through the end of each fiscal year. Super League has not included peer group TSR, consistent with scaled disclosure requirements applicable to smaller reporting companies.
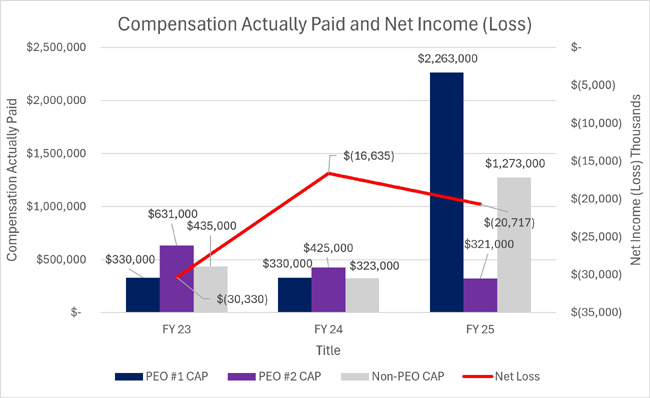
This graph compares Compensation Actually Paid to PEO #1 and PEO #2 and the average Compensation Actually Paid to the non-PEO NEOs with Super League’s net income (loss) for each of fiscal years 2023, 2024 and 2025. Super League has not historically looked to net income (loss) as a performance measure for our executive compensation program.
Compensation Actually Paid and Cumulative TSR
We do utilize several performance measures to align executive compensation with Super League’s performance, but the recent trend has not used financial performance measures such as TSR. See the preceding discussion of the performance measures we use with respect to executive compensation in this section of this Proxy Statement. For example, as described in more detail above, part of the compensation our NEOs are eligible to receive consists of annual performance-based cash bonuses and equity awards that are designed to provide appropriate incentives to our executives to achieve defined annual corporate goals.
All information provided above under the “Pay Versus Performance” heading will not be deemed to be incorporated by reference in any filing of Super League under the Securities Act, whether made before or after the date hereof and irrespective of any general incorporation language in any such filing.