Exhibit 99.1
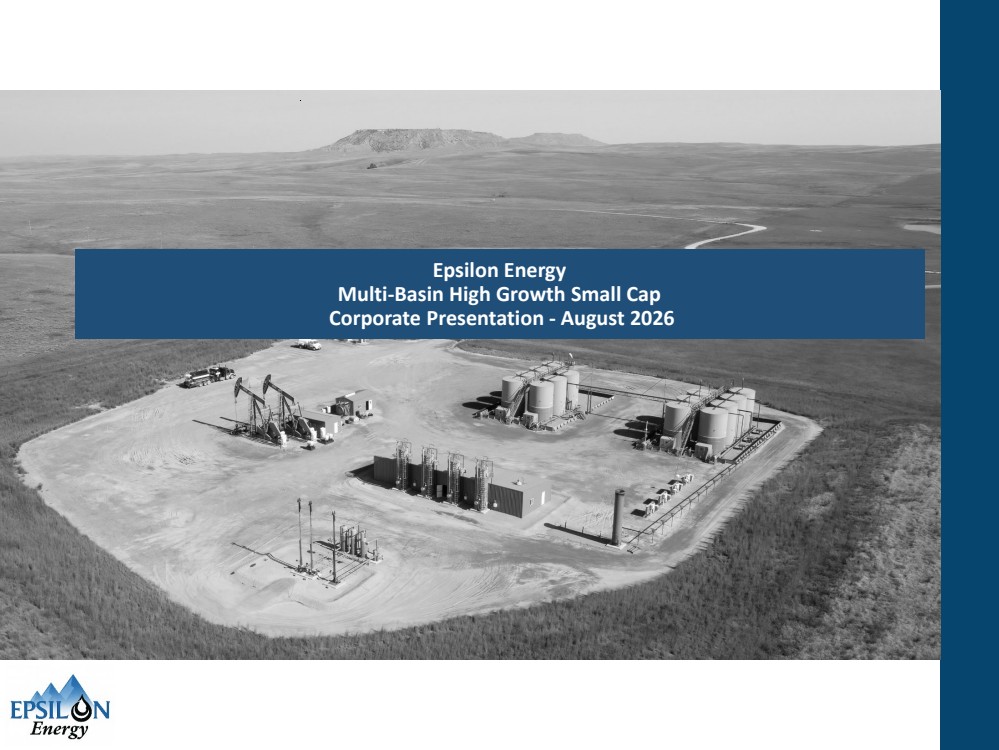
| Epsilon Energy Multi-Basin High Growth Small Cap Corporate Presentation - August 2026 |
| Disclaimers 2 Certain statements contained in this presentation constitute forward looking statements. The use of any of the words “anticipate”, “continue”, “estimate”, “expect”, ‘may”, “will”, “project”, “should”, ‘believe”, and similar expressions are intended to identify forward-looking statements. These statements involve known and unknown risks, uncertainties and other factors that may cause actual results or events to differ materially from those anticipated. Forward-looking statements are based on reasonable assumptions, but no assurance can be given that these expectations will prove to be correct. There are a number of important factors that could cause actual results to differ materially from those suggested or indicated by the forward-looking statements. Additional information regarding the factors that may cause actual results to differ materially from these forward-looking statements is available in our filings with the Securities and Exchange Commission, including but not limited to our Annual Report on Form 10-K for the year ended December 31, 2025 and our Quarterly Reports on Form 10-Qfor subsequent periods. The reserves and associated future net revenue information set forth in this presentation are estimates only. In general, estimates of oil and natural gas reserves and the future net revenue therefrom are based upon a number of variable factors and assumptions, such as production rates, ultimate reserves recovery, timing and amount of capital expenditures, ability to transport production, marketability of oil and natural gas, royalty rates, the assumed effects of regulation by governmental agencies and future operating costs, all of which may vary materially from actual results. For those reasons, estimates of the oil and natural gas reserves attributable to any particular group of properties, as well as the classification of such reserves and estimates of future net revenues associated with such reserves prepared by different engineers (or by the same engineers at different times) may vary. Our actual reserves may be greater or less than those calculated. In addition, our actual production, revenues, development and operating expenditureswill vary fromestimates thereof and such variations could be material. Statements relating to "reserves" are deemed to be forward-looking statements as they involve the implied assessment, based on certain estimates and assumptions, that the reserves described exist in the quantities predicted or estimated and can be profitably produced in the future. There is no assurance that forecast price and cost assumptionswill be attained and variances could be material. Proved reserves are those reserves which are most certain to be recovered. Probable reserves are those additional reserves that are less certain to be recovered than Proved reserves but which, together with Proved reserves, are as likely as not to be recovered. Undeveloped reserves are those reserves expected to be recovered from known accumulations where a significant expenditure (for example, when compared to the cost of drilling a well) is required to render them capable of production. They must fully meet the requirements of the reserves classification (Proved or Probable) to which they are assigned. The estimates of reserves and future net revenue for individual properties may not reflect the same confidence level as estimates of reserves and future net revenue for all properties due to the effects of aggregation. The estimated future netrevenues contained in this presentation do not necessarily representthe fair market value of our reserves. Viewers are cautioned that the assumptions used in the preparation of such information, although considered reasonable at the time of preparation, may prove to be imprecise, and as such, undue reliance should not be placed on forward-looking statements. Our actual results, performance or achievement could differ materially from those expressed in, or implied by, these forward-looking statements, and accordingly, no assurance can be given that any of the events anticipated by the forward-looking statements will transpire or occur, or, if any of them do, what benefits that we will derive therefrom. We disclaim any intention or obligation to update or revise any forward-looking statements, whether as a result of new information, future events or otherwise. This presentation is neither an offer to sell nor a solicitation of any offer to buy any securities. This presentation does not contain all of the information necessary to make an investment decision. The contents of this presentation are based upon conditions as they exist on the date of this presentation, and, except where otherwise indicated, reflect information as at the date of this presentation. By delivering this presentation we do not undertake to update any of the information, representations, or conclusions contained herein. The information and comments provided are strictly for information purposes only, and are not to be construed in any way as invitations to purchase securities, nor distributed to others for said purpose. |
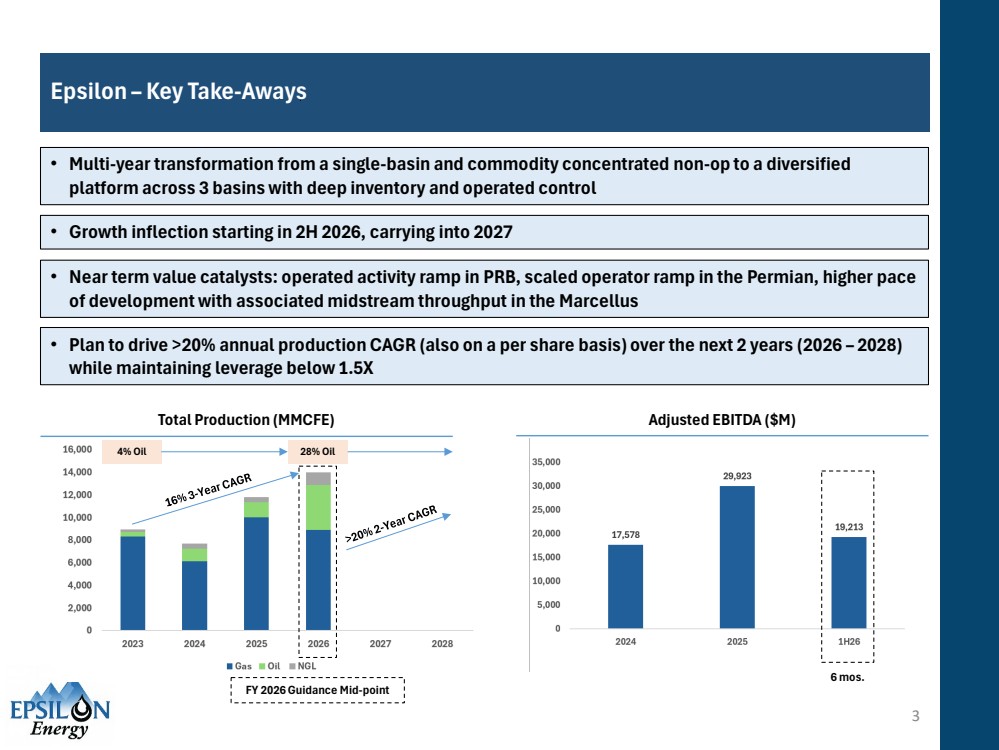
| Epsilon – Key Take-Aways 3 • Multi-year transformation from a single-basin and commodity concentrated non-op to a diversified platform across 3 basins with deep inventory and operated control • Growth inflection starting in 2H 2026, carrying into 2027 • Near term value catalysts: operated activity ramp in PRB, scaled operator ramp in the Permian, higher pace of development with associated midstream throughput in the Marcellus • Plan to drive >20% annual production CAGR (also on a per share basis) over the next 2 years (2026 – 2028) while maintaining leverage below 1.5X Total Production (MMCFE) Adjusted EBITDA ($M) 4% Oil FY 2026 Guidance Mid-point 6 mos. 28% Oil |
| Epsilon – At A Glance 4 Ticker: EPSN (Nasdaq) Enterprise Value1: $208 MM Q2 Net Total Production: 33.9 MMcfe/d (25% Oil) Q2 Net Oil Production: 1,380 Bbl/d Leverage2: 0.9X (LTM EBITDA) Regular Annual Dividend: $0.25 p/share 47,100 net acres3 ADTV: 180,000 shares 90-Day AVG4 Mid-Point 2026 Guidance: 38.4 MMcfe/d (Total Prod) +13% vs. Q2 Actual Mid-Point 2026 Guidance: 1,795 Bbl/d (Oil Prod) +30% vs. Q2 Actual Dev Location Inventory (Net): 216 (Total) Dev Location Inventory (Net): 115 (Priority5) • Diversified upstream business across the Powder River Basin, Marcellus, and Permian coupled with a capital efficient midstream platform • Management team has materially expanded inventory, operational control and strategic flexibility since mid-2022 • 115 net drilling locations with average lateral length of 10,300 CLL ft. and average returns of 45% IRR ($70 WTI and $3.50 HH) • Active development program across all three core assets: - New development in the Powder River Basin (PRB) began in early Q3 2026 (Parkman) - Ongoing Permian Barnett development with acceleration under new operator (Firebird II) - 15 gross Marcellus wells expected online through YE2028 • Multiple near-term value catalysts: • Development pace inflection starting in Q3 2026 across all three core areas, led by operated PRB • PRB shale inventory acceleration opportunities through partnerships • Increased throughput in the AGGS midstream asset expected to start in Q4 2026, accelerating in 2027 Statistics Executive Summary 1. Using closing share price of $5.94 on 8.12.26 2. Net Debt / LTM EBITDA (as of 6.30.26) – Q3 & the first half of Q4 2025 EBITDA does not reflect PRB assets (closed Nov 2025) 3. Excludes WCSB assets 4. 90 days from 8.12.26 5. Defined as >45% WI, >8,000 CLL ft., and >25% IRR @ $70 WTI / $3.50 HHUB |
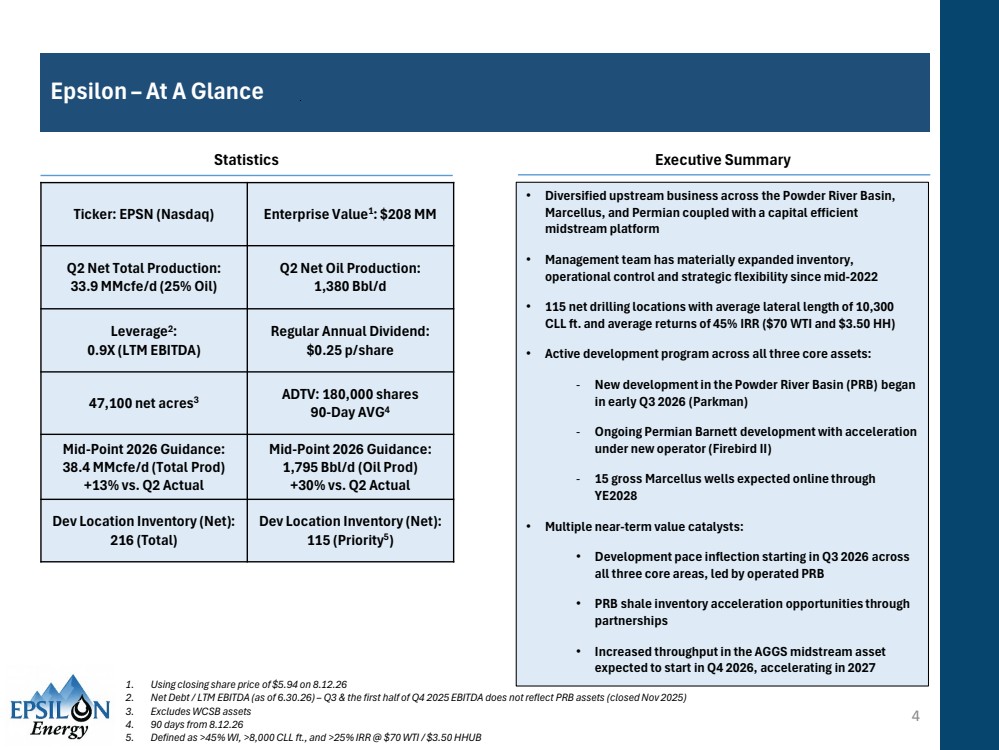
| Asset Portfolio Overview 5 Appalachian Basin Marcellus (Non-Operated) Epsilon - PRB Operator and Project Based Non-Op in the Marcellus & Permian • Core non-op position in the most economic dry gas play in NAM - operated by Expand Energy • 5,100 net acres (95% HBP) • 21.7 MMcf/d NRI production (146 producing wells) YTD 20261 • 218.2 Bcf net Proved + Probable reserves (12/31/25)2 • Substantial undeveloped Marcellus inventory: ~400-450K ft. CLL gross (EPSN ~21% WI) 1. 6mos. through 6.30.26 2. Independent reserve report (DeGolyer & McNaughton (YE25 SEC Reserves Report) 3. Defined as >45% WI, >8,000 CLL ft., and >25% IRR @ $70 WTI / $3.50 HHUB Powder River Basin (PRB) (Majority Operated) • Majority – operated acreage position in core PRB (37,800 net acres – 75% HBP) • 1,868 BOE/d NRI production (149 producing wells (107 operated), 57% oil) YTD 20261 • 70.1 MMboe net Proved + Probable reserves (50% oil) (12/31/25)2 • Experienced operating team with 10+ years of basin experience • 101 net priority3 locations across multiple conventional and unconventional formations • Scalable platform with full control of investment pace Permian Basin Barnett (Non-Operated) • Non-op position on the CBP – Mississippian Barnett development • 4,100 net acres – 25% WI in ~16,600 gross contiguous acres (12,940 undeveloped) • 573 BOE/d NRI production (66% oil, 9 producing wells) YTD 20261 • 2.57 MMboe net Proved + Probable reserves (12/31/25)2 • Substantial undeveloped Barnett inventory: ~450K ft. CLL gross 1 2 3 Appalachian Basin Marcellus Midstream (Non-Operated) 4 Powder River Basin Wyoming Appalachian Basin Pennsylvania 1 4 2 Permian Basin 3 Texas • 35% ownership in 45 mile gathering system • Operated by the Williams Companies • 155 MMcfd max capacity at 450 psig target suction pressure. • 94 MMcf/d gathered YTD 20261 WCSB (Alberta) 5 • JV with Canadian private operator • 25% WI in >100,000 gross acres • 2 producing wells • 25+ 2-mile locations identified in Garrington area (est. 30K acres) • Currently does not compete for capital in the portfolio 5 WCSB Alberta |
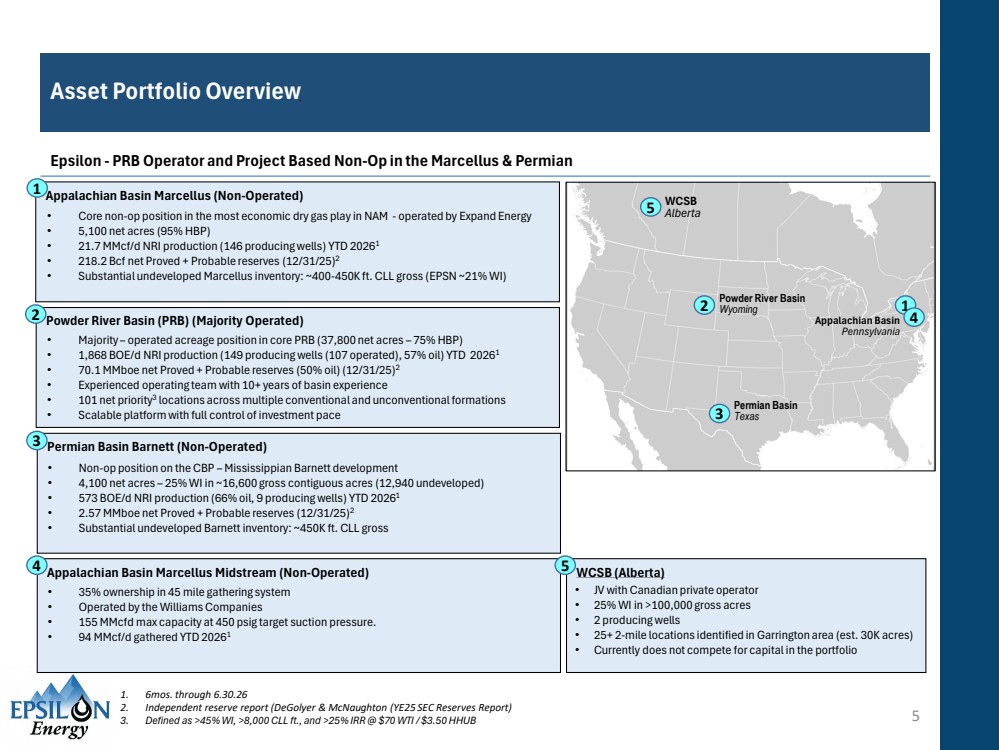
| Opportunities for Capital Allocation (Unique Attribute for Micro-Cap E&P) 6 Portfolio Growth Drivers 1. Defined as >45% WI, >8,000 CLL ft., and >25% IRR @ $70 WTI / $3.50 HHUB 2. Company weighted average type curves 3. $70 WTI / $3.50 HHUB (then less applicable basis) OCF = Revenues – Operating Expenses e Upper Marcellus2 PRB U Nio (Camp)2 PRB Parkman2 Permian Barnett2 Per Net Well D&C Capital: $11.1MM IRR3: 71% 12 mos. Prod: 6.0 BCF (8/8) AVG Gross CLL (Ft.): 14,500 Inventory: 7 net locations Non - Operated Operated Operated Per Net Well D&C Capital: $12.6MM IRR3: 32% 12 mos. Prod: 218 MBOE (8/8) 74% Oil AVG Gross CLL (Ft.): 11,200 Inventory: 26 net locations Per Net Well D&C Capital: $7.9MM IRR3: 72% 12 mos. Prod: 178 MBOE (8/8) 92% Oil AVG Gross CLL (Ft.): 10,000 Inventory: 17 net locations Non - Operated Per Net Well D&C Capital: $14.9MM IRR3: 53% 12 mos. Prod: 300 MBOE (8/8) 88% Oil AVG Gross CLL (Ft.): 14,700 Inventory: 7 net locations Total Inventory: 216 net locations Priority1 Inventory: 116 net locations PRB Turner (Conv)2 Operated Per Net Well D&C Capital: $6.2MM IRR3: 80% 12 mos. Prod: 150 MBOE (8/8) 81% Oil AVG Gross CLL (Ft.): 8,200 Inventory: 16 net locations Focus area, type curve details below |
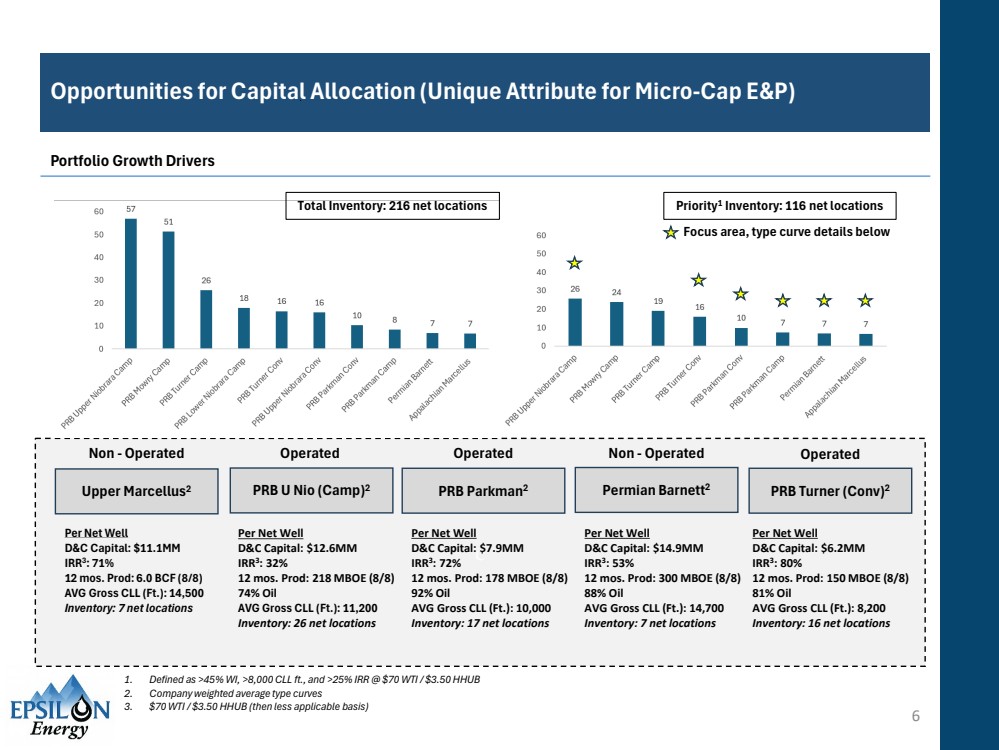
| Powder River Basin Overview (Operated) • Core 37,800 net acre PRB position, directly offset premier operators in both Campbell and Converse County, WY. » Net Production: 1,868 Boe/d (57% oil) (YTD 2026) » Average Operated WI: 53% / Average Lease NRI: 80% » 31,000 acres remain undeveloped (average across 5 formations) • Provides a platform for controlled capital spending » Leasehold is ~75% HBP with no continuous drilling obligations • Acreage covers four proven development formations, well delineated by Peak and offset operators. » Conventional targets: Parkman, Turner » Unconventional targets: Niobrara, Mowry » Priority Inventory1 (Net): Parkman (17), Turner (35), Niobrara (26), Mowry (24) » 1H 2026 activity - completed 2 gross Niobrara DUCS (34% WI) » 2H 2026 planned activity – drilling and completion of 3 gross Parkman wells (72% WI) 7 Summary PRB Position Map 1. Defined as >45% WI, >8,000 CLL ft., and >25% IRR @ $70 WTI / $3.50 HHUB |
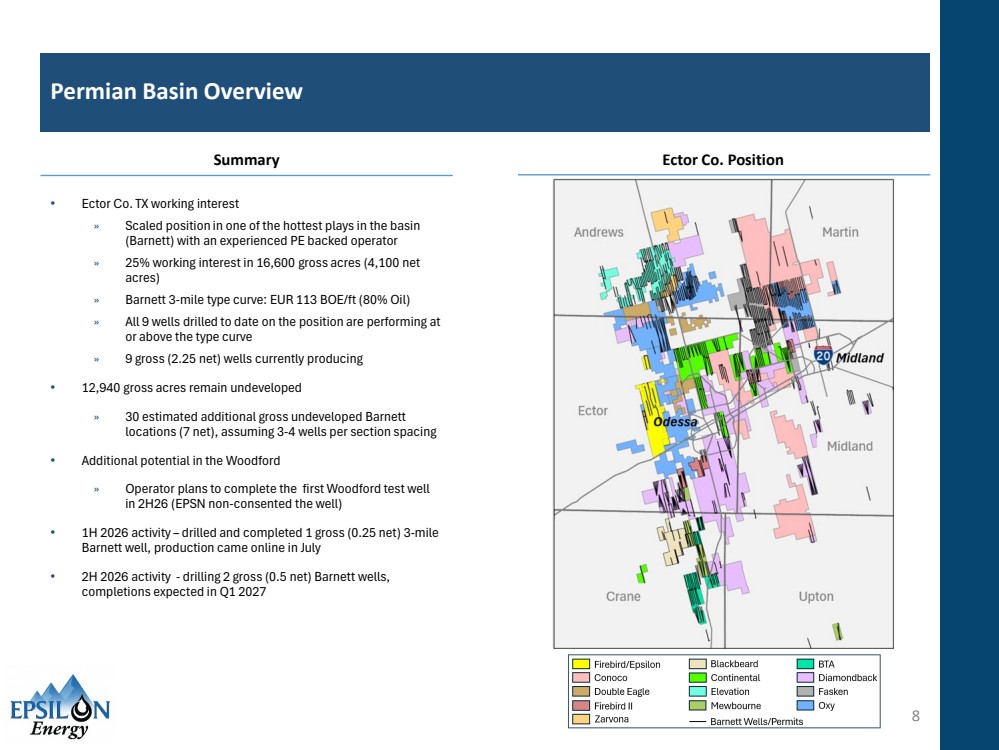
| Permian Basin Overview • Ector Co. TX working interest » Scaled position in one of the hottest plays in the basin (Barnett) with an experienced PE backed operator » 25% working interest in 16,600 gross acres (4,100 net acres) » Barnett 3-mile type curve: EUR 113 BOE/ft (80% Oil) » All 9 wells drilled to date on the position are performing at or above the type curve » 9 gross (2.25 net) wells currently producing • 12,940 gross acres remain undeveloped » 30 estimated additional gross undeveloped Barnett locations (7 net), assuming 3-4 wells per section spacing • Additional potential in the Woodford » Operator plans to complete the first Woodford test well in 2H26 (EPSN non-consented the well) • 1H 2026 activity – drilled and completed 1 gross (0.25 net) 3-mile Barnett well, production came online in July • 2H 2026 activity - drilling 2 gross (0.5 net) Barnett wells, completions expected in Q1 2027 8 Summary Ector Co. Position |
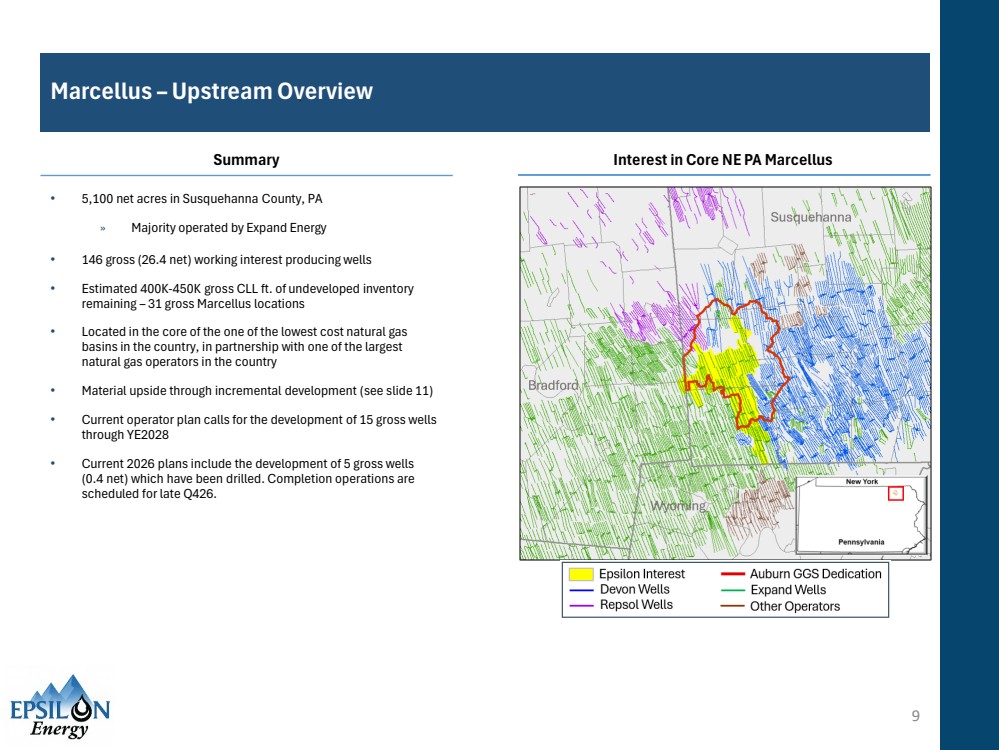
| Marcellus – Upstream Overview • 5,100 net acres in Susquehanna County, PA » Majority operated by Expand Energy • 146 gross (26.4 net) working interest producing wells • Estimated 400K-450K gross CLL ft. of undeveloped inventory remaining – 31 gross Marcellus locations • Located in the core of the one of the lowest cost natural gas basins in the country, in partnership with one of the largest natural gas operators in the country • Material upside through incremental development (see slide 11) • Current operator plan calls for the development of 15 gross wells through YE2028 • Current 2026 plans include the development of 5 gross wells (0.4 net) which have been drilled. Completion operations are scheduled for late Q426. 9 Summary Interest in Core NE PA Marcellus |
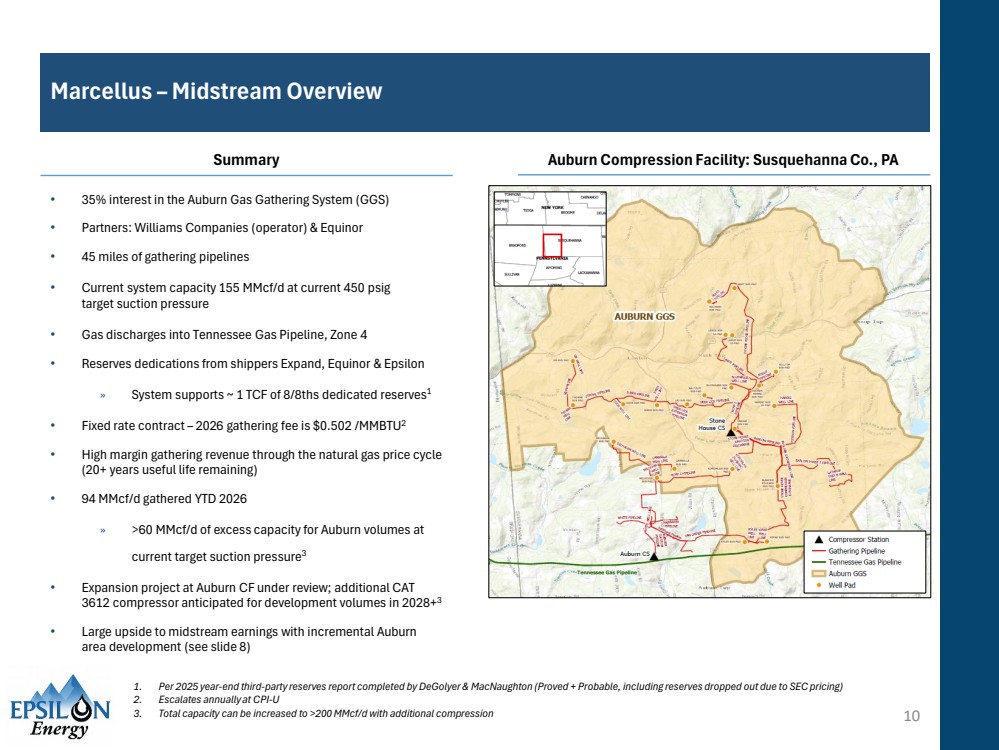
| Marcellus – Midstream Overview 10 Summary Auburn Compression Facility: Susquehanna Co., PA • 35% interest in the Auburn Gas Gathering System (GGS) • Partners: Williams Companies (operator) & Equinor • 45 miles of gathering pipelines • Current system capacity 155 MMcf/d at current 450 psig target suction pressure • Gas discharges into Tennessee Gas Pipeline, Zone 4 • Reserves dedications from shippers Expand, Equinor & Epsilon » System supports ~ 1 TCF of 8/8ths dedicated reserves1 • Fixed rate contract – 2026 gathering fee is $0.502 /MMBTU2 • High margin gathering revenue through the natural gas price cycle (20+ years useful life remaining) • 94 MMcf/d gathered YTD 2026 » >60 MMcf/d of excess capacity for Auburn volumes at current target suction pressure3 • Expansion project at Auburn CF under review; additional CAT 3612 compressor anticipated for development volumes in 2028+3 • Large upside to midstream earnings with incremental Auburn area development (see slide 8) 1. Per 2025 year-end third-party reserves report completed by DeGolyer & MacNaughton (Proved + Probable, including reserves dropped out due to SEC pricing) 2. Escalates annually at CPI-U 3. Total capacity can be increased to >200 MMcf/d with additional compression |
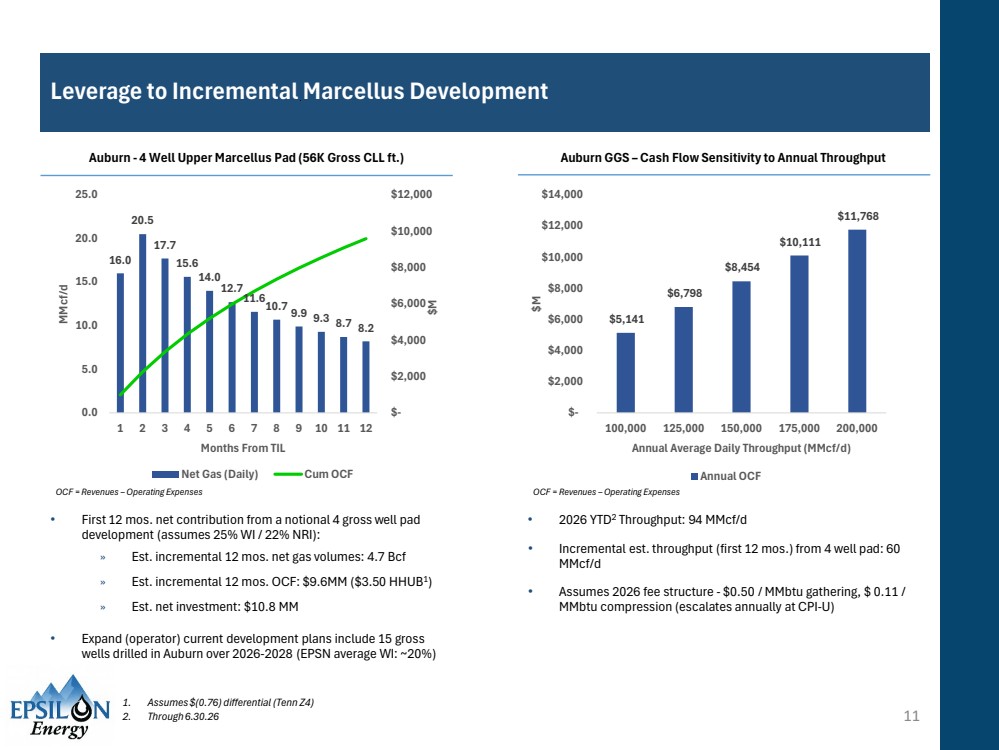
| Leverage to Incremental Marcellus Development • First 12 mos. net contribution from a notional 4 gross well pad development (assumes 25% WI / 22% NRI): » Est. incremental 12 mos. net gas volumes: 4.7 Bcf » Est. incremental 12 mos. OCF: $9.6MM ($3.50 HHUB1) » Est. net investment: $10.8 MM • Expand (operator) current development plans include 15 gross wells drilled in Auburn over 2026-2028 (EPSN average WI: ~20%) 11 Auburn - 4 Well Upper Marcellus Pad (56K Gross CLL ft.) Auburn GGS – Cash Flow Sensitivity to Annual Throughput 16.0 20.5 17.7 15.6 14.0 12.7 11.610.7 9.9 9.3 8.7 8.2 $- $2,000 $4,000 $6,000 $8,000 $10,000 $12,000 0.0 5.0 10.0 15.0 20.0 25.0 1 2 3 4 5 6 7 8 9 10 11 12 $M MMcf/d Months From TIL Net Gas (Daily) Cum OCF $5,141 $6,798 $8,454 $10,111 $11,768 $- $2,000 $4,000 $6,000 $8,000 $10,000 $12,000 $14,000 100,000 125,000 150,000 175,000 200,000 $M Annual Average Daily Throughput (MMcf/d) Annual OCF • 2026 YTD2 Throughput: 94 MMcf/d • Incremental est. throughput (first 12 mos.) from 4 well pad: 60 MMcf/d • Assumes 2026 fee structure - $0.50 / MMbtu gathering, $ 0.11 / MMbtu compression (escalates annually at CPI-U) OCF = Revenues – Operating Expenses OCF = Revenues – Operating Expenses 1. Assumes $(0.76) differential (Tenn Z4) 2. Through 6.30.26 |
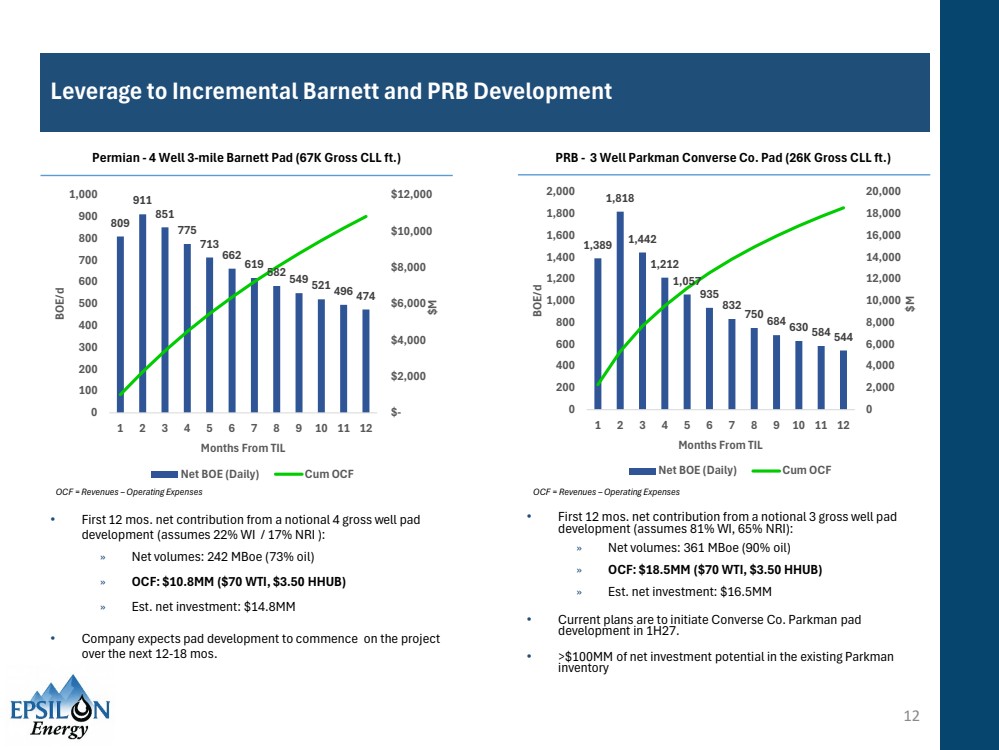
| Leverage to Incremental Barnett and PRB Development • First 12 mos. net contribution from a notional 4 gross well pad development (assumes 22% WI / 17% NRI ): » Net volumes: 242 MBoe (73% oil) » OCF: $10.8MM ($70 WTI, $3.50 HHUB) » Est. net investment: $14.8MM • Company expects pad development to commence on the project over the next 12-18 mos. 12 Permian - 4 Well 3-mile Barnett Pad (67K Gross CLL ft.) PRB - 3 Well Parkman Converse Co. Pad (26K Gross CLL ft.) 809 911 851 775 713 662 619 582 549 521 496 474 $- $2,000 $4,000 $6,000 $8,000 $10,000 $12,000 0 100 200 300 400 500 600 700 800 900 1,000 1 2 3 4 5 6 7 8 9 10 11 12 $M BOE/d Months From TIL Net BOE (Daily) Cum OCF OCF = Revenues – Operating Expenses OCF = Revenues – Operating Expenses 1,389 1,818 1,442 1,212 1,057 935 832 750 684 630 584 544 0 2,000 4,000 6,000 8,000 10,000 12,000 14,000 16,000 18,000 20,000 0 200 400 600 800 1,000 1,200 1,400 1,600 1,800 2,000 1 2 3 4 5 6 7 8 9 10 11 12 $M BOE/d Months From TIL Net BOE (Daily) Cum OCF • First 12 mos. net contribution from a notional 3 gross well pad development (assumes 81% WI, 65% NRI): » Net volumes: 361 MBoe (90% oil) » OCF: $18.5MM ($70 WTI, $3.50 HHUB) » Est. net investment: $16.5MM • Current plans are to initiate Converse Co. Parkman pad development in 1H27. • >$100MM of net investment potential in the existing Parkman inventory |
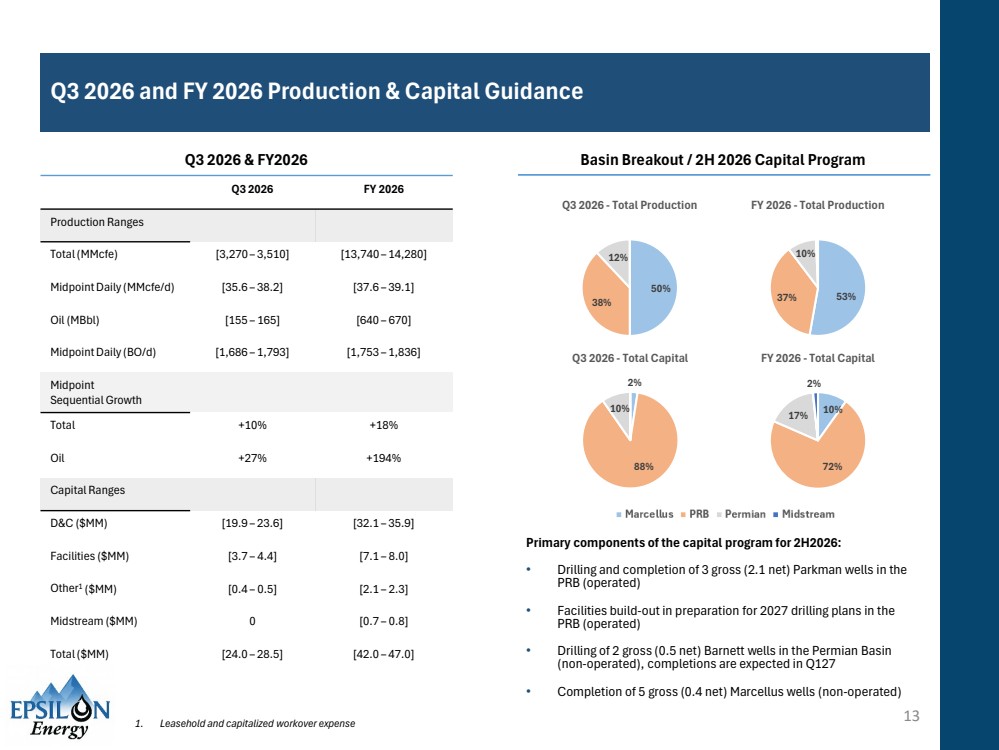
| Q3 2026 and FY 2026 Production & Capital Guidance 13 Q3 2026 & FY2026 Basin Breakout / 2H 2026 Capital Program Primary components of the capital program for 2H2026: • Drilling and completion of 3 gross (2.1 net) Parkman wells in the PRB (operated) • Facilities build-out in preparation for 2027 drilling plans in the PRB (operated) • Drilling of 2 gross (0.5 net) Barnett wells in the Permian Basin (non-operated), completions are expected in Q127 • Completion of 5 gross (0.4 net) Marcellus wells (non-operated) Q3 2026 FY 2026 Production Ranges Total (MMcfe) [3,270 – 3,510] [13,740 – 14,280] Midpoint Daily (MMcfe/d) [35.6 – 38.2] [37.6 – 39.1] Oil (MBbl) [155 – 165] [640 – 670] Midpoint Daily (BO/d) [1,686 – 1,793] [1,753 – 1,836] Midpoint Sequential Growth Total +10% +18% Oil +27% +194% Capital Ranges D&C ($MM) [19.9 – 23.6] [32.1 – 35.9] Facilities ($MM) [3.7 – 4.4] [7.1 – 8.0] Other1 ($MM) [0.4 – 0.5] [2.1 – 2.3] Midstream ($MM) 0 [0.7 – 0.8] Total ($MM) [24.0 – 28.5] [42.0 – 47.0] 50% 38% 12% Q3 2026 - Total Production 37% 53% 10% FY 2026 - Total Production 2% 88% 10% Q3 2026 - Total Capital 10% 72% 17% 2% FY 2026 - Total Capital 1. Leasehold and capitalized workover expense |
| Disclosures 14 Non-GAAP Financial Measures Epsilon defines Adjusted EBITDA as earnings before (1) net interest expense, (2) taxes, (3) depreciation, depletion, amortization and accretion expense, (4) impairments of natural gas and oil properties, (5) non-cash stock compensation expense, (6) transaction costs, (7) gain or loss on derivative contracts net of cash received or paid on settlement, (8) gain or loss on sale of assets, and (9) gain or loss on foreign currency translations. Additionally, Adjusted EBITDA may not be comparable to other similarly titled measures of other companies. Epsilon has included Adjusted EBITDA as a supplemental disclosure because its management believes that EBITDA provides useful information regarding its ability to service debt and to fund capital expenditures. It further provides investors a helpful measure for comparing operating performance on a "normalized" or recurring basis with the performance of other companies, without giving effect to certain non-cash expenses and other items. This provides management, investors and analysts with comparative information for evaluating the Company in relation to other natural gas and oil companies providing corresponding non-U.S. GAAP financial measures or that have different financing and capital structures or tax rates. These non-U.S. GAAP financial measures should be considered in addition to, but not as a substitute for, measures for financial performance prepared in accordancewith U.S. GAAP. |