
Second Quarter 2026 Results 1 Klarna Q2’26 Earnings Release
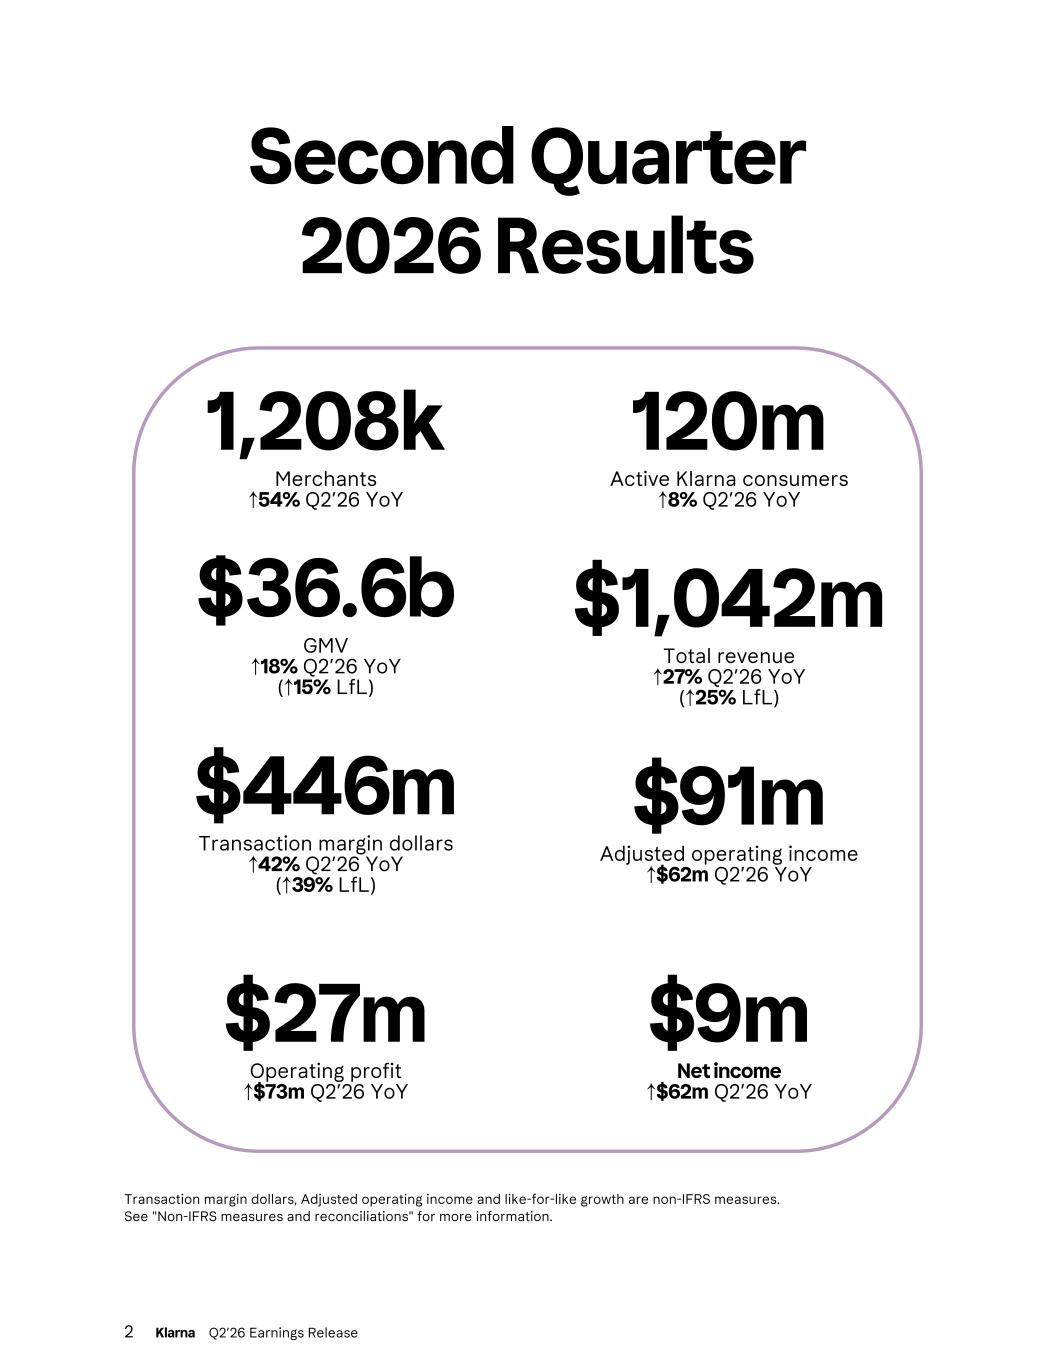
Second Quarter 2026 Results 1,208k Merchants ↑54% Q2’26 YoY 120m Active Klarna consumers ↑8% Q2’26 YoY $36.6b GMV ↑18% Q2’26 YoY (↑15% LfL) $1,042m Total revenue ↑27% Q2’26 YoY (↑25% LfL) $446m Transaction margin dollars ↑42% Q2’26 YoY (↑39% LfL) $91m Adjusted operating income ↑$62m Q2’26 YoY $27m Operating profit ↑$73m Q2’26 YoY $9m Net income ↑$62m Q2’26 YoY Transaction margin dollars, Adjusted operating income and like-for-like growth are non-IFRS measures. See "Non-IFRS measures and reconciliations" for more information. 2 Klarna Q2’26 Earnings Release
Key Highlights This was a strong quarter. We delivered on our guidance and demonstrated the earnings strength of the business. Volume grew 18%, revenue grew 27%, and transaction margin dollars grew 42%. Each grew faster than the last. Operating costs grew 16%, well below all three, and that gap is the operating leverage we have been building toward. Adjusted operating income reached $91 million, up $62 million year over year, and net income was positive at $9 million. We measure our progress in transaction margin dollars and we expect to deliver around 30% growth in Transaction margin dollars (TMD) this year, well ahead of revenue growth. They are what we optimize for, and they shape how we build products, how we price, and how we underwrite. Because operating costs grow far slower, that growth is what turns into earnings per share over time. Klarna is spend-centric, not lend-centric. Pay in Full serves everyday spend. Pay Later, our charge-card equivalent, serves medium-sized purchases on short repayment terms. Point-of-sale installments, or Fair Financing, which serves large-ticket purchases, grew 82% year over year and continues to gain share, particularly in the U.S., where we won marquee partners including Bolt, Ulta Beauty and Southwest Airlines. Last month, Klarna and Apple announced the Apple Upgrade program, a new device leasing program available on the Apple Store Online, in the Apple Store app, and at Apple Store locations in the U.S. Consumers apply at Apple and then pay and manage within the Klarna app, creating a direct relationship with new US consumers that supports Klarna’s ability to grow engagement, ARPAC, and profitability. Alongside those three products, engagement deepens. ARPAC reached $33.7, up 24%. Klarna Memberships reached 2 million paying subscribers, eight times more than a year ago, with subscription revenue up more than 600%. The Klarna Card reached 6.5 million active users across 16 countries, up from 1.3 million a year ago; on our first earnings call in November that number was 3.2 million, so it has more than doubled in nine months. Last week we launched new plans built on what consumers actually want: cashback and benefits. Subscription revenue is high margin and recurring: it is earned on the membership rather than on each transaction, so it does not track volume the way our payments revenue does. It grows TMD directly, and is part of why transaction margin dollars outpace volume. The network keeps widening. Over 1.2 million merchants are now live, up 54%, underpinned by continued ramp of our PSP partnerships. J.P. Morgan Payments went live on August 6. It is the largest U.S. merchant acquirer, processing $2.6 trillion of payments a year, and every merchant on its platform, from boutiques to big-box, can now offer the full Klarna suite through their existing setup, with no new integration. In addition to Stripe and Nexi who are live and ramping, we have five PSPs enabling Klarna as a default-on option across payment networks totaling over $9.5 trillion of volumes. PSPs bring merchants and merchants bring consumer surfaces. We win when a merchant offers a choice at checkout and we take the largest share of it and that is what drives profitable growth. We are also moving with where consumers search. Klarna's flexible payments are coming to Google Search and the Gemini app within Google Pay, and our AI-powered Shopping Search app is live in ChatGPT, putting our dataset of over 100 million products, and our payments, inside the world's largest AI surfaces. Traffic from AI platforms to retailers grew sharply last holiday season and converts at higher rates. We enter the second half with real momentum. Our payment-platform partnerships are scaling ahead of the holiday season, our new device-upgrade program is ramping, and each new merchant and consumer turns the same flywheel: a wider network, deeper engagement, and better economics on every transaction. 3 Klarna Q2’26 Earnings Release
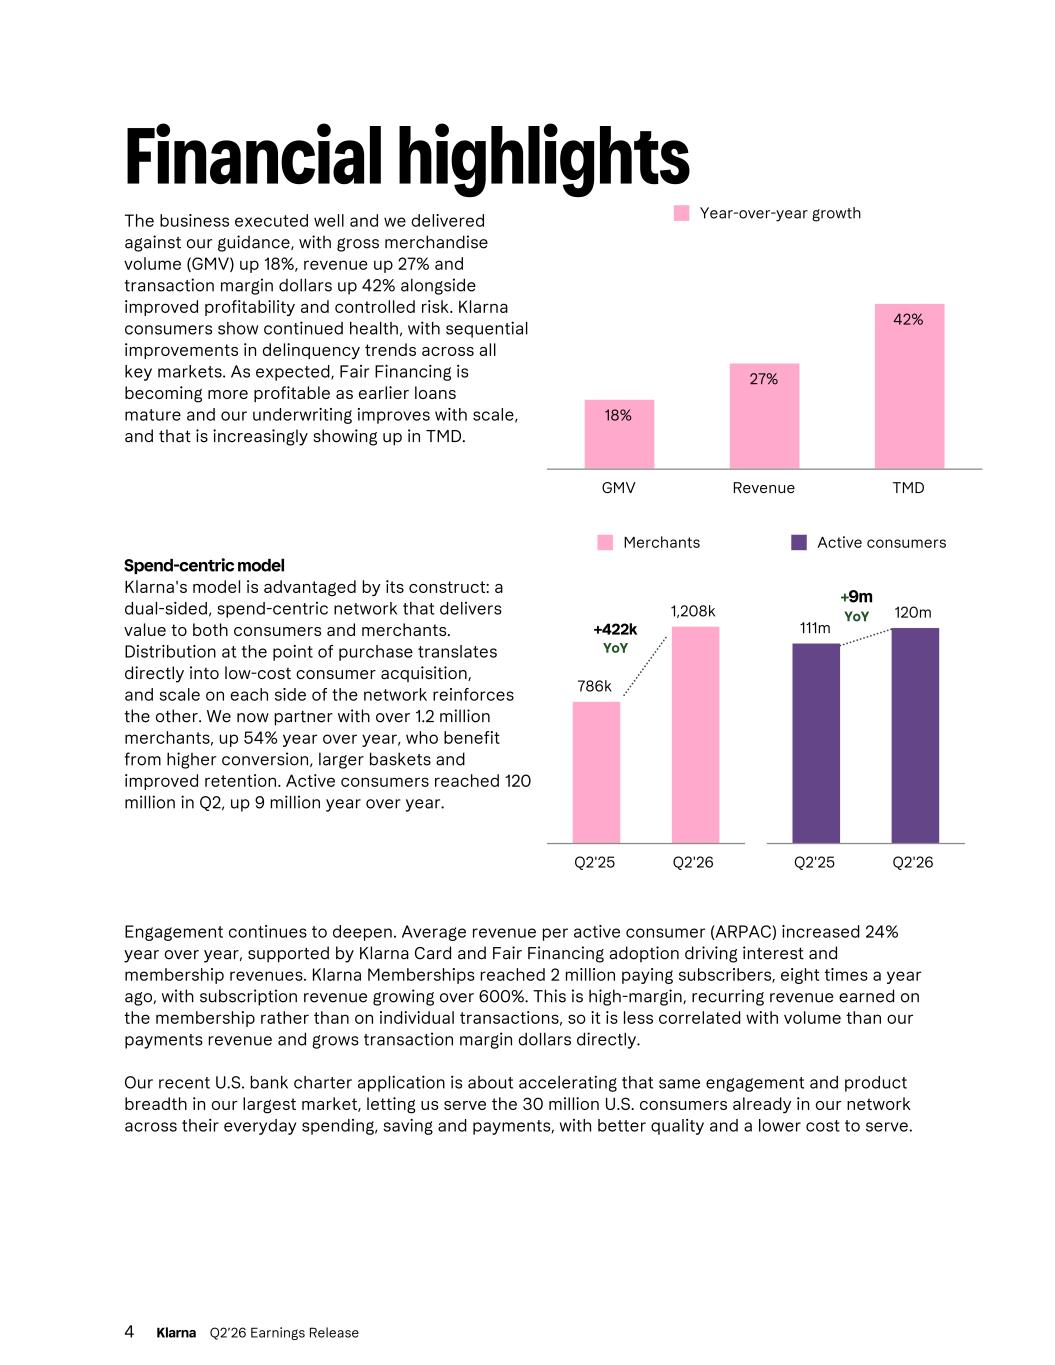
Financial highlights The business executed well and we delivered against our guidance, with gross merchandise volume (GMV) up 18%, revenue up 27% and transaction margin dollars up 42% alongside improved profitability and controlled risk. Klarna consumers show continued health, with sequential improvements in delinquency trends across all key markets. As expected, Fair Financing is becoming more profitable as earlier loans mature and our underwriting improves with scale, and that is increasingly showing up in TMD. Spend-centric model Klarna's model is advantaged by its construct: a dual-sided, spend-centric network that delivers value to both consumers and merchants. Distribution at the point of purchase translates directly into low-cost consumer acquisition, and scale on each side of the network reinforces the other. We now partner with over 1.2 million merchants, up 54% year over year, who benefit from higher conversion, larger baskets and improved retention. Active consumers reached 120 million in Q2, up 9 million year over year. Engagement continues to deepen. Average revenue per active consumer (ARPAC) increased 24% year over year, supported by Klarna Card and Fair Financing adoption driving interest and membership revenues. Klarna Memberships reached 2 million paying subscribers, eight times a year ago, with subscription revenue growing over 600%. This is high-margin, recurring revenue earned on the membership rather than on individual transactions, so it is less correlated with volume than our payments revenue and grows transaction margin dollars directly. Our recent U.S. bank charter application is about accelerating that same engagement and product breadth in our largest market, letting us serve the 30 million U.S. consumers already in our network across their everyday spending, saving and payments, with better quality and a lower cost to serve. 4 Klarna Q2’26 Earnings Release 18% 27% 42% Year-over-year growth GMV Revenue TMD 111m 120m Active consumers Q2'25 Q2'26 786k 1,208k Merchants Q2'25 Q2'26 +9m YoY +422k YoY
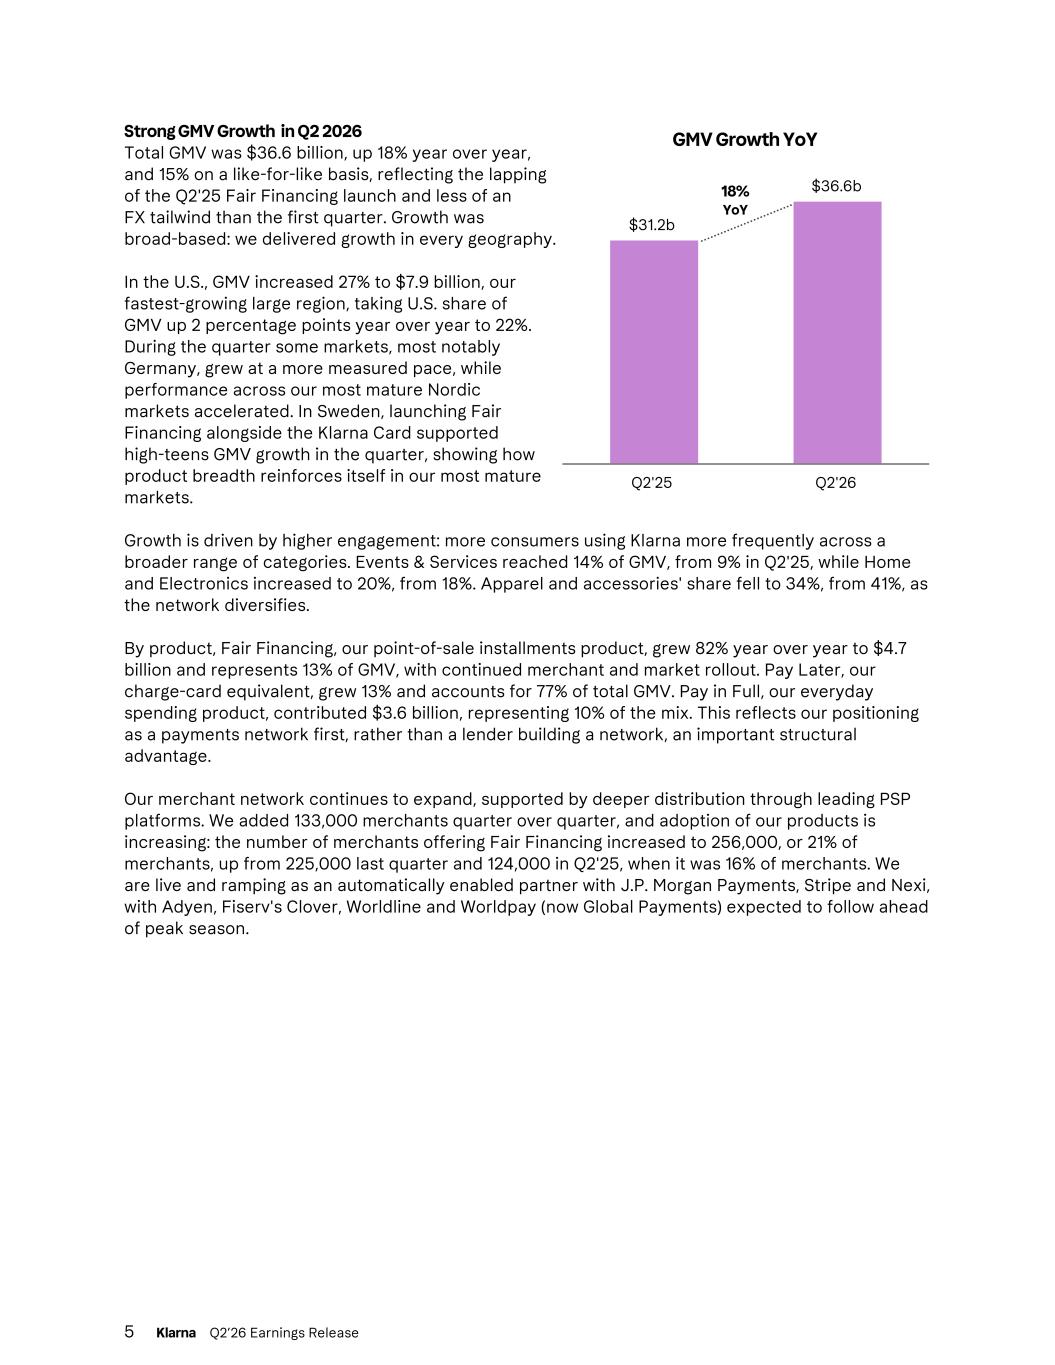
Strong GMV Growth in Q2 2026 Total GMV was $36.6 billion, up 18% year over year, and 15% on a like-for-like basis, reflecting the lapping of the Q2'25 Fair Financing launch and less of an FX tailwind than the first quarter. Growth was broad-based: we delivered growth in every geography. In the U.S., GMV increased 27% to $7.9 billion, our fastest-growing large region, taking U.S. share of GMV up 2 percentage points year over year to 22%. During the quarter some markets, most notably Germany, grew at a more measured pace, while performance across our most mature Nordic markets accelerated. In Sweden, launching Fair Financing alongside the Klarna Card supported high-teens GMV growth in the quarter, showing how product breadth reinforces itself in our most mature markets. Growth is driven by higher engagement: more consumers using Klarna more frequently across a broader range of categories. Events & Services reached 14% of GMV, from 9% in Q2'25, while Home and Electronics increased to 20%, from 18%. Apparel and accessories' share fell to 34%, from 41%, as the network diversifies. By product, Fair Financing, our point-of-sale installments product, grew 82% year over year to $4.7 billion and represents 13% of GMV, with continued merchant and market rollout. Pay Later, our charge-card equivalent, grew 13% and accounts for 77% of total GMV. Pay in Full, our everyday spending product, contributed $3.6 billion, representing 10% of the mix. This reflects our positioning as a payments network first, rather than a lender building a network, an important structural advantage. Our merchant network continues to expand, supported by deeper distribution through leading PSP platforms. We added 133,000 merchants quarter over quarter, and adoption of our products is increasing: the number of merchants offering Fair Financing increased to 256,000, or 21% of merchants, up from 225,000 last quarter and 124,000 in Q2'25, when it was 16% of merchants. We are live and ramping as an automatically enabled partner with J.P. Morgan Payments, Stripe and Nexi, with Adyen, Fiserv's Clover, Worldline and Worldpay (now Global Payments) expected to follow ahead of peak season. 5 Klarna Q2’26 Earnings Release GMV Growth YoY $31.2b $36.6b Q2'25 Q2'26 18% YoY
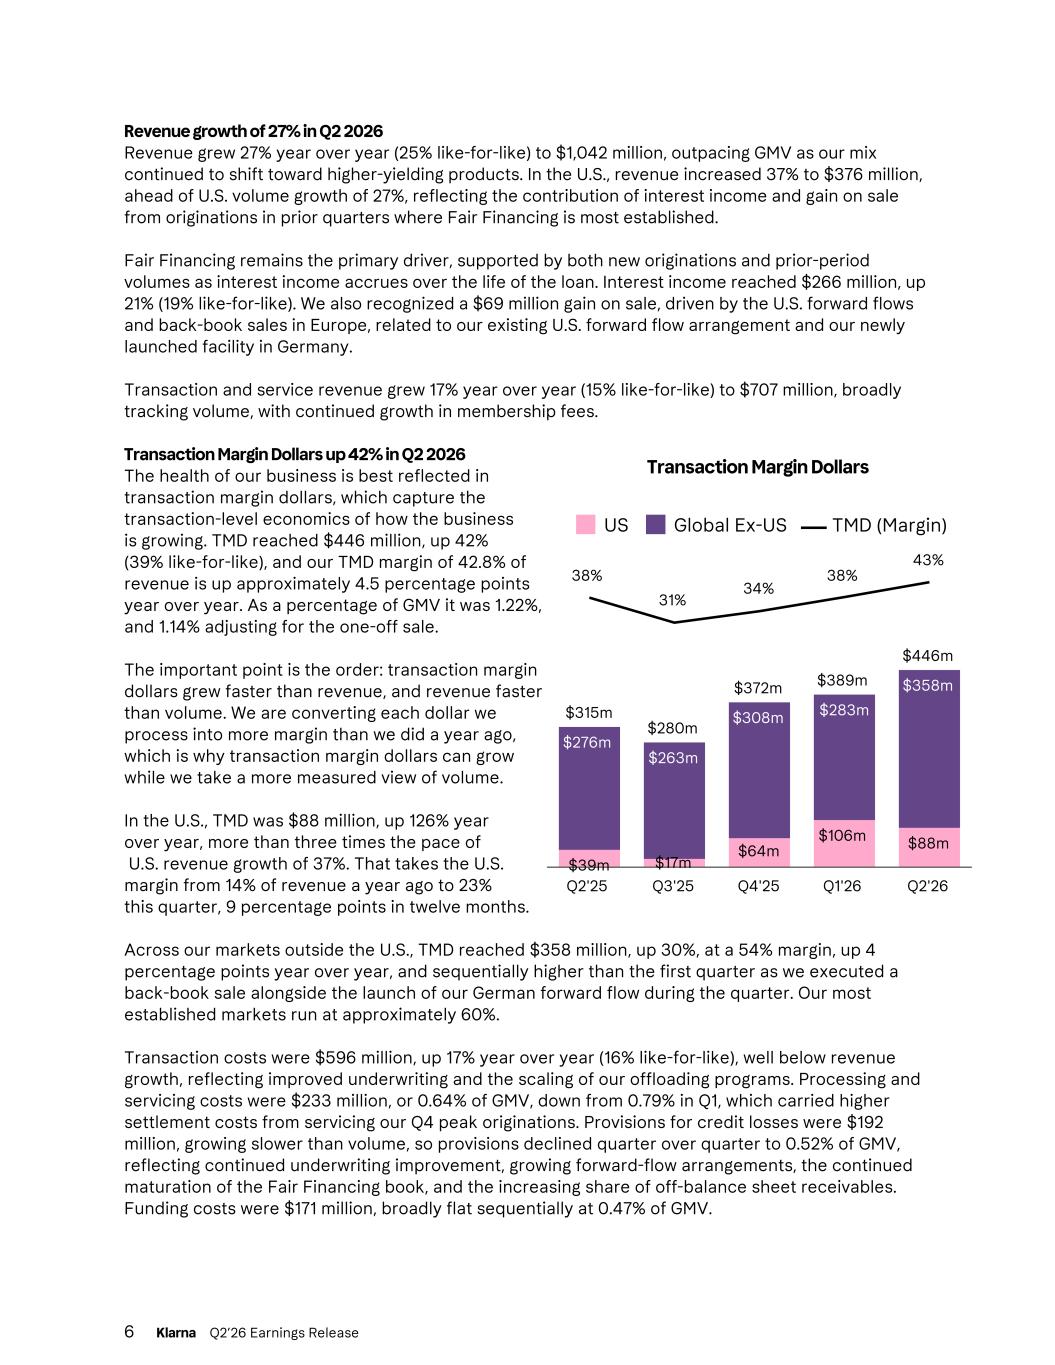
Revenue growth of 27% in Q2 2026 Revenue grew 27% year over year (25% like-for-like) to $1,042 million, outpacing GMV as our mix continued to shift toward higher-yielding products. In the U.S., revenue increased 37% to $376 million, ahead of U.S. volume growth of 27%, reflecting the contribution of interest income and gain on sale from originations in prior quarters where Fair Financing is most established. Fair Financing remains the primary driver, supported by both new originations and prior-period volumes as interest income accrues over the life of the loan. Interest income reached $266 million, up 21% (19% like-for-like). We also recognized a $69 million gain on sale, driven by the U.S. forward flows and back-book sales in Europe, related to our existing U.S. forward flow arrangement and our newly launched facility in Germany. Transaction and service revenue grew 17% year over year (15% like-for-like) to $707 million, broadly tracking volume, with continued growth in membership fees. Transaction Margin Dollars up 42% in Q2 2026 The health of our business is best reflected in transaction margin dollars, which capture the transaction-level economics of how the business is growing. TMD reached $446 million, up 42% (39% like-for-like), and our TMD margin of 42.8% of revenue is up approximately 4.5 percentage points year over year. As a percentage of GMV it was 1.22%, and 1.14% adjusting for the one-off sale. The important point is the order: transaction margin dollars grew faster than revenue, and revenue faster than volume. We are converting each dollar we process into more margin than we did a year ago, which is why transaction margin dollars can grow while we take a more measured view of volume. In the U.S., TMD was $88 million, up 126% year over year, more than three times the pace of U.S. revenue growth of 37%. That takes the U.S. margin from 14% of revenue a year ago to 23% this quarter, 9 percentage points in twelve months. Across our markets outside the U.S., TMD reached $358 million, up 30%, at a 54% margin, up 4 percentage points year over year, and sequentially higher than the first quarter as we executed a back-book sale alongside the launch of our German forward flow during the quarter. Our most established markets run at approximately 60%. Transaction costs were $596 million, up 17% year over year (16% like-for-like), well below revenue growth, reflecting improved underwriting and the scaling of our offloading programs. Processing and servicing costs were $233 million, or 0.64% of GMV, down from 0.79% in Q1, which carried higher settlement costs from servicing our Q4 peak originations. Provisions for credit losses were $192 million, growing slower than volume, so provisions declined quarter over quarter to 0.52% of GMV, reflecting continued underwriting improvement, growing forward-flow arrangements, the continued maturation of the Fair Financing book, and the increasing share of off-balance sheet receivables. Funding costs were $171 million, broadly flat sequentially at 0.47% of GMV. 6 Klarna Q2’26 Earnings Release Transaction Margin Dollars $315m $280m $372m $389m $446m $39m $17m $64m $106m $88m $276m $263m $308m $283m $358m 38% 31% 34% 38% 43% US Global Ex-US TMD (Margin) Q2'25 Q3'25 Q4'25 Q1'26 Q2'26
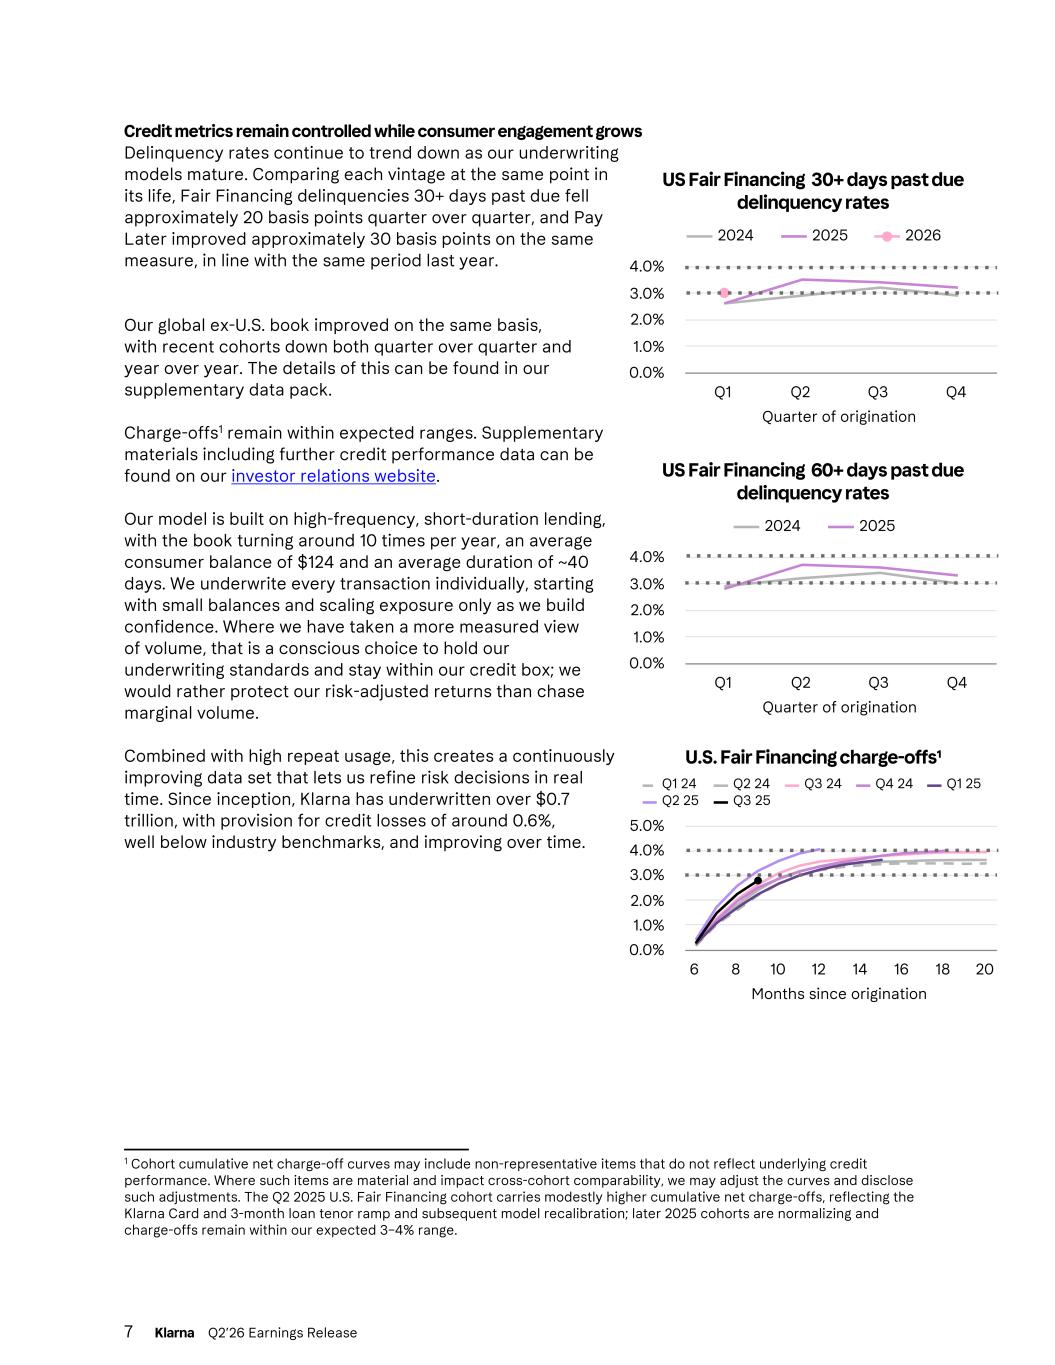
Credit metrics remain controlled while consumer engagement grows Delinquency rates continue to trend down as our underwriting models mature. Comparing each vintage at the same point in its life, Fair Financing delinquencies 30+ days past due fell approximately 20 basis points quarter over quarter, and Pay Later improved approximately 30 basis points on the same measure, in line with the same period last year. Our global ex-U.S. book improved on the same basis, with recent cohorts down both quarter over quarter and year over year. The details of this can be found in our supplementary data pack. Charge-offs1 remain within expected ranges. Supplementary materials including further credit performance data can be found on our investor relations website. Our model is built on high-frequency, short-duration lending, with the book turning around 10 times per year, an average consumer balance of $124 and an average duration of ~40 days. We underwrite every transaction individually, starting with small balances and scaling exposure only as we build confidence. Where we have taken a more measured view of volume, that is a conscious choice to hold our underwriting standards and stay within our credit box; we would rather protect our risk-adjusted returns than chase marginal volume. Combined with high repeat usage, this creates a continuously improving data set that lets us refine risk decisions in real time. Since inception, Klarna has underwritten over $0.7 trillion, with provision for credit losses of around 0.6%, well below industry benchmarks, and improving over time. 7 Klarna Q2’26 Earnings Release 1 Cohort cumulative net charge-off curves may include non-representative items that do not reflect underlying credit performance. Where such items are material and impact cross-cohort comparability, we may adjust the curves and disclose such adjustments. The Q2 2025 U.S. Fair Financing cohort carries modestly higher cumulative net charge-offs, reflecting the Klarna Card and 3-month loan tenor ramp and subsequent model recalibration; later 2025 cohorts are normalizing and charge-offs remain within our expected 3–4% range. Quarter of origination US Fair Financing 60+ days past due delinquency rates 2024 2025 Q1 Q2 Q3 Q4 0.0% 1.0% 2.0% 3.0% 4.0% Quarter of origination US Fair Financing 30+ days past due delinquency rates 2024 2025 2026 Q1 Q2 Q3 Q4 0.0% 1.0% 2.0% 3.0% 4.0% Months since origination U.S. Fair Financing charge-offs¹ Q1 24 Q2 24 Q3 24 Q4 24 Q1 25 Q2 25 Q3 25 6 8 10 12 14 16 18 20 0.0% 1.0% 2.0% 3.0% 4.0% 5.0%
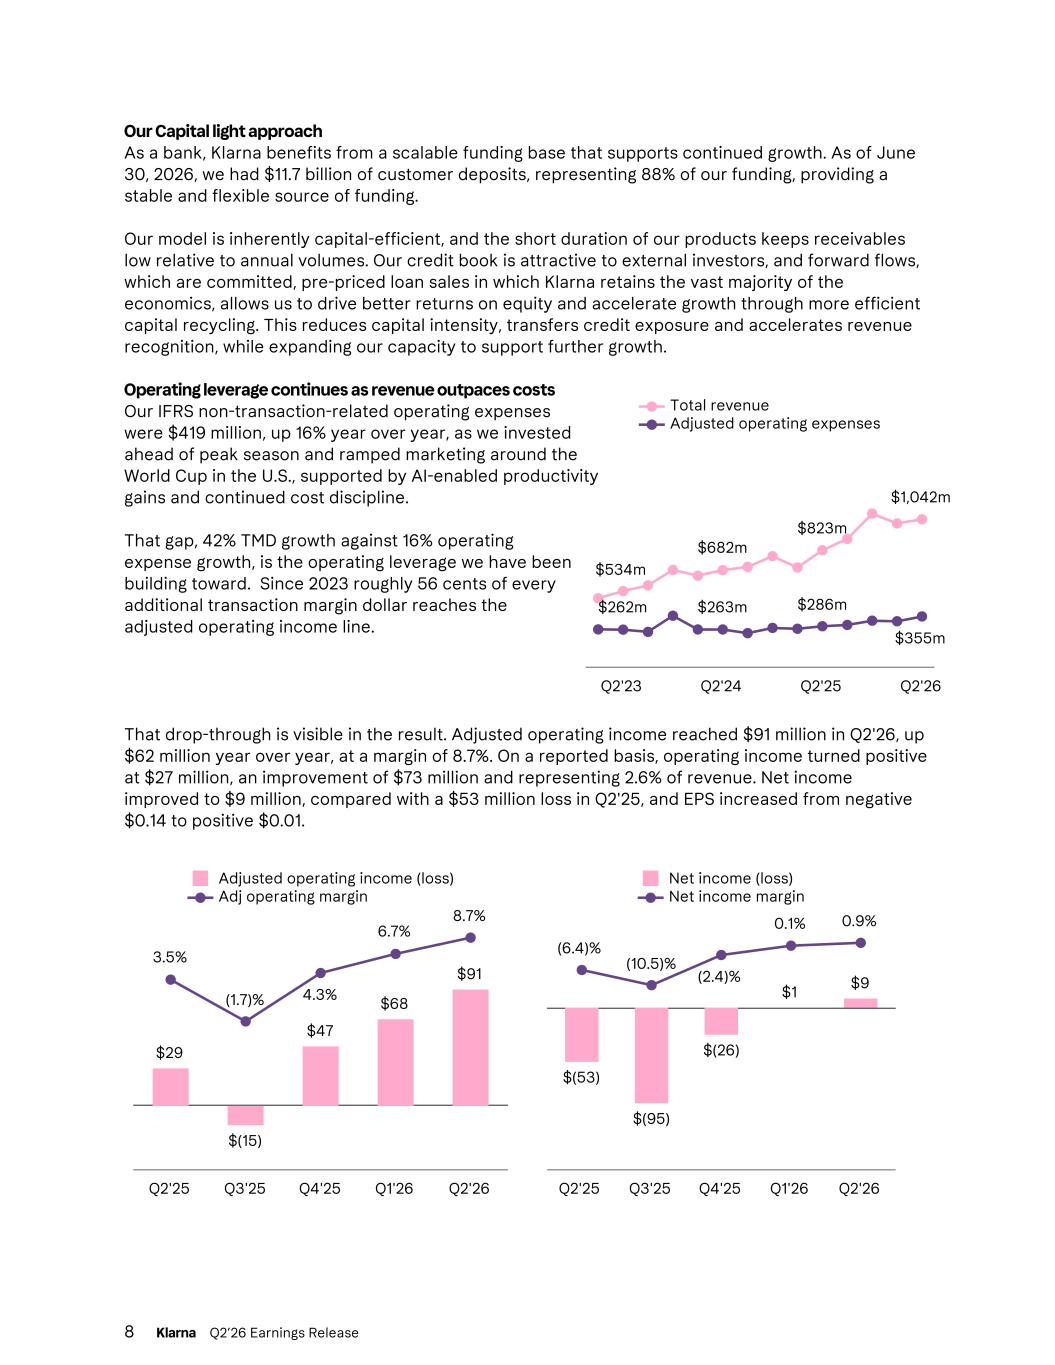
Our Capital light approach As a bank, Klarna benefits from a scalable funding base that supports continued growth. As of June 30, 2026, we had $11.7 billion of customer deposits, representing 88% of our funding, providing a stable and flexible source of funding. Our model is inherently capital-efficient, and the short duration of our products keeps receivables low relative to annual volumes. Our credit book is attractive to external investors, and forward flows, which are committed, pre-priced loan sales in which Klarna retains the vast majority of the economics, allows us to drive better returns on equity and accelerate growth through more efficient capital recycling. This reduces capital intensity, transfers credit exposure and accelerates revenue recognition, while expanding our capacity to support further growth. Operating leverage continues as revenue outpaces costs Our IFRS non-transaction-related operating expenses were $419 million, up 16% year over year, as we invested ahead of peak season and ramped marketing around the World Cup in the U.S., supported by AI-enabled productivity gains and continued cost discipline. That gap, 42% TMD growth against 16% operating expense growth, is the operating leverage we have been building toward. Since 2023 roughly 56 cents of every additional transaction margin dollar reaches the adjusted operating income line. That drop-through is visible in the result. Adjusted operating income reached $91 million in Q2'26, up $62 million year over year, at a margin of 8.7%. On a reported basis, operating income turned positive at $27 million, an improvement of $73 million and representing 2.6% of revenue. Net income improved to $9 million, compared with a $53 million loss in Q2'25, and EPS increased from negative $0.14 to positive $0.01. 8 Klarna Q2’26 Earnings Release $534m $682m $823m $1,042m $262m $263m $286m $355m Total revenue Adjusted operating expenses Q2'23 Q2'24 Q2'25 Q2'26 $29 $(15) $47 $68 $91 3.5% (1.7)% 4.3% 6.7% 8.7% Adjusted operating income (loss) Adj operating margin Q2'25 Q3'25 Q4'25 Q1'26 Q2'26 $(53) $(95) $(26) $1 $9 (6.4)% (10.5)% (2.4)% 0.1% 0.9% Net income (loss) Net income margin Q2'25 Q3'25 Q4'25 Q1'26 Q2'26
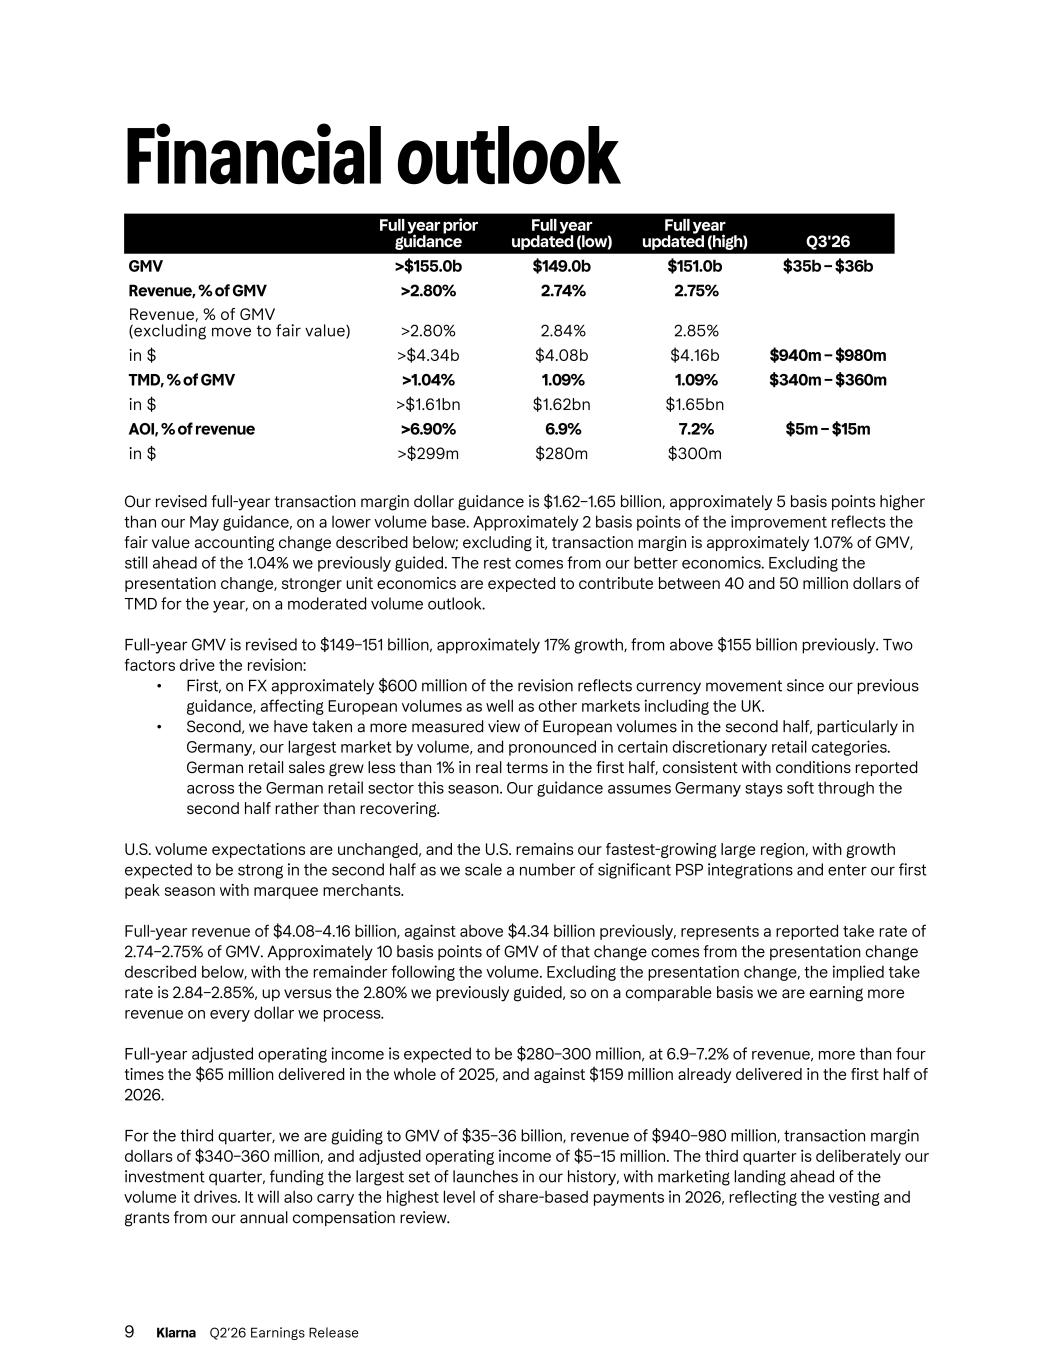
Financial outlook Full year prior guidance Full year updated (low) Full year updated (high) Q3'26 GMV >$155.0b $149.0b $151.0b $35b – $36b Revenue, % of GMV >2.80% 2.74% 2.75% Revenue, % of GMV (excluding move to fair value) >2.80% 2.84% 2.85% in $ >$4.34b $4.08b $4.16b $940m – $980m TMD, % of GMV >1.04% 1.09% 1.09% $340m – $360m in $ >$1.61bn $1.62bn $1.65bn AOI, % of revenue >6.90% 6.9% 7.2% $5m – $15m in $ >$299m $280m $300m Our revised full-year transaction margin dollar guidance is $1.62–1.65 billion, approximately 5 basis points higher than our May guidance, on a lower volume base. Approximately 2 basis points of the improvement reflects the fair value accounting change described below; excluding it, transaction margin is approximately 1.07% of GMV, still ahead of the 1.04% we previously guided. The rest comes from our better economics. Excluding the presentation change, stronger unit economics are expected to contribute between 40 and 50 million dollars of TMD for the year, on a moderated volume outlook. Full-year GMV is revised to $149–151 billion, approximately 17% growth, from above $155 billion previously. Two factors drive the revision: • First, on FX approximately $600 million of the revision reflects currency movement since our previous guidance, affecting European volumes as well as other markets including the UK. • Second, we have taken a more measured view of European volumes in the second half, particularly in Germany, our largest market by volume, and pronounced in certain discretionary retail categories. German retail sales grew less than 1% in real terms in the first half, consistent with conditions reported across the German retail sector this season. Our guidance assumes Germany stays soft through the second half rather than recovering. U.S. volume expectations are unchanged, and the U.S. remains our fastest-growing large region, with growth expected to be strong in the second half as we scale a number of significant PSP integrations and enter our first peak season with marquee merchants. Full-year revenue of $4.08–4.16 billion, against above $4.34 billion previously, represents a reported take rate of 2.74–2.75% of GMV. Approximately 10 basis points of GMV of that change comes from the presentation change described below, with the remainder following the volume. Excluding the presentation change, the implied take rate is 2.84–2.85%, up versus the 2.80% we previously guided, so on a comparable basis we are earning more revenue on every dollar we process. Full-year adjusted operating income is expected to be $280–300 million, at 6.9–7.2% of revenue, more than four times the $65 million delivered in the whole of 2025, and against $159 million already delivered in the first half of 2026. For the third quarter, we are guiding to GMV of $35–36 billion, revenue of $940–980 million, transaction margin dollars of $340–360 million, and adjusted operating income of $5–15 million. The third quarter is deliberately our investment quarter, funding the largest set of launches in our history, with marketing landing ahead of the volume it drives. It will also carry the highest level of share-based payments in 2026, reflecting the vesting and grants from our annual compensation review. 9 Klarna Q2’26 Earnings Release
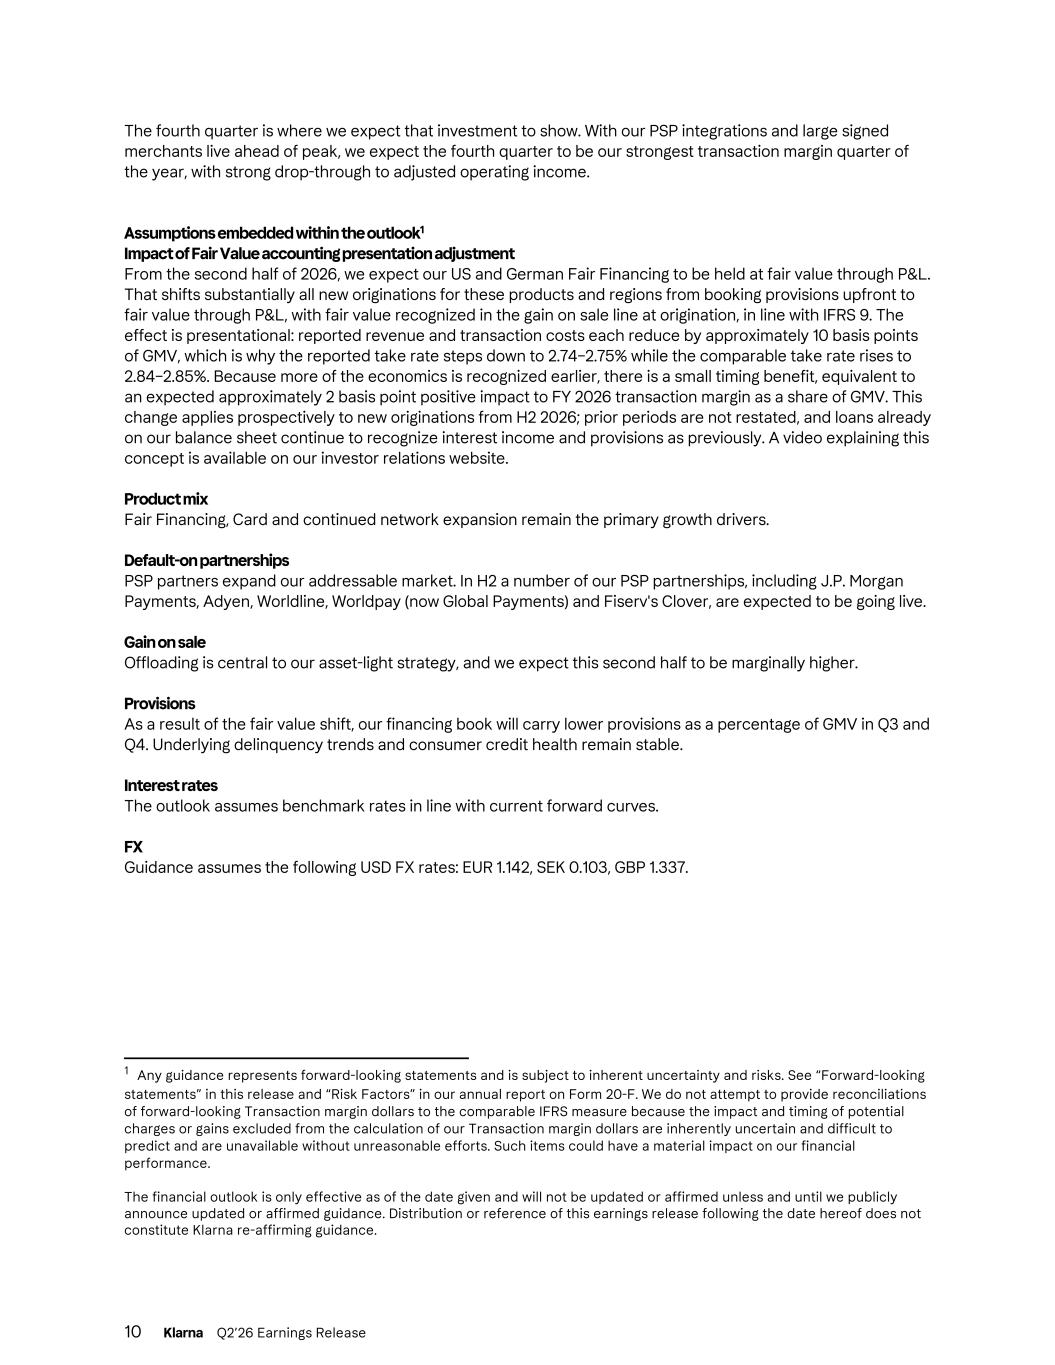
The fourth quarter is where we expect that investment to show. With our PSP integrations and large signed merchants live ahead of peak, we expect the fourth quarter to be our strongest transaction margin quarter of the year, with strong drop-through to adjusted operating income. Assumptions embedded within the outlook1 Impact of Fair Value accounting presentation adjustment From the second half of 2026, we expect our US and German Fair Financing to be held at fair value through P&L. That shifts substantially all new originations for these products and regions from booking provisions upfront to fair value through P&L, with fair value recognized in the gain on sale line at origination, in line with IFRS 9. The effect is presentational: reported revenue and transaction costs each reduce by approximately 10 basis points of GMV, which is why the reported take rate steps down to 2.74–2.75% while the comparable take rate rises to 2.84–2.85%. Because more of the economics is recognized earlier, there is a small timing benefit, equivalent to an expected approximately 2 basis point positive impact to FY 2026 transaction margin as a share of GMV. This change applies prospectively to new originations from H2 2026; prior periods are not restated, and loans already on our balance sheet continue to recognize interest income and provisions as previously. A video explaining this concept is available on our investor relations website. Product mix Fair Financing, Card and continued network expansion remain the primary growth drivers. Default-on partnerships PSP partners expand our addressable market. In H2 a number of our PSP partnerships, including J.P. Morgan Payments, Adyen, Worldline, Worldpay (now Global Payments) and Fiserv's Clover, are expected to be going live. Gain on sale Offloading is central to our asset-light strategy, and we expect this second half to be marginally higher. Provisions As a result of the fair value shift, our financing book will carry lower provisions as a percentage of GMV in Q3 and Q4. Underlying delinquency trends and consumer credit health remain stable. Interest rates The outlook assumes benchmark rates in line with current forward curves. FX Guidance assumes the following USD FX rates: EUR 1.142, SEK 0.103, GBP 1.337. 10 Klarna Q2’26 Earnings Release 1 Any guidance represents forward-looking statements and is subject to inherent uncertainty and risks. See “Forward-looking statements” in this release and “Risk Factors” in our annual report on Form 20-F. We do not attempt to provide reconciliations of forward-looking Transaction margin dollars to the comparable IFRS measure because the impact and timing of potential charges or gains excluded from the calculation of our Transaction margin dollars are inherently uncertain and difficult to predict and are unavailable without unreasonable efforts. Such items could have a material impact on our financial performance. The financial outlook is only effective as of the date given and will not be updated or affirmed unless and until we publicly announce updated or affirmed guidance. Distribution or reference of this earnings release following the date hereof does not constitute Klarna re-affirming guidance.
Conference call Klarna will host a conference call and webcast to discuss its second quarter 2026 financial results on August 18, 2026, at 8:30 am ET. Participating on the call will be: • Sebastian Siemiatkowski, Chief Executive Officer, and • Niclas Neglen, Chief Financial Officer. The conference call will be webcast live on Klarna’s investor relations website at investors.klarna.com. A replay will be available on the same website following the call. 11 Klarna Q2’26 Earnings Release
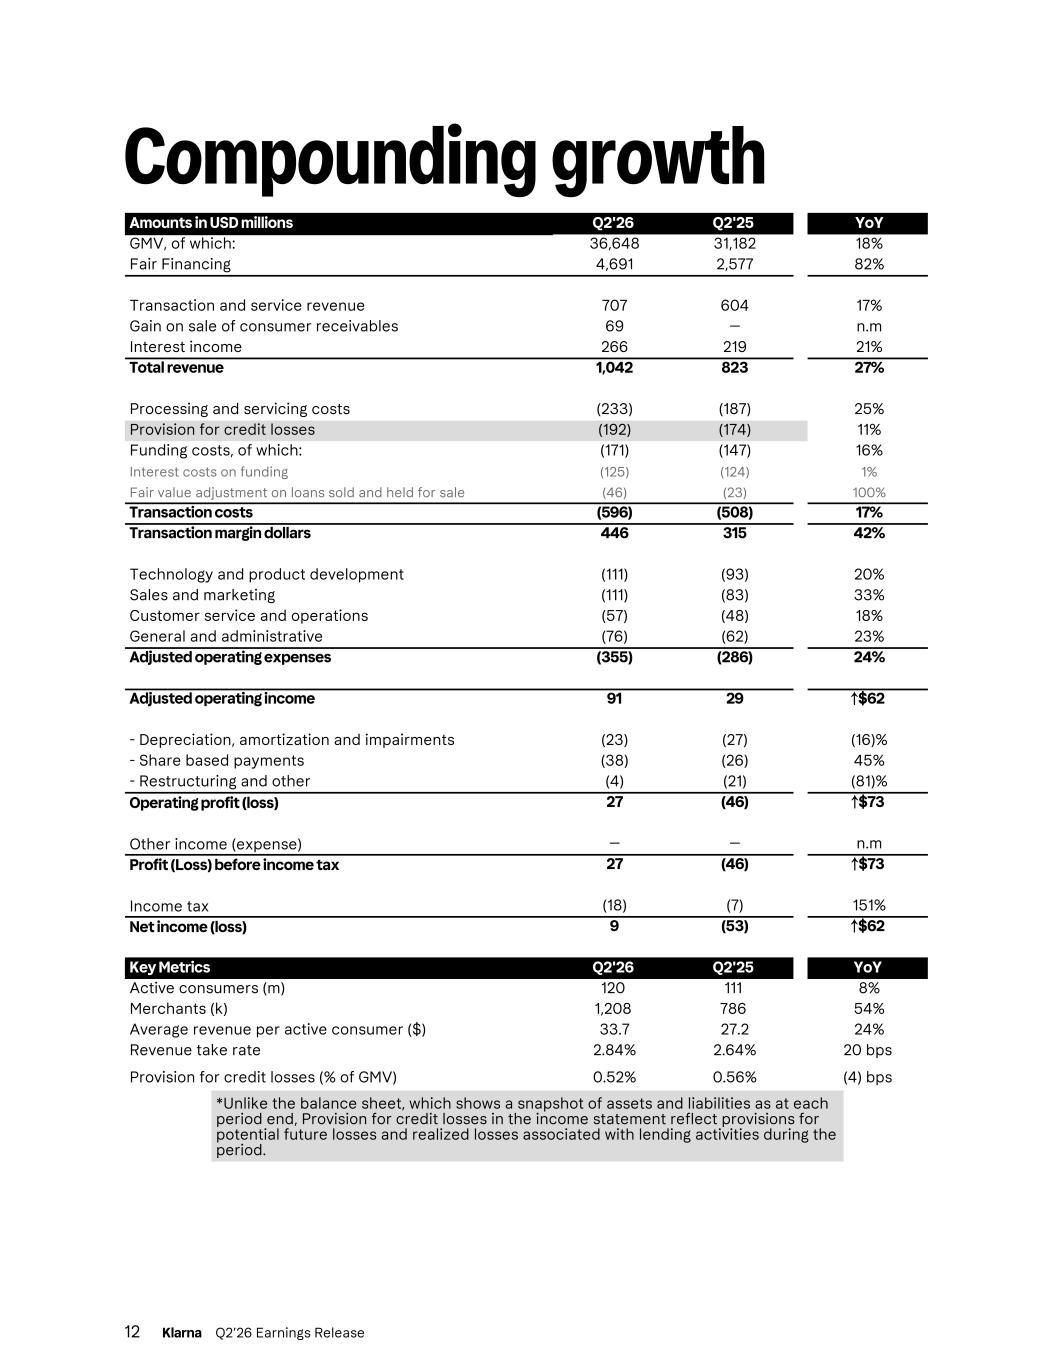
Compounding growth Amounts in USD millions Q2'26 Q2'25 YoY GMV, of which: 36,648 31,182 18% Fair Financing 4,691 2,577 82% Transaction and service revenue 707 604 17% Gain on sale of consumer receivables 69 — n.m Interest income 266 219 21% Total revenue 1,042 823 27% Processing and servicing costs (233) (187) 25% Provision for credit losses (192) (174) 11% Funding costs, of which: (171) (147) 16% Interest costs on funding (125) (124) 1% Fair value adjustment on loans sold and held for sale (46) (23) 100% Transaction costs (596) (508) 17% Transaction margin dollars 446 315 42% Technology and product development (111) (93) 20% Sales and marketing (111) (83) 33% Customer service and operations (57) (48) 18% General and administrative (76) (62) 23% Adjusted operating expenses (355) (286) 24% Adjusted operating income 91 29 ↑$62 - Depreciation, amortization and impairments (23) (27) (16)% - Share based payments (38) (26) 45% - Restructuring and other (4) (21) (81)% Operating profit (loss) 27 (46) ↑$73 Other income (expense) — — n.m Profit (Loss) before income tax 27 (46) ↑$73 Income tax (18) (7) 151% Net income (loss) 9 (53) ↑$62 Key Metrics Q2'26 Q2'25 YoY Active consumers (m) 120 111 8% Merchants (k) 1,208 786 54% Average revenue per active consumer ($) 33.7 27.2 24% Revenue take rate 2.84% 2.64% 20 bps Provision for credit losses (% of GMV) 0.52% 0.56% (4) bps *Unlike the balance sheet, which shows a snapshot of assets and liabilities as at each period end, Provision for credit losses in the income statement reflect provisions for potential future losses and realized losses associated with lending activities during the period. 12 Klarna Q2’26 Earnings Release
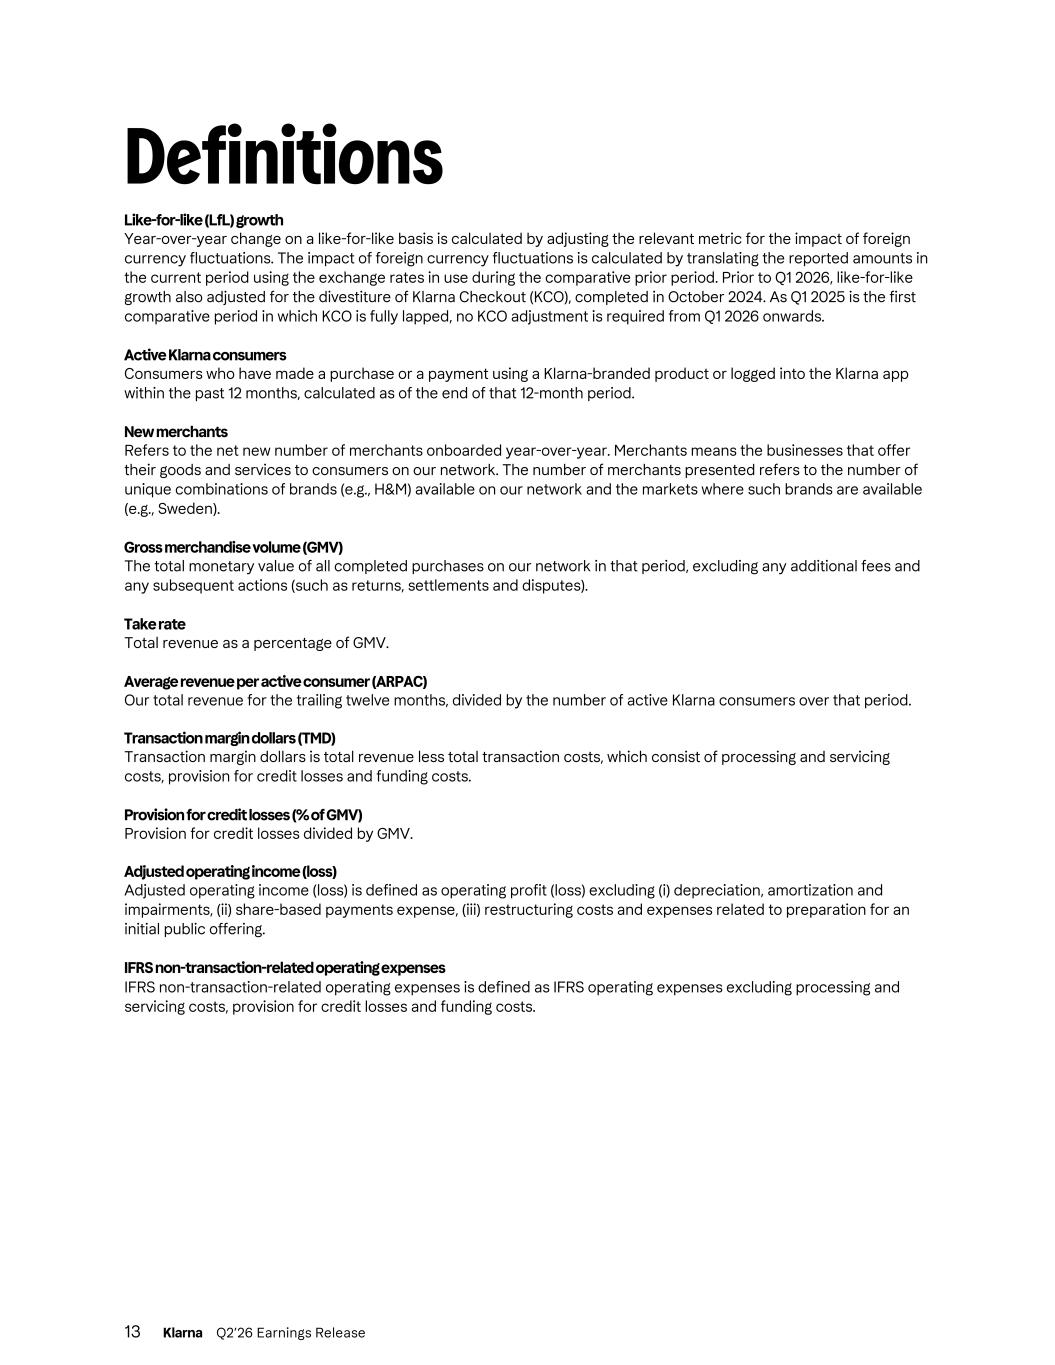
Definitions Like-for-like (LfL) growth Year-over-year change on a like-for-like basis is calculated by adjusting the relevant metric for the impact of foreign currency fluctuations. The impact of foreign currency fluctuations is calculated by translating the reported amounts in the current period using the exchange rates in use during the comparative prior period. Prior to Q1 2026, like-for-like growth also adjusted for the divestiture of Klarna Checkout (KCO), completed in October 2024. As Q1 2025 is the first comparative period in which KCO is fully lapped, no KCO adjustment is required from Q1 2026 onwards. Active Klarna consumers Consumers who have made a purchase or a payment using a Klarna-branded product or logged into the Klarna app within the past 12 months, calculated as of the end of that 12-month period. New merchants Refers to the net new number of merchants onboarded year-over-year. Merchants means the businesses that offer their goods and services to consumers on our network. The number of merchants presented refers to the number of unique combinations of brands (e.g., H&M) available on our network and the markets where such brands are available (e.g., Sweden). Gross merchandise volume (GMV) The total monetary value of all completed purchases on our network in that period, excluding any additional fees and any subsequent actions (such as returns, settlements and disputes). Take rate Total revenue as a percentage of GMV. Average revenue per active consumer (ARPAC) Our total revenue for the trailing twelve months, divided by the number of active Klarna consumers over that period. Transaction margin dollars (TMD) Transaction margin dollars is total revenue less total transaction costs, which consist of processing and servicing costs, provision for credit losses and funding costs. Provision for credit losses (% of GMV) Provision for credit losses divided by GMV. Adjusted operating income (loss) Adjusted operating income (loss) is defined as operating profit (loss) excluding (i) depreciation, amortization and impairments, (ii) share-based payments expense, (iii) restructuring costs and expenses related to preparation for an initial public offering. IFRS non-transaction-related operating expenses IFRS non-transaction-related operating expenses is defined as IFRS operating expenses excluding processing and servicing costs, provision for credit losses and funding costs. 13 Klarna Q2’26 Earnings Release
Non-IFRS measures and reconciliations We use certain non-IFRS financial measures to supplement our consolidated financial statements, which are presented in accordance with IFRS. These non-IFRS financial measures include Transaction margin dollars, Transaction margin, Adjusted operating income (loss), Adjusted operating expenses and Adjusted operating margin. We use these non-IFRS financial measures to facilitate the review of our operational performance and as a basis for strategic planning. We also present period-over-period changes in certain metrics on like-for-like (LfL) basis, which is calculated by adjusting the metric for the impact of foreign currency fluctuations. The impact of foreign currency fluctuations is calculated by translating the reported amounts in the current period using the exchange rates in use during the comparative prior period. Transaction margin dollars and Transaction margin are key performance measures used by our management to measure our ability to attain efficiency and scale and to grow these metrics over time. They measure our success in growing revenue while effectively managing our processing and servicing costs, provision for credit losses and funding costs. In addition, by excluding certain items that are nonrecurring or not reflective of the performance of our normal course of business, we believe that Adjusted operating expenses, Adjusted operating income (loss) and Adjusted operating margin provide meaningful supplemental information regarding our performance. Accordingly, we believe that these non-IFRS financial measures are useful to investors and others because they allow investors to supplement their understanding of our financial trends and evaluate our ongoing and future performance in the same manner as management. However, there are several limitations related to the use of non-IFRS financial measures as they reflect the exercise of judgment by our management about which expenses are excluded or included in determining these non-IFRS measures. These non-IFRS measures should be considered in addition to, not as a substitute for or in isolation from, our financial results prepared in accordance with IFRS. Other companies, including companies in our industry, may calculate these non-IFRS (or similar non-GAAP) financial measures differently or not at all, which reduces their usefulness as comparative measures. Transaction margin dollars is defined as total revenue less total transaction costs, consisting of processing and servicing, provision for credit losses and funding costs. Transaction margin is calculated by dividing Transaction margin dollars by our total revenue. Adjusted operating income (loss) is defined as operating profit (loss) excluding (i) depreciation, amortization and impairments, (ii) share-based payments expense, (iii) restructuring costs and expenses related to preparation for an initial public offering. Adjusted operating expenses are defined as operating expenses excluding (i) depreciation, amortization and impairments, (ii) share-based payments expense and (iii) restructuring costs and expenses related to preparation for an initial public offering. Adjusted operating margin is defined as Adjusted operating income (loss) divided by our total revenue. Depreciation, amortization and impairments below include amounts recorded within Technology and product development expenses in our consolidated statements of profit and loss. We consider the exclusion of certain nonrecurring or noncash items in calculating Adjusted operating income (loss), Adjusted operating margin and Adjusted non-transaction-related operating expenses to provide a useful measure for investors and others to evaluate our operating results and expenses in the same manner as management. 14 Klarna Q2’26 Earnings Release
Forward-looking statements This earnings release contains forward-looking statements within the meaning of applicable securities laws. These statements include, but are not limited to, statements regarding our future financial performance, business strategy, growth objectives, market opportunities, expected timing of becoming live with PSPs and other partners, utilization of our forward-flow and similar arrangements and other operational plans. Words such as "believe," "expect," "anticipate," "intend," "plan," "will," "may," "could," "estimate" and similar expressions identify forward-looking statements. These forward-looking statements are subject to risks, uncertainties, and assumptions that could cause actual results to differ materially from those expressed or implied, including risks related to: • Our ability to retain and grow consumer and merchant relationships; • Competition and technological developments; • Regulatory compliance and licensing requirements; • Credit risk management and funding availability; • General economic conditions and market volatility; and • Our ability to expand into new markets and products. Forward-looking statements reflect our views as of the date of this release and are based on information currently available to us. We undertake no obligation to update any forward-looking statements, except as required by law. Actual results may differ materially from those anticipated. Investors should not place undue reliance on these forward-looking statements and should review the risk factors in our filings with the SEC for a more complete discussion of risks. 15 Klarna Q2’26 Earnings Release
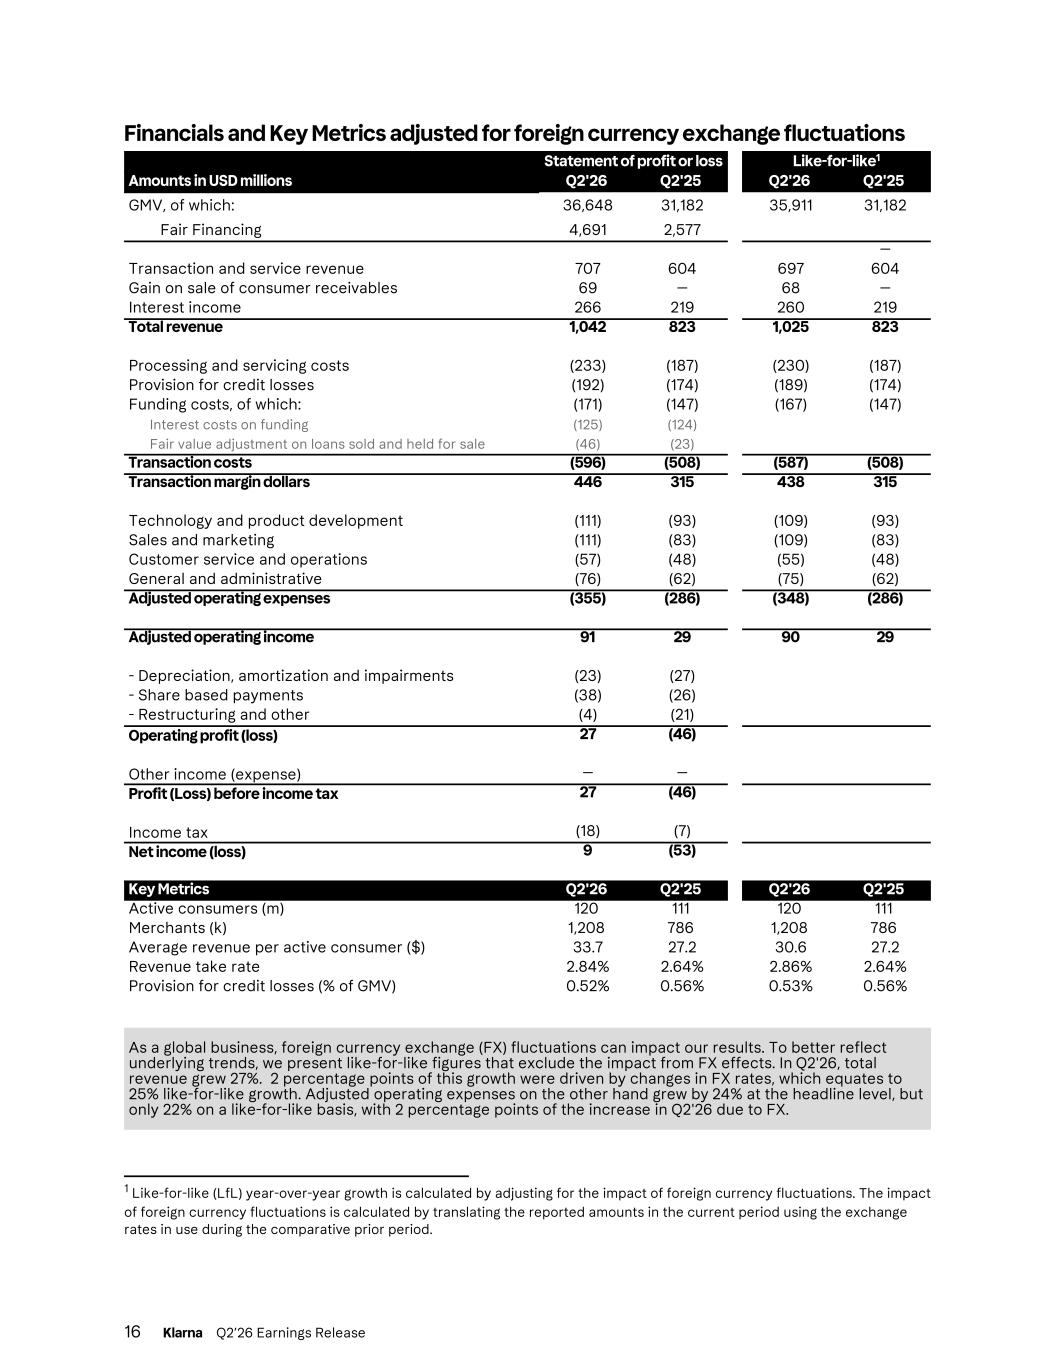
Financials and Key Metrics adjusted for foreign currency exchange fluctuations Statement of profit or loss Like-for-like1 Amounts in USD millions Q2'26 Q2'25 Q2'26 Q2'25 GMV, of which: 36,648 31,182 35,911 31,182 Fair Financing 4,691 2,577 — Transaction and service revenue 707 604 697 604 Gain on sale of consumer receivables 69 — 68 — Interest income 266 219 260 219 Total revenue 1,042 823 1,025 823 Processing and servicing costs (233) (187) (230) (187) Provision for credit losses (192) (174) (189) (174) Funding costs, of which: (171) (147) (167) (147) Interest costs on funding (125) (124) Fair value adjustment on loans sold and held for sale (46) (23) Transaction costs (596) (508) (587) (508) Transaction margin dollars 446 315 438 315 Technology and product development (111) (93) (109) (93) Sales and marketing (111) (83) (109) (83) Customer service and operations (57) (48) (55) (48) General and administrative (76) (62) (75) (62) Adjusted operating expenses (355) (286) (348) (286) Adjusted operating income 91 29 90 29 - Depreciation, amortization and impairments (23) (27) - Share based payments (38) (26) - Restructuring and other (4) (21) Operating profit (loss) 27 (46) Other income (expense) — — Profit (Loss) before income tax 27 (46) Income tax (18) (7) Net income (loss) 9 (53) Key Metrics Q2'26 Q2'25 Q2'26 Q2'25 Active consumers (m) 120 111 120 111 Merchants (k) 1,208 786 1,208 786 Average revenue per active consumer ($) 33.7 27.2 30.6 27.2 Revenue take rate 2.84% 2.64% 2.86% 2.64% Provision for credit losses (% of GMV) 0.52% 0.56% 0.53% 0.56% As a global business, foreign currency exchange (FX) fluctuations can impact our results. To better reflect underlying trends, we present like-for-like figures that exclude the impact from FX effects. In Q2'26, total revenue grew 27%. 2 percentage points of this growth were driven by changes in FX rates, which equates to 25% like-for-like growth. Adjusted operating expenses on the other hand grew by 24% at the headline level, but only 22% on a like-for-like basis, with 2 percentage points of the increase in Q2'26 due to FX. 16 Klarna Q2’26 Earnings Release 1 Like-for-like (LfL) year-over-year growth is calculated by adjusting for the impact of foreign currency fluctuations. The impact of foreign currency fluctuations is calculated by translating the reported amounts in the current period using the exchange rates in use during the comparative prior period.
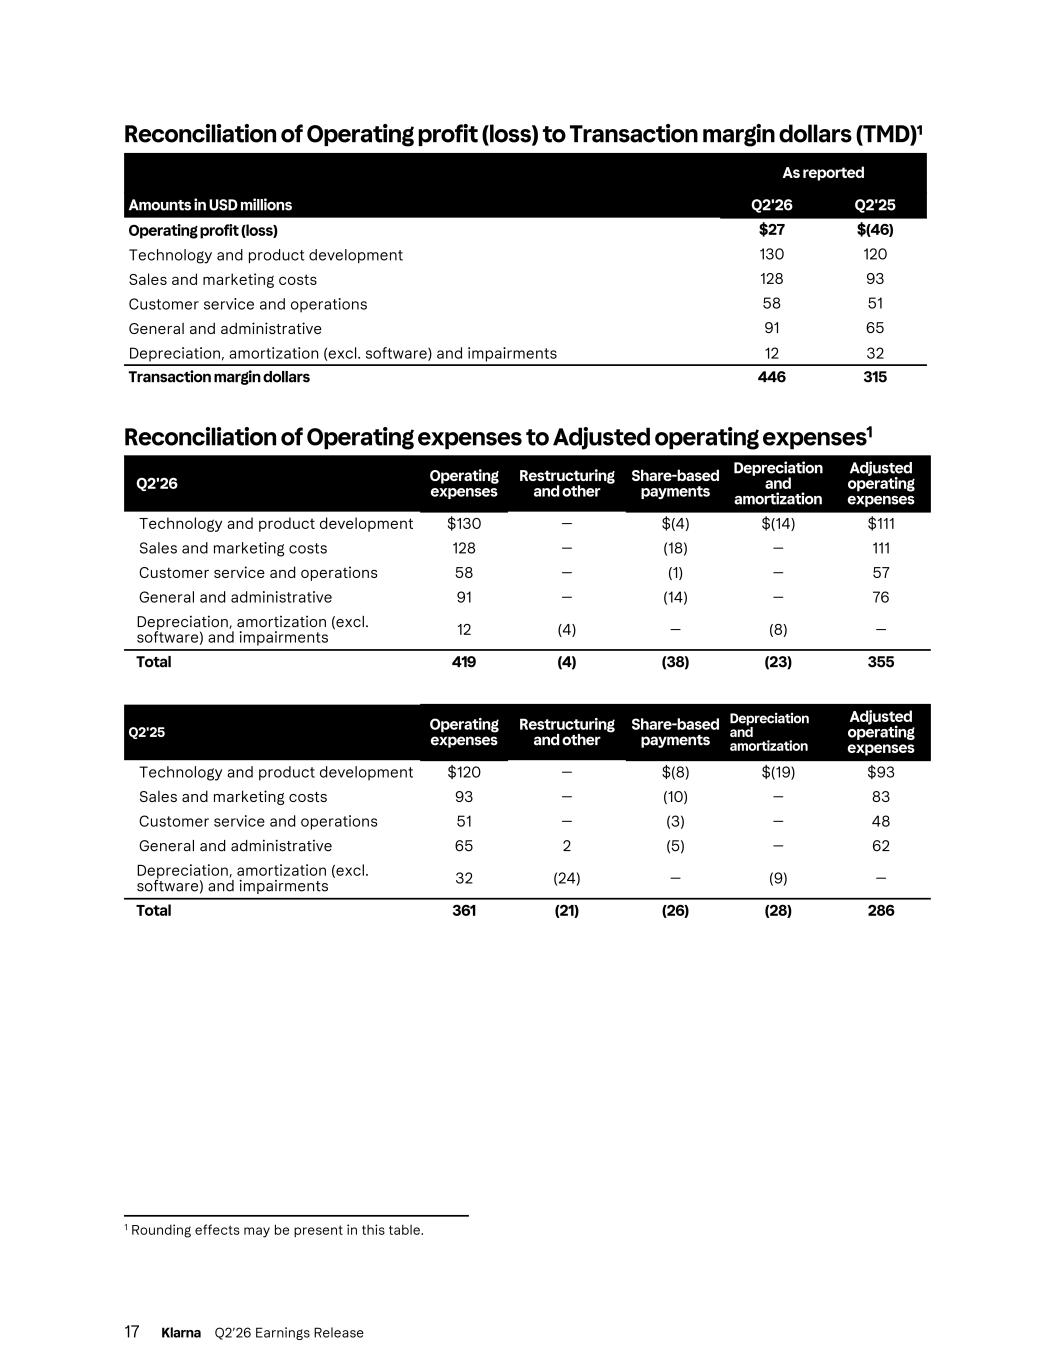
Reconciliation of Operating profit (loss) to Transaction margin dollars (TMD)¹ As reported Amounts in USD millions Q2'26 Q2'25 Operating profit (loss) $27 $(46) Technology and product development 130 120 Sales and marketing costs 128 93 Customer service and operations 58 51 General and administrative 91 65 Depreciation, amortization (excl. software) and impairments 12 32 Transaction margin dollars 446 315 Reconciliation of Operating expenses to Adjusted operating expenses1 Q2'26 Operating expenses Restructuring and other Share-based payments Depreciation and amortization Adjusted operating expenses Technology and product development $130 — $(4) $(14) $111 Sales and marketing costs 128 — (18) — 111 Customer service and operations 58 — (1) — 57 General and administrative 91 — (14) — 76 Depreciation, amortization (excl. software) and impairments 12 (4) — (8) — Total 419 (4) (38) (23) 355 Q2'25 Operating expenses Restructuring and other Share-based payments Depreciation and amortization Adjusted operating expenses Technology and product development $120 — $(8) $(19) $93 Sales and marketing costs 93 — (10) — 83 Customer service and operations 51 — (3) — 48 General and administrative 65 2 (5) — 62 Depreciation, amortization (excl. software) and impairments 32 (24) — (9) — Total 361 (21) (26) (28) 286 17 Klarna Q2’26 Earnings Release 1 Rounding effects may be present in this table.
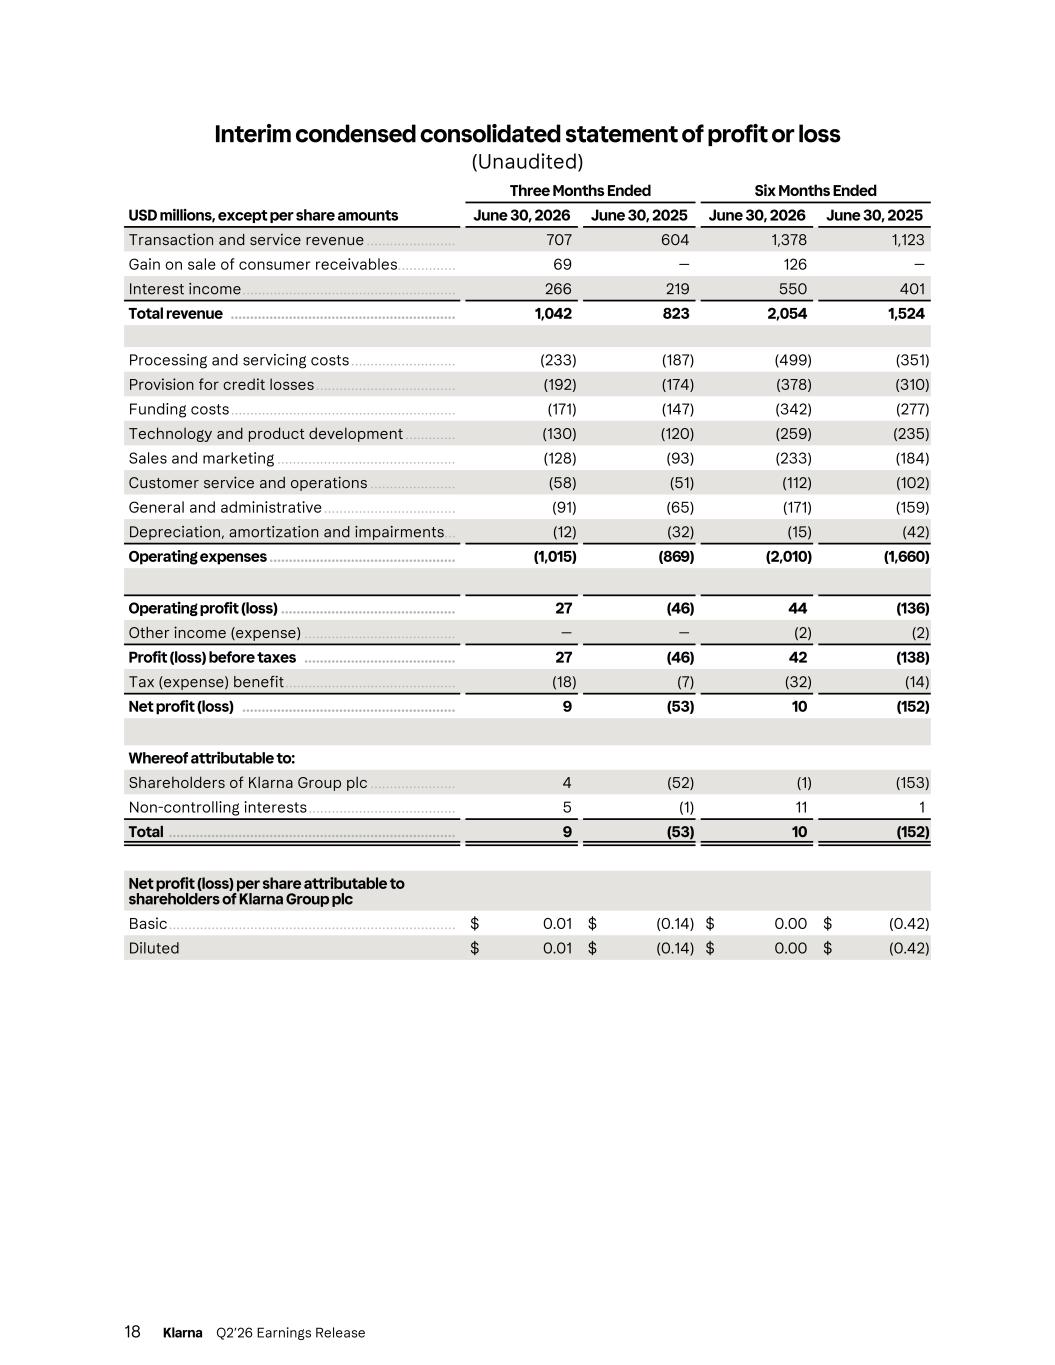
Interim condensed consolidated statement of profit or loss (Unaudited) Three Months Ended Six Months Ended USD millions, except per share amounts June 30, 2026 June 30, 2025 June 30, 2026 June 30, 2025 Transaction and service revenue ....................... 707 604 1,378 1,123 Gain on sale of consumer receivables ............... 69 — 126 — Interest income ....................................................... 266 219 550 401 Total revenue .......................................................... 1,042 823 2,054 1,524 Processing and servicing costs ........................... (233) (187) (499) (351) Provision for credit losses .................................... (192) (174) (378) (310) Funding costs .......................................................... (171) (147) (342) (277) Technology and product development ............. (130) (120) (259) (235) Sales and marketing .............................................. (128) (93) (233) (184) Customer service and operations ...................... (58) (51) (112) (102) General and administrative .................................. (91) (65) (171) (159) Depreciation, amortization and impairments ... (12) (32) (15) (42) Operating expenses ................................................ (1,015) (869) (2,010) (1,660) Operating profit (loss) ............................................. 27 (46) 44 (136) Other income (expense) ....................................... — — (2) (2) Profit (loss) before taxes ....................................... 27 (46) 42 (138) Tax (expense) benefit ............................................ (18) (7) (32) (14) Net profit (loss) ....................................................... 9 (53) 10 (152) Whereof attributable to: Shareholders of Klarna Group plc ...................... 4 (52) (1) (153) Non-controlling interests ...................................... 5 (1) 11 1 Total .......................................................................... 9 (53) 10 (152) Net profit (loss) per share attributable to shareholders of Klarna Group plc Basic .......................................................................... $ 0.01 $ (0.14) $ 0.00 $ (0.42) Diluted $ 0.01 $ (0.14) $ 0.00 $ (0.42) 18 Klarna Q2’26 Earnings Release
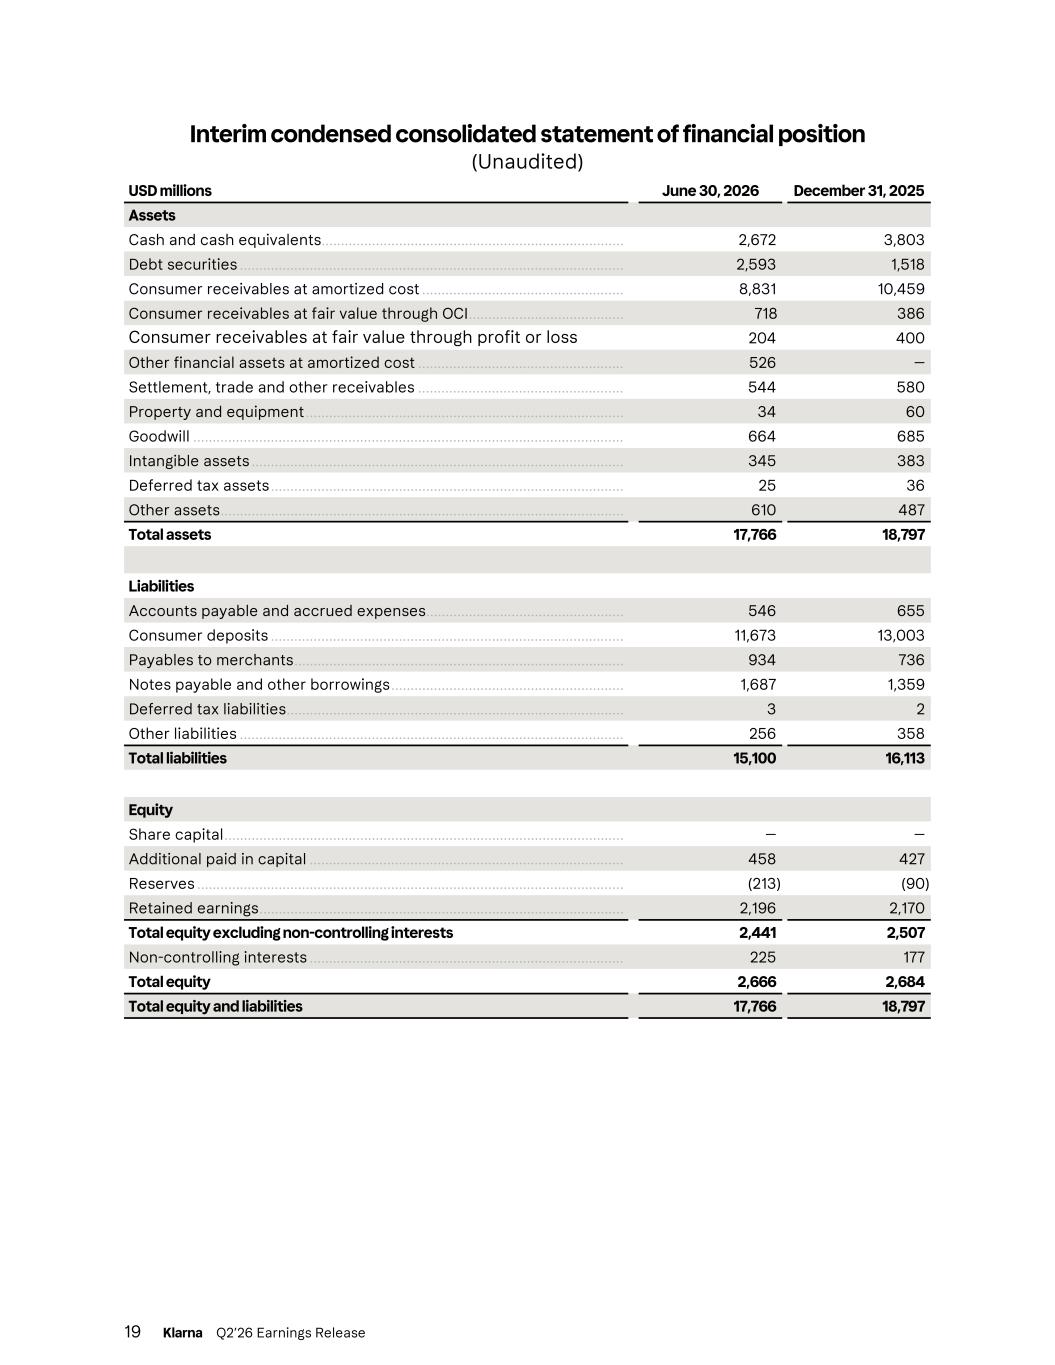
Interim condensed consolidated statement of financial position (Unaudited) USD millions June 30, 2026 December 31, 2025 Assets Cash and cash equivalents .............................................................................. 2,672 3,803 Debt securities ................................................................................................... 2,593 1,518 Consumer receivables at amortized cost .................................................... 8,831 10,459 Consumer receivables at fair value through OCI ........................................ 718 386 Consumer receivables at fair value through profit or loss 204 400 Other financial assets at amortized cost ..................................................... 526 — Settlement, trade and other receivables ..................................................... 544 580 Property and equipment .................................................................................. 34 60 Goodwill ............................................................................................................... 664 685 Intangible assets ................................................................................................ 345 383 Deferred tax assets ........................................................................................... 25 36 Other assets ........................................................................................................ 610 487 Total assets 17,766 18,797 Liabilities Accounts payable and accrued expenses ................................................... 546 655 Consumer deposits ........................................................................................... 11,673 13,003 Payables to merchants ..................................................................................... 934 736 Notes payable and other borrowings ............................................................ 1,687 1,359 Deferred tax liabilities ....................................................................................... 3 2 Other liabilities ................................................................................................... 256 358 Total liabilities 15,100 16,113 Equity Share capital ....................................................................................................... — — Additional paid in capital ................................................................................. 458 427 Reserves .............................................................................................................. (213) (90) Retained earnings .............................................................................................. 2,196 2,170 Total equity excluding non-controlling interests 2,441 2,507 Non-controlling interests ................................................................................. 225 177 Total equity 2,666 2,684 Total equity and liabilities 17,766 18,797 19 Klarna Q2’26 Earnings Release
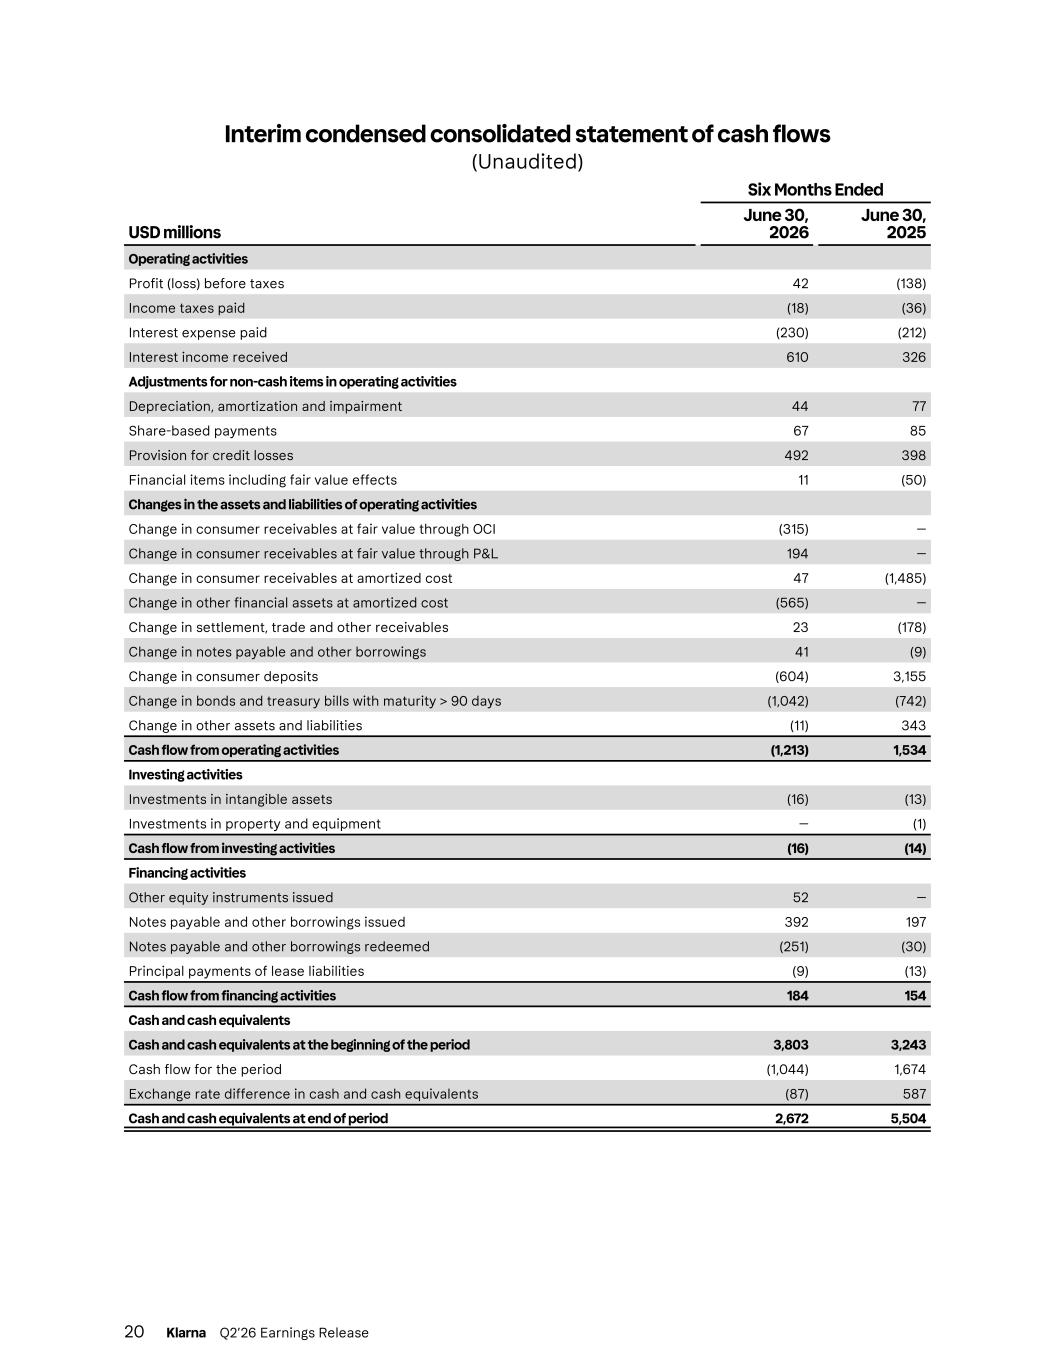
Interim condensed consolidated statement of cash flows (Unaudited) Six Months Ended USD millions June 30, 2026 June 30, 2025 Operating activities Profit (loss) before taxes 42 (138) Income taxes paid (18) (36) Interest expense paid (230) (212) Interest income received 610 326 Adjustments for non-cash items in operating activities Depreciation, amortization and impairment 44 77 Share-based payments 67 85 Provision for credit losses 492 398 Financial items including fair value effects 11 (50) Changes in the assets and liabilities of operating activities Change in consumer receivables at fair value through OCI (315) — Change in consumer receivables at fair value through P&L 194 — Change in consumer receivables at amortized cost 47 (1,485) Change in other financial assets at amortized cost (565) — Change in settlement, trade and other receivables 23 (178) Change in notes payable and other borrowings 41 (9) Change in consumer deposits (604) 3,155 Change in bonds and treasury bills with maturity > 90 days (1,042) (742) Change in other assets and liabilities (11) 343 Cash flow from operating activities (1,213) 1,534 Investing activities Investments in intangible assets (16) (13) Investments in property and equipment — (1) Cash flow from investing activities (16) (14) Financing activities Other equity instruments issued 52 — Notes payable and other borrowings issued 392 197 Notes payable and other borrowings redeemed (251) (30) Principal payments of lease liabilities (9) (13) Cash flow from financing activities 184 154 Cash and cash equivalents Cash and cash equivalents at the beginning of the period 3,803 3,243 Cash flow for the period (1,044) 1,674 Exchange rate difference in cash and cash equivalents (87) 587 Cash and cash equivalents at end of period 2,672 5,504 20 Klarna Q2’26 Earnings Release