Exhibit 99.8


LOGO


MINISTRY OF FINANCE   
2026–27 First Quarter Finances    August 2026


Contents


The First Quarter Finances report contains information about Ontario’s 2026–27 fiscal outlook, primarily as of June 30, 2026.

A. Ontario’s 2026–27 Fiscal Outlook


3 


B. Ontario’s Economic Outlook


8 


C. Details of Ontario’s Finances


10 


D. Ontario’s 2026–27 Borrowing Program  

16 


Highlights


As of the 2026–27 First Quarter Finances, the province’s 2026–27 deficit is projected to be $13.8 billion, consistent with the outlook published in the 2026 Budget.


Revenues in 2026–27 are projected to be $232.0 billion, $0.1 billion higher than forecasted in the 2026 Budget.


Overall program expense in 2026–27 is projected to be $227.1 billion, $0.1 billion higher than forecasted in the 2026 Budget.


In the first calendar quarter of 2026, Ontario’s real gross domestic product (GDP) edged down 0.1 per cent, following a decline of 0.3 per cent in the previous quarter. The first quarter decline was largely due to weaker net trade, which was impacted by heightened external risks, including U.S. tariffs and geopolitical uncertainty.


Private-sector expectations for real GDP growth for 2026 and 2027 have been revised downward since the 2026 Budget. Uncertainty related to U.S. trade policy, along with geopolitical conflicts, continues to remain a key risk to Ontario’s economic outlook.


- 1 -


Introduction


Amid economic and geopolitical uncertainty, the 2026 Budget, released this past spring, delivered a balanced approach—supporting people and businesses through targeted investments, while maintaining prudent fiscal management and a sustainable medium-term outlook.

The 2026–27 First Quarter Finances builds on this successful approach. Ontario’s fiscal outlook remains consistent with the forecast presented in the 2026 Budget, while reflecting additional investments to strengthen social supports and advance economic development priorities. The government will continue to take the necessary actions to protect Ontario, including by building the most competitive economy in the G7 while also investing in critical public services.

While economic growth in Canada and Ontario was weak in the first quarter of 2026, a number of key monthly indicators suggest economic growth resumed in the second quarter of 2026.

Following the release of the 2026 Budget, all four major credit rating agencies—Moody’s, Fitch, Morningstar DBRS and S&P Global—affirmed Ontario’s AA credit rating with a stable outlook. This reflects Ontario’s commitment to maintaining its targets for debt sustainability measures, despite the economic and geopolitical uncertainties the province is currently facing.

The government will continue to monitor economic and fiscal risks, and will provide its next update as part of the 2026 Ontario Economic Outlook and Fiscal Review, to be released by November 15, 2026.


- 2 -


Section A: Ontario’s 2026–27 Fiscal Outlook


The province’s 2026–27 deficit is projected to be unchanged from the outlook of $13.8 billion published in the 2026 Budget.

Revenues in 2026–27 are projected to be $232.0 billion, $0.1 billion higher than forecasted in the 2026 Budget.

Program expense in 2026–27 is projected to be $227.1 billion, $0.1 billion higher than forecasted in the 2026 Budget.

Interest and Other Debt Servicing Charges in 2026–27 is projected to remain unchanged at $17.2 billion, as forecasted in the 2026 Budget.

The net debt-to-GDP ratio is projected to be 37.7 per cent in 2026–27, consistent with the forecast in the 2026 Budget.

The 2026 Budget included a $1.5 billion reserve in 2026–27, to protect the fiscal outlook against any unforeseen changes in the province’s revenue and expense forecasts. With the release of the 2026–27 First Quarter Finances, the reserve has remained unchanged. The reserve provides prudence in the government’s fiscal framework and is distinct from contingency funds that are set aside for dedicated funding. The reserve can be used to safeguard against any events and uncertainty that may arise, or can be eliminated if not needed as part of year-end projections, supporting the government’s ability to protect the fiscal plan and uphold prudent financial management.

Additionally, the Contingency Fund is maintained to help mitigate expense risks for example, in cases where health and safety may be compromised, or unforeseen events which may otherwise adversely affect Ontario’s fiscal performance. The government has allocated $0.2 billion from this year’s Contingency Fund, leaving a balance of $1.3 billion for 2026–27.

Table 1

2026–27 In-Year Fiscal Performance


($ Millions)                   
       
      2026 Budget      Current Outlook      In-Year  Change  

Revenue

     231,856       231,996       140  

Expense


Programs

     226,963       227,103       140  

Interest and Other Debt Servicing Charges

     17,237       17,237        

Total Expense

     244,200       244,340       140  

Surplus/(Deficit) Before Reserve

     (12,344     (12,344      

Reserve

     1,500       1,500        

Surplus/(Deficit)

     (13,844     (13,844      

Notes: Numbers may not add due to rounding. Current outlook primarily reflects information available as of June 30, 2026.

Sources: Ontario Treasury Board Secretariat and Ontario Ministry of Finance.


- 3 -


Revenue

The outlook for revenue in 2026–27 is projected to be $232.0 billion, an increase of $0.1 billion compared to the 2026 Budget. The increase reflects federal funding to provide evacuation support services to First Nation communities affected by spring flooding and other emergencies.

Table 2

Key Changes to 2026–27 Revenue Projections


($ Millions)       
   
      2026–27  

2026 Budget Total Revenue

     231,856  
          

Revenue Changes Since the 2026 Budget


Government of Canada Transfers

     140  

Total Revenue Changes Since the 2026 Budget

     140  
          

2026–27 First Quarter Finances Total Revenue Outlook

     231,996  

Notes: Numbers may not add due to rounding. Current outlook primarily reflects information available as of June 30, 2026.

Source: Ontario Ministry of Finance.

Additional developments could materially affect the 2026–27 revenue outlook as new information becomes available during and after the end of the 2026–27 fiscal year. These include changes to the economic growth outlook, the results from tax return processing, revenue collections from Ontario-administered taxes and the earnings of government business enterprises. The government will monitor these developments and provide further details in future fiscal updates.


- 4 -


Expense

Total expense in 2026–27 is projected to be $244.3 billion, $0.1 billion higher than the 2026 Budget projection. In-year expenditure items in the first quarter of 2026 were fully offset through revenues or the Contingency Fund.

Table 3

Key Changes to 2026–27 Total Expense Projections


($ Millions)              
     
              2026–27  

2026 Budget Total Expense

              244,200  
                   

Total Program Expense Changes Since the 2026 Budget


Toronto New Deal Agreement – Shelter Operations and Homelessness

     200           

First Nations Emergency Evacuations on behalf of Indigenous Services Canada

     140           

Northern Shield Energy Corridor

     14           

Support Partner Needs Related to Critical Infrastructure and Priority Projects in Ring of Fire

     6           

Total Program Expense Changes Since the 2026 Budget

              360  
                   

Drawdown of the Contingency Fund

              (220
                   

Total Net Program Expense Changes Since the 2026 Budget

              140  

Interest and Other Debt Servicing Charges Change Since the 2026 Budget

              –   

Total Expense Changes Since the 2026 Budget

              140  
                   

2026–27 First Quarter Finances Total Expense Outlook

              244,340  

Notes: Numbers may not add due to rounding. Current outlook primarily reflects information available as of June 30, 2026.

Sources: Ontario Treasury Board Secretariat and Ontario Ministry of Finance.


- 5 -


Program Expense Update

Total program expense in 2026–27 is projected to be $227.1 billion, $0.1 billion higher than forecasted in the 2026 Budget.

Key changes to program expense projections since the release of the 2026 Budget include:


$200.0 million as part of the New Deal for Toronto to support shelters and homelessness programs;


$140.0 million, reflecting federal funding to provide evacuation support services to First Nation communities affected by spring flooding and other emergencies;


$14.0 million to continue to support the feasibility study for the Northern Shield Energy Corridor, a 3,300 km crude oil pipeline and energy corridor from Alberta to Ontario; and


$5.7 million for community supports, as part of the continued implementation of the Community Partnership Agreements with the Webequie and Marten Falls First Nations, to unlock the economic benefits of the Ring of Fire.

Interest and Other Debt Servicing Charges Expense Update

Interest and Other Debt Servicing Charges expense is projected to be $17.2 billion in 2026–27, consistent with the forecast in the 2026 Budget. Interest rates have been within the range anticipated since the 2026 Budget. As a result, Ontario’s cost of borrowing for 2026–27 remains unchanged at 4.1 per cent.


- 6 -


Fiscal Prudence

The Fiscal Sustainability, Transparency and Accountability Act, 2019 requires Ontario’s fiscal plan to incorporate prudence in the form of a reserve, to protect the fiscal outlook against unforeseen changes in the province’s revenue and expenses, including those resulting from Ontario’s economic performance. The 2026 Budget included a reserve of $1.5 billion in 2026–27, which has been maintained as part of the current fiscal outlook.

The Contingency Fund is also maintained, to address expense risks such as circumstances that may impact health and safety or unforeseen events that could adversely affect Ontario’s fiscal performance. The remaining balance of the Contingency Fund is $1.3 billion in 2026–27.


- 7 -


Section B: Ontario’s Economic Outlook


Economic Outlook

In the first calendar quarter of 2026, Ontario’s real GDP edged down 0.1 per cent, following a decline of 0.3 per cent in the previous quarter. The first quarter decline was largely due to weaker net trade, which was impacted by heightened external risks, including U.S. tariffs and geopolitical uncertainty. Several key monthly indicators suggest economic growth resumed in the second quarter of 2026.

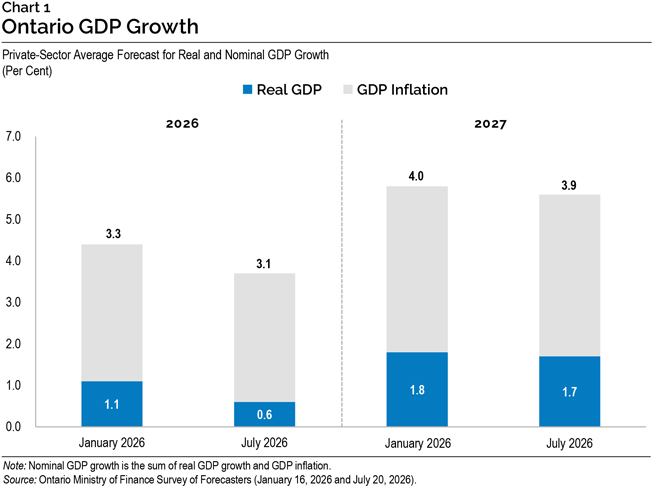
Since the release of the 2026 Budget, expectations for Ontario’s real GDP growth from private-sector forecasters have, on average, been revised downward for 2026 and 2027. Private-sector forecasters, on average, project Ontario’s real GDP to rise by 0.6 per cent in 2026, below the 1.1 per cent growth projected at the time of the 2026 Budget. The private-sector forecast average for 2027 has been revised down slightly, to 1.7 per cent from 1.8 per cent at the time of the 2026 Budget.

The current private-sector forecast average for Ontario’s nominal GDP growth for 2026 is 3.1 per cent, below the projection of 3.3 per cent at the time of the 2026 Budget. The private-sector forecast average for 2027 has been revised slightly lower, to 3.9 per cent from 4.0 per cent.


LOGO


- 8 -


Global economic growth has been resilient, despite uncertainty surrounding U.S. trade policy and geopolitical tensions. The International Monetary Fund projects global real GDP to rise by 3.0 per cent in 2026 and 3.4 per cent in 2027, compared to the projected increases of 3.3 per cent in 2026 and 3.2 per cent in 2027 at the time of the 2026 Budget.

In the United States, forecasters anticipate real GDP to increase by 2.1 per cent in 2026, revised down from 2.4 per cent at the time of the 2026 Budget, according to the Blue Chip Economic Indicators survey, while the forecast for real GDP growth in 2027 eased from 2.1 per cent to 2.0 per cent.

U.S. trade policy and associated uncertainty remain a key risk to Ontario’s economic outlook. Escalating trade tensions could continue to weaken export demand and business investment, dampening economic growth. A prolonged conflict in the Middle East could result in further supply-chain disruptions, contributing to volatility in energy prices and inflationary pressures.


- 9 -


Section C: Details of Ontario’s Finances


Table 4

Revenue


($ Millions)  


2026–27


2026

 Budget

     Current
  Outlook
     In-Year 
  Change 
 

Taxation Revenue


Personal Income Tax

     65,108        65,108        –   

Sales Tax

     39,871        39,871        –   

Corporations Tax

     28,618        28,618        –   

Education Property Tax

     5,981        5,981        –   

Employer Health Tax

     9,812        9,812        –   

Ontario Health Premium

     5,518        5,518        –   

Gasoline Tax

     1,737        1,737        –   

Land Transfer Tax

     3,785        3,785        –   

Tobacco Tax

     602        602        –   

Fuel Tax

     540        540        –   

Beer, Wine and Spirits Taxes

     262        262        –   

Electricity Payments in Lieu of Taxes

     350        350        –   

Ontario Portion of the Federal Cannabis Excise Duty

     405        405        –   

Other Taxes

     1,043        1,043        –   
       163,633        163,633        –   

Government of Canada Transfers


Canada Health Transfer

     22,406        22,406        –   

Canada Social Transfer

     7,000        7,000        –   

Equalization

     406        406        –   

Infrastructure Programs

     1,104        1,104        –   

Labour Market Programs

     1,064        1,064        –   

Social Housing Agreement

     98        98        –   

Other Federal Payments

     7,070        7,210        140  

Direct Transfers to Broader Public Sector Organizations

     684        684        –   
       39,831        39,971        140  

Income from Government Business Enterprises


Liquor Control Board of Ontario

     1,896        1,896        –   

Ontario Power Generation Inc./Hydro One Ltd.

     1,818        1,818        –   

Ontario Lottery and Gaming Corporation

     2,219        2,219        –   

Ontario Cannabis Store

     236        236        –   

iGaming Ontario

     294        294        –   
       6,462        6,462        –   
continued


- 10 -


Table 4 (continued)

Revenue

($ Millions)


      2026–27
     

2026

Budget


Current
Outlook


In-Year
Change


Other Non-Tax Revenue


Fees, Donations and Other Revenues from Hospitals, School Boards and Colleges

     11,066        11,066      – 

Vehicle and Driver Registration Fees

     1,251        1,251      – 

Miscellaneous Other Non-Tax Revenue

     2,124        2,124      – 

Other Fees and Licences

     2,010        2,010      – 

Sales and Rentals

     2,069        2,069      – 

Reimbursements

     1,278        1,278      – 

Royalties

     311        311      – 

Power Supply Contract Recoveries

     42        42      – 

Interest and Investment Income

     1,779        1,779      – 
       21,930        21,930      – 

Total Revenue

       231,856          231,996         140

Notes: Numbers may not add due to rounding. Current outlook primarily reflects information available as of June 30, 2026.

Source: Ontario Ministry of Finance.


- 11 -


Table 5

Total Expense

($ Millions)


     2026–27
Ministry Expense


2026 Budget


Current Outlook


In-Year Change


Agriculture, Food and Agribusiness (Base)

     320.9        320.9     

Demand-Driven Risk Management and Time-Limited Programs

     710.3        710.3     

Agriculture, Food and Agribusiness (Total)

     1,031.2        1,031.2     

Attorney General (Base)

     2,428.8        2,428.8     

Bad Debt Expense

     5.3        5.3     

Attorney General (Total)

     2,434.1        2,434.1     

Board of Internal Economy (Total)

     399.2        399.2     

Children, Community and Social Services (Total)

     21,425.5        21,425.5     

Citizenship and Multiculturalism (Total)

     83.0        83.0     

Colleges, Universities, Research Excellence and Security (Base)

     11,512.4        11,512.4     

Student Financial Assistance

     2,448.4        2,448.4     

Colleges, Universities, Research Excellence and Security (Total)

     13,960.8        13,960.8     

Economic Development, Job Creation and Trade (Base)

     210.5        210.5     

Tax Credits for Business Investment and Research and Development1

     758.3        758.3     

Time-Limited Investments

     950.3        950.3     

Economic Development, Job Creation and Trade (Total)

     1,919.1        1,919.1     

Education (Base)

     40,762.1        40,762.1     

Teachers’ Pension Plan

     1,787.0        1,787.0     

Education (Total)

     42,549.1        42,549.1     

Emergency Preparedness and Response (Base)

     69.9        69.9     

First Nations Emergency Evacuations on behalf of Indigenous

Services Canada

            140.0      140.0

Emergency Preparedness and Response (Total)

     69.9        209.9     

140.0

Energy and Mines (Base)

     701.1        701.1     

Electricity Cost Relief Programs

     6,913.1        6,913.1     

High-Speed Internet

     351.1        351.1     

Time-Limited Investments

     89.8        89.8     

Energy and Mines (Total)

     8,055.0        8,055.0     

Environment, Conservation and Parks (Total)

     1,191.2        1,191.2     

Executive Offices (Total)

     82.6        82.6     

Finance (Base)

     1,072.1        1,072.1     

Investment Management Corporation of Ontario

     321.7        321.7     

Ontario Municipal Partnership Fund

     600.0        600.0     

Temporary and Other Local Assistance

     17.7        17.7     

Power Supply Contract Costs

     42.5        42.5     

Finance (Total)

     2,053.9        2,053.9     

Francophone Affairs (Base)

     8.9        8.9     

Time-Limited Investments

     4.4        4.4     

Francophone Affairs (Total)

     13.3        13.3     

Health (Total)

     91,800.0        91,812.0     

12.0

Indigenous Affairs and First Nations Economic Reconciliation (Total)

     179.0        184.7     

5.7

Infrastructure (Base)

     821.0        835.0      14.0

Federal-Provincial Infrastructure Programs

     121.6        121.6     

Waterfront Toronto Revitalization (Port Lands Flood Protection)

     35.0        35.0     

Municipal Infrastructure Program Investments

     600.0        600.0     

Realty

     1,655.2        1,655.2     

Infrastructure (Total)

     3,232.7        3,246.7     

14.0

continued...


- 12 -


Table 5 (continued)

Total Expense

($ Millions)


     2026–27
Ministry Expense


2026 Budget


Current Outlook


In-Year Change


Labour, Immigration, Training and Skills Development (Base)

     242.0        242.0     

Co-operative Education Tax Credit

     98.1        98.1     

Demand-Driven Employment and Training Programs

     1,631.1        1,631.1     

Labour, Immigration, Training and Skills Development (Total)

     1,971.2        1,971.2     

Long-Term Care (Total)2

     9,354.0        9,342.0     

(12.0)

Municipal Affairs and Housing (Base)

     803.1        803.1     

Time-Limited Investments

     991.3        1,191.3      200.0

Municipal Affairs and Housing (Total)

     1,794.3        1,994.3     

200.0

Natural Resources (Base)

     739.5        739.5     

Emergency Forest Firefighting

     150.0        150.0     

Natural Resources (Total)

     889.5        889.5     

Northern Economic Development and Growth (Total)

     927.9        927.9     

Public and Business Service Delivery and Procurement (Total)

     1,522.1        1,522.1     

Rural Affairs (Total)

     19.3        19.3     

Seniors and Accessibility (Base)

     77.9        77.9     

Seniors Tax Credit

     100.2        100.2     

Seniors and Accessibility (Total)

     178.1        178.1     

Solicitor General (Total)

     4,832.3        4,832.3     

Sport (Base)

     63.9        63.9     

Time-Limited Investments

     221.2        221.2     

Sport (Total)

     285.1        285.1     

Tourism, Culture and Gaming (Base)

     1,201.8        1,201.8     

Ontario Cultural Media Tax Credits

     1,046.2        1,046.2     

Tourism, Culture and Gaming (Total)

     2,247.9        2,247.9     

Transportation (Base)

     8,073.1        8,073.1     

Federal-Provincial Infrastructure Programs

     556.3        556.3     

Transportation (Total)

     8,629.4        8,629.4     

Treasury Board Secretariat (Base)

     411.0        411.0     

Employee and Pensioner Benefits

     1,921.0        1,921.0     

Operating Contingency Fund

     1,350.0        1,136.0      (214.0)

Capital Contingency Fund

     150.0        144.3      (5.7)

Treasury Board Secretariat (Total)

     3,832.0        3,612.3     

(219.7)

Interest and Other Debt Servicing Charges3

     17,237.2        17,237.2     

– 

Total Expense

     244,200.0        244,340.0     

140.0

  1 

Includes the estimated cost of tax credit claims for the Regional Opportunities Investment Tax Credit (ROITC), the Ontario Innovation Tax Credit, the Ontario Business-Research Institute Tax Credit and the Ontario Made Manufacturing Investment Tax Credit (OMMITC). Amounts in 2026–27 for the ROITC include the wind-down of the credit for expenditures incurred after 2026. The OMMITC costs include costs starting in 2026–27 for the OMMITC enhancement, but not the OMMITC expansion, the impacts of which are reported separately as a revenue decrease.

  2 

The Ontario Ministry of Long-Term Care total includes expenses incurred by Ontario Health and hospitals for funding for long-term care. These amounts will be consolidated in the total expense of the Ontario Ministry of Health, including $8.0 billion in 2026–27.

  3

Interest and Other Debt Servicing Charges is net of interest capitalized during construction of tangible capital assets of $1,261 million in 2026–27.

Notes: Numbers may not add due to rounding. Current outlook primarily reflects information available as of June 30, 2026.

Sources: Ontario Treasury Board Secretariat and Ontario Ministry of Finance


- 13 -


Table 6

Infrastructure Expenditures

($ Millions)


     2026–27
     2026 Budget      Current Outlook      Change from
2026 Budget
Sector   

Total
Infrastructure
Expenditures


Investment
in Capital
Assets1,2


Transfers
and Other
Infrastructure
Expenditures3


Total
Infrastructure
Expenditures


Total
Infrastructure
Expenditures


Transportation


Transit

     13,789        12,796        993        13,789     

Provincial Highways

     5,391        5,001        385        5,386      (5.7)

Other Transportation, Property and Planning

     261        139        123        261     

Health


Hospitals

     5,602        5,579        22        5,602     

Other Health

     1,413        183        1,229        1,413     

Education

     4,211        4,134        77        4,211     

Postsecondary Education


Colleges and Other

     701        670        32        701     

Universities

     202               202        202     

Social

     583        40        543        583     

Justice

     1,102        1,006        96        1,102     

Other Sectors4

     5,386        3,035        2,355        5,390      3.7

Total Infrastructure Expenditures

     38,641        32,583        6,056        38,639      (2.0)

Less: Other Partner Funding5

     1,897        1,897               1,897     

Total6

     36,744        30,686        6,056        36,742      (2.0)
 1

Includes provincial investment in capital assets of $28.0 billion.

2

Includes $1,261 million in interest capitalized during construction.

3

Includes transfers to municipalities, universities and non-consolidated agencies.

4

Includes high-speed internet infrastructure, government administration, natural resources, and the culture and tourism industries.

5

Other Partner Funding refers to third-party investments, primarily in hospitals, colleges and schools.

6

Includes federal–municipal contributions to provincial infrastructure investments.

Notes: Numbers may not add due to rounding. Current outlook primarily reflects information available as of June 30, 2026.

Source: Ontario Treasury Board Secretariat.


- 14 -


Table 7

Five-Year Review of Selected Financial and Economic Statistics1,2

($ Millions)


              Actual             

Interim


Current
Outlook


2022–23


  2023–24


  2024–25


  2025–26


  2026–27


Revenue

     194,431        208,975        226,161        226,609        231,996  

Expense


Programs

     186,364        195,207        212,129        222,387        227,103  

Interest and Other Debt Servicing Charges3

     13,935        14,461        15,122        16,047        17,237  

Total Expense

     200,299        209,668        227,251        238,434        244,340  

Reserve

                          500        1,500  

Surplus/(Deficit)

     (5,868)        (693)        (1,090)        (12,326)        (13,844)  

Net Debt4

     399,806        409,761        427,050        459,325        485,082  

Accumulated Deficit

     246,007        246,101        247,060        259,386        273,230  

Gross Domestic Product (GDP) at Market Prices

     1,065,260        1,138,592        1,197,020        1,246,433        1,286,319  

Primary Household Income

     689,842        740,660        797,253        831,931        862,712  

Population — July (000s)5

     15,156        15,632        16,145        16,258        16,099  

Net Debt Per Capita4 (dollars)

     26,380        26,212        26,451        28,252        30,131  

Household Income Per Capita (dollars)

     45,517        47,380        49,381        51,170        53,588  

Net Debt as a Per Cent of Revenue4

     207.3%        199.0%        191.2%        204.4%        210.7%  

Interest as a Per Cent of Revenue

     6.4%        5.5%        5.5%        6.3%        6.7%  

Net Debt as a Per Cent of GDP4

     37.5%        36.0%        35.7%        36.9%        37.7%  

Accumulated Deficit as a Per Cent of GDP

     23.1%        21.6%        20.6%        20.8%        21.2%  
 1

Beginning in the 2025 Budget, the Total Revenue, Interest and Other Debt Servicing Charges (IOD), and Total Expense figures for all years have been restated to report interest and investment income as part of revenue and separate from IOD. These changes are fiscally neutral.

2

Actual results for 2023–24 are restated to present an accounting policy change implemented in the Public Accounts of Ontario 2024–2025 regarding the calculation of accrued Corporations Tax Revenue.

3

Interest and Other Debt Servicing Charges is net of interest capitalized during construction of tangible capital assets of $694 million in 2022–23, $978 million in 2023–24, $1,221 million in 2024–25, $1,309 million in 2025–26 and $1,261 million in 2026–27.

4

For 2026–27 and future years, Net Debt reflects financial assets less financial liabilities and is aligned with Net Financial Liabilities, as will be reported in the Public Accounts of Ontario 20262027. A one-year restatement will be provided in the Public Accounts of Ontario 20262027.

5 Population figures are for July 1 of the fiscal year indicated (i.e., for 2026–27, the population on July 1, 2026 is shown).

Notes: Numbers may not add due to rounding. Current outlook primarily reflects information available as of June 30, 2026.

Sources: Statistics Canada, Ontario Treasury Board Secretariat and Ontario Ministry of Finance.


- 15 -


Section D: Ontario’s 2026–27 Borrowing Program


Table 8

Ontario’s 2026–27 Borrowing Program

($ Billions)

      2026–27
     

2026 Budget


Current
  Outlook


Change from 

2026 Budget


Deficit/(Surplus)

     13.8        13.8      – 

Provincial Investment in Capital Assets

     28.0        28.0      – 

Amortization of Capital Assets1

     (10.2)        (10.2)      – 

Non-Cash and Cash Timing Adjustments

     (2.5)        (2.5)      – 

Net Loans and Investments

     5.2        5.2      – 

Debt Maturities/Redemptions

     26.9        26.9      – 

Total Funding Requirement

     61.2        61.2      – 

Decrease/(Increase) in Short-Term Borrowing

     (6.0)        (6.0)      – 

Increase/(Decrease) in Year-End Cash and Cash Equivalents

     (8.0)        (9.0)      (1.0)

Total Long-Term Borrowing

     47.2        46.2      (1.0)
 1

Starting in the 2025 Budget, Amortization of Capital Assets will be reflected in a separate line in this table to reflect the increasing impact of the capital plan on the borrowing program.

Note: Numbers may not add due to rounding.

Source: Ontario Financing Authority.


On March 30, 2026, Ontario issued $1.0 billion, which increased borrowing to $59.6 billion for 2025–26 and reduced the 2026–27 borrowing requirement from $47.2 billion in the 2026 Budget to $46.2 billion.

Green Bonds remain a core component of Ontario’s borrowing program and are an important tool to help finance public transit initiatives, extreme weather-resilient infrastructure, as well as energy efficiency and conservation projects. Ontario remains the largest issuer of Canadian dollar Green Bonds, totalling $24.6 billion issued since 2014–15, with $19.85 billion outstanding.

Interest rates have been within the range forecasted in the 2026 Budget. As a result, Ontario’s cost of borrowing for 2026–27 remains unchanged at 4.1 per cent. Ontario is estimated to pay Interest and Other Debt Servicing Charges of $17.2 billion, consistent with the 2026 Budget.


- 16 -


2026–27 Long-Term Borrowing

Table 9

2026–27 Long-Term Borrowing

($ Billions)


Canadian Dollar Issues

     15.5  

Foreign Currency Issues

     13.3  

Total

     28.8  

Notes: Numbers may not add due to rounding. As of August 5, 2026.

Source: Ontario Financing Authority.


- 17 -


Ministry of Finance


www.ontario.ca/finance

For general inquiries regarding the 2026–27 First Quarter Finances, please call or email:


Toll-free English and French inquiries:

   1–800–337–7222

Teletypewriter (TTY):

   1–800–263–7776

Email:


FinanceCommunications.fin@ontario.ca

© King’s Printer for Ontario, 2026


- 18 -


Chart Descriptions: Alternative Text for

Web Accessibility

Chart 1: Ontario GDP Growth

This stacked bar chart shows private-sector average forecasts in January 2026 and July 2026 for Ontario real GDP growth, GDP inflation and nominal GDP growth in 2026 and 2027. Note that nominal GDP growth is the sum of real GDP growth and GDP inflation.

In January 2026, Ontario’s real GDP was projected to rise by 1.1 per cent in 2026 and nominal GDP to increase by 3.3 per cent. For 2027, real GDP was projected to rise by 1.8 per cent and nominal GDP to grow by 4.0 per cent.

In July 2026, the average of private-sector forecasts projects Ontario’s real GDP to rise by 0.6 per cent in 2026 and nominal GDP to grow by 3.1 per cent. For 2027, real GDP is projected to rise by 1.7 per cent and nominal GDP to increase by 3.9 per cent.

Source: Ontario Ministry of Finance Survey of Forecasters (January 16, 2026 and July 20, 2026).


- 19 -