Shareholder Report
Feb. 28, 2026
USD ($)
Holding
This report describes changes to the Fund that occurred during the reporting period.
What were the Fund costs for the last year? (based on a hypothetical $10,000 investment)
| Cost of a $10,000 investment |
Costs paid as a percentage of $10,000 investment* | |||
| Class I Shares |
$54 | 0.53% | ||
* Annualized for period less than one year.
How did the Fund perform last year? What affected the Fund’s performance?
| Performance Highlights • The Nuveen California Municipal Bond Fund returned 3.93% for Class I Shares at net asset value (NAV) for the 12 months ended February 28, 2026. The Fund underperformed the S&P Municipal Bond California Index, which returned 4.67%. • Top contributors to relative performance • Sector positioning, particularly an underweight to the industrial development revenue bond segment and an overweight to the multi-family housing segment. • An overweight to A‑rated and BBB‑rated bonds. • Top detractors from relative performance • An overweight to non‑rated bonds. • Duration positioning, particularly an overweight to bonds with durations of 10 years and longer. • An out‑of‑benchmark allocation to Puerto Rico sales‑tax bonds. |
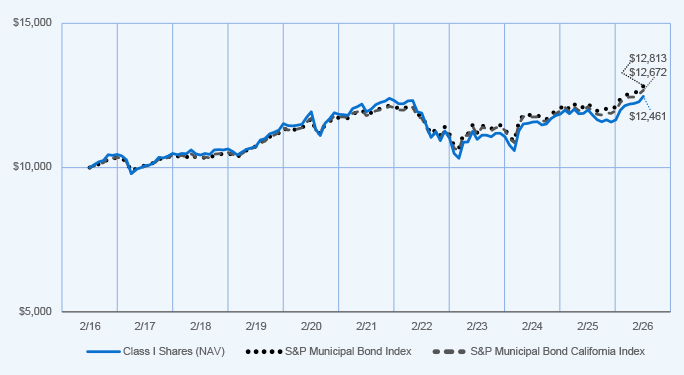
Average Annual Total Returns
| 1‑Year | 5‑Year | 10‑Year | ||||||||||
| Class I Shares at NAV |
3.93 | % | 0.87 | % | 2.22 | % | ||||||
| S&P Municipal Bond Index |
4.85 | % | 1.62 | % | 2.51 | % | ||||||
| S&P Municipal Bond California Index |
4.67 | % | 1.45 | % | 2.40 | % | ||||||
| Lipper California Municipal Debt Funds Classification Average |
3.84 | % | 1.03 | % | 2.13 | % | ||||||
Fund Statistics (as of February 28, 2026)
| Fund net assets |
$1,673,276,126 | |||
| Total number of portfolio holdings |
281 | |||
| Portfolio turnover (%) |
27% | |||
| Total management fees paid for the year |
$ 7,702,590 | |||
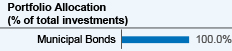
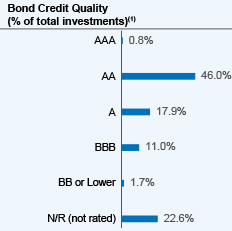
(1) The ratings disclosed are the highest rating given by one of the following national rating agencies: Standard & Poor’s (S&P), Moody’s Investors Service, Inc. (Moody’s) or Fitch, Inc (Fitch). This treatment of split-rated securities may differ from that used for other purposes, such as for Fund investment policies. Credit ratings are subject to change. AAA, AA, A, and BBB are investment grade ratings; BB, B, CCC, CC, C and D are below-investment grade ratings. Holdings designated N/R are not rated by these national ratings agencies.
How has the Fund changed?
For more complete information, you may review the Fund’s next prospectus, which is expected to be available by April 30, 2026 at https://www.nuveen.com/en‑us/mutual‑funds/prospectuses or upon request at (800) 257‑8787.
For more complete information, you may review the Fund’s next prospectus, which is expected to be available by April 30, 2026 at https://www.nuveen.com/en‑us/mutual‑funds/prospectuses or upon request at (800) 257‑8787.
This report describes changes to the Fund that occurred during the reporting period.
What were the Fund costs for the last year? (based on a hypothetical $10,000 investment)
| Cost of a $10,000 investment |
Costs paid as a percentage of $10,000 investment* | |||
| Class C Shares |
$155 | 1.53% | ||
* Annualized for period less than one year.
How did the Fund perform last year? What affected the Fund’s performance?
| Performance Highlights • The Nuveen California Municipal Bond Fund returned 2.91% for Class C Shares at net asset value (NAV) for the 12 months ended February 28, 2026. The Fund underperformed the S&P Municipal Bond California Index, which returned 4.67%. • Top contributors to relative performance • Sector positioning, particularly an underweight to the industrial development revenue bond segment and an overweight to the multi-family housing segment. • An overweight to A‑rated and BBB‑rated bonds. • Top detractors from relative performance • An overweight to non‑rated bonds. • Duration positioning, particularly an overweight to bonds with durations of 10 years and longer. • An out‑of‑benchmark allocation to Puerto Rico sales‑tax bonds. |
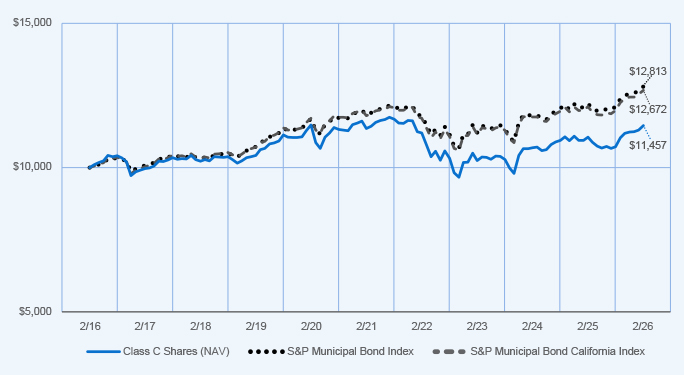
Average Annual Total Returns
| 1‑Year | 5‑Year | 10‑Year | ||||||||||
| Class C Shares at NAV (excluding maximum sales charge) |
2.91 | % | (0.14 | )% | 1.37 | % | ||||||
| S&P Municipal Bond Index |
4.85 | % | 1.62 | % | 2.51 | % | ||||||
| S&P Municipal Bond California Index |
4.67 | % | 1.45 | % | 2.40 | % | ||||||
| Lipper California Municipal Debt Funds Classification Average |
3.84 | % | 1.03 | % | 2.13 | % | ||||||
Fund Statistics (as of February 28, 2026)
| Fund net assets |
$1,673,276,126 | |||
| Total number of portfolio holdings |
281 | |||
| Portfolio turnover (%) |
27% | |||
| Total management fees paid for the year |
$ 7,702,590 | |||
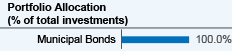
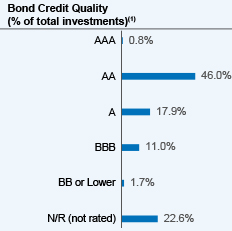
(1) The ratings disclosed are the highest rating given by one of the following national rating agencies: Standard & Poor’s (S&P), Moody’s Investors Service, Inc. (Moody’s) or Fitch, Inc (Fitch). This treatment of split-rated securities may differ from that used for other purposes, such as for Fund investment policies. Credit ratings are subject to change. AAA, AA, A, and BBB are investment grade ratings; BB, B, CCC, CC, C and D are below-investment grade ratings. Holdings designated N/R are not rated by these national ratings agencies.
How has the Fund changed?
For more complete information, you may review the Fund’s next prospectus, which is expected to be available by April 30, 2026 at https://www.nuveen.com/en‑us/mutual‑funds/prospectuses or upon request at (800) 257‑8787.
For more complete information, you may review the Fund’s next prospectus, which is expected to be available by April 30, 2026 at https://www.nuveen.com/en‑us/mutual‑funds/prospectuses or upon request at (800) 257‑8787.
This report describes changes to the Fund that occurred during the reporting period.
What were the Fund costs for the last year? (based on a hypothetical $10,000 investment)
| Cost of a $10,000 investment |
Costs paid as a percentage of $10,000 investment* | |||
| Class A Shares |
$74 | 0.73% | ||
* Annualized for period less than one year.
How did the Fund perform last year? What affected the Fund’s performance?
| Performance Highlights • The Nuveen California Municipal Bond Fund returned 3.64% for Class A Shares at net asset value (NAV) for the 12 months ended February 28, 2026. The Fund underperformed the S&P Municipal Bond California Index, which returned 4.67%. • Top contributors to relative performance • Sector positioning, particularly an underweight to the industrial development revenue bond segment and an overweight to the multi-family housing segment. • An overweight to A‑rated and BBB‑rated bonds. • Top detractors from relative performance • An overweight to non‑rated bonds. • Duration positioning, particularly an overweight to bonds with durations of 10 years and longer. • An out‑of‑benchmark allocation to Puerto Rico sales‑tax bonds. |
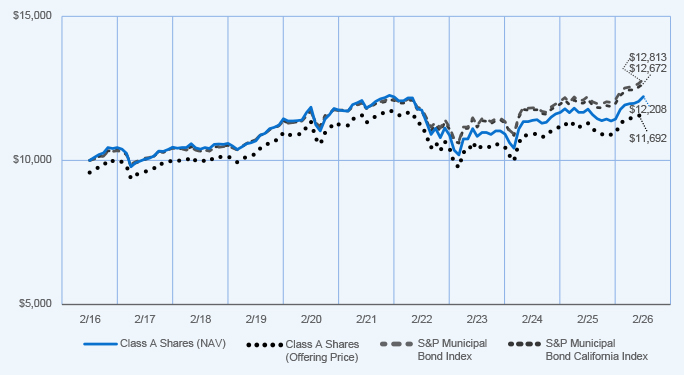
Average Annual Total Returns
| 1‑Year | 5‑Year | 10‑Year | ||||||||||
| Class A Shares at NAV (excluding maximum sales charge) |
3.64 | % | 0.67 | % | 2.02 | % | ||||||
| Class A Shares at maximum sales charge (Offering Price) |
(0.68 | )% | (0.19 | )% | 1.58 | % | ||||||
| S&P Municipal Bond Index |
4.85 | % | 1.62 | % | 2.51 | % | ||||||
| S&P Municipal Bond California Index |
4.67 | % | 1.45 | % | 2.40 | % | ||||||
| Lipper California Municipal Debt Funds Classification Average |
3.84 | % | 1.03 | % | 2.13 | % | ||||||
Fund Statistics (as of February 28, 2026)
| Fund net assets |
$ | 1,673,276,126 | ||
| Total number of portfolio holdings |
281 | |||
| Portfolio turnover (%) |
27% | |||
| Total management fees paid for the year |
$ | 7,702,590 | ||
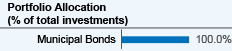
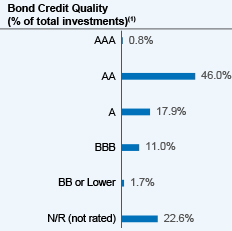
(1) The ratings disclosed are the highest rating given by one of the following national rating agencies: Standard & Poor’s (S&P), Moody’s Investors Service, Inc. (Moody’s) or Fitch, Inc (Fitch). This treatment of split-rated securities may differ from that used for other purposes, such as for Fund investment policies. Credit ratings are subject to change. AAA, AA, A, and BBB are investment grade ratings; BB, B, CCC, CC, C and D are below-investment grade ratings. Holdings designated N/R are not rated by these national ratings agencies.
How has the Fund changed?
For more complete information, you may review the Fund’s next prospectus, which is expected to be available by April 30, 2026 at https://www.nuveen.com/en‑us/mutual‑funds/prospectuses or upon request at (800) 257‑8787.
For more complete information, you may review the Fund’s next prospectus, which is expected to be available by April 30, 2026 at https://www.nuveen.com/en‑us/mutual‑funds/prospectuses or upon request at (800) 257‑8787.
This report describes changes to the Fund that occurred during the reporting period.
What were the Fund costs for the last year? (based on a hypothetical $10,000 investment)
| Cost of a $10,000 investment |
Costs paid as a percentage of $10,000 investment* | |||
| Class A Shares |
$83 | 0.81% | ||
* Annualized for period less than one year.
How did the Fund perform last year? What affected the Fund’s performance?
| Performance Highlights • The Nuveen Connecticut Municipal Bond Fund returned 3.96% for Class A Shares at net asset value (NAV) for the 12 months ended February 28, 2026. The Fund underperformed the S&P Municipal Bond Connecticut Index, which returned 5.26%. • Top contributors to relative performance • Duration positioning, especially underweights to bonds with durations of zero to four years and overweights to bonds with durations of 12+ years and longer. • Top detractors from relative performance • An overweight to A‑rated bonds. • Sector selection, especially overweights to the higher education and transportation bond segments. |
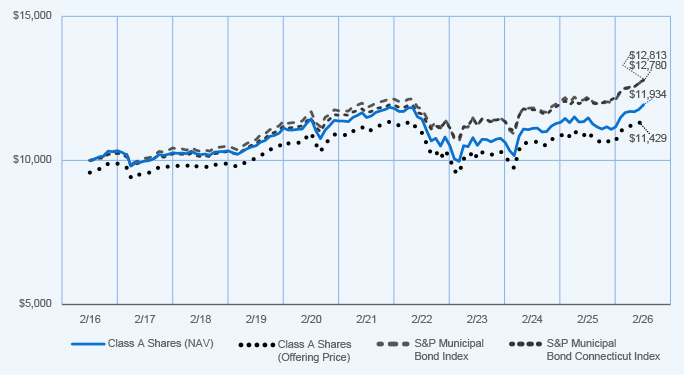
Average Annual Total Returns
| 1‑Year | 5‑Year | 10‑Year | ||||
| Class A Shares at NAV (excluding maximum sales charge) |
3.96% | 0.78% | 1.78% | |||
| Class A Shares at maximum sales charge (Offering Price) |
(0.37)% | (0.08)% | 1.34% | |||
| S&P Municipal Bond Index |
4.85% | 1.62% | 2.51% | |||
| S&P Municipal Bond Connecticut Index |
5.26% | 1.87% | 2.48% | |||
| Lipper Other States Municipal Debt Funds Classification Average |
4.26% | 0.87% | 1.69% | |||
Fund Statistics (as of February 28, 2026)
| Fund net assets |
$243,146,236 | |||
| Total number of portfolio holdings |
144 | |||
| Portfolio turnover (%) |
13% | |||
| Total management fees paid for the year |
$ 1,126,748 | |||
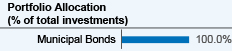
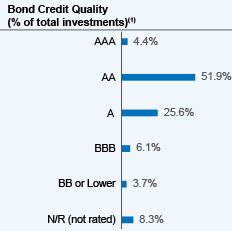
(1) The ratings disclosed are the highest rating given by one of the following national rating agencies: Standard & Poor’s (S&P), Moody’s Investors Service, Inc. (Moody’s) or Fitch, Inc (Fitch). This treatment of split-rated securities may differ from that used for other purposes, such as for Fund investment policies. Credit ratings are subject to change. AAA, AA, A, and BBB are investment grade ratings; BB, B, CCC, CC, C and D are below-investment grade ratings. Holdings designated N/R are not rated by these national ratings agencies.
How has the Fund changed?
For more complete information, you may review the Fund’s next prospectus, which is expected to be available by April 30, 2026 at https://www.nuveen.com/en‑us/mutual‑funds/prospectuses or upon request at (800) 257‑8787.
For more complete information, you may review the Fund’s next prospectus, which is expected to be available by April 30, 2026 at https://www.nuveen.com/en‑us/mutual‑funds/prospectuses or upon request at (800) 257‑8787.
This report describes changes to the Fund that occurred during the reporting period.
What were the Fund costs for the last year? (based on a hypothetical $10,000 investment)
| Cost of a $10,000 investment |
Costs paid as a percentage of $10,000 investment* | |||
| Class C Shares |
$164 | 1.61% | ||
* Annualized for period less than one year.
How did the Fund perform last year? What affected the Fund’s performance?
| Performance Highlights • The Nuveen Connecticut Municipal Bond Fund returned 3.22% for Class C Shares at net asset value (NAV) for the 12 months ended February 28, 2026. The Fund underperformed the S&P Municipal Bond Connecticut Index, which returned 5.26%. • Top contributors to relative performance • Duration positioning, especially underweights to bonds with durations of zero to four years and overweights to bonds with durations of 12+ years and longer. • Top detractors from relative performance • An overweight to A‑rated bonds. • Sector selection, especially overweights to the higher education and transportation bond segments. |
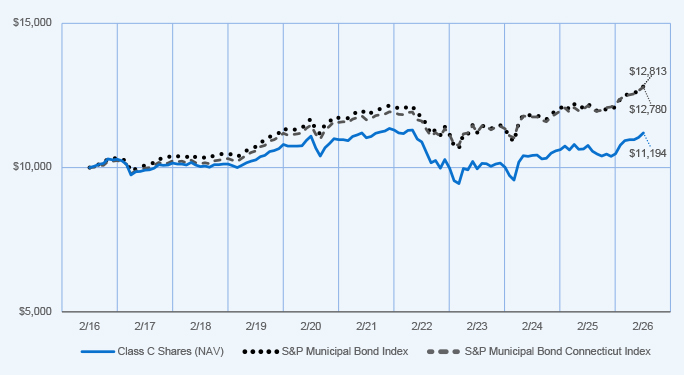
Average Annual Total Returns
| 1‑Year | 5‑Year | 10‑Year | ||||
| Class C Shares at NAV (excluding maximum sales charge) |
3.22% | 0.00% | 1.13% | |||
| S&P Municipal Bond Index |
4.85% | 1.62% | 2.51% | |||
| S&P Municipal Bond Connecticut Index |
5.26% | 1.87% | 2.48% | |||
| Lipper Other States Municipal Debt Funds Classification Average |
4.26% | 0.87% | 1.69% | |||
Fund Statistics (as of February 28, 2026)
| Fund net assets |
$ | 243,146,236 | ||
| Total number of portfolio holdings |
144 | |||
| Portfolio turnover (%) |
13% | |||
| Total management fees paid for the year |
$ | 1,126,748 | ||
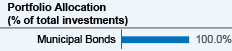
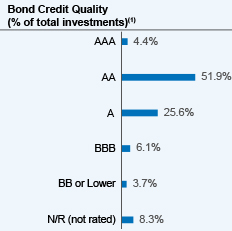
(1) The ratings disclosed are the highest rating given by one of the following national rating agencies: Standard & Poor’s (S&P), Moody’s Investors Service, Inc. (Moody’s) or Fitch, Inc (Fitch). This treatment of split-rated securities may differ from that used for other purposes, such as for Fund investment policies. Credit ratings are subject to change. AAA, AA, A, and BBB are investment grade ratings; BB, B, CCC, CC, C and D are below-investment grade ratings. Holdings designated N/R are not rated by these national ratings agencies.
How has the Fund changed?
For more complete information, you may review the Fund’s next prospectus, which is expected to be available by April 30, 2026 at https://www.nuveen.com/en‑us/mutual‑funds/prospectuses or upon request at (800) 257‑8787.
For more complete information, you may review the Fund’s next prospectus, which is expected to be available by April 30, 2026 at https://www.nuveen.com/en‑us/mutual‑funds/prospectuses or upon request at (800) 257‑8787.
This report describes changes to the Fund that occurred during the reporting period.
What were the Fund costs for the last year? (based on a hypothetical $10,000 investment)
| Cost of a $10,000 investment |
Costs paid as a percentage of $10,000 investment* | |||
| Class I Shares |
$62 | 0.61% | ||
* Annualized for period less than one year.
How did the Fund perform last year? What affected the Fund’s performance?
| Performance Highlights • The Nuveen Connecticut Municipal Bond Fund returned 4.26% for Class I Shares at net asset value (NAV) for the 12 months ended February 28, 2026. The Fund underperformed the S&P Municipal Bond Connecticut Index, which returned 5.26%. • Top contributors to relative performance • Duration positioning, especially underweights to bonds with durations of zero to four years and overweights to bonds with durations of 12+ years and longer. • Top detractors from relative performance • An overweight to A‑rated bonds. • Sector selection, especially overweights to the higher education and transportation bond segments. |
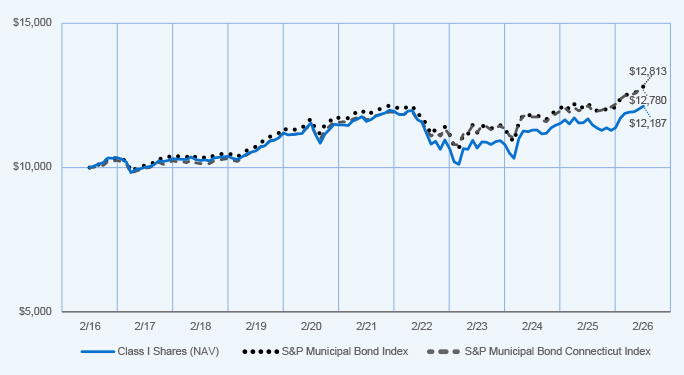
Average Annual Total Returns
| 1‑Year | 5‑Year | 10‑Year | ||||
| Class I Shares at NAV |
4.26% | 1.00% | 2.00% | |||
| S&P Municipal Bond Index |
4.85% | 1.62% | 2.51% | |||
| S&P Municipal Bond Connecticut Index |
5.26% | 1.87% | 2.48% | |||
| Lipper Other States Municipal Debt Funds Classification Average |
4.26% | 0.87% | 1.69% | |||
Fund Statistics (as of February 28, 2026)
| Fund net assets |
$243,146,236 | |||
| Total number of portfolio holdings |
144 | |||
| Portfolio turnover (%) |
13% | |||
| Total management fees paid for the year |
$ 1,126,748 | |||
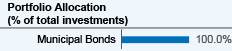
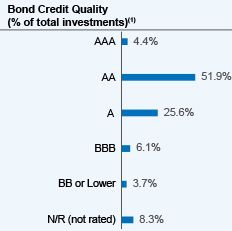
(1) The ratings disclosed are the highest rating given by one of the following national rating agencies: Standard & Poor’s (S&P), Moody’s Investors Service, Inc. (Moody’s) or Fitch, Inc (Fitch). This treatment of split-rated securities may differ from that used for other purposes, such as for Fund investment policies. Credit ratings are subject to change. AAA, AA, A, and BBB are investment grade ratings; BB, B, CCC, CC, C and D are below-investment grade ratings. Holdings designated N/R are not rated by these national ratings agencies.
How has the Fund changed?
For more complete information, you may review the Fund’s next prospectus, which is expected to be available by April 30, 2026 at https://www.nuveen.com/en‑us/mutual‑funds/prospectuses or upon request at (800) 257‑8787.
For more complete information, you may review the Fund’s next prospectus, which is expected to be available by April 30, 2026 at https://www.nuveen.com/en‑us/mutual‑funds/prospectuses or upon request at (800) 257‑8787.
This report describes changes to the Fund that occurred during the reporting period.
What were the Fund costs for the last year? (based on a hypothetical $10,000 investment)
| Cost of a $10,000 investment |
Costs paid as a percentage of $10,000 investment* | |||
| Class I Shares |
$62 | 0.61% | ||
* Annualized for period less than one year.
How did the Fund perform last year? What affected the Fund’s performance?
| Performance Highlights • The Nuveen Massachusetts Municipal Bond Fund returned 3.35% for Class I Shares at net asset value (NAV) for the 12 months ended February 28, 2026. The Fund underperformed the S&P Municipal Bond Massachusetts Index, which returned 5.03%. • Top contributors to relative performance • Duration positioning, particularly underweights to bonds with durations of zero to four years and overweights to bonds with durations of four to 12 years. • Sector selection, particularly an underweight to tax‑supported bonds, with longer-duration issues performing well. • Top detractors from relative performance • Security selection. • Credit-quality allocation, particularly an overweight to BBB‑rated bonds. |
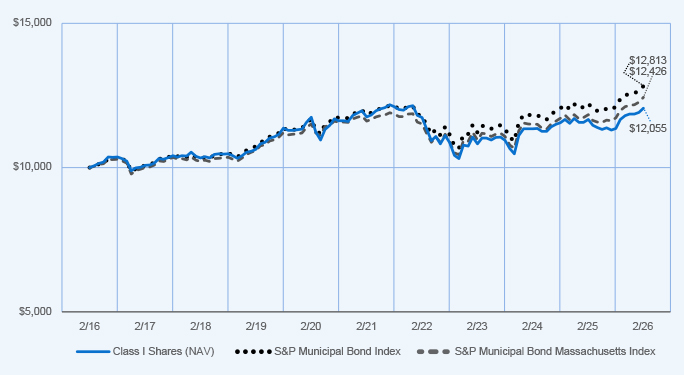
Average Annual Total Returns
| 1‑Year | 5‑Year | 10‑Year | ||||
| Class I Shares at NAV |
3.35% | 0.52% | 1.89% | |||
| S&P Municipal Bond Index |
4.85% | 1.62% | 2.51% | |||
| S&P Municipal Bond Massachusetts Index |
5.03% | 1.37% | 2.20% | |||
| Lipper Massachusetts Municipal Debt Funds Classification Average |
3.73% | 0.58% | 1.51% | |||
Fund Statistics (as of February 28, 2026)
| Fund net assets |
$429,916,949 | |||
| Total number of portfolio holdings |
150 | |||
| Portfolio turnover (%) |
21% | |||
| Total management fees paid for the year |
$ 2,069,970 | |||
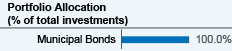
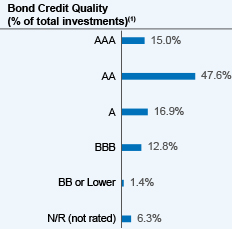
(1) The ratings disclosed are the highest rating given by one of the following national rating agencies: Standard & Poor’s (S&P), Moody’s Investors Service, Inc. (Moody’s) or Fitch, Inc (Fitch). This treatment of split-rated securities may differ from that used for other purposes, such as for Fund investment policies. Credit ratings are subject to change. AAA, AA, A, and BBB are investment grade ratings; BB, B, CCC, CC, C and D are below-investment grade ratings. Holdings designated N/R are not rated by these national ratings agencies.
How has the Fund changed?
For more complete information, you may review the Fund’s next prospectus, which is expected to be available by April 30, 2026 at https://www.nuveen.com/en‑us/mutual‑funds/prospectuses or upon request at (800) 257‑8787.
For more complete information, you may review the Fund’s next prospectus, which is expected to be available by April 30, 2026 at https://www.nuveen.com/en‑us/mutual‑funds/prospectuses or upon request at (800) 257‑8787.
This report describes changes to the Fund that occurred during the reporting period.
What were the Fund costs for the last year? (based on a hypothetical $10,000 investment)
| Cost of a $10,000 investment |
Costs paid as a percentage of $10,000 investment* | |||
| Class C Shares |
$163 | 1.61% | ||
* Annualized for period less than one year.
How did the Fund perform last year? What affected the Fund’s performance?
| Performance Highlights • The Nuveen Massachusetts Municipal Bond Fund returned 2.39% for Class C Shares at net asset value (NAV) for the 12 months ended February 28, 2026. The Fund underperformed the S&P Municipal Bond Massachusetts Index, which returned 5.03%. • Top contributors to relative performance • Duration positioning, particularly underweights to bonds with durations of zero to four years and overweights to bonds with durations of four to 12 years. • Sector selection, particularly an underweight to tax‑supported bonds, with longer-duration issues performing well. • Top detractors from relative performance • Security selection. • Credit-quality allocation, particularly an overweight to BBB‑rated bonds. |
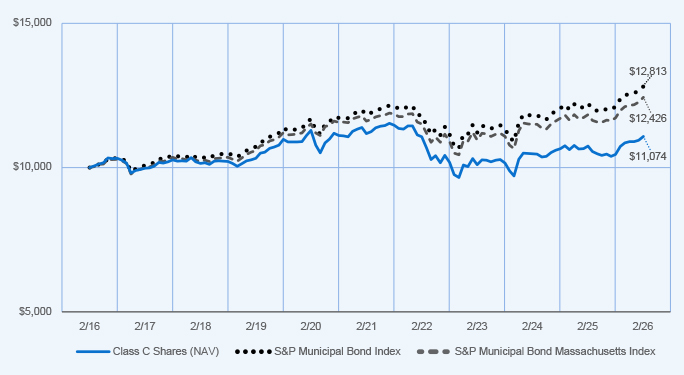
Average Annual Total Returns
| 1‑Year | 5‑Year | 10‑Year | ||||
| Class C Shares at NAV (excluding maximum sales charge) |
2.39% | (0.46)% | 1.03% | |||
| S&P Municipal Bond Index |
4.85% | 1.62% | 2.51% | |||
| S&P Municipal Bond Massachusetts Index |
5.03% | 1.37% | 2.20% | |||
| Lipper Massachusetts Municipal Debt Funds Classification Average |
3.73% | 0.58% | 1.51% | |||
Fund Statistics (as of February 28, 2026)
| Fund net assets |
$429,916,949 | |||
| Total number of portfolio holdings |
150 | |||
| Portfolio turnover (%) |
21% | |||
| Total management fees paid for the year |
$ 2,069,970 | |||
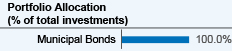
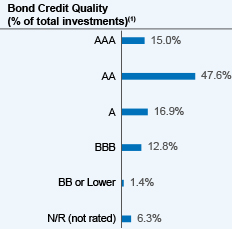
(1) The ratings disclosed are the highest rating given by one of the following national rating agencies: Standard & Poor’s (S&P), Moody’s Investors Service, Inc. (Moody’s) or Fitch, Inc (Fitch). This treatment of split-rated securities may differ from that used for other purposes, such as for Fund investment policies. Credit ratings are subject to change. AAA, AA, A, and BBB are investment grade ratings; BB, B, CCC, CC, C and D are below-investment grade ratings. Holdings designated N/R are not rated by these national ratings agencies.
How has the Fund changed?
For more complete information, you may review the Fund’s next prospectus, which is expected to be available by April 30, 2026 at https://www.nuveen.com/en‑us/mutual‑funds/prospectuses or upon request at (800) 257‑8787.
For more complete information, you may review the Fund’s next prospectus, which is expected to be available by April 30, 2026 at https://www.nuveen.com/en‑us/mutual‑funds/prospectuses or upon request at (800) 257‑8787.
This report describes changes to the Fund that occurred during the reporting period.
What were the Fund costs for the last year? (based on a hypothetical $10,000 investment)
| Cost of a $10,000 investment |
Costs paid as a percentage of $10,000 investment* | |||
| Class A Shares |
$82 | 0.81% | ||
* Annualized for period less than one year.
How did the Fund perform last year? What affected the Fund’s performance?
| Performance Highlights • The Nuveen Massachusetts Municipal Bond Fund returned 3.14% for Class A Shares at net asset value (NAV) for the 12 months ended February 28, 2026. The Fund underperformed the S&P Municipal Bond Massachusetts Index, which returned 5.03%. • Top contributors to relative performance • Duration positioning, particularly underweights to bonds with durations of zero to four years and overweights to bonds with durations of four to 12 years. • Sector selection, particularly an underweight to tax‑supported bonds, with longer-duration issues performing well. • Top detractors from relative performance • Security selection. • Credit-quality allocation, particularly an overweight to BBB‑rated bonds. |
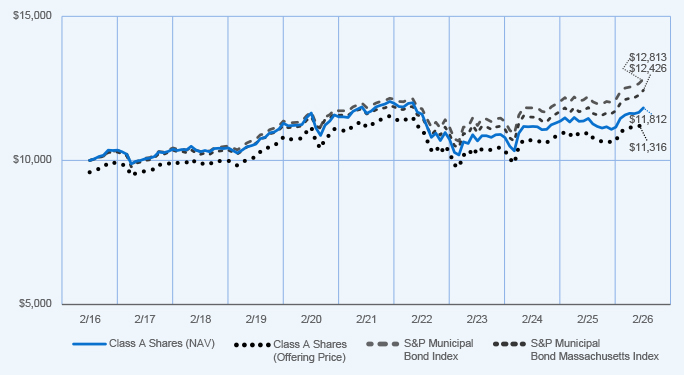
Average Annual Total Returns
| 1‑Year | 5‑Year | 10‑Year | ||||
| Class A Shares at NAV (excluding maximum sales charge) |
3.14% | 0.31% | 1.68% | |||
| Class A Shares at maximum sales charge (Offering Price) |
(1.22)% | (0.55)% | 1.24% | |||
| S&P Municipal Bond Index |
4.85% | 1.62% | 2.51% | |||
| S&P Municipal Bond Massachusetts Index |
5.03% | 1.37% | 2.20% | |||
| Lipper Massachusetts Municipal Debt Funds Classification Average |
3.73% | 0.58% | 1.51% | |||
Fund Statistics (as of February 28, 2026)
| Fund net assets |
$429,916,949 | |||
| Total number of portfolio holdings |
150 | |||
| Portfolio turnover (%) |
21% | |||
| Total management fees paid for the year |
$ 2,069,970 | |||
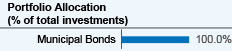
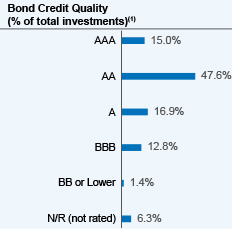
(1) The ratings disclosed are the highest rating given by one of the following national rating agencies: Standard & Poor’s (S&P), Moody’s Investors Service, Inc. (Moody’s) or Fitch, Inc (Fitch). This treatment of split-rated securities may differ from that used for other purposes, such as for Fund investment policies. Credit ratings are subject to change. AAA, AA, A, and BBB are investment grade ratings; BB, B, CCC, CC, C and D are below-investment grade ratings. Holdings designated N/R are not rated by these national ratings agencies.
How has the Fund changed?
For more complete information, you may review the Fund’s next prospectus, which is expected to be available by April 30, 2026 at https://www.nuveen.com/en‑us/mutual‑funds/prospectuses or upon request at (800) 257‑8787.
For more complete information, you may review the Fund’s next prospectus, which is expected to be available by April 30, 2026 at https://www.nuveen.com/en‑us/mutual‑funds/prospectuses or upon request at (800) 257‑8787.
This report describes changes to the Fund that occurred during the reporting period.
What were the Fund costs for the last year? (based on a hypothetical $10,000 investment)
| Cost of a $10,000 investment |
Costs paid as a percentage of $10,000 investment* | |||
| Class A Shares |
$82 | 0.80% | ||
* Annualized for period less than one year.
How did the Fund perform last year? What affected the Fund’s performance?
| Performance Highlights • The Nuveen New Jersey Municipal Bond Fund returned 4.20% for Class A Shares at net asset value (NAV) for the 12 months ended February 28, 2026. The Fund underperformed the S&P Municipal Bond New Jersey Index, which returned 5.19%. • Top contributors to relative performance • Security selection. • An underweight to the toll-road bond segment and an overweight to the local general obligation and housing bond segments. • Top detractors from relative performance • Duration and yield curve positioning, particularly overweights to bonds with durations of 12 years and longer and underweights to bonds with durations from zero to four years. • An underweight to state-supported debt. • Credit-quality positioning, particularly an underweight to A‑rated bonds and an overweight to BBB‑rated bonds. |
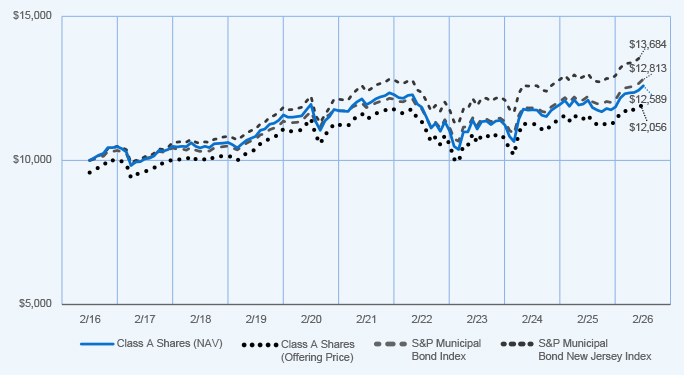
Average Annual Total Returns
| 1‑Year | 5‑Year | 10‑Year | ||||
| Class A Shares at NAV (excluding maximum sales charge) |
4.20% | 1.08% | 2.33% | |||
| Class A Shares at maximum sales charge (Offering Price) |
(0.14)% | 0.22% | 1.89% | |||
| S&P Municipal Bond Index |
4.85% | 1.62% | 2.51% | |||
| S&P Municipal Bond New Jersey Index |
5.19% | 2.01% | 3.19% | |||
| Lipper New Jersey Municipal Debt Funds Classification Average |
4.30% | 1.26% | 2.35% | |||
Fund Statistics (as of February 28, 2026)
| Fund net assets |
$390,874,486 | |||
| Total number of portfolio holdings |
271 | |||
| Portfolio turnover (%) |
15% | |||
| Total management fees paid for the year |
$ 1,781,405 | |||
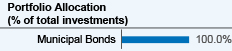
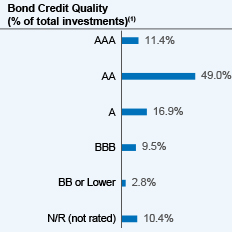
(1) The ratings disclosed are the highest rating given by one of the following national rating agencies: Standard & Poor’s (S&P), Moody’s Investors Service, Inc. (Moody’s) or Fitch, Inc (Fitch). This treatment of split-rated securities may differ from that used for other purposes, such as for Fund investment policies. Credit ratings are subject to change. AAA, AA, A, and BBB are investment grade ratings; BB, B, CCC, CC, C and D are below-investment grade ratings. Holdings designated N/R are not rated by these national ratings agencies.
How has the Fund changed?
| • | Portfolio manager update: Effective September 18, 2025, Kristen DeJong was added as a portfolio manager of the Fund. |
For more complete information, you may review the Fund’s next prospectus, which is expected to be available by April 30, 2026 at https://www.nuveen.com/en-us/mutual-funds/prospectuses or upon request at (800) 257‑8787.
For more complete information, you may review the Fund’s next prospectus, which is expected to be available by April 30, 2026 at https://www.nuveen.com/en-us/mutual-funds/prospectuses or upon request at (800) 257‑8787.
This report describes changes to the Fund that occurred during the reporting period.
What were the Fund costs for the last year? (based on a hypothetical $10,000 investment)
| Cost of a $10,000 investment |
Costs paid as a percentage of $10,000 investment* | |||
| Class C Shares |
$163 | 1.60% | ||
* Annualized for period less than one year.
How did the Fund perform last year? What affected the Fund’s performance?
| Performance Highlights • The Nuveen New Jersey Municipal Bond Fund returned 3.28% for Class C Shares at net asset value (NAV) for the 12 months ended February 28, 2026. The Fund underperformed the S&P Municipal Bond New Jersey Index, which returned 5.19%. • Top contributors to relative performance • Security selection. • An underweight to the toll-road bond segment and an overweight to the local general obligation and housing bond segments. • Top detractors from relative performance • Duration and yield curve positioning, particularly overweights to bonds with durations of 12 years and longer and underweights to bonds with durations from zero to four years. • An underweight to state-supported debt. • Credit-quality positioning, particularly an underweight to A‑rated bonds and an overweight to BBB‑rated bonds. |
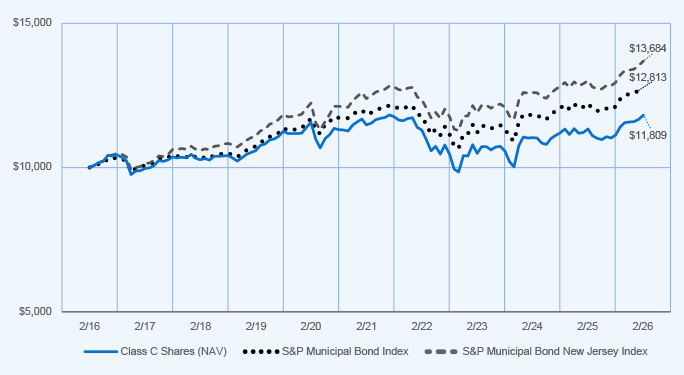
Average Annual Total Returns
| 1‑Year | 5‑Year | 10‑Year | ||||||||||
| Class C Shares at NAV (excluding maximum sales charge) |
3.28 | % | 0.25 | % | 1.68 | % | ||||||
| S&P Municipal Bond Index |
4.85 | % | 1.62 | % | 2.51 | % | ||||||
| S&P Municipal Bond New Jersey Index |
5.19 | % | 2.01 | % | 3.19 | % | ||||||
| Lipper New Jersey Municipal Debt Funds Classification Average |
4.30 | % | 1.26 | % | 2.35 | % | ||||||
Fund Statistics (as of February 28, 2026)
| Fund net assets |
$ | 390,874,486 | ||
| Total number of portfolio holdings |
271 | |||
| Portfolio turnover (%) |
15% | |||
| Total management fees paid for the year |
$ | 1,781,405 | ||
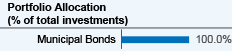
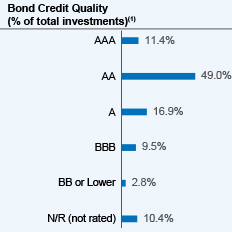
(1) The ratings disclosed are the highest rating given by one of the following national rating agencies: Standard & Poor’s (S&P), Moody’s Investors Service, Inc. (Moody’s) or Fitch, Inc (Fitch). This treatment of split-rated securities may differ from that used for other purposes, such as for Fund investment policies. Credit ratings are subject to change. AAA, AA, A, and BBB are investment grade ratings; BB, B, CCC, CC, C and D are below-investment grade ratings. Holdings designated N/R are not rated by these national ratings agencies.
How has the Fund changed?
| • | Portfolio manager update: Effective September 18, 2025, Kristen DeJong was added as a portfolio manager of the Fund. |
For more complete information, you may review the Fund’s next prospectus, which is expected to be available by April 30, 2026 at https://www.nuveen.com/en‑us/mutual‑funds/prospectuses or upon request at (800) 257‑8787.
For more complete information, you may review the Fund’s next prospectus, which is expected to be available by April 30, 2026 at https://www.nuveen.com/en‑us/mutual‑funds/prospectuses or upon request at (800) 257‑8787.
This report describes changes to the Fund that occurred during the reporting period.
What were the Fund costs for the last year? (based on a hypothetical $10,000 investment)
| Cost of a $10,000 investment |
Costs paid as a percentage of $10,000 investment* | |||
| Class I Shares |
$61 | 0.60% | ||
* Annualized for period less than one year.
How did the Fund perform last year? What affected the Fund’s performance?
| Performance Highlights • The Nuveen New Jersey Municipal Bond Fund returned 4.33% for Class I Shares at net asset value (NAV) for the 12 months ended February 28, 2026. The Fund underperformed the S&P Municipal Bond New Jersey Index, which returned 5.19%. • Top contributors to relative performance • Security selection. • An underweight to the toll-road bond segment and an overweight to the local general obligation and housing bond segments. • Top detractors from relative performance • Duration and yield curve positioning, particularly overweights to bonds with durations of 12 years and longer and underweights to bonds with durations from zero to four years. • An underweight to state-supported debt. • Credit-quality positioning, particularly an underweight to A‑rated bonds and an overweight to BBB‑rated bonds. |
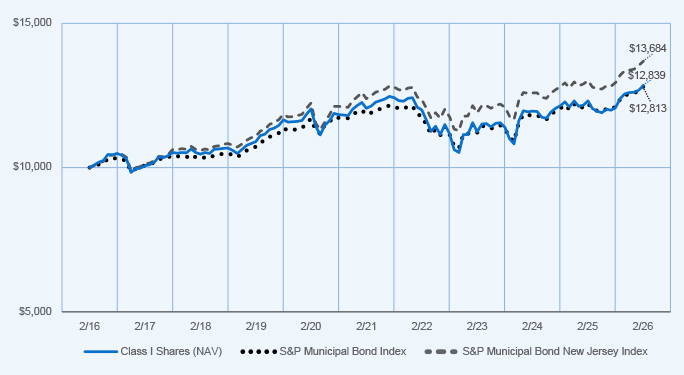
Average Annual Total Returns
| 1‑Year | 5‑Year | 10‑Year | ||||
| Class I Shares at NAV |
4.33% | 1.28% | 2.53% | |||
| S&P Municipal Bond Index |
4.85% | 1.62% | 2.51% | |||
| S&P Municipal Bond New Jersey Index |
5.19% | 2.01% | 3.19% | |||
| Lipper New Jersey Municipal Debt Funds Classification Average |
4.30% | 1.26% | 2.35% | |||
Fund Statistics (as of February 28, 2026)
| Fund net assets |
$ | 390,874,486 | ||
| Total number of portfolio holdings |
271 | |||
| Portfolio turnover (%) |
15% | |||
| Total management fees paid for the year |
$ | 1,781,405 | ||
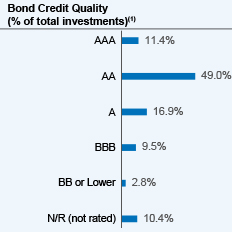
(1) The ratings disclosed are the highest rating given by one of the following national rating agencies: Standard & Poor’s (S&P), Moody’s Investors Service, Inc. (Moody’s) or Fitch, Inc (Fitch). This treatment of split-rated securities may differ from that used for other purposes, such as for Fund investment policies. Credit ratings are subject to change. AAA, AA, A, and BBB are investment grade ratings; BB, B, CCC, CC, C and D are below-investment grade ratings. Holdings designated N/R are not rated by these national ratings agencies.
How has the Fund changed?
| • | Portfolio manager update: Effective September 18, 2025, Kristen DeJong was added as a portfolio manager of the Fund. |
For more complete information, you may review the Fund’s next prospectus, which is expected to be available by April 30, 2026 at https://www.nuveen.com/en‑us/mutual‑funds/prospectuses or upon request at (800) 257‑8787.
For more complete information, you may review the Fund’s next prospectus, which is expected to be available by April 30, 2026 at https://www.nuveen.com/en‑us/mutual‑funds/prospectuses or upon request at (800) 257‑8787.
This report describes changes to the Fund that occurred during the reporting period.
What were the Fund costs for the last year? (based on a hypothetical $10,000 investment)
| Cost of a $10,000 investment |
Costs paid as a percentage of $10,000 investment* | |||
| Class I Shares |
$56 | 0.55% | ||
* Annualized for period less than one year.
How did the Fund perform last year? What affected the Fund’s performance?
| Performance Highlights • The Nuveen New York Municipal Bond Fund returned 3.77% for Class I Shares at net asset value (NAV) for the 12 months ended February 28, 2026. The Fund underperformed the S&P Municipal Bond New York Index, which returned 4.57%. • Top contributors to relative performance • Sector positioning, particularly an overweight to the transportation segment and an underweight to the tax‑supported segment. • An overweight to A‑rated bonds. • Top detractors from relative performance • Overweights to non‑rated bonds and bonds rated below-investment-grade. • Duration positioning. • An out‑of‑benchmark allocation to Puerto Rico sales‑tax bonds. |
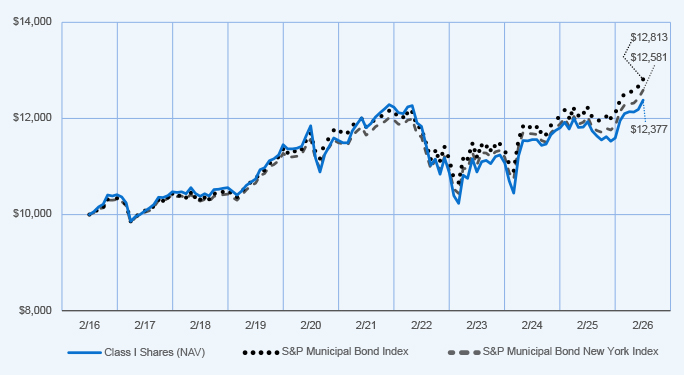
Average Annual Total Returns
| 1‑Year | 5‑Year | 10‑Year | ||||||||||
| Class I Shares at NAV |
3.77 | % | 0.95 | % | 2.16 | % | ||||||
| S&P Municipal Bond Index |
4.85 | % | 1.62 | % | 2.51 | % | ||||||
| S&P Municipal Bond New York Index |
4.57 | % | 1.55 | % | 2.32 | % | ||||||
| Lipper New York Municipal Debt Funds Classification Average |
3.56 | % | 1.02 | % | 2.07 | % | ||||||
Fund Statistics (as of February 28, 2026)
| Fund net assets |
$ | 1,014,941,677 | ||
| Total number of portfolio holdings |
199 | |||
| Portfolio turnover (%) |
14% | |||
| Total management fees paid for the year |
$ | 4,609,613 | ||
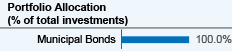
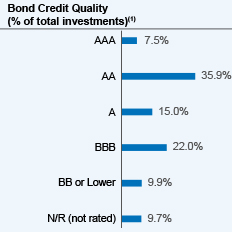
(1) The ratings disclosed are the highest rating given by one of the following national rating agencies: Standard & Poor’s (S&P), Moody’s Investors Service, Inc. (Moody’s) or Fitch, Inc (Fitch). This treatment of split-rated securities may differ from that used for other purposes, such as for Fund investment policies. Credit ratings are subject to change. AAA, AA, A, and BBB are investment grade ratings; BB, B, CCC, CC, C and D are below-investment grade ratings. Holdings designated N/R are not rated by these national ratings agencies.
How has the Fund changed?
For more complete information, you may review the Fund’s next prospectus, which is expected to be available by April 30, 2026 at https://www.nuveen.com/en‑us/mutual‑funds/prospectuses or upon request at (800) 257‑8787.
For more complete information, you may review the Fund’s next prospectus, which is expected to be available by April 30, 2026 at https://www.nuveen.com/en‑us/mutual‑funds/prospectuses or upon request at (800) 257‑8787.
This report describes changes to the Fund that occurred during the reporting period.
What were the Fund costs for the last year? (based on a hypothetical $10,000 investment)
| Cost of a $10,000 investment |
Costs paid as a percentage of $10,000 investment* | |||
| Class C Shares |
$157 | 1.55% | ||
* Annualized for period less than one year.
How did the Fund perform last year? What affected the Fund’s performance?
| Performance Highlights • The Nuveen New York Municipal Bond Fund returned 2.74% for Class C Shares at net asset value (NAV) for the 12 months ended February 28, 2026. The Fund underperformed the S&P Municipal Bond New York Index, which returned 4.57%. • Top contributors to relative performance • Sector positioning, particularly an overweight to the transportation segment and an underweight to the tax‑supported segment. • An overweight to A‑rated bonds. • Top detractors from relative performance • Overweights to non‑rated bonds and bonds rated below-investment-grade. • Duration positioning. • An out‑of‑benchmark allocation to Puerto Rico sales‑tax bonds. |
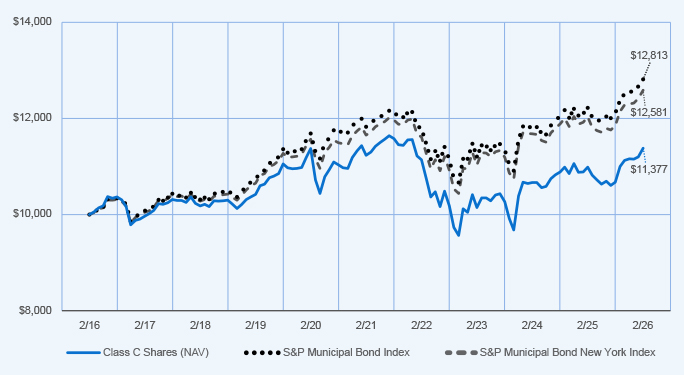
Average Annual Total Returns
| 1‑Year | 5‑Year | 10‑Year | ||||||||||
| Class C Shares at NAV (excluding maximum sales charge) |
2.74 | % | (0.06 | )% | 1.30 | % | ||||||
| S&P Municipal Bond Index |
4.85 | % | 1.62 | % | 2.51 | % | ||||||
| S&P Municipal Bond New York Index |
4.57 | % | 1.55 | % | 2.32 | % | ||||||
| Lipper New York Municipal Debt Funds Classification Average |
3.56 | % | 1.02 | % | 2.07 | % | ||||||
Fund Statistics (as of February 28, 2026)
| Fund net assets |
$ | 1,014,941,677 | ||
| Total number of portfolio holdings |
199 | |||
| Portfolio turnover (%) |
14% | |||
| Total management fees paid for the year |
$ | 4,609,613 | ||
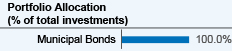
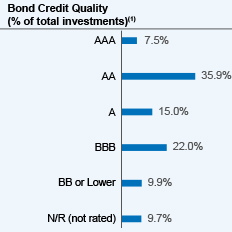
(1) The ratings disclosed are the highest rating given by one of the following national rating agencies: Standard & Poor’s (S&P), Moody’s Investors Service, Inc. (Moody’s) or Fitch, Inc (Fitch). This treatment of split-rated securities may differ from that used for other purposes, such as for Fund investment policies. Credit ratings are subject to change. AAA, AA, A, and BBB are investment grade ratings; BB, B, CCC, CC, C and D are below-investment grade ratings. Holdings designated N/R are not rated by these national ratings agencies.
How has the Fund changed?
For more complete information, you may review the Fund’s next prospectus, which is expected to be available by April 30, 2026 at https://www.nuveen.com/en‑us/mutual‑funds/prospectuses or upon request at (800) 257‑8787.
For more complete information, you may review the Fund’s next prospectus, which is expected to be available by April 30, 2026 at https://www.nuveen.com/en‑us/mutual‑funds/prospectuses or upon request at (800) 257‑8787.
This report describes changes to the Fund that occurred during the reporting period.
What were the Fund costs for the last year? (based on a hypothetical $10,000 investment)
| Cost of a $10,000 investment |
Costs paid as a percentage of $10,000 investment* | |||
| Class A Shares |
$76 | 0.75% | ||
* Annualized for period less than one year.
How did the Fund perform last year? What affected the Fund’s performance?
| Performance Highlights • The Nuveen New York Municipal Bond Fund returned 3.57% for Class A Shares at net asset value (NAV) for the 12 months ended February 28, 2026. The Fund underperformed the S&P Municipal Bond New York Index, which returned 4.57%. • Top contributors to relative performance • Sector positioning, particularly an overweight to the transportation segment and an underweight to the tax‑supported segment. • An overweight to A‑rated bonds. • Top detractors from relative performance • Overweights to non‑rated bonds and bonds rated below-investment-grade. • Duration positioning. • An out‑of‑benchmark allocation to Puerto Rico sales‑tax bonds. |
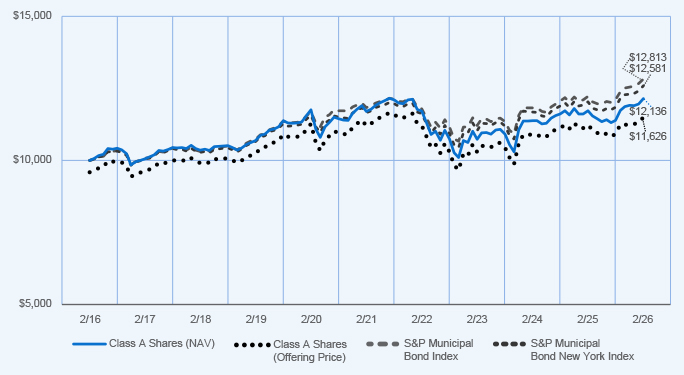
Average Annual Total Returns
| 1‑Year | 5‑Year | 10‑Year | ||||||||||
| Class A Shares at NAV (excluding maximum sales charge) |
3.57 | % | 0.75 | % | 1.95 | % | ||||||
| Class A Shares at maximum sales charge (Offering Price) |
(0.78 | )% | (0.11 | )% | 1.52 | % | ||||||
| S&P Municipal Bond Index |
4.85 | % | 1.62 | % | 2.51 | % | ||||||
| S&P Municipal Bond New York Index |
4.57 | % | 1.55 | % | 2.32 | % | ||||||
| Lipper New York Municipal Debt Funds Classification Average |
3.56 | % | 1.02 | % | 2.07 | % | ||||||
Fund Statistics (as of February 28, 2026)
| Fund net assets |
$ | 1,014,941,677 | ||
| Total number of portfolio holdings |
199 | |||
| Portfolio turnover (%) |
14% | |||
| Total management fees paid for the year |
$ | 4,609,613 | ||
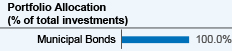
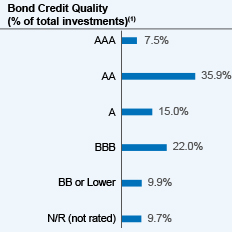
(1) The ratings disclosed are the highest rating given by one of the following national rating agencies: Standard & Poor’s (S&P), Moody’s Investors Service, Inc. (Moody’s) or Fitch, Inc (Fitch). This treatment of split-rated securities may differ from that used for other purposes, such as for Fund investment policies. Credit ratings are subject to change. AAA, AA, A, and BBB are investment grade ratings; BB, B, CCC, CC, C and D are below-investment grade ratings. Holdings designated N/R are not rated by these national ratings agencies.
How has the Fund changed?
For more complete information, you may review the Fund’s next prospectus, which is expected to be available by April 30, 2026 at https://www.nuveen.com/en‑us/mutual‑funds/prospectuses or upon request at (800) 257‑8787.
For more complete information, you may review the Fund’s next prospectus, which is expected to be available by April 30, 2026 at https://www.nuveen.com/en‑us/mutual‑funds/prospectuses or upon request at (800) 257‑8787.
This report describes changes to the Fund that occurred during the reporting period.
What were the Fund costs for the last year? (based on a hypothetical $10,000 investment)
| Cost of a $10,000 investment |
Costs paid as a percentage of $10,000 investment* | |||
| Class A Shares |
$170 | 1.67% | ||
* Annualized for period less than one year.
How did the Fund perform last year? What affected the Fund’s performance?
| Performance Highlights • The Nuveen California High Yield Municipal Bond Fund returned 3.62% for Class A Shares at net asset value (NAV) for the 12 months ended February 28, 2026. The Fund performed in line with the S&P Municipal Yield Index, which returned 3.73%. • Top contributors to relative performance • Sector positioning, particularly underweights to the tobacco and industrial development revenue bond segments. • Security selection among non‑rated bonds. • Top detractors from relative performance • An overweight to California tax‑exempt bonds. • An underweight to the health care sector. |
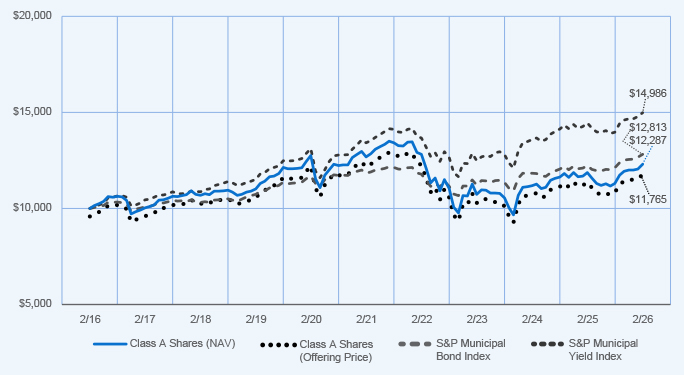
Average Annual Total Returns
| 1‑Year | 5‑Year | 10‑Year | ||||||||||
| Class A Shares at NAV (excluding maximum sales charge) |
3.62 | % | (0.63 | )% | 2.08 | % | ||||||
| Class A Shares at maximum sales charge (Offering Price) |
(0.70 | )% | (1.49 | )% | 1.64 | % | ||||||
| S&P Municipal Bond Index |
4.85 | % | 1.62 | % | 2.51 | % | ||||||
| S&P Municipal Yield Index |
3.73 | % | 2.24 | % | 4.13 | % | ||||||
| Lipper California Municipal Debt Funds Classification Average |
3.84 | % | 1.03 | % | 2.13 | % | ||||||
Fund Statistics (as of February 28, 2026)
| Fund net assets |
$ | 982,086,543 | ||
| Total number of portfolio holdings |
483 | |||
| Portfolio turnover (%) |
16% | |||
| Total management fees paid for the year |
$ | 5,062,648 | ||
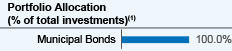
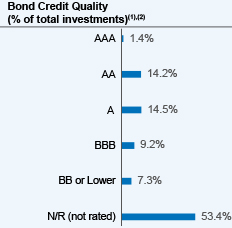
(1) Total investments include the Fund’s assets attributable to financial leverage. For these purposes, financial leverage includes the Fund’s investments in the residual interest certificates (also called inverse floating rate securities) in tender option bond (TOB) trusts, including the portion of assets held by a TOB trust that has been effectively financed by the trust’s issuance of floating rate securities.
(2) The ratings disclosed are the lowest rating given by one of the following national rating agencies: Standard & Poor’s (S&P), Moody’s Investors Service, Inc. (Moody’s) or Fitch, Inc (Fitch). This treatment of split-rated securities may differ from that used for other purposes, such as for Fund investment policies. Credit ratings are subject to change. AAA, AA, A, and BBB are investment grade ratings; BB, B, CCC, CC, C and D are below-investment grade ratings. Holdings designated N/R are not rated by these national ratings agencies.
How has the Fund changed?
| • | Portfolio manager update: Effective May 9, 2025, Steve Hlavin was added as a portfolio manager of the Fund. |
For more complete information, you may review the Fund’s next prospectus, which is expected to be available by April 30, 2026 at https://www.nuveen.com/en‑us/mutual‑funds/prospectuses or upon request at (800) 257‑8787.
For more complete information, you may review the Fund’s next prospectus, which is expected to be available by April 30, 2026 at https://www.nuveen.com/en‑us/mutual‑funds/prospectuses or upon request at (800) 257‑8787.
This report describes changes to the Fund that occurred during the reporting period.
What were the Fund costs for the last year? (based on a hypothetical $10,000 investment)
| Cost of a $10,000 investment |
Costs paid as a percentage of $10,000 investment* | |||
| Class C Shares |
$250 | 2.47% | ||
* Annualized for period less than one year.
How did the Fund perform last year? What affected the Fund’s performance?
| Performance Highlights • The Nuveen California High Yield Municipal Bond Fund returned 2.82% for Class C Shares at net asset value (NAV) for the 12 months ended February 28, 2026. The Fund underperformed the S&P Municipal Yield Index, which returned 3.73%. • Top contributors to relative performance • Sector positioning, particularly underweights to the tobacco and industrial development revenue bond segments. • Security selection among non‑rated bonds. • Top detractors from relative performance • An overweight to California tax‑exempt bonds. • An underweight to the health care sector. |
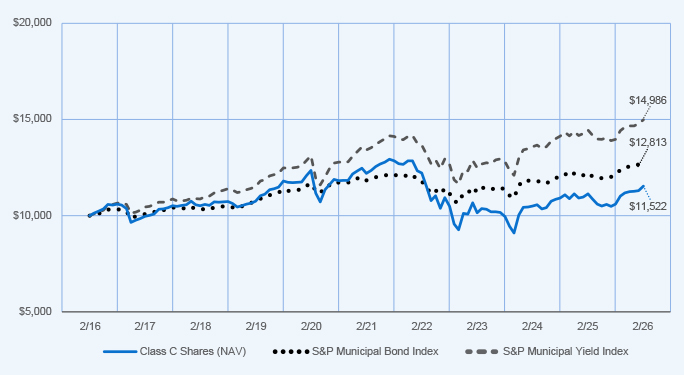
Average Annual Total Returns
| 1‑Year | 5‑Year | 10‑Year | ||||||||||
| Class C Shares at NAV (excluding maximum sales charge) |
2.82 | % | (1.42 | )% | 1.43 | % | ||||||
| S&P Municipal Bond Index |
4.85 | % | 1.62 | % | 2.51 | % | ||||||
| S&P Municipal Yield Index |
3.73 | % | 2.24 | % | 4.13 | % | ||||||
| Lipper California Municipal Debt Funds Classification Average |
3.84 | % | 1.03 | % | 2.13 | % | ||||||
Fund Statistics (as of February 28, 2026)
| Fund net assets |
$ | 982,086,543 | ||
| Total number of portfolio holdings |
483 | |||
| Portfolio turnover (%) |
16% | |||
| Total management fees paid for the year |
$ | 5,062,648 | ||
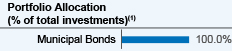
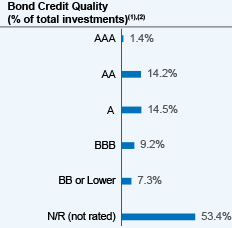
(1) Total investments include the Fund’s assets attributable to financial leverage. For these purposes, financial leverage includes the Fund’s investments in the residual interest certificates (also called inverse floating rate securities) in tender option bond (TOB) trusts, including the portion of assets held by a TOB trust that has been effectively financed by the trust’s issuance of floating rate securities.
(2) The ratings disclosed are the lowest rating given by one of the following national rating agencies: Standard & Poor’s (S&P), Moody’s Investors Service, Inc. (Moody’s) or Fitch, Inc (Fitch). This treatment of split-rated securities may differ from that used for other purposes, such as for Fund investment policies. Credit ratings are subject to change. AAA, AA, A, and BBB are investment grade ratings; BB, B, CCC, CC, C and D are below-investment grade ratings. Holdings designated N/R are not rated by these national ratings agencies.
How has the Fund changed?
| • | Portfolio manager update: Effective May 9, 2025, Steve Hlavin was added as a portfolio manager of the Fund. |
For more complete information, you may review the Fund’s next prospectus, which is expected to be available by April 30, 2026 at https://www.nuveen.com/en‑us/mutual‑funds/prospectuses or upon request at (800) 257‑8787.
For more complete information, you may review the Fund’s next prospectus, which is expected to be available by April 30, 2026 at https://www.nuveen.com/en‑us/mutual‑funds/prospectuses or upon request at (800) 257‑8787.
This report describes changes to the Fund that occurred during the reporting period.
What were the Fund costs for the last year? (based on a hypothetical $10,000 investment)
| Cost of a $10,000 investment |
Costs paid as a percentage of $10,000 investment* | |||
| Class I Shares |
$150 | 1.47% | ||
* Annualized for period less than one year.
How did the Fund perform last year? What affected the Fund’s performance?
| Performance Highlights • The Nuveen California High Yield Municipal Bond Fund returned 3.86% for Class I Shares at net asset value (NAV) for the 12 months ended February 28, 2026. The Fund performed in line with the S&P Municipal Yield Index, which returned 3.73%. • Top contributors to relative performance • Sector positioning, particularly underweights to the tobacco and industrial development revenue bond segments. • Security selection among non‑rated bonds. • Top detractors from relative performance • An overweight to California tax‑exempt bonds. • An underweight to the health care sector. |
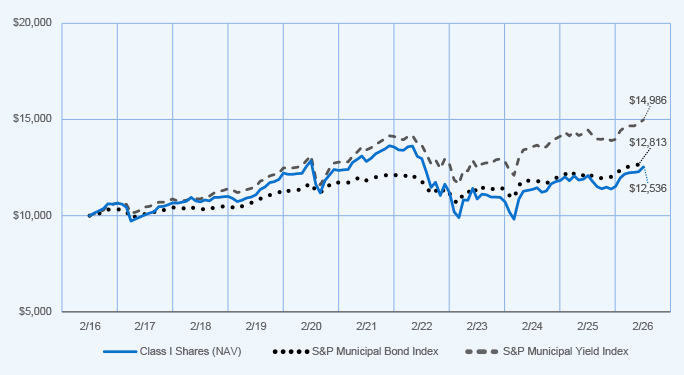
Average Annual Total Returns
| 1‑Year | 5‑Year | 10‑Year | ||||||||||
| Class I Shares at NAV |
3.86 | % | (0.44 | )% | 2.29 | % | ||||||
| S&P Municipal Bond Index |
4.85 | % | 1.62 | % | 2.51 | % | ||||||
| S&P Municipal Yield Index |
3.73 | % | 2.24 | % | 4.13 | % | ||||||
| Lipper California Municipal Debt Funds Classification Average |
3.84 | % | 1.03 | % | 2.13 | % | ||||||
Fund Statistics (as of February 28, 2026)
| Fund net assets |
$ | 982,086,543 | ||
| Total number of portfolio holdings |
483 | |||
| Portfolio turnover (%) |
16% | |||
| Total management fees paid for the year |
$ | 5,062,648 | ||
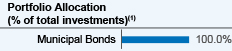
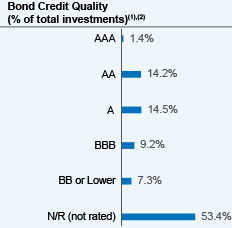
(1) Total investments include the Fund’s assets attributable to financial leverage. For these purposes, financial leverage includes the Fund’s investments in the residual interest certificates (also called inverse floating rate securities) in tender option bond (TOB) trusts, including the portion of assets held by a TOB trust that has been effectively financed by the trust’s issuance of floating rate securities.
(2) The ratings disclosed are the lowest rating given by one of the following national rating agencies: Standard & Poor’s (S&P), Moody’s Investors Service, Inc. (Moody’s) or Fitch, Inc (Fitch). This treatment of split-rated securities may differ from that used for other purposes, such as for Fund investment policies. Credit ratings are subject to change. AAA, AA, A, and BBB are investment grade ratings; BB, B, CCC, CC, C and D are below-investment grade ratings. Holdings designated N/R are not rated by these national ratings agencies.
How has the Fund changed?
| • | Portfolio manager update: Effective May 9, 2025, Steve Hlavin was added as a portfolio manager of the Fund. |
For more complete information, you may review the Fund’s next prospectus, which is expected to be available by April 30, 2026 at https://www.nuveen.com/en‑us/mutual‑funds/prospectuses or upon request at (800) 257‑8787.
For more complete information, you may review the Fund’s next prospectus, which is expected to be available by April 30, 2026 at https://www.nuveen.com/en‑us/mutual‑funds/prospectuses or upon request at (800) 257‑8787.
| [1] | Annualized for period less than one year. |
| [2] | Annualized for period less than one year. |
| [3] | Annualized for period less than one year. |
| [4] | Annualized for period less than one year. |
| [5] | Annualized for period less than one year. |
| [6] | Annualized for period less than one year. |
| [7] | Annualized for period less than one year. |
| [8] | Annualized for period less than one year. |
| [9] | Annualized for period less than one year. |
| [10] | Annualized for period less than one year. |
| [11] | Annualized for period less than one year. |
| [12] | Annualized for period less than one year. |
| [13] | Annualized for period less than one year. |
| [14] | Annualized for period less than one year. |
| [15] | Annualized for period less than one year. |
| [16] | Annualized for period less than one year. |
| [17] | Annualized for period less than one year. |
| [18] | Annualized for period less than one year. |