Phillip D. Green, Chairman and Chief Executive Officer | Daniel Geddes, Chief Financial Officer Cullen/Frost Bankers, Inc. June 30, 2026
2 Cautionary Statement Certain statements contained in this Quarterly Report on Form 10-Q that are not statements of historical fact constitute forward-looking statements within the meaning of the Private Securities Litigation Reform Act of 1995 (the “Act”), notwithstanding that such statements are not specifically identified as such. In addition, certain statements may be contained in our future filings with the SEC, in press releases, and in oral and written statements made by us or with our approval that are not statements of historical fact and constitute forward-looking statements within the meaning of the Act. Examples of forward-looking statements include, but are not limited to: (i) projections of revenues, expenses, income or loss, earnings or loss per share, the payment or nonpayment of dividends, capital structure and other financial items; (ii) statements of plans, objectives and expectations of Cullen/Frost or its management or Board of Directors, including those relating to products, services or operations; (iii) statements of future economic performance; and (iv) statements of assumptions underlying such statements. Words such as “believes,” “anticipates,” “expects,” “intends,” “targeted,” “continue,” “remain,” “will,” “should,” “may,” and other similar expressions are intended to identify forward-looking statements but are not the exclusive means of identifying such statements. Forward-looking statements involve risks and uncertainties that may cause actual results to differ materially from those in such statements. Factors that could cause actual results to differ from those discussed in the forward-looking statements include, but are not limited to: In addition, recent military conflict involving the U.S. and Iran, including direct military actions, attacks affecting commercial shipping in and around the Strait of Hormuz, and subsequent retaliatory military strikes, has contributed to heightened geopolitical uncertainty, increased volatility in global financial markets, and significant fluctuations in energy and commodity prices. While diplomatic communications and negotiations may continue, recent statements by U.S. and Iranian officials, including indications that the previously announced ceasefire framework is no longer in effect, have increased the risk of further military escalation and broader regional instability. Ongoing developments in the Middle East, including potential disruptions to maritime trade routes and energy infrastructure, could adversely affect global supply chains, inflation expectations, economic activity, and market conditions. The timing, magnitude, duration, and geographic scope of any further conflict remain highly uncertain and may evolve rapidly in response to military actions, diplomatic developments, government policy decisions, sanctions, and market reactions. Heightened geopolitical uncertainty and volatility in energy markets may influence monetary policy decisions, interest-rate expectations, funding markets, liquidity conditions, foreign-exchange markets, and investor risk sentiment. These factors could adversely affect our funding profile; customer and counterparty credit quality, particularly in sectors sensitive to energy prices, global trade, transportation, manufacturing, and broader economic cycles; and the market value of certain financial instruments. Prolonged market volatility, additional military escalation involving the United States, Iran, or other regional actors, disruptions to global energy supplies or shipping lanes, expanded sanctions, or a deterioration in global economic conditions could negatively impact economic growth, increase borrower stress, reduce business activity, and contribute to higher credit losses and operational risks, including cyber-related incidents, any of which could have a material adverse effect on our business, financial condition, results of operations, and prospects. We will continue to monitor geopolitical developments and assess their potential impact on our customers, operations, liquidity position, capital levels, market exposures, and overall risk profile, and we may adjust our risk management, liquidity management, capital planning, and business continuity strategies as appropriate. Furthermore, financial markets, international relations, and global supply chains continue to be affected by evolving U.S. trade policies and practices. While the U.S. Supreme Court's February 20, 2026 ruling that the International Emergency Economic Powers Act ("IEEPA") does not authorize presidential tariff authority invalidated certain tariffs previously imposed under IEEPA, uncertainty remains regarding tariff refunds, related legal and administrative proceedings, and the scope, duration, and economic impact of replacement or additional trade measures adopted under other U.S. trade laws. Ongoing changes in U.S. trade policy, including the imposition, modification, suspension, or expansion of tariffs and other trade restrictions, may affect customer cash flows, business confidence, capital investment decisions, supply chain strategies, commodity prices, inflation expectations, and market volatility. These developments may increase our exposure to operational, credit, market, liquidity, and compliance risks. Customers with significant exposure to international trade, manufacturing, transportation, agriculture, retail, or other sectors sensitive to global trade and supply chain conditions may experience financial stress, reduced profitability, or weakened operating performance. Trade policy developments may also contribute to volatility in interest rates, foreign exchange markets, and asset valuations. If these developments adversely affect borrower financial condition, market stability, economic growth, or broader business activity, they could have a material adverse effect on our business, financial condition, results of operations, and prospects. We will continue to monitor trade policy developments and adjust our risk management, liquidity management, and capital planning strategies as appropriate. Forward-looking statements speak only as of the date on which such statements are made. We do not undertake any obligation to update any forward-looking statement to reflect events or circumstances after the date on which such statement is made, or to reflect the occurrence of unanticipated events. • Changes in the reliability of our vendors, internal control systems or information systems. • Our ability to increase market share and control expenses. • Our ability to attract and retain qualified employees. • Changes in our organization, compensation, and benefit plans. • The soundness of other financial institutions. • Volatility and disruption in national and international financial and commodity markets. • Changes in the competitive environment in our markets and among banking organizations and other financial service providers. • Government intervention in the U.S. financial system. • Political or economic instability. • Acts of God or of war or terrorism. • The potential impact of climate change. • The impact of pandemics, epidemics, or any other health-related crisis. • The costs and effects of legal and regulatory developments, the resolution of legal proceedings or regulatory or other governmental inquiries, the results of regulatory examinations or reviews and the ability to obtain required regulatory approvals. • The effect of changes in laws and regulations (including laws and regulations concerning taxes, banking, securities, and insurance) and their application with which we and our subsidiaries must comply. • The effect of changes in accounting policies and practices, as may be adopted by the regulatory agencies, as well as the Public Company Accounting Oversight Board, the Financial Accounting Standards Board and other accounting standard setters. • Our success at managing the risks involved in the foregoing items. • The effects of and changes in trade and monetary and fiscal policies and laws, including the interest rate policies of the Federal Reserve Board and the implementation of tariffs and other protectionist trade policies. • Inflation, interest rate, securities market, and monetary fluctuations. • Local, regional, national, and international economic conditions and the impact they may have on us and our customers and our assessment of that impact. • Changes in the financial performance and/or condition of our borrowers. • Changes in the mix of loan geographies, sectors and types or the level of non-performing assets and charge-offs. • Changes in estimates of future credit loss reserve requirements based upon the periodic review thereof under relevant regulatory and accounting requirements. • Changes in our liquidity position. • Impairment of our goodwill or other intangible assets. • The timely development and acceptance of new products and services and perceived overall value of these products and services by users. • Changes in consumer spending, borrowing, and saving habits. • Greater than expected costs or difficulties related to the integration of new products and lines of business. • Technological changes, including advances in artificial intelligence and quantum computing. • The cost and effects of cyber incidents or other failures, interruptions, or security breaches of our systems or those of our customers or third-party providers. • Acquisitions and integration of acquired businesses.
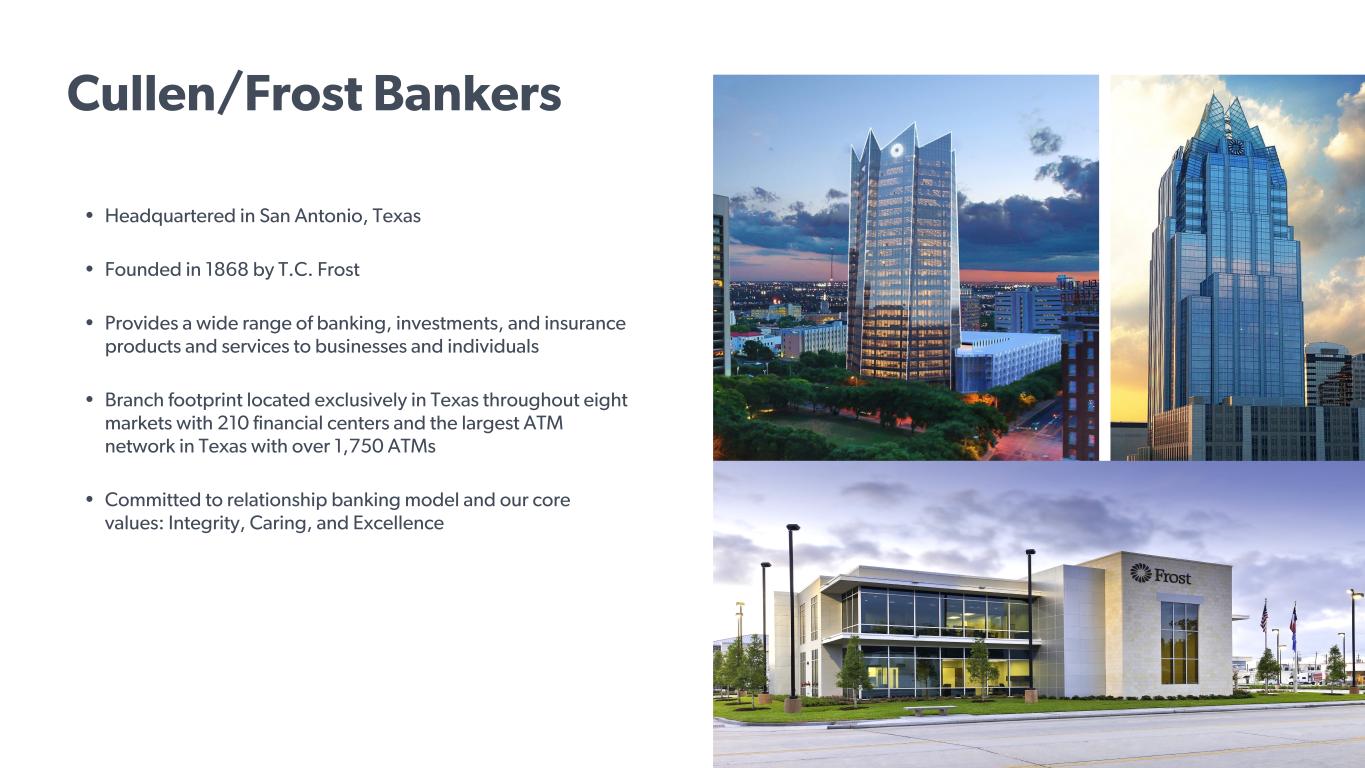
3 • Headquartered in San Antonio, Texas • Founded in 1868 by T.C. Frost • Provides a wide range of banking, investments, and insurance products and services to businesses and individuals • Branch footprint located exclusively in Texas throughout eight markets with 210 financial centers and the largest ATM network in Texas with over 1,750 ATMs • Committed to relationship banking model and our core values: Integrity, Caring, and Excellence Cullen/Frost Bankers
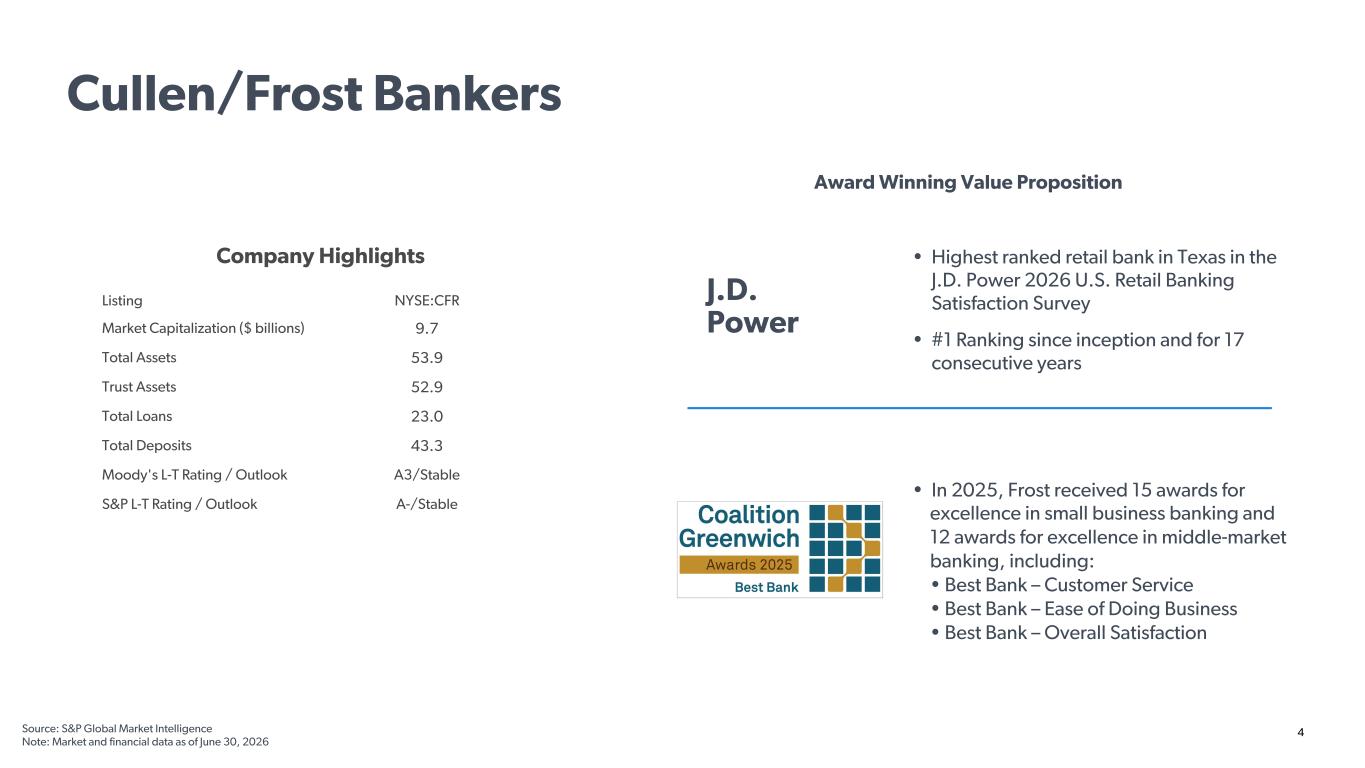
4 Award Winning Value Proposition J.D. Power • Highest ranked retail bank in Texas in the J.D. Power 2026 U.S. Retail Banking Satisfaction Survey • #1 Ranking since inception and for 17 consecutive years • In 2025, Frost received 15 awards for excellence in small business banking and 12 awards for excellence in middle-market banking, including: • Best Bank – Customer Service • Best Bank – Ease of Doing Business • Best Bank – Overall Satisfaction Source: S&P Global Market Intelligence Note: Market and financial data as of June 30, 2026 Cullen/Frost Bankers Company Highlights Listing NYSE:CFR Market Capitalization ($ billions) 9.7 Total Assets 53.9 Trust Assets 52.9 Total Loans 23.0 Total Deposits 43.3 Moody's L-T Rating / Outlook A3/Stable S&P L-T Rating / Outlook A-/Stable
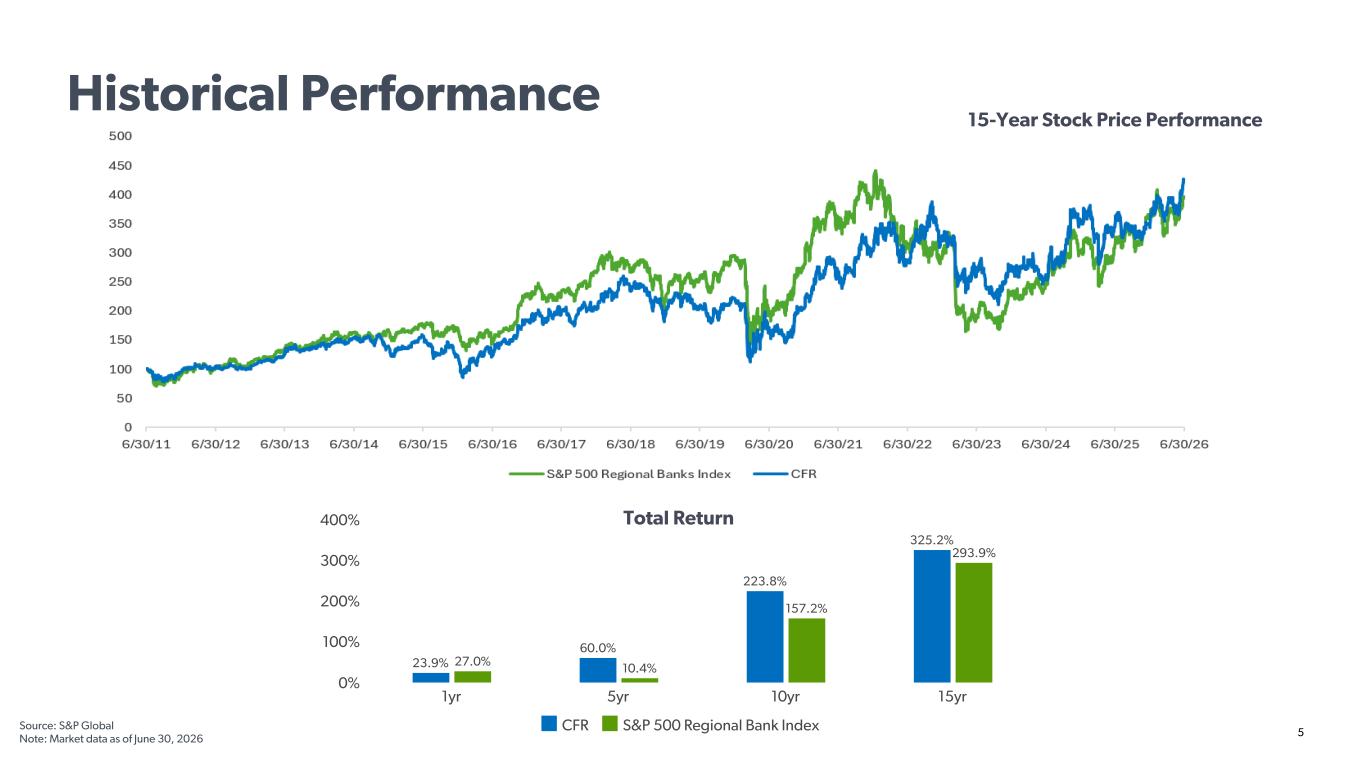
5 15-Year Stock Price Performance Total Return Source: S&P Global Note: Market data as of June 30, 2026 23.9% 60.0% 223.8% 325.2% 27.0% 10.4% 157.2% 293.9% CFR S&P 500 Regional Bank Index 1yr 5yr 10yr 15yr 0% 100% 200% 300% 400% Historical Performance
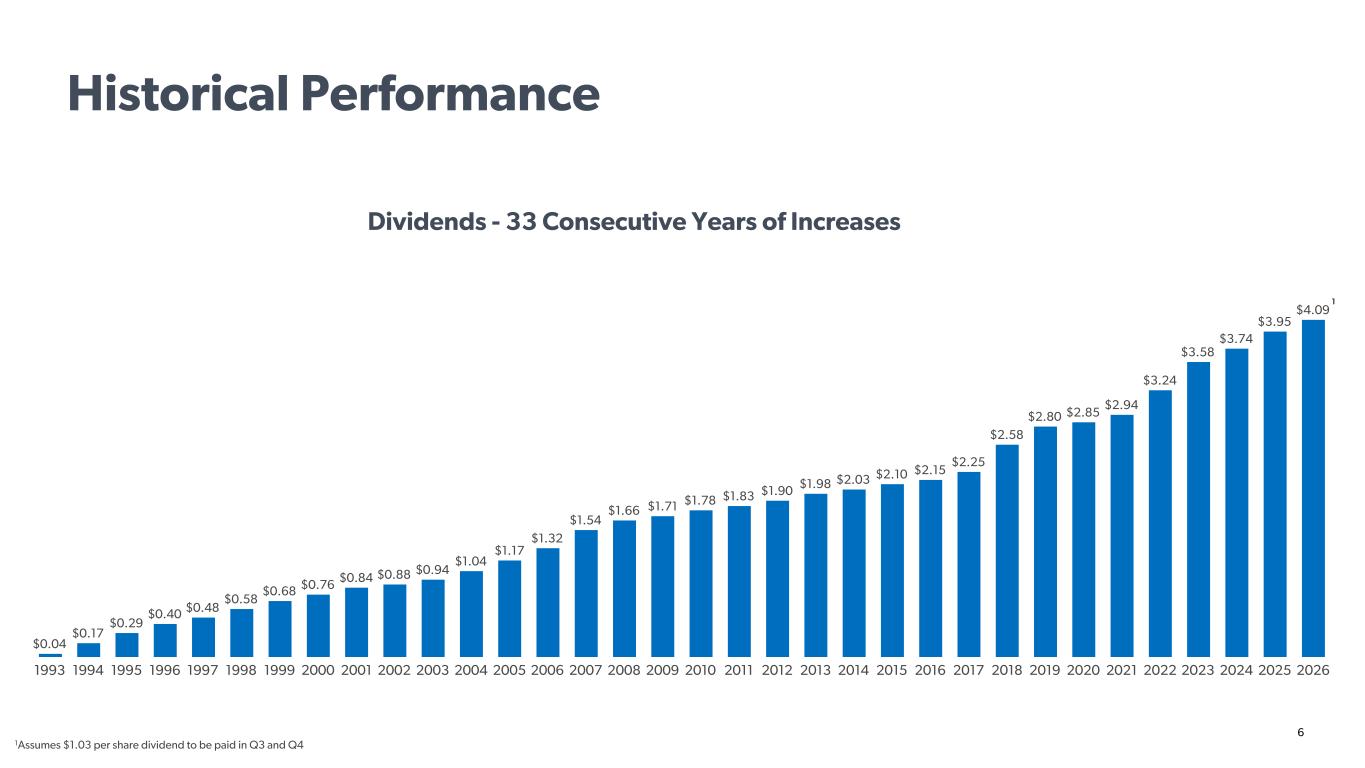
6 $0.04 $0.17 $0.29 $0.40 $0.48 $0.58 $0.68 $0.76 $0.84 $0.88 $0.94 $1.04 $1.17 $1.32 $1.54 $1.66 $1.71 $1.78 $1.83 $1.90 $1.98 $2.03 $2.10 $2.15 $2.25 $2.58 $2.80 $2.85 $2.94 $3.24 $3.58 $3.74 $3.95 $4.09 1993 1994 1995 1996 1997 1998 1999 2000 2001 2002 2003 2004 2005 2006 2007 2008 2009 2010 2011 2012 2013 2014 2015 2016 2017 2018 2019 2020 2021 2022 2023 2024 2025 2026 Dividends - 33 Consecutive Years of Increases 1Assumes $1.03 per share dividend to be paid in Q3 and Q4 1 Historical Performance
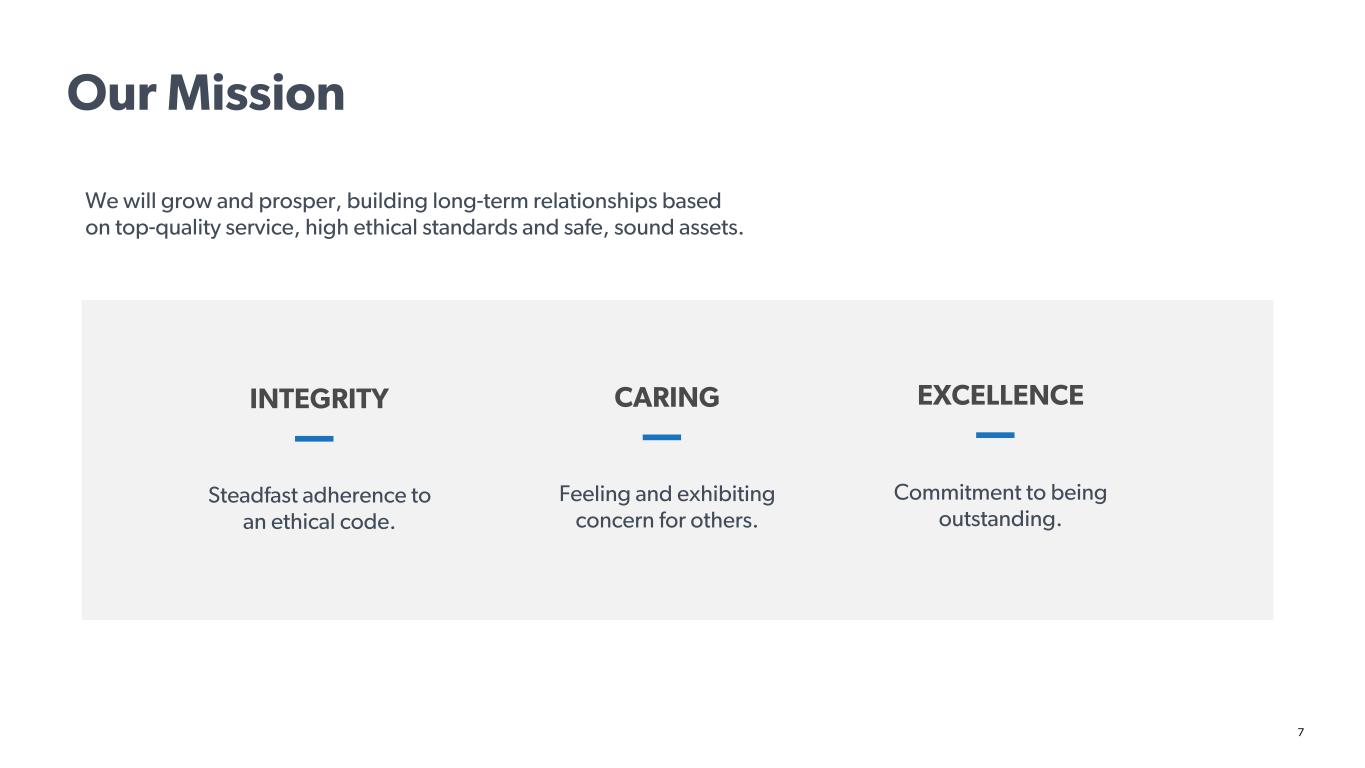
7 We will grow and prosper, building long-term relationships based on top-quality service, high ethical standards and safe, sound assets. INTEGRITY Steadfast adherence to an ethical code. CARING Feeling and exhibiting concern for others. EXCELLENCE Commitment to being outstanding. Our Mission
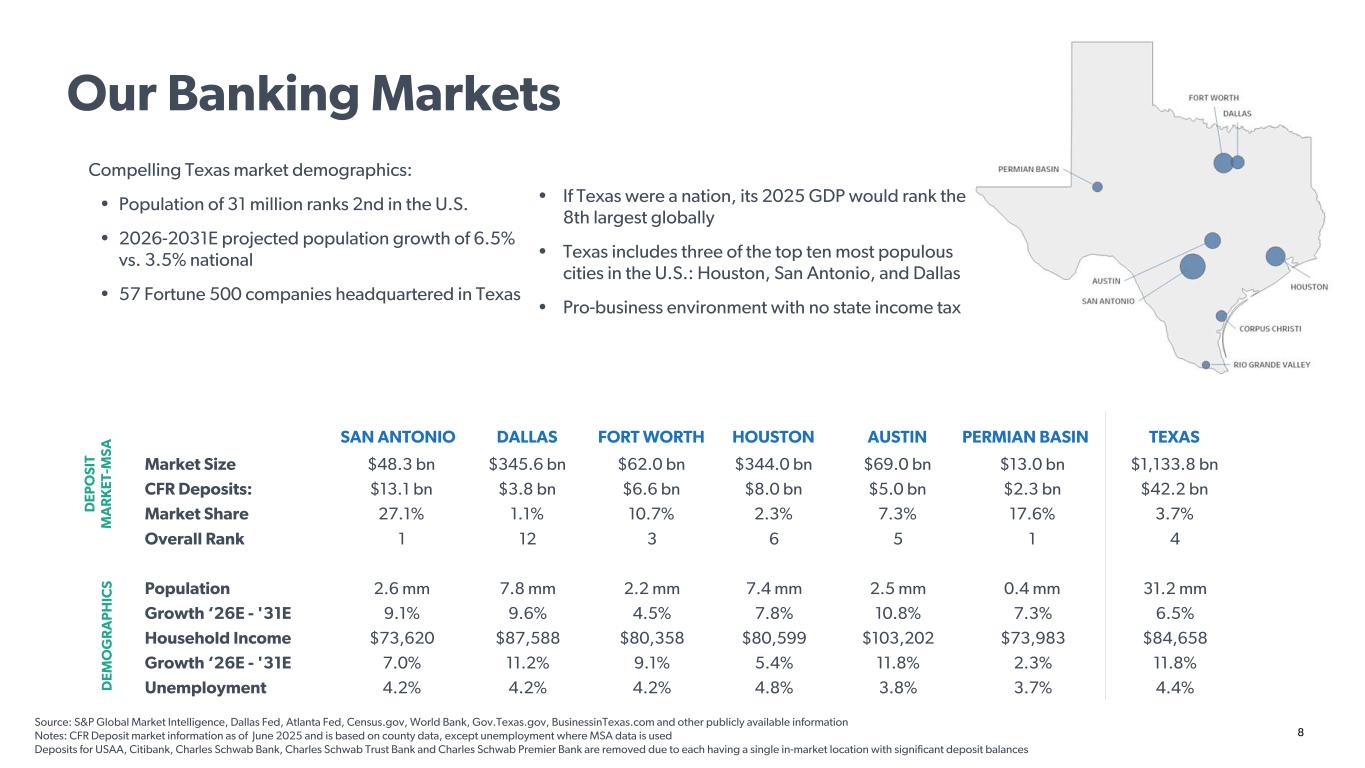
8 Compelling Texas market demographics: • Population of 31 million ranks 2nd in the U.S. • 2026-2031E projected population growth of 6.5% vs. 3.5% national • 57 Fortune 500 companies headquartered in Texas D EP O SI T M A R K ET -M SA D EM O G R A P H IC S • If Texas were a nation, its 2025 GDP would rank the 8th largest globally • Texas includes three of the top ten most populous cities in the U.S.: Houston, San Antonio, and Dallas • Pro-business environment with no state income tax Our Banking Markets Source: S&P Global Market Intelligence, Dallas Fed, Atlanta Fed, Census.gov, World Bank, Gov.Texas.gov, BusinessinTexas.com and other publicly available information Notes: CFR Deposit market information as of June 2025 and is based on county data, except unemployment where MSA data is used Deposits for USAA, Citibank, Charles Schwab Bank, Charles Schwab Trust Bank and Charles Schwab Premier Bank are removed due to each having a single in-market location with significant deposit balances SAN ANTONIO DALLAS FORT WORTH HOUSTON AUSTIN PERMIAN BASIN TEXAS Market Size $48.3 bn $345.6 bn $62.0 bn $344.0 bn $69.0 bn $13.0 bn $1,133.8 bn CFR Deposits: $13.1 bn $3.8 bn $6.6 bn $8.0 bn $5.0 bn $2.3 bn $42.2 bn Market Share 27.1% 1.1% 10.7% 2.3% 7.3% 17.6% 3.7% Overall Rank 1 12 3 6 5 1 4 Population 2.6 mm 7.8 mm 2.2 mm 7.4 mm 2.5 mm 0.4 mm 31.2 mm Growth ‘26E - '31E 9.1% 9.6% 4.5% 7.8% 10.8% 7.3% 6.5% Household Income $73,620 $87,588 $80,358 $80,599 $103,202 $73,983 $84,658 Growth ‘26E - '31E 7.0% 11.2% 9.1% 5.4% 11.8% 2.3% 11.8% Unemployment 4.2% 4.2% 4.2% 4.8% 3.8% 3.7% 4.4%
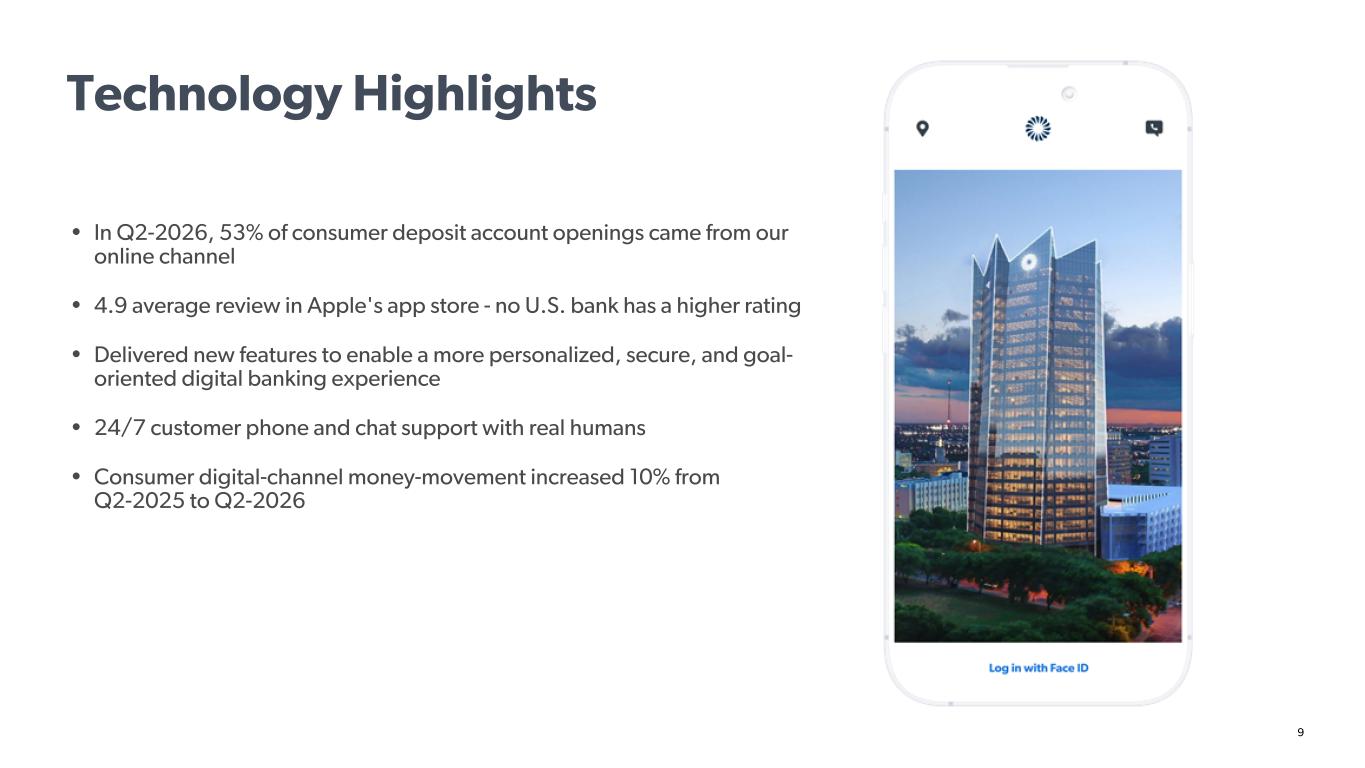
9 • In Q2-2026, 53% of consumer deposit account openings came from our online channel • 4.9 average review in Apple's app store - no U.S. bank has a higher rating • Delivered new features to enable a more personalized, secure, and goal- oriented digital banking experience • 24/7 customer phone and chat support with real humans • Consumer digital-channel money-movement increased 10% from Q2-2025 to Q2-2026 Technology Highlights
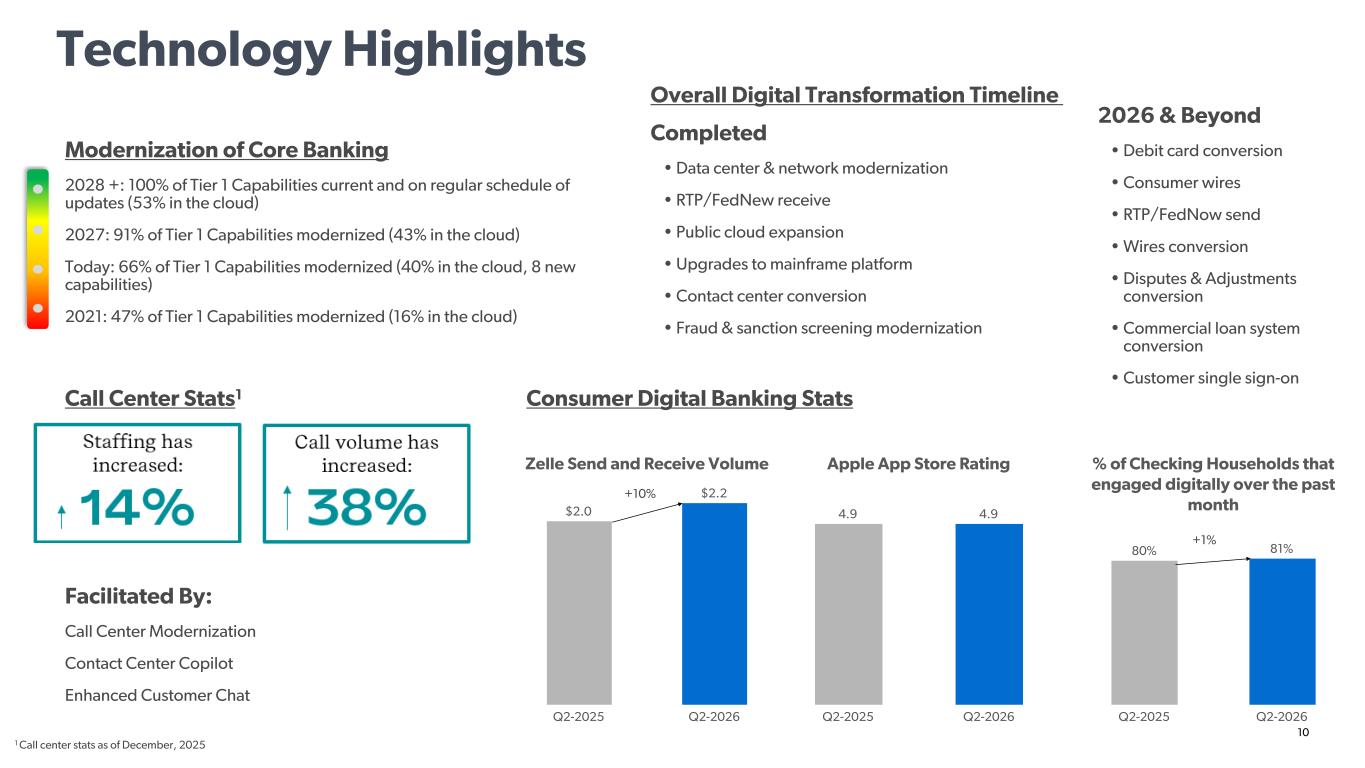
10 Technology Highlights Modernization of Core Banking 2028 +: 100% of Tier 1 Capabilities current and on regular schedule of updates (53% in the cloud) 2027: 91% of Tier 1 Capabilities modernized (43% in the cloud) Today: 66% of Tier 1 Capabilities modernized (40% in the cloud, 8 new capabilities) 2021: 47% of Tier 1 Capabilities modernized (16% in the cloud) Overall Digital Transformation Timeline Completed • Data center & network modernization • RTP/FedNew receive • Public cloud expansion • Upgrades to mainframe platform • Contact center conversion • Fraud & sanction screening modernization 2026 & Beyond • Debit card conversion • Consumer wires • RTP/FedNow send • Wires conversion • Disputes & Adjustments conversion • Commercial loan system conversion • Customer single sign-on Call Center Stats1 Facilitated By: Call Center Modernization Contact Center Copilot Enhanced Customer Chat Zelle Send and Receive Volume $2.0 $2.2 Q2-2025 Q2-2026 Apple App Store Rating 4.9 4.9 Q2-2025 Q2-2026 % of Checking Households that engaged digitally over the past month 80% 81% Q2-2025 Q2-2026 Consumer Digital Banking Stats +10% +1% 1 Call center stats as of December, 2025
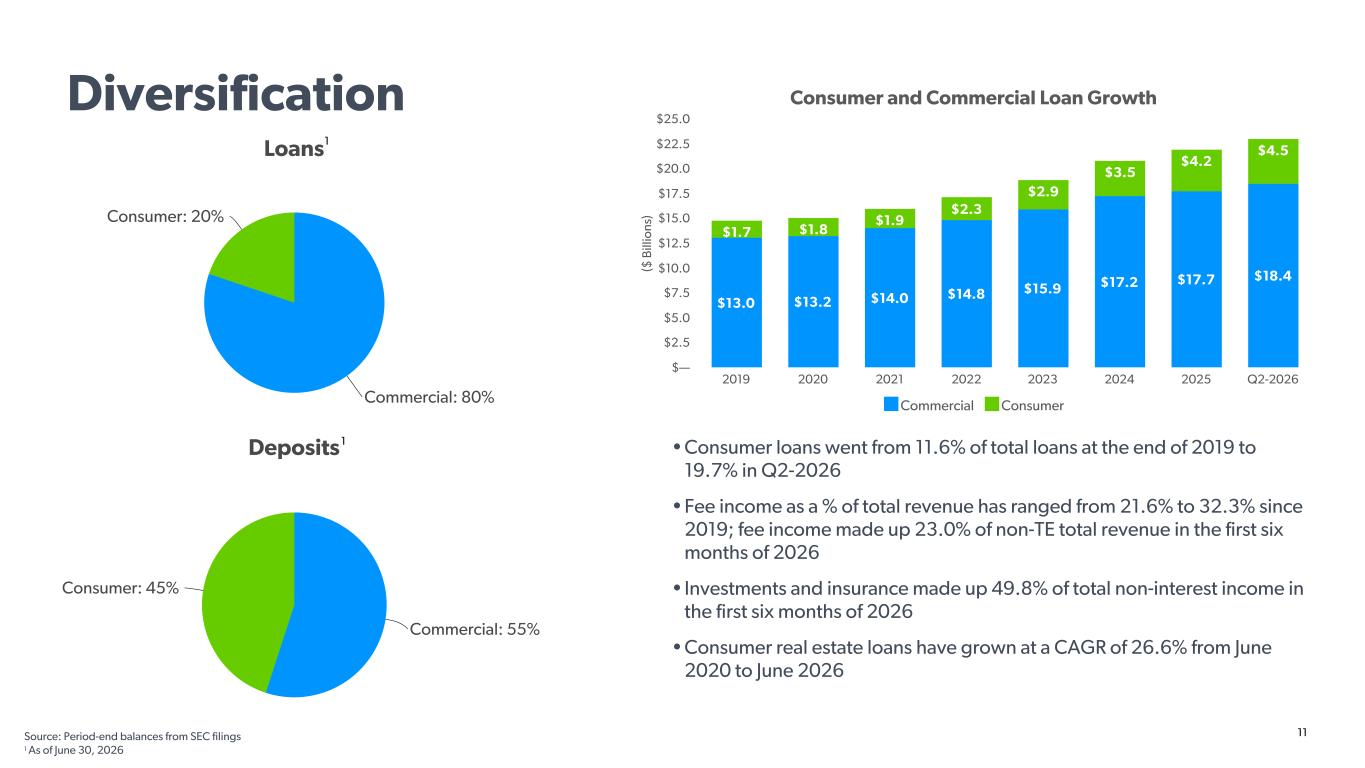
11 Loans Commercial: 80% Consumer: 20% Deposits Commercial: 55% Consumer: 45% ($ B ill io ns ) Consumer and Commercial Loan Growth $13.0 $13.2 $14.0 $14.8 $15.9 $17.2 $17.7 $18.4 $1.7 $1.8 $1.9 $2.3 $2.9 $3.5 $4.2 $4.5 Commercial Consumer 2019 2020 2021 2022 2023 2024 2025 Q2-2026 $— $2.5 $5.0 $7.5 $10.0 $12.5 $15.0 $17.5 $20.0 $22.5 $25.0 • Consumer loans went from 11.6% of total loans at the end of 2019 to 19.7% in Q2-2026 • Fee income as a % of total revenue has ranged from 21.6% to 32.3% since 2019; fee income made up 23.0% of non-TE total revenue in the first six months of 2026 • Investments and insurance made up 49.8% of total non-interest income in the first six months of 2026 • Consumer real estate loans have grown at a CAGR of 26.6% from June 2020 to June 2026 Source: Period-end balances from SEC filings 1 As of June 30, 2026 1 1 Diversification
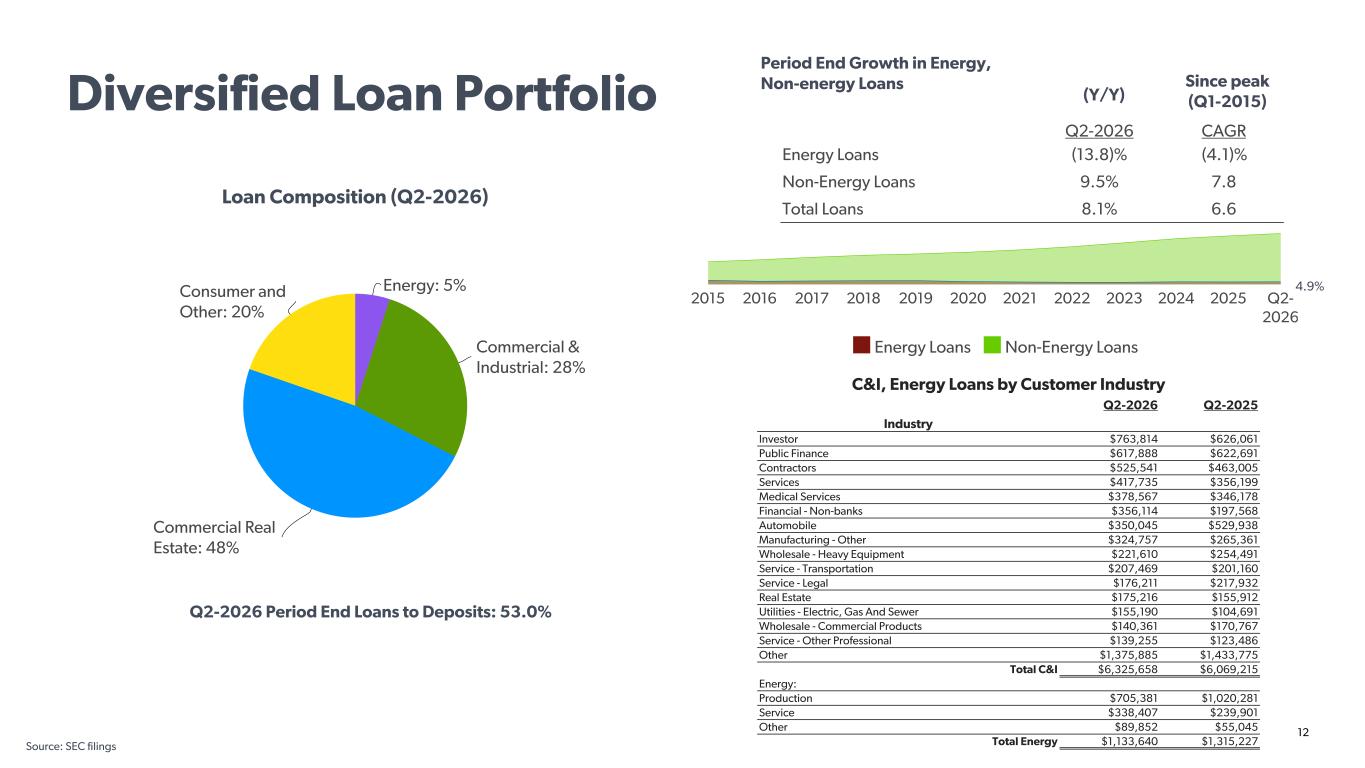
12 Period End Growth in Energy, Non-energy Loans Loan Composition (Q2-2026) Q2-2026 Period End Loans to Deposits: 53.0% Source: SEC filings Since peak (Q1-2015)(Y/Y) Q2-2026 CAGR Energy Loans (13.8)% (4.1)% Non-Energy Loans 9.5% 7.8 Total Loans 8.1% 6.6 4.9% Energy Loans Non-Energy Loans 2015 2016 2017 2018 2019 2020 2021 2022 2023 2024 2025 Q2- 2026 Energy: 5% Commercial & Industrial: 28% Commercial Real Estate: 48% Consumer and Other: 20% Diversified Loan Portfolio C&I, Energy Loans by Customer Industry Q2-2026 Q2-2025 Industry Investor $763,814 $626,061 Public Finance $617,888 $622,691 Contractors $525,541 $463,005 Services $417,735 $356,199 Medical Services $378,567 $346,178 Financial - Non-banks $356,114 $197,568 Automobile $350,045 $529,938 Manufacturing - Other $324,757 $265,361 Wholesale - Heavy Equipment $221,610 $254,491 Service - Transportation $207,469 $201,160 Service - Legal $176,211 $217,932 Real Estate $175,216 $155,912 Utilities - Electric, Gas And Sewer $155,190 $104,691 Wholesale - Commercial Products $140,361 $170,767 Service - Other Professional $139,255 $123,486 Other $1,375,885 $1,433,775 Total C&I $6,325,658 $6,069,215 Energy: Production $705,381 $1,020,281 Service $338,407 $239,901 Other $89,852 $55,045 Total Energy $1,133,640 $1,315,227
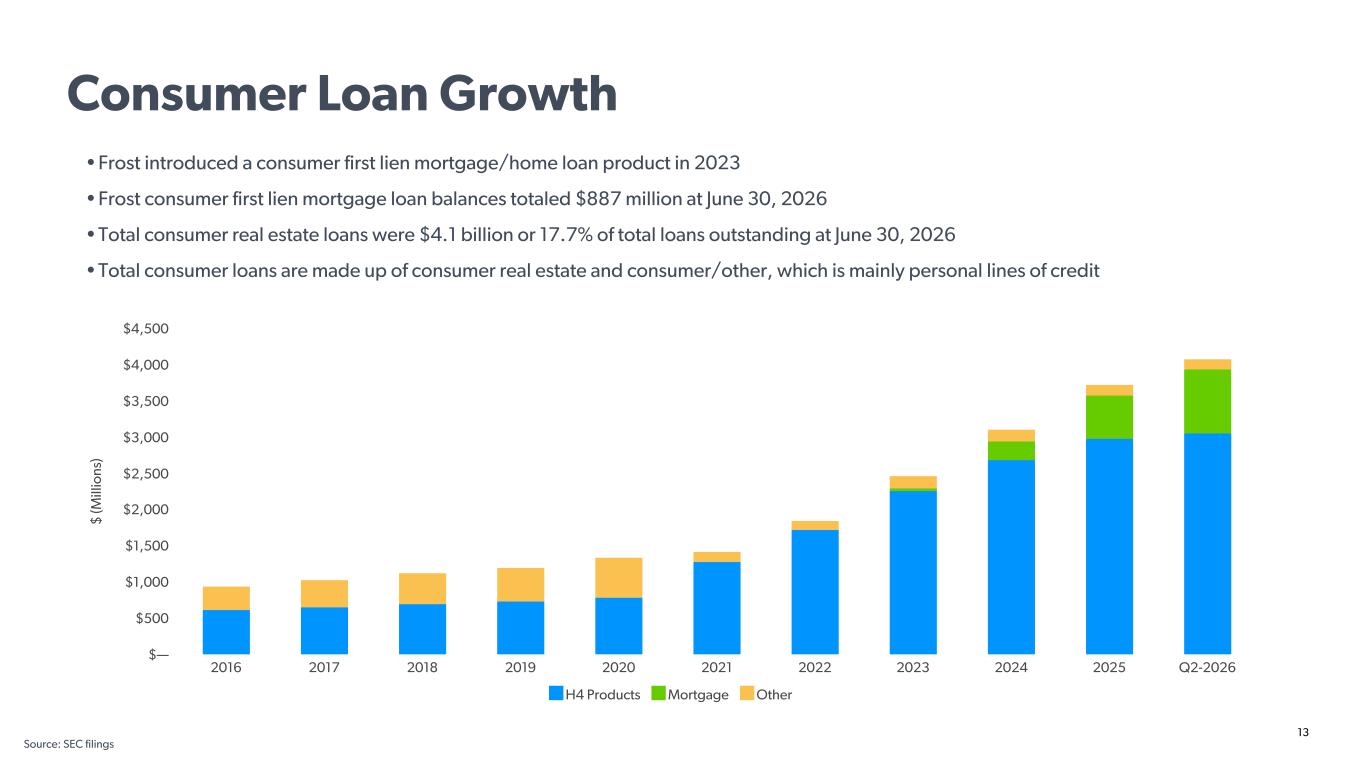
13 • Frost introduced a consumer first lien mortgage/home loan product in 2023 • Frost consumer first lien mortgage loan balances totaled $887 million at June 30, 2026 • Total consumer real estate loans were $4.1 billion or 17.7% of total loans outstanding at June 30, 2026 • Total consumer loans are made up of consumer real estate and consumer/other, which is mainly personal lines of credit $ (M ill io ns ) H4 Products Mortgage Other 2016 2017 2018 2019 2020 2021 2022 2023 2024 2025 Q2-2026 $— $500 $1,000 $1,500 $2,000 $2,500 $3,000 $3,500 $4,000 $4,500 Source: SEC filings Consumer Loan Growth
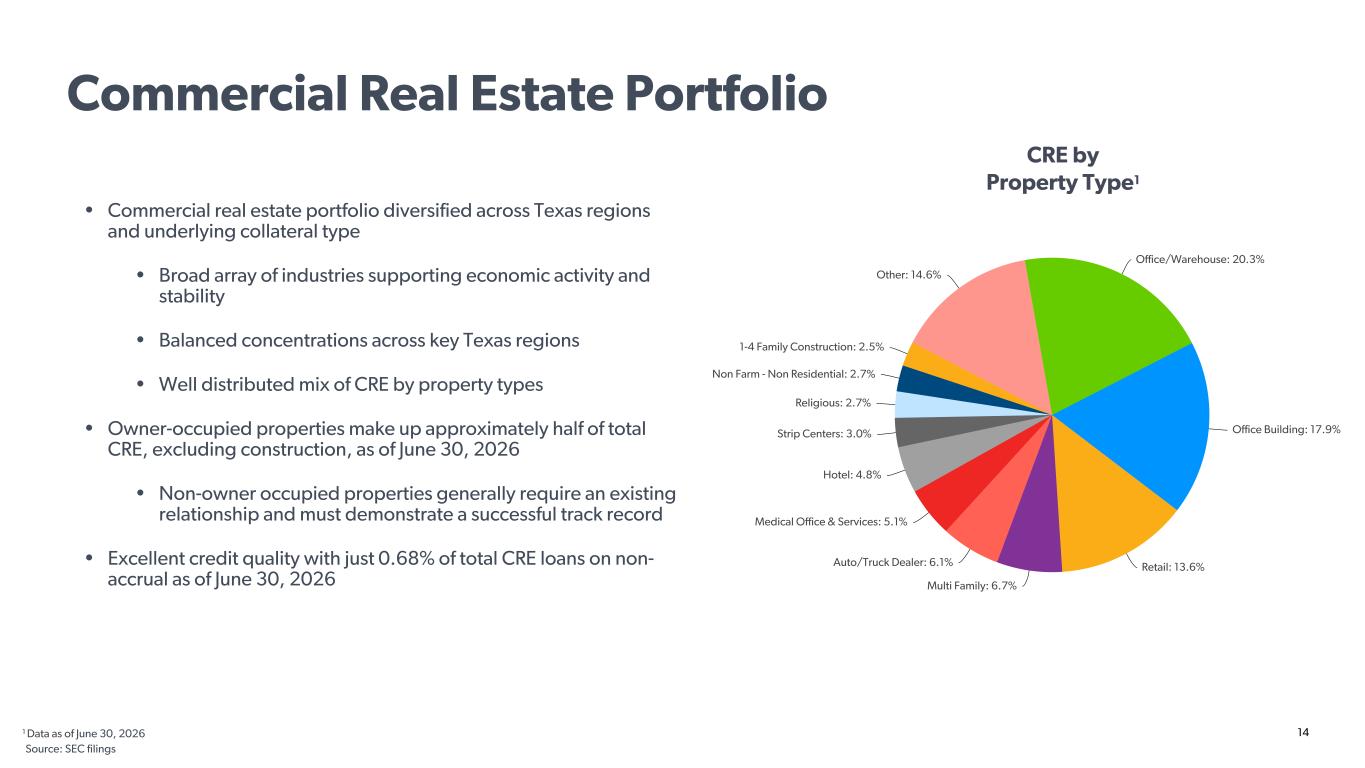
14 • Commercial real estate portfolio diversified across Texas regions and underlying collateral type • Broad array of industries supporting economic activity and stability • Balanced concentrations across key Texas regions • Well distributed mix of CRE by property types • Owner-occupied properties make up approximately half of total CRE, excluding construction, as of June 30, 2026 • Non-owner occupied properties generally require an existing relationship and must demonstrate a successful track record • Excellent credit quality with just 0.68% of total CRE loans on non- accrual as of June 30, 2026 CRE by Property Type1 Office/Warehouse: 20.3% Office Building: 17.9% Retail: 13.6% Multi Family: 6.7% Auto/Truck Dealer: 6.1% Medical Office & Services: 5.1% Hotel: 4.8% Strip Centers: 3.0% Religious: 2.7% Non Farm - Non Residential: 2.7% 1-4 Family Construction: 2.5% Other: 14.6% 1 Data as of June 30, 2026 Commercial Real Estate Portfolio Source: SEC filings
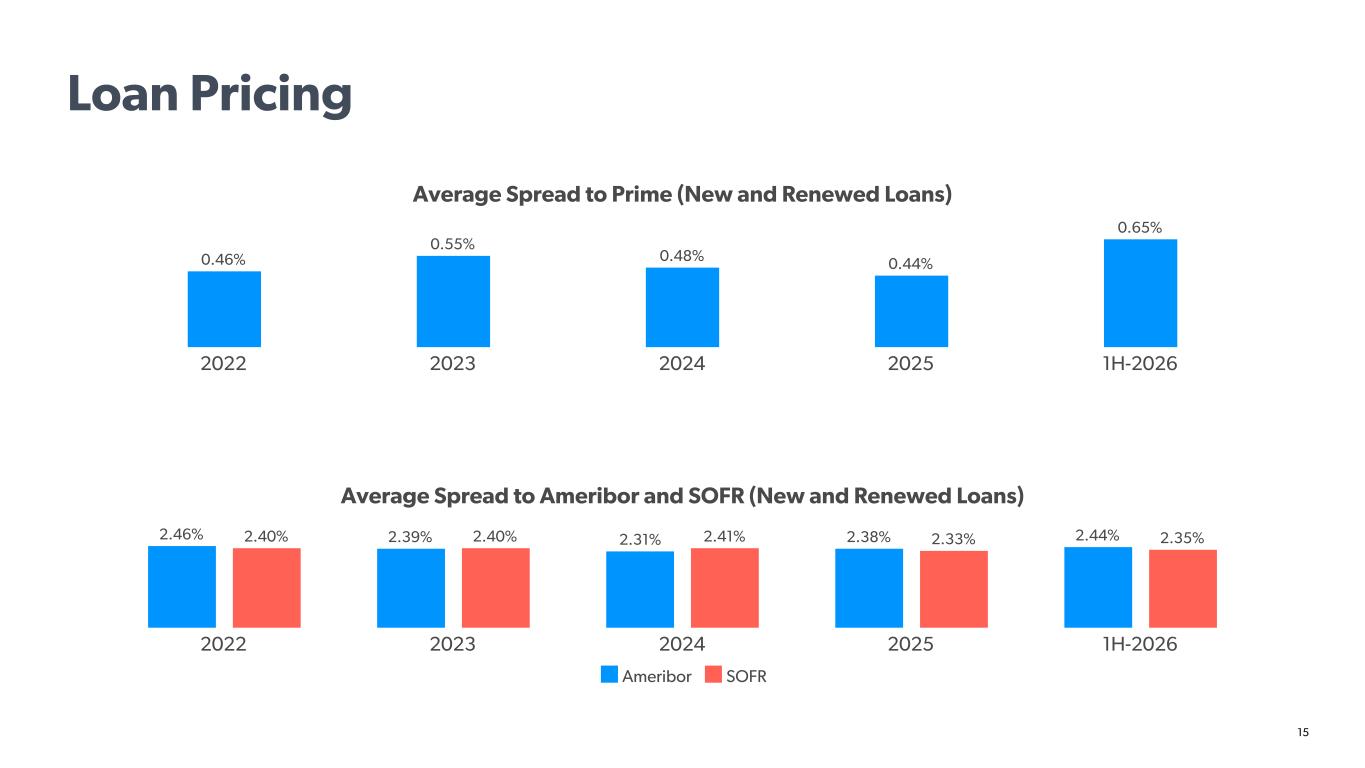
15 Average Spread to Ameribor and SOFR (New and Renewed Loans) Average Spread to Prime (New and Renewed Loans) 2.46% 2.39% 2.31% 2.38% 2.44%2.40% 2.40% 2.41% 2.33% 2.35% Ameribor SOFR 2022 2023 2024 2025 1H-2026 0.46% 0.55% 0.48% 0.44% 0.65% 2022 2023 2024 2025 1H-2026 Loan Pricing
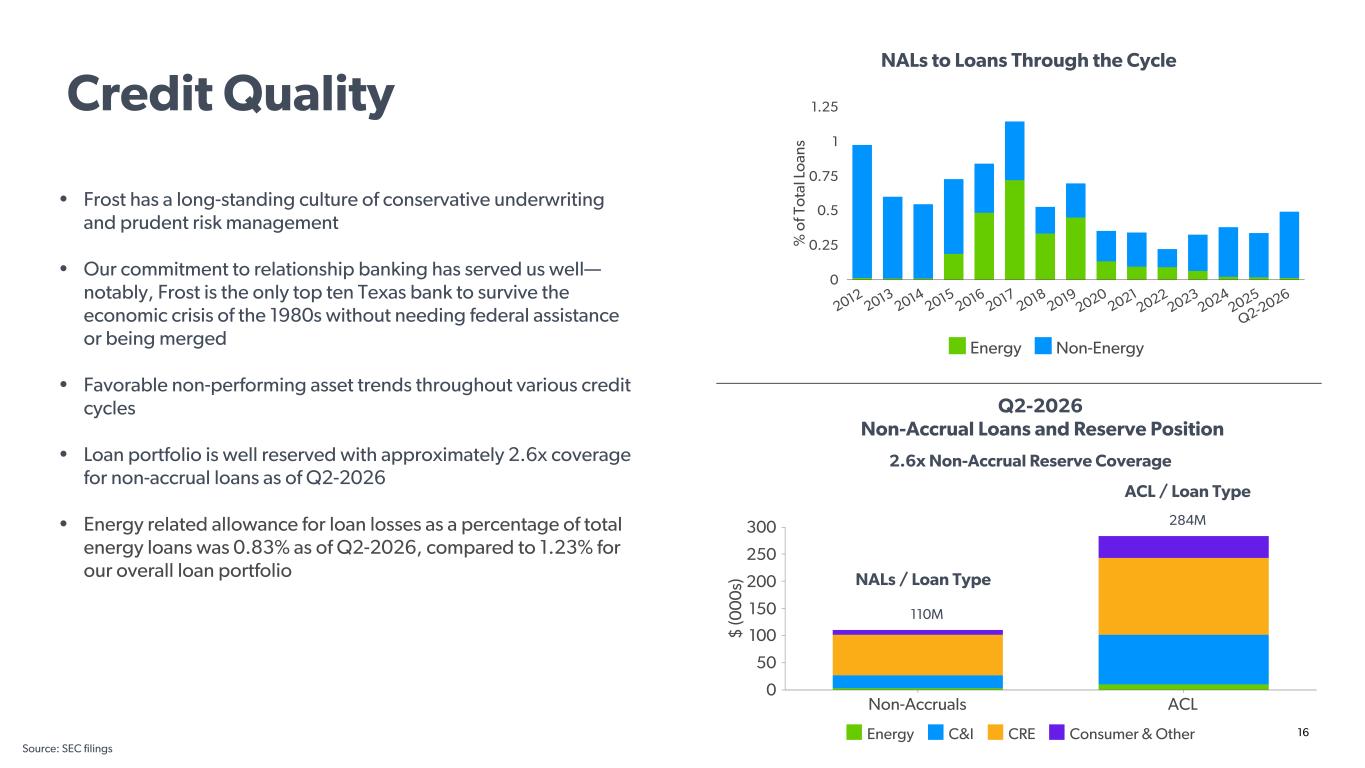
16 $ (0 0 0 s) Energy C&I CRE Consumer & Other Non-Accruals ACL 0 50 100 150 200 250 300 • Frost has a long-standing culture of conservative underwriting and prudent risk management • Our commitment to relationship banking has served us well— notably, Frost is the only top ten Texas bank to survive the economic crisis of the 1980s without needing federal assistance or being merged • Favorable non-performing asset trends throughout various credit cycles • Loan portfolio is well reserved with approximately 2.6x coverage for non-accrual loans as of Q2-2026 • Energy related allowance for loan losses as a percentage of total energy loans was 0.83% as of Q2-2026, compared to 1.23% for our overall loan portfolio NALs to Loans Through the Cycle Q2-2026 Non-Accrual Loans and Reserve Position ACL / Loan Type NALs / Loan Type 2.6x Non-Accrual Reserve Coverage 110M 284M % o f T ot al L oa ns Energy Non-Energy 2012 2013 2014 2015 2016 2017 2018 2019 2020 2021 2022 2023 2024 2025 Q2-2026 0 0.25 0.5 0.75 1 1.25 Source: SEC filings Credit Quality
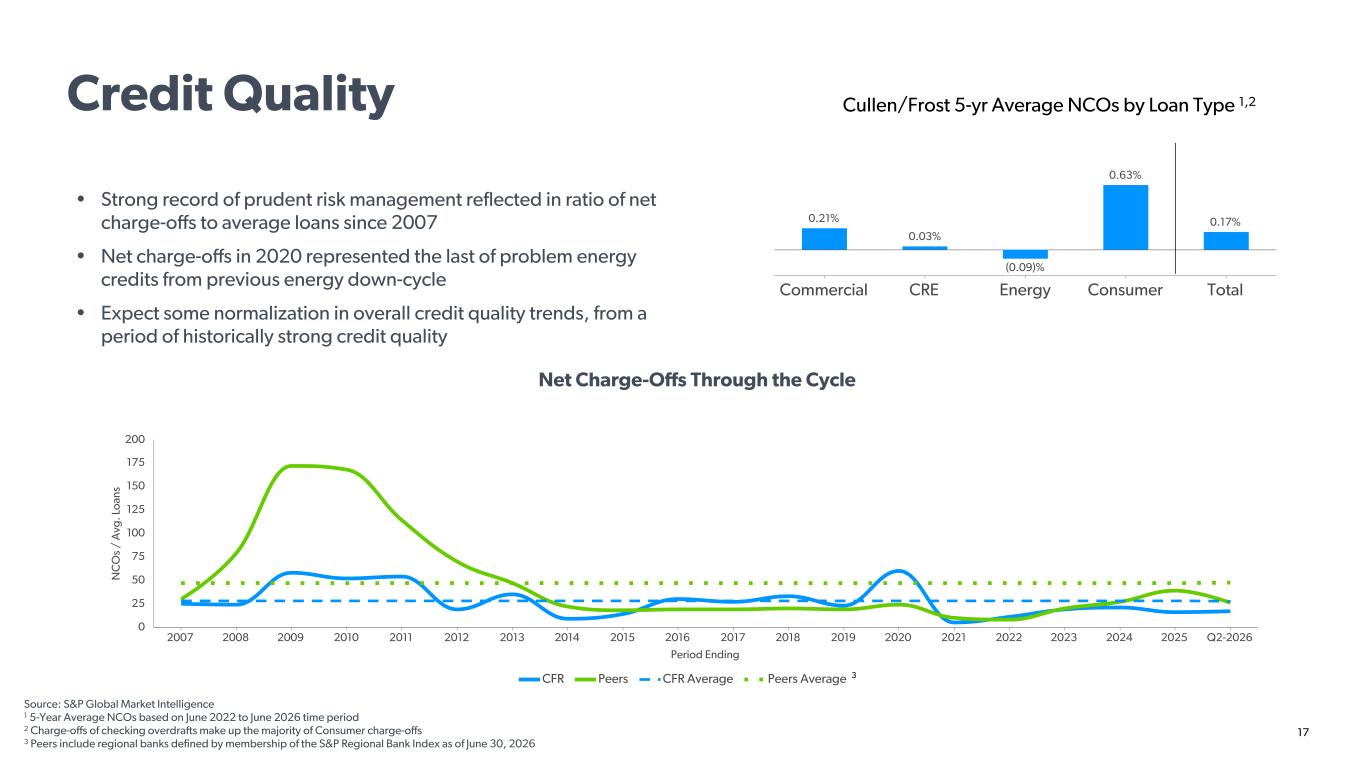
17 • Strong record of prudent risk management reflected in ratio of net charge-offs to average loans since 2007 • Net charge-offs in 2020 represented the last of problem energy credits from previous energy down-cycle • Expect some normalization in overall credit quality trends, from a period of historically strong credit quality Net Charge-Offs Through the Cycle Period Ending N C O s / A vg . L oa ns CFR Peers CFR Average Peers Average 2007 2008 2009 2010 2011 2012 2013 2014 2015 2016 2017 2018 2019 2020 2021 2022 2023 2024 2025 Q2-2026 0 25 50 75 100 125 150 175 200 0.21% 0.03% (0.09)% 0.63% 0.17% Commercial CRE Energy Consumer Total Cullen/Frost 5-yr Average NCOs by Loan Type 1,2 Source: S&P Global Market Intelligence 1 5-Year Average NCOs based on June 2022 to June 2026 time period 2 Charge-offs of checking overdrafts make up the majority of Consumer charge-offs 3 Peers include regional banks defined by membership of the S&P Regional Bank Index as of June 30, 2026 3 Credit Quality
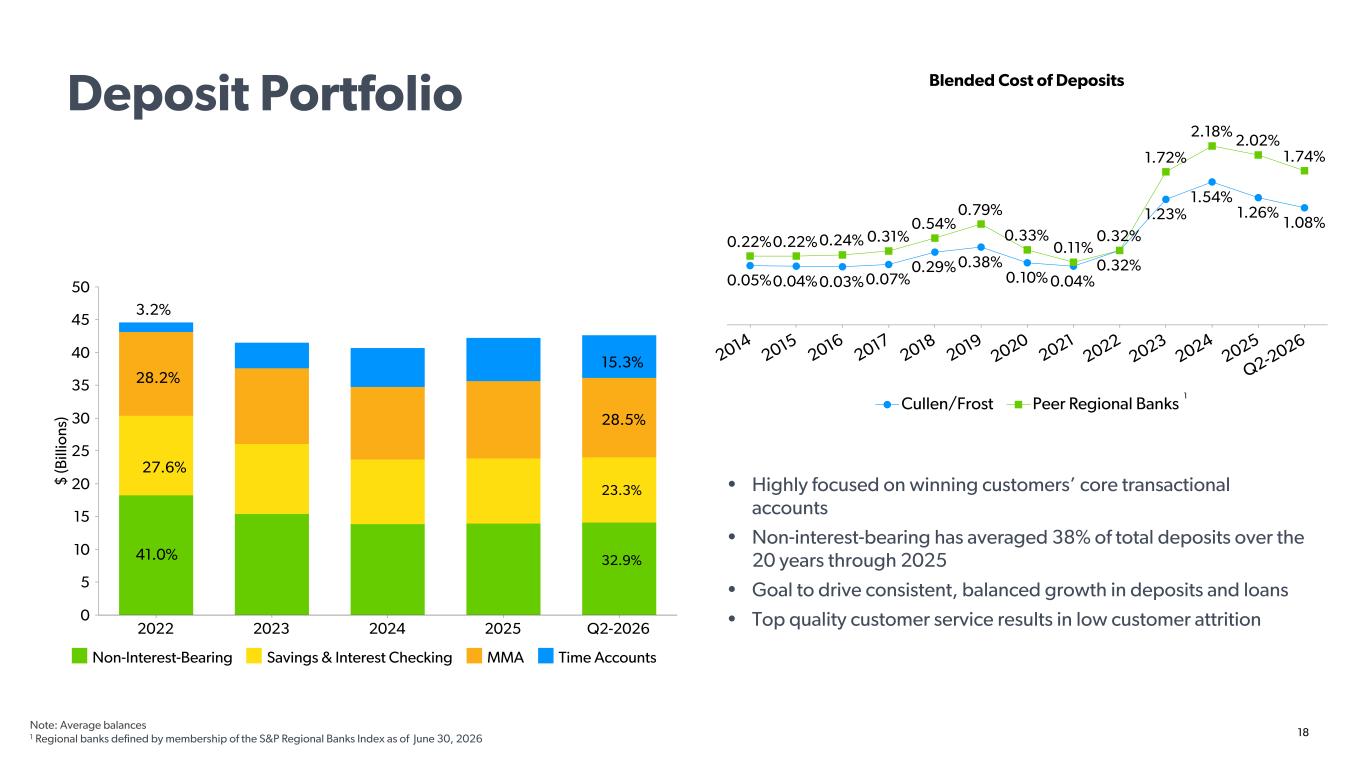
18 • Highly focused on winning customers’ core transactional accounts • Non-interest-bearing has averaged 38% of total deposits over the 20 years through 2025 • Goal to drive consistent, balanced growth in deposits and loans • Top quality customer service results in low customer attrition $ (B ill io ns ) Non-Interest-Bearing Savings & Interest Checking MMA Time Accounts 2022 2023 2024 2025 Q2-2026 0 5 10 15 20 25 30 35 40 45 50 32.9% 23.3% 28.5% Blended Cost of Deposits 0.05%0.04% 0.03% 0.07% 0.29% 0.38% 0.10% 0.04% 0.32% 1.23% 1.54% 1.26% 1.08% 0.22%0.22% 0.24% 0.31% 0.54% 0.79% 0.33% 0.11% 0.32% 1.72% 2.18% 2.02% 1.74% Cullen/Frost Peer Regional Banks 2014 2015 2016 2017 2018 2019 2020 2021 2022 2023 2024 2025 Q2-2026 15.3% 41.0% 27.6% 28.2% 3.2% 1 Deposit Portfolio Note: Average balances 1 Regional banks defined by membership of the S&P Regional Banks Index as of June 30, 2026
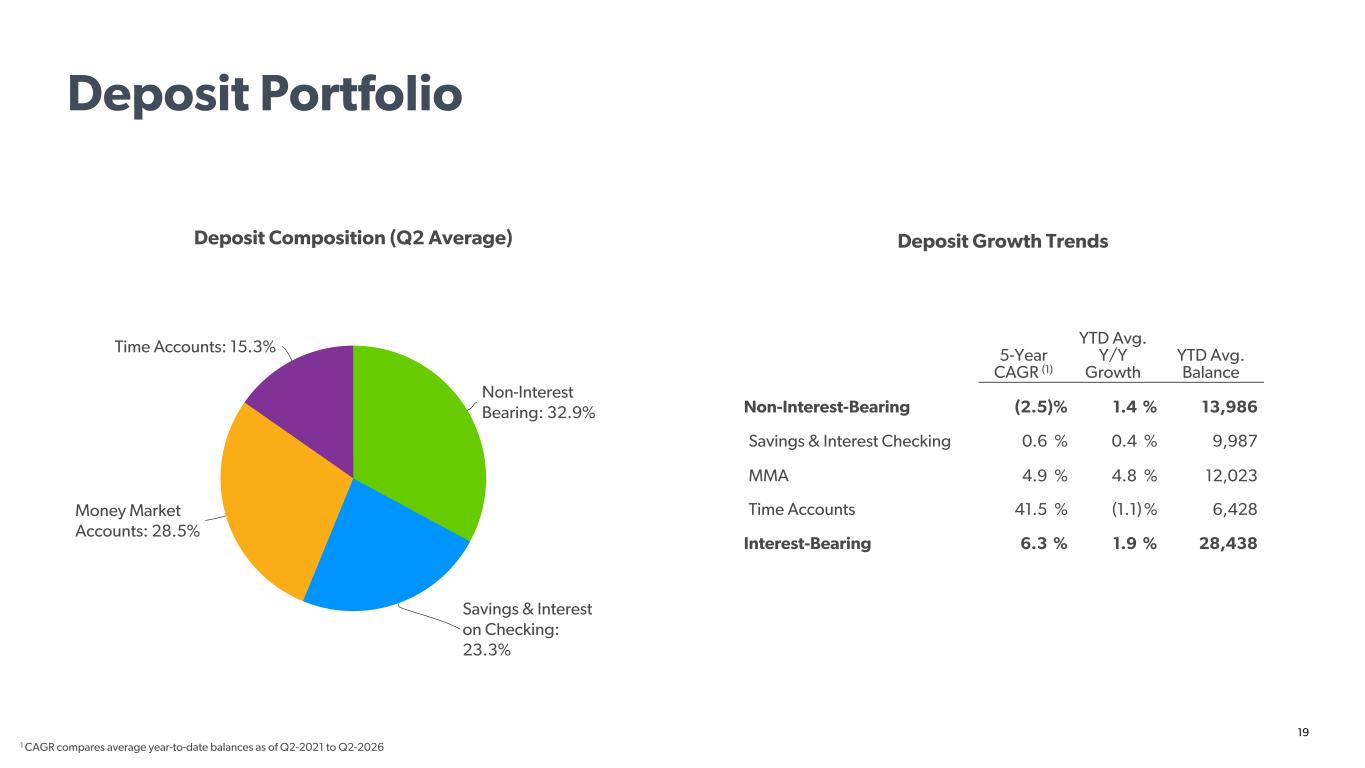
19 Deposit Composition (Q2 Average) Deposit Growth Trends Non-Interest Bearing: 32.9% Savings & Interest on Checking: 23.3% Money Market Accounts: 28.5% Time Accounts: 15.3% 5-Year CAGR (1) YTD Avg. Y/Y Growth YTD Avg. Balance Non-Interest-Bearing (2.5) % 1.4 % 13,986 Savings & Interest Checking 0.6 % 0.4 % 9,987 MMA 4.9 % 4.8 % 12,023 Time Accounts 41.5 % (1.1) % 6,428 Interest-Bearing 6.3 % 1.9 % 28,438 1 CAGR compares average year-to-date balances as of Q2-2021 to Q2-2026 Deposit Portfolio
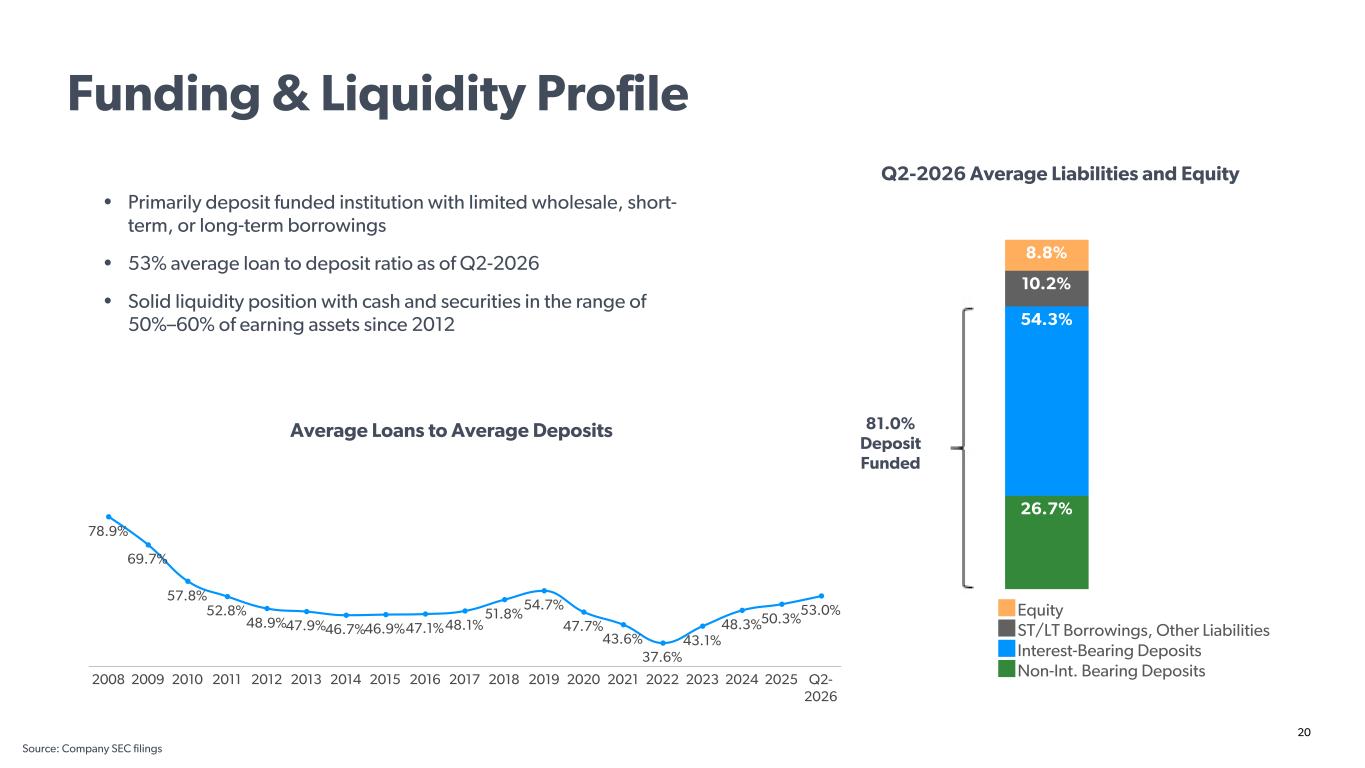
20 • Primarily deposit funded institution with limited wholesale, short- term, or long-term borrowings • 53% average loan to deposit ratio as of Q2-2026 • Solid liquidity position with cash and securities in the range of 50%–60% of earning assets since 2012 Q2-2026 Average Liabilities and Equity Average Loans to Average Deposits 81.0% Deposit Funded 78.9% 69.7% 57.8% 52.8% 48.9%47.9%46.7%46.9%47.1%48.1% 51.8% 54.7% 47.7% 43.6% 37.6% 43.1% 48.3%50.3% 53.0% 2008 2009 2010 2011 2012 2013 2014 2015 2016 2017 2018 2019 2020 2021 2022 2023 2024 2025 Q2- 2026 Funding & Liquidity Profile Source: Company SEC filings 26.7% 54.3% 10.2% 8.8% Equity ST/LT Borrowings, Other Liabilities Interest-Bearing Deposits Non-Int. Bearing Deposits
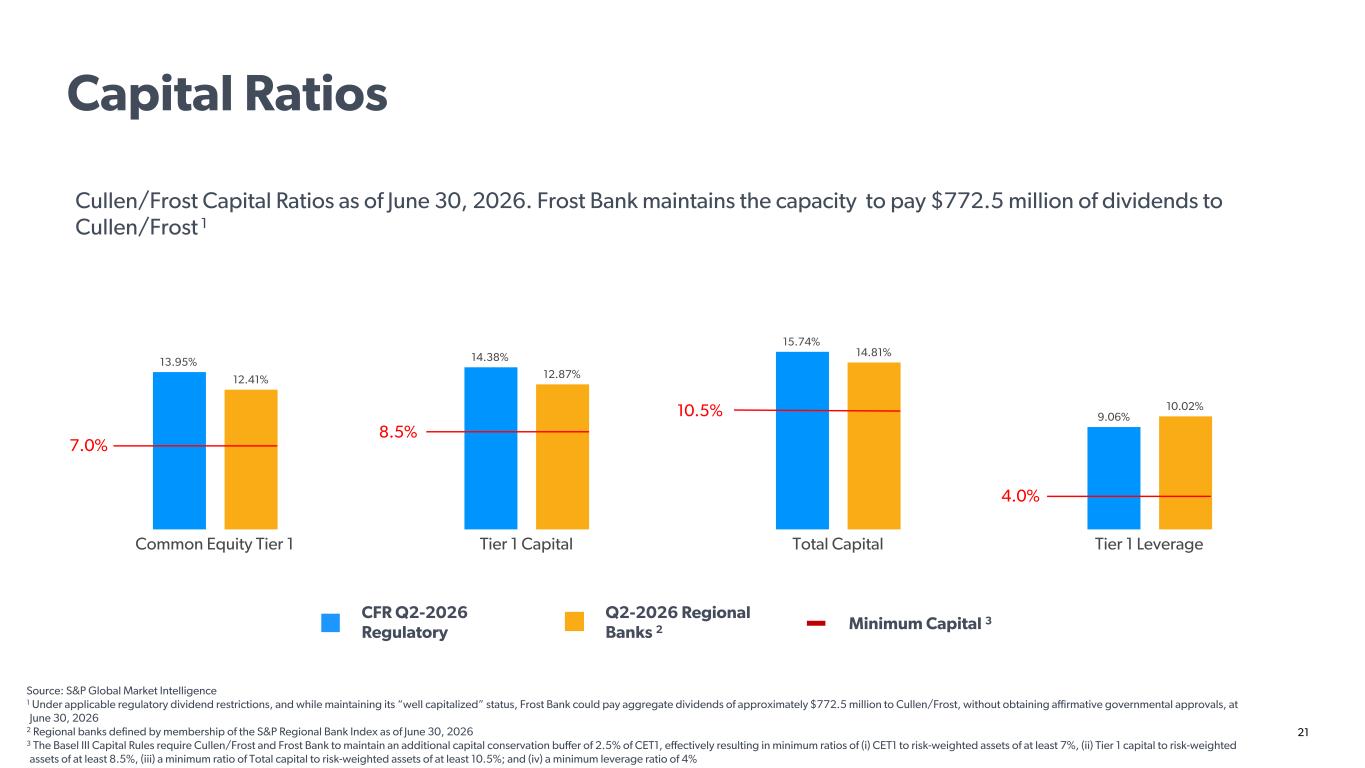
21 13.95% 14.38% 15.74% 9.06% 12.41% 12.87% 14.81% 10.02% Common Equity Tier 1 Tier 1 Capital Total Capital Tier 1 Leverage Cullen/Frost Capital Ratios as of June 30, 2026. Frost Bank maintains the capacity to pay $772.5 million of dividends to Cullen/Frost 1 CFR Q2-2026 Regulatory Q2-2026 Regional Banks 2 Minimum Capital 3 Source: S&P Global Market Intelligence 1 Under applicable regulatory dividend restrictions, and while maintaining its “well capitalized” status, Frost Bank could pay aggregate dividends of approximately $772.5 million to Cullen/Frost, without obtaining affirmative governmental approvals, at June 30, 2026 2 Regional banks defined by membership of the S&P Regional Bank Index as of June 30, 2026 3 The Basel III Capital Rules require Cullen/Frost and Frost Bank to maintain an additional capital conservation buffer of 2.5% of CET1, effectively resulting in minimum ratios of (i) CET1 to risk-weighted assets of at least 7%, (ii) Tier 1 capital to risk-weighted assets of at least 8.5%, (iii) a minimum ratio of Total capital to risk-weighted assets of at least 10.5%; and (iv) a minimum leverage ratio of 4% 4.0% 10.5% 8.5% 7.0% Capital Ratios
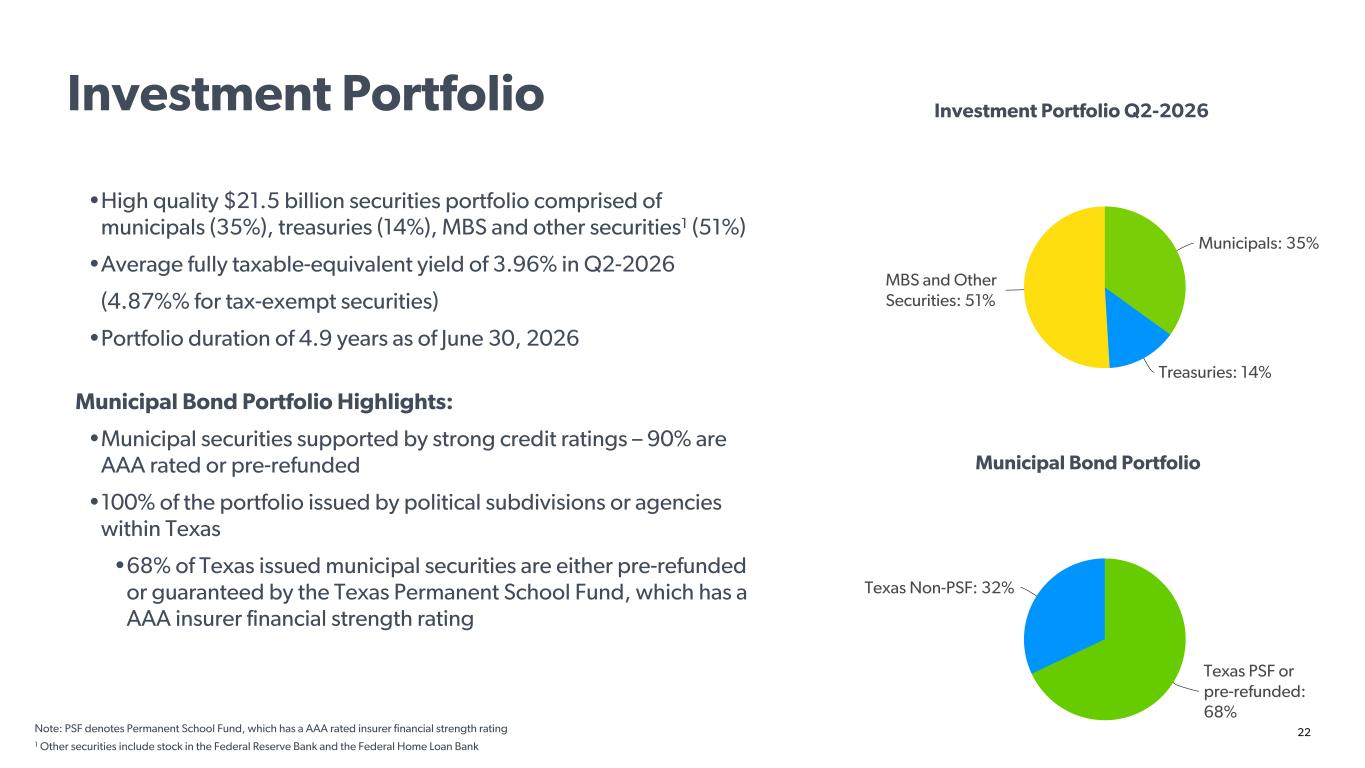
22 •High quality $21.5 billion securities portfolio comprised of municipals (35%), treasuries (14%), MBS and other securities1 (51%) •Average fully taxable-equivalent yield of 3.96% in Q2-2026 (4.87%% for tax-exempt securities) •Portfolio duration of 4.9 years as of June 30, 2026 Municipal Bond Portfolio Highlights: •Municipal securities supported by strong credit ratings – 90% are AAA rated or pre-refunded •100% of the portfolio issued by political subdivisions or agencies within Texas •68% of Texas issued municipal securities are either pre-refunded or guaranteed by the Texas Permanent School Fund, which has a AAA insurer financial strength rating Note: PSF denotes Permanent School Fund, which has a AAA rated insurer financial strength rating 1 Other securities include stock in the Federal Reserve Bank and the Federal Home Loan Bank Investment Portfolio Q2-2026 Municipal Bond Portfolio Municipals: 35% Treasuries: 14% MBS and Other Securities: 51% Texas PSF or pre-refunded: 68% Texas Non-PSF: 32% Investment Portfolio
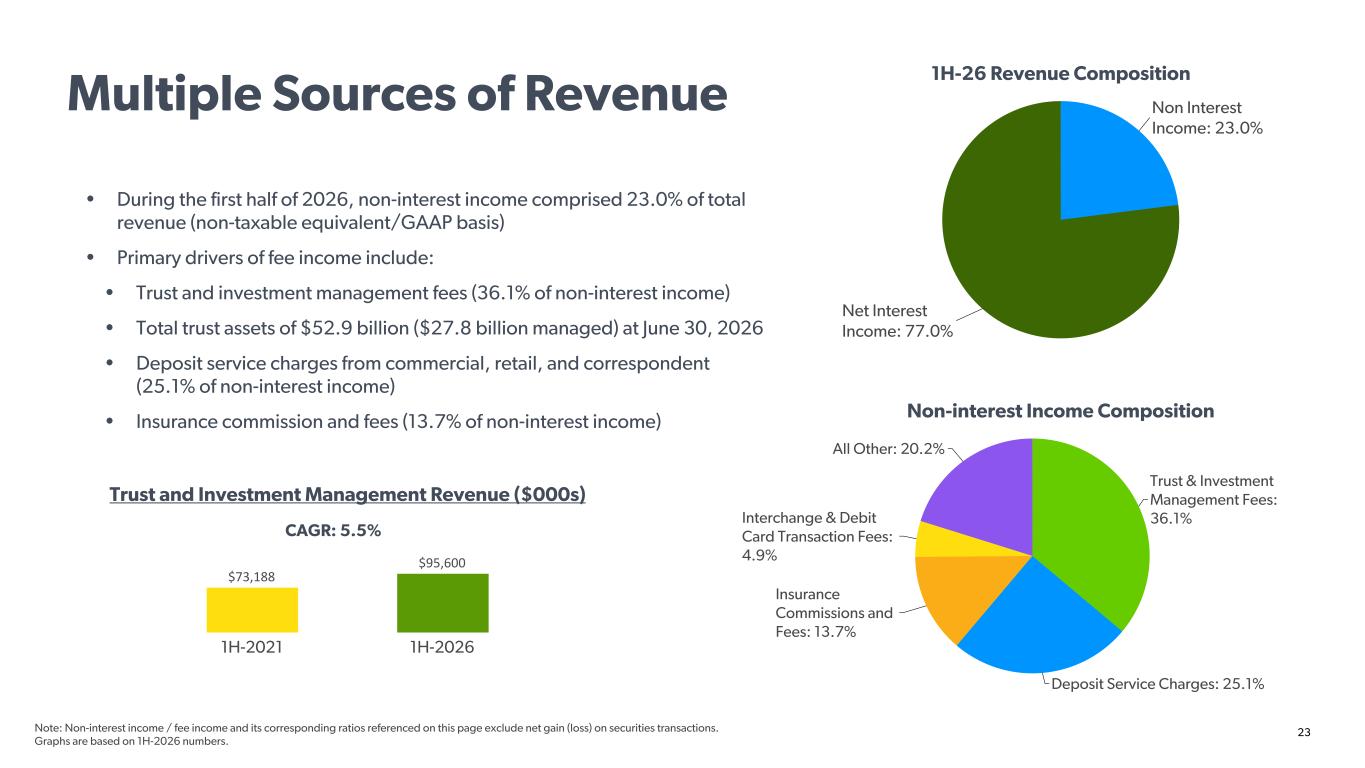
23 • During the first half of 2026, non-interest income comprised 23.0% of total revenue (non-taxable equivalent/GAAP basis) • Primary drivers of fee income include: • Trust and investment management fees (36.1% of non-interest income) • Total trust assets of $52.9 billion ($27.8 billion managed) at June 30, 2026 • Deposit service charges from commercial, retail, and correspondent (25.1% of non-interest income) • Insurance commission and fees (13.7% of non-interest income) Trust and Investment Management Revenue ($000s) Non-interest Income Composition 1H-26 Revenue Composition Non Interest Income: 23.0% Net Interest Income: 77.0% Trust & Investment Management Fees: 36.1% Deposit Service Charges: 25.1% Insurance Commissions and Fees: 13.7% Interchange & Debit Card Transaction Fees: 4.9% All Other: 20.2% $73,188 $95,600 1H-2021 1H-2026 CAGR: 5.5% Note: Non-interest income / fee income and its corresponding ratios referenced on this page exclude net gain (loss) on securities transactions. Graphs are based on 1H-2026 numbers. Multiple Sources of Revenue
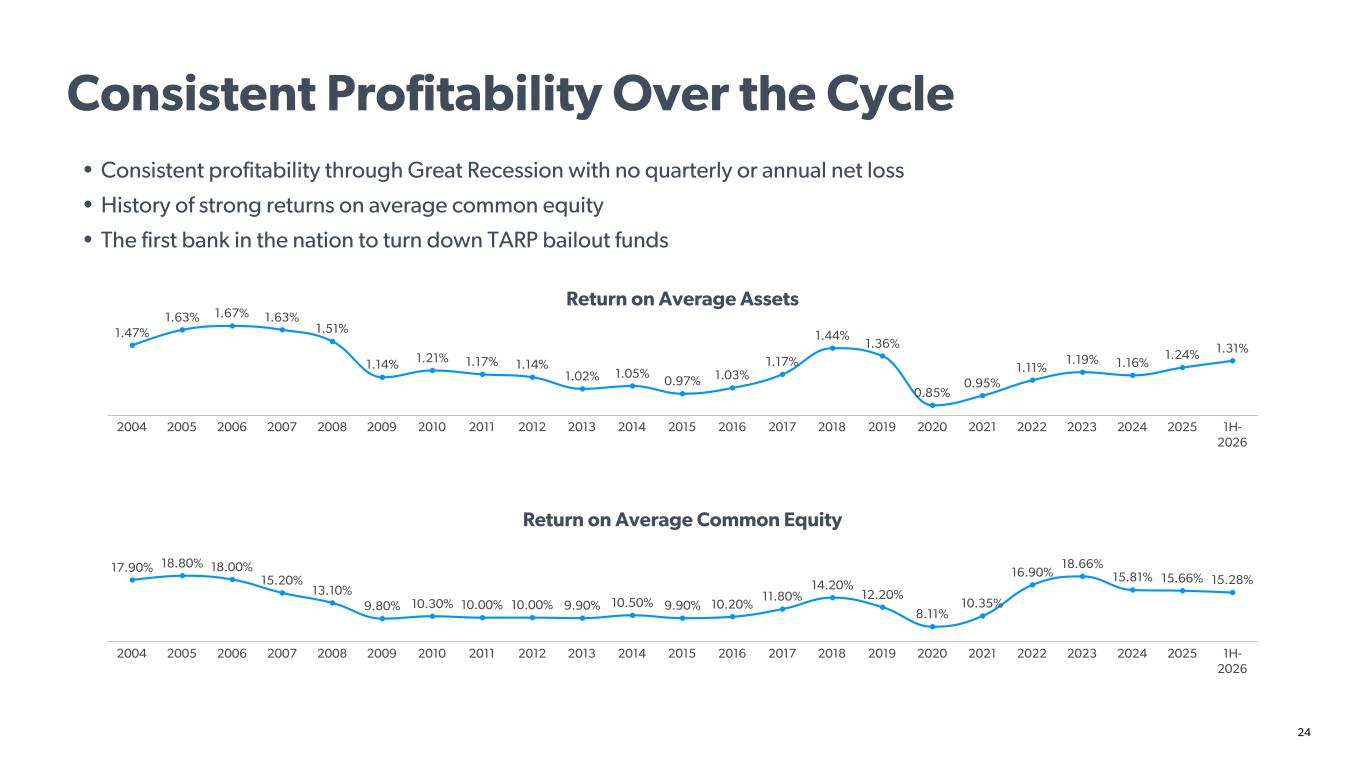
24 • Consistent profitability through Great Recession with no quarterly or annual net loss • History of strong returns on average common equity • The first bank in the nation to turn down TARP bailout funds Return on Average Assets Return on Average Common Equity 1.47% 1.63% 1.67% 1.63% 1.51% 1.14% 1.21% 1.17% 1.14% 1.02% 1.05% 0.97% 1.03% 1.17% 1.44% 1.36% 0.85% 0.95% 1.11% 1.19% 1.16% 1.24% 1.31% 2004 2005 2006 2007 2008 2009 2010 2011 2012 2013 2014 2015 2016 2017 2018 2019 2020 2021 2022 2023 2024 2025 1H- 2026 17.90% 18.80% 18.00% 15.20% 13.10% 9.80% 10.30% 10.00% 10.00% 9.90% 10.50% 9.90% 10.20% 11.80% 14.20% 12.20% 8.11% 10.35% 16.90% 18.66% 15.81% 15.66% 15.28% 2004 2005 2006 2007 2008 2009 2010 2011 2012 2013 2014 2015 2016 2017 2018 2019 2020 2021 2022 2023 2024 2025 1H- 2026 Consistent Profitability Over the Cycle
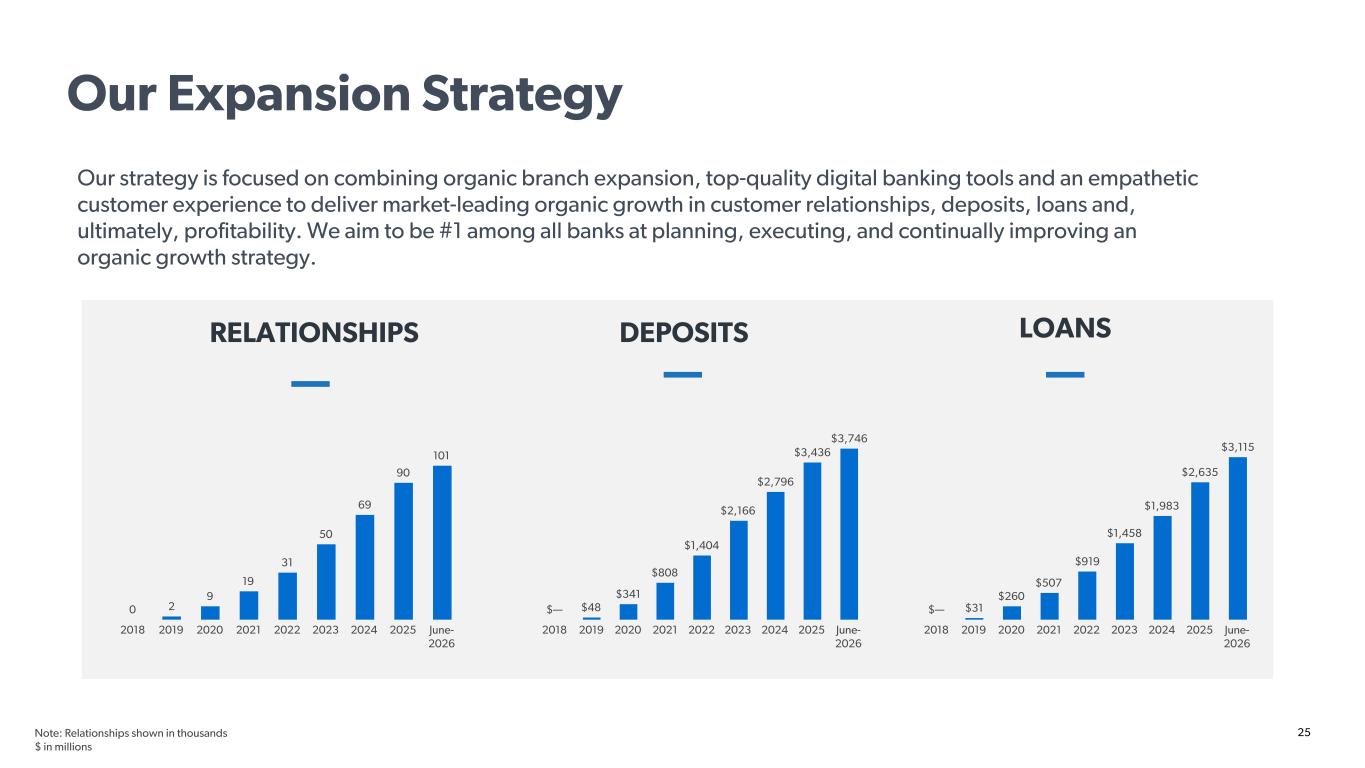
25 Our strategy is focused on combining organic branch expansion, top-quality digital banking tools and an empathetic customer experience to deliver market-leading organic growth in customer relationships, deposits, loans and, ultimately, profitability. We aim to be #1 among all banks at planning, executing, and continually improving an organic growth strategy. RELATIONSHIPS DEPOSITS LOANS $— $31 $260 $507 $919 $1,458 $1,983 $2,635 $3,115 2018 2019 2020 2021 2022 2023 2024 2025 June- 2026 0 2 9 19 31 50 69 90 101 2018 2019 2020 2021 2022 2023 2024 2025 June- 2026 $— $48 $341 $808 $1,404 $2,166 $2,796 $3,436 $3,746 2018 2019 2020 2021 2022 2023 2024 2025 June- 2026 Note: Relationships shown in thousands $ in millions Our Expansion Strategy
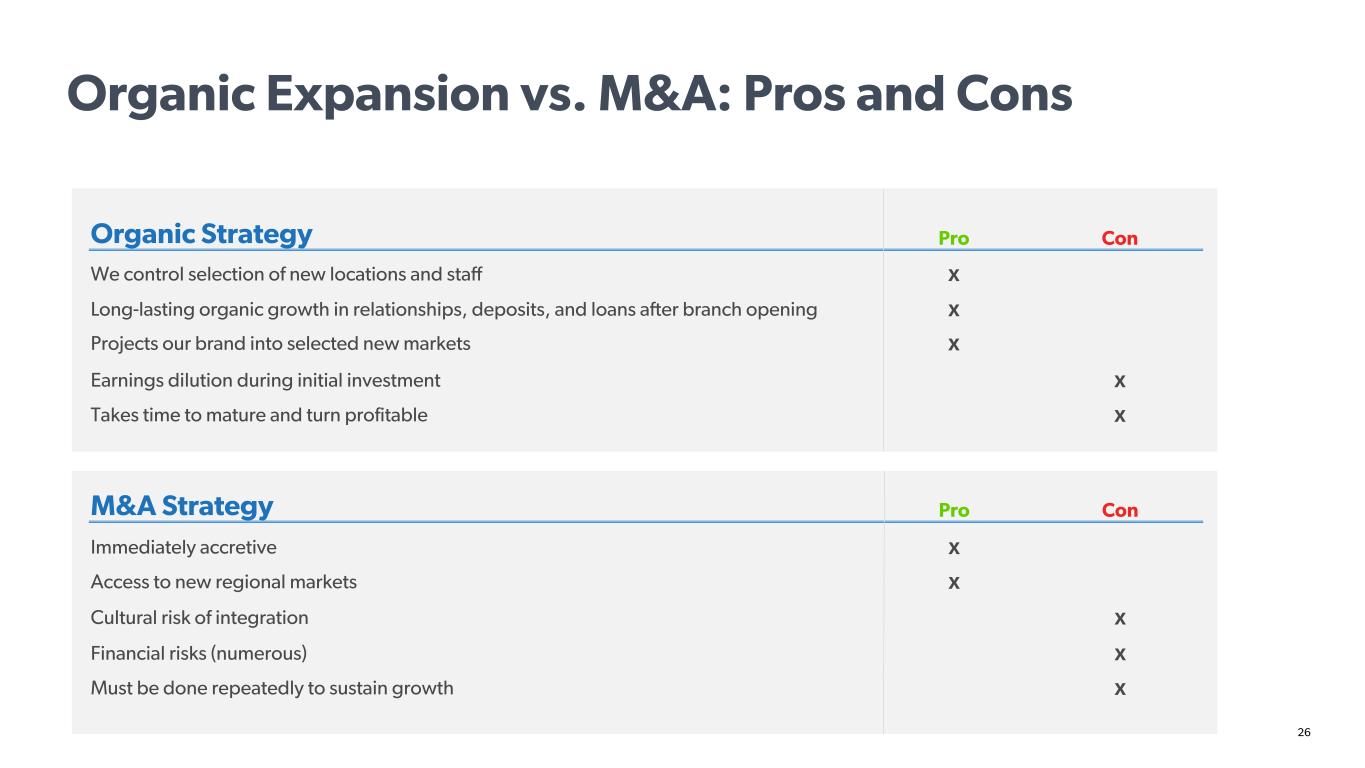
26 Organic Strategy Pro Con We control selection of new locations and staff X Long-lasting organic growth in relationships, deposits, and loans after branch opening X Projects our brand into selected new markets X Earnings dilution during initial investment X Takes time to mature and turn profitable X M&A Strategy Pro Con Immediately accretive X Access to new regional markets X Cultural risk of integration X Financial risks (numerous) X Must be done repeatedly to sustain growth X Organic Expansion vs. M&A: Pros and Cons
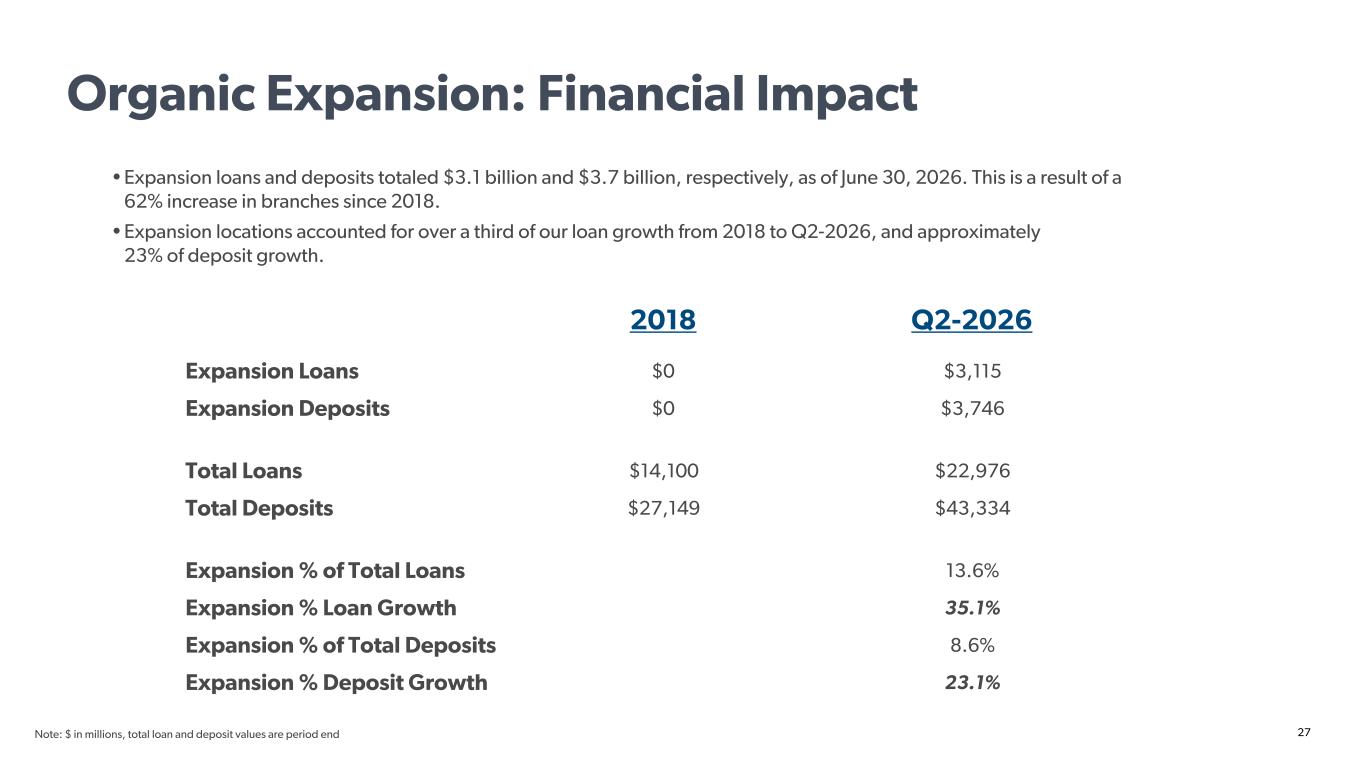
27 2018 Q2-2026 Expansion Loans $0 $3,115 Expansion Deposits $0 $3,746 Total Loans $14,100 $22,976 Total Deposits $27,149 $43,334 Expansion % of Total Loans 13.6% Expansion % Loan Growth 35.1% Expansion % of Total Deposits 8.6% Expansion % Deposit Growth 23.1% Note: $ in millions, total loan and deposit values are period end • Expansion loans and deposits totaled $3.1 billion and $3.7 billion, respectively, as of June 30, 2026. This is a result of a 62% increase in branches since 2018. • Expansion locations accounted for over a third of our loan growth from 2018 to Q2-2026, and approximately 23% of deposit growth. Organic Expansion: Financial Impact
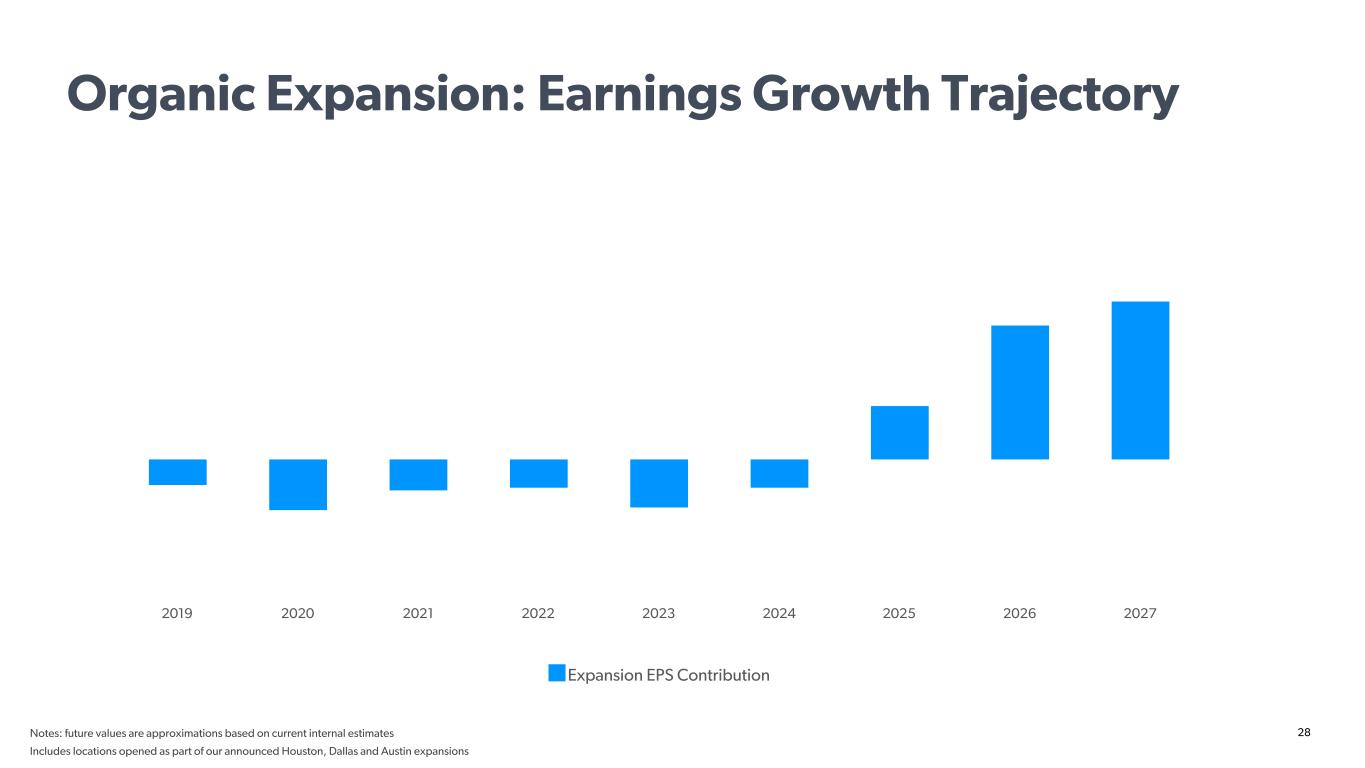
28 Expansion EPS Contribution 2019 2020 2021 2022 2023 2024 2025 2026 2027 Notes: future values are approximations based on current internal estimates Includes locations opened as part of our announced Houston, Dallas and Austin expansions Organic Expansion: Earnings Growth Trajectory
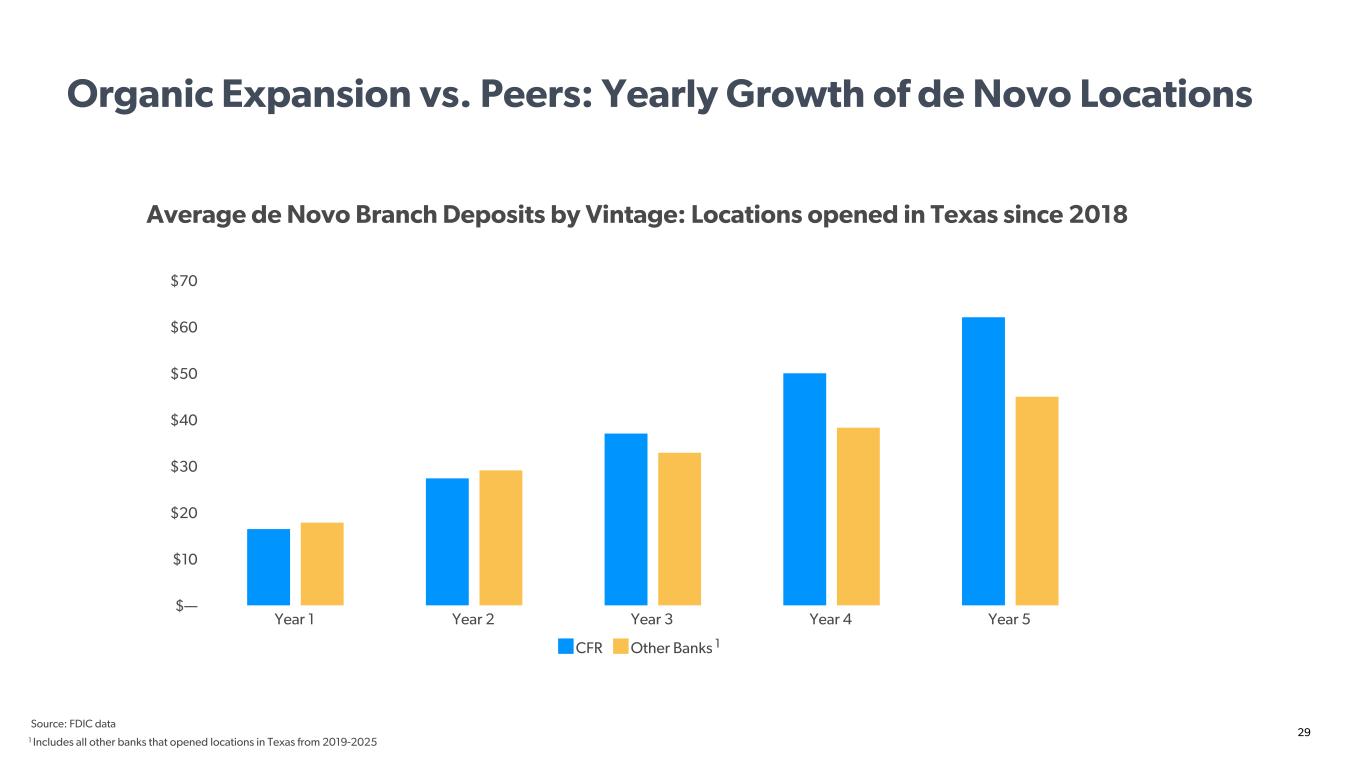
29 1 Includes all other banks that opened locations in Texas from 2019-2025 Average de Novo Branch Deposits by Vintage: Locations opened in Texas since 2018 CFR Other Banks Year 1 Year 2 Year 3 Year 4 Year 5 $— $10 $20 $30 $40 $50 $60 $70 Organic Expansion vs. Peers: Yearly Growth of de Novo Locations Source: FDIC data 1
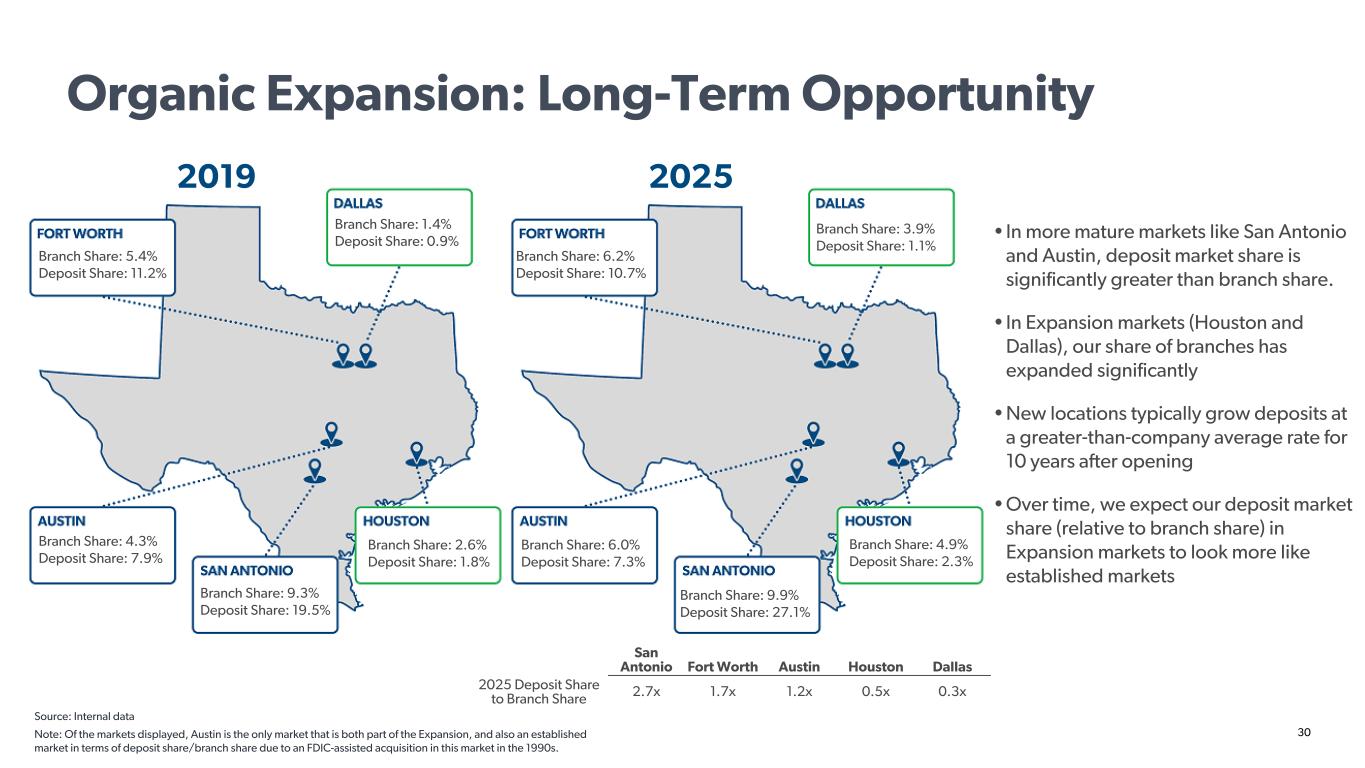
30 Source: Internal data Note: Of the markets displayed, Austin is the only market that is both part of the Expansion, and also an established market in terms of deposit share/branch share due to an FDIC-assisted acquisition in this market in the 1990s. Organic Expansion: Long-Term Opportunity San Antonio Fort Worth Austin Houston Dallas 2025 Deposit Share to Branch Share 2.7x 1.7x 1.2x 0.5x 0.3x 2019 2025 Branch Share: 6.0% Deposit Share: 7.3% Branch Share: 9.9% Deposit Share: 27.1% Branch Share: 1.4% Deposit Share: 0.9% Branch Share: 2.6% Deposit Share: 1.8% Branch Share: 9.3% Deposit Share: 19.5% Branch Share: 4.3% Deposit Share: 7.9% • In more mature markets like San Antonio and Austin, deposit market share is significantly greater than branch share. • In Expansion markets (Houston and Dallas), our share of branches has expanded significantly • New locations typically grow deposits at a greater-than-company average rate for 10 years after opening • Over time, we expect our deposit market share (relative to branch share) in Expansion markets to look more like established markets Branch Share: 5.4% Deposit Share: 11.2% Branch Share: 6.2% Deposit Share: 10.7% Branch Share: 3.9% Deposit Share: 1.1% Branch Share: 4.9% Deposit Share: 2.3%
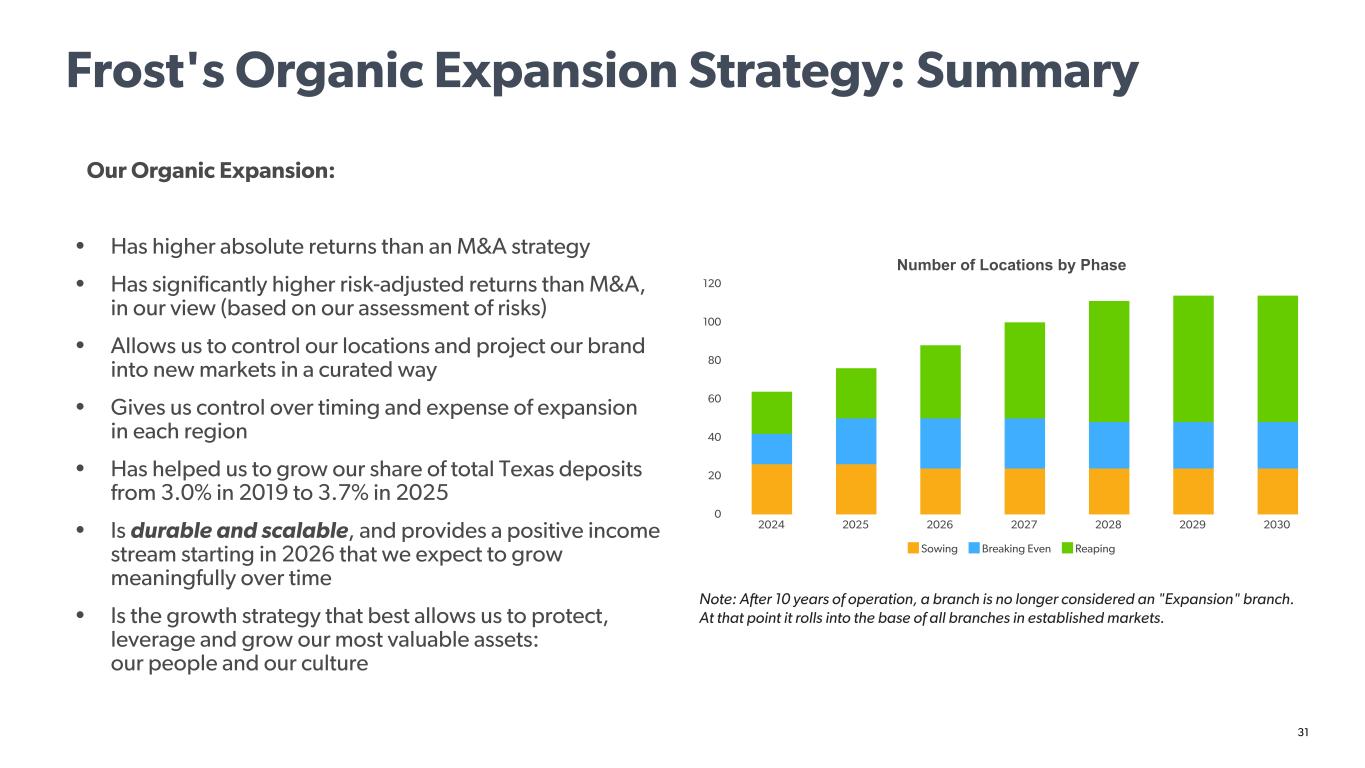
31 Our Organic Expansion: • Has higher absolute returns than an M&A strategy • Has significantly higher risk-adjusted returns than M&A, in our view (based on our assessment of risks) • Allows us to control our locations and project our brand into new markets in a curated way • Gives us control over timing and expense of expansion in each region • Has helped us to grow our share of total Texas deposits from 3.0% in 2019 to 3.7% in 2025 • Is durable and scalable, and provides a positive income stream starting in 2026 that we expect to grow meaningfully over time • Is the growth strategy that best allows us to protect, leverage and grow our most valuable assets: our people and our culture Number of Locations by Phase Sowing Breaking Even Reaping 2024 2025 2026 2027 2028 2029 2030 0 20 40 60 80 100 120 Frost's Organic Expansion Strategy: Summary Note: After 10 years of operation, a branch is no longer considered an "Expansion" branch. At that point it rolls into the base of all branches in established markets.