Pay versus Performance
As required by Section 953(a) of the Dodd-Frank Wall Street Reform and Consumer Protection Act and Item 402(v) of Regulation S-K, we are providing the following information about the relationship between the SEC-defined Compensation Actually Paid (“CAP”) to our NEOs and certain of our financial performance metrics during the fiscal years listed below. The SEC-defined CAP data set forth in the table below does not necessarily reflect amounts actually paid, earned or received by our NEOs, and the metrics are not those that the Compensation Committee uses when setting executive compensation.
The following table sets forth additional compensation information of our principal executive officer (“PEO”) along with total shareholder return and net income for our 2025, 2024 and 2023 fiscal years. The Company appointed Lisa C. Carson as Vice President Finance and Administration in May 2025 and subsequently appointed her as Chief Financial Officer in February 2026. Ms. Carson is considered a non-PEO NEO for fiscal year 2025. The Company appointed Robert M. Infarinato as Chief Financial Officer in August of 2024, and Mr. Infarinato is considered a non-PEO NEO for fiscal years 2025 and 2024. The Company did not have any non-PEO NEOs for the 2023 fiscal year.
|
Year |
Summary Compensation Table Total for PEO (1) |
CAP to PEO (2) |
Average Summary Compensation Table Total for Non-PEO NEOs |
Average CAP to Non-PEO NEOs (3) |
Value of Initial Fixed $100 Investment Based On Total Shareholder Return (4) |
Net Income (Loss) (Thousands) |
||||||||||||||||||
|
2025 |
$ | 1,159,432 | $ | 885,952 | $ | 599,704 | $ | 564,494 | $ | 19.33 | $ | (8,698 | ) | |||||||||||
|
2024 |
$ | 387,019 | $ | 384,546 | $ | 105,206 | $ | 106,566 | $ | 23.25 | $ | (7,150 | ) | |||||||||||
|
2023 |
$ | 437,892 | $ | 379,393 | — | — | $ | 6.33 | $ | (10,826 | ) | |||||||||||||
|
(1) |
Mr. Bitterman, served as the Company’s Interim Executive Chair from September 2022 to February 2023 and was appointed as our President and Chief Executive Officer in February 2023. |
|
(2) |
CAP reflects the following exclusions and inclusions for the PEO in the table above: |
|
Year |
Summary Compensation Table Total |
Minus: Grant Date Fair Value of Stock Awards and Option Awards from Summary Compensation Table |
Plus: Year-end Fair Value of Unvested Equity Awards Granted During Year |
Plus: Year-Over-Year Difference of Year-End Fair Value of Unvested Awards Granted in Prior Years |
Plus: Fair Value at Vest Date for Awards Granted and Vested During Year |
Plus: Year-Over-Year Difference of Year-End Fair Value of Prior Years’ Awards Vested During Year |
Minus: Fair Value at Prior Year-end for Prior Years’ Awards that Fail to Meet Vesting Conditions During Year |
Compensation Actually Paid | ||||||||||||||||||||||||
|
2025 |
$ | 1,159,432 | $ | (580,000 | ) | $ | 262,500 | — | $ | 35,960 | $ | 8,060 | — | $ | 885,952 | |||||||||||||||||
|
2024 |
$ | 387,019 | $ | (43,245 | ) | $ | 43,245 | — | — | $ | (2,473 | ) | — | $ | 384,546 | |||||||||||||||||
|
2023 |
$ | 437,892 | $ | (57,640 | ) | $ | 8,360 | — | — | $ | (9,219 | ) | — | $ | 379,393 | |||||||||||||||||
|
(3) |
Average CAP reflects the following average exclusions and inclusions for the Non-PEO NEOs in the table above: |
|
Year |
Summary Compensation Table Total |
Minus: Grant Date Fair Value of Stock Awards and Option Awards from Summary Compensation Table |
Plus: Year-end Fair Value of Unvested Equity Awards Granted During Year |
Plus: Year-Over-Year Difference of Year-End Fair Value of Unvested Awards Granted in Prior Years |
Plus: Fair Value at Vest Date for Awards Granted and Vested During Year |
Plus: Year-Over-Year Difference of Year-End Fair Value of Prior Years’ Awards Vested During Year |
Minus: Fair Value at Prior Year-end for Prior Years’ Awards that Fail to Meet Vesting Conditions During Year |
Compensation Actually Paid | ||||||||||||||||||||||||
|
2025 |
$ | 599,704 | $ | (109,040 | ) | $ | 49,350 | — | $ | 24,480 | — | — | $ | 564,494 | ||||||||||||||||||
|
2024 |
$ | 105,206 | $ | (29,330 | ) | $ | 30,690 | — | — | — | — | $ | 106,566 | |||||||||||||||||||
|
2023 |
— | — | — | — | — | — | — | — | ||||||||||||||||||||||||
|
(4) |
Total shareholder return as calculated based on a fixed investment of $100 measured from the market close on December 31, 2023 through and including the end of the fiscal year for each year reported in the table. |
|
Year |
Summary Compensation Table Total |
Minus: Grant Date Fair Value of Stock Awards and Option Awards from Summary Compensation Table |
Plus: Year-end Fair Value of Unvested Equity Awards Granted During Year |
Plus: Year-Over-Year Difference of Year-End Fair Value of Unvested Awards Granted in Prior Years |
Plus: Fair Value at Vest Date for Awards Granted and Vested During Year |
Plus: Year-Over-Year Difference of Year-End Fair Value of Prior Years’ Awards Vested During Year |
Minus: Fair Value at Prior Year-end for Prior Years’ Awards that Fail to Meet Vesting Conditions During Year |
Compensation Actually Paid | ||||||||||||||||||||||||
|
2025 |
$ | 1,159,432 | $ | (580,000 | ) | $ | 262,500 | — | $ | 35,960 | $ | 8,060 | — | $ | 885,952 | |||||||||||||||||
|
2024 |
$ | 387,019 | $ | (43,245 | ) | $ | 43,245 | — | — | $ | (2,473 | ) | — | $ | 384,546 | |||||||||||||||||
|
2023 |
$ | 437,892 | $ | (57,640 | ) | $ | 8,360 | — | — | $ | (9,219 | ) | — | $ | 379,393 | |||||||||||||||||
|
(3) |
Average CAP reflects the following average exclusions and inclusions for the Non-PEO NEOs in the table above: |
|
Year |
Summary Compensation Table Total |
Minus: Grant Date Fair Value of Stock Awards and Option Awards from Summary Compensation Table |
Plus: Year-end Fair Value of Unvested Equity Awards Granted During Year |
Plus: Year-Over-Year Difference of Year-End Fair Value of Unvested Awards Granted in Prior Years |
Plus: Fair Value at Vest Date for Awards Granted and Vested During Year |
Plus: Year-Over-Year Difference of Year-End Fair Value of Prior Years’ Awards Vested During Year |
Minus: Fair Value at Prior Year-end for Prior Years’ Awards that Fail to Meet Vesting Conditions During Year |
Compensation Actually Paid | ||||||||||||||||||||||||
|
2025 |
$ | 599,704 | $ | (109,040 | ) | $ | 49,350 | — | $ | 24,480 | — | — | $ | 564,494 | ||||||||||||||||||
|
2024 |
$ | 105,206 | $ | (29,330 | ) | $ | 30,690 | — | — | — | — | $ | 106,566 | |||||||||||||||||||
|
2023 |
— | — | — | — | — | — | — | — | ||||||||||||||||||||||||
|
(4) |
Total shareholder return as calculated based on a fixed investment of $100 measured from the market close on December 31, 2023 through and including the end of the fiscal year for each year reported in the table. |
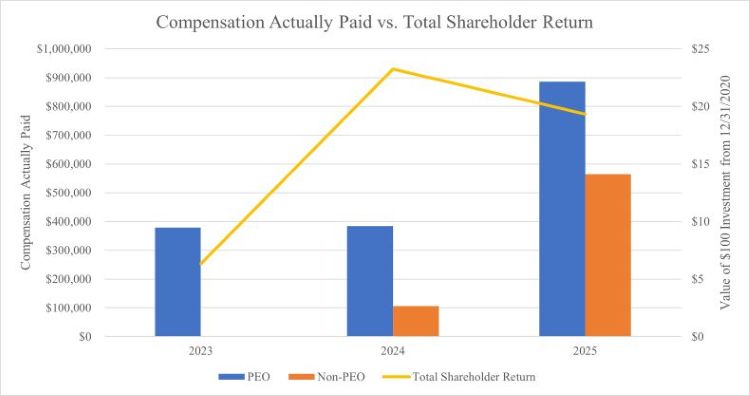
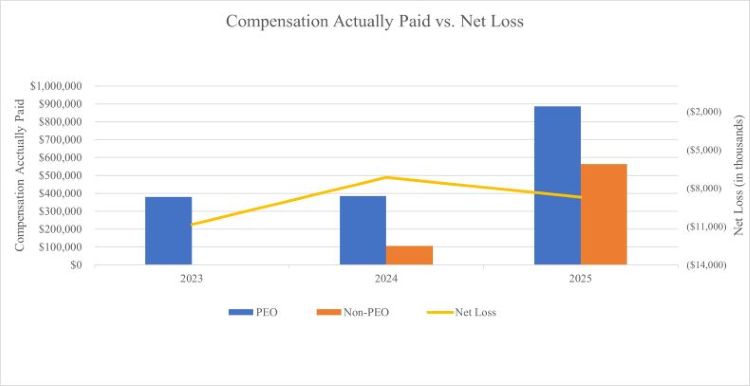
Relationship Between Pay and Performance
The following charts shown below illustrate the relationship of compensation actually paid to our PEO and, for 2023, 2024 and 2025, average compensation actually paid to our Non-PEO NEOs, as set forth in the table above, as compared to: our (1) total shareholder return and (2) net income (loss).