Exhibit IX

Exhibit IX Q2 Report Interim Financial January–June 2026
Exhibit IX
Exhibit IX Q2 Report Interim Financial January–June 2026
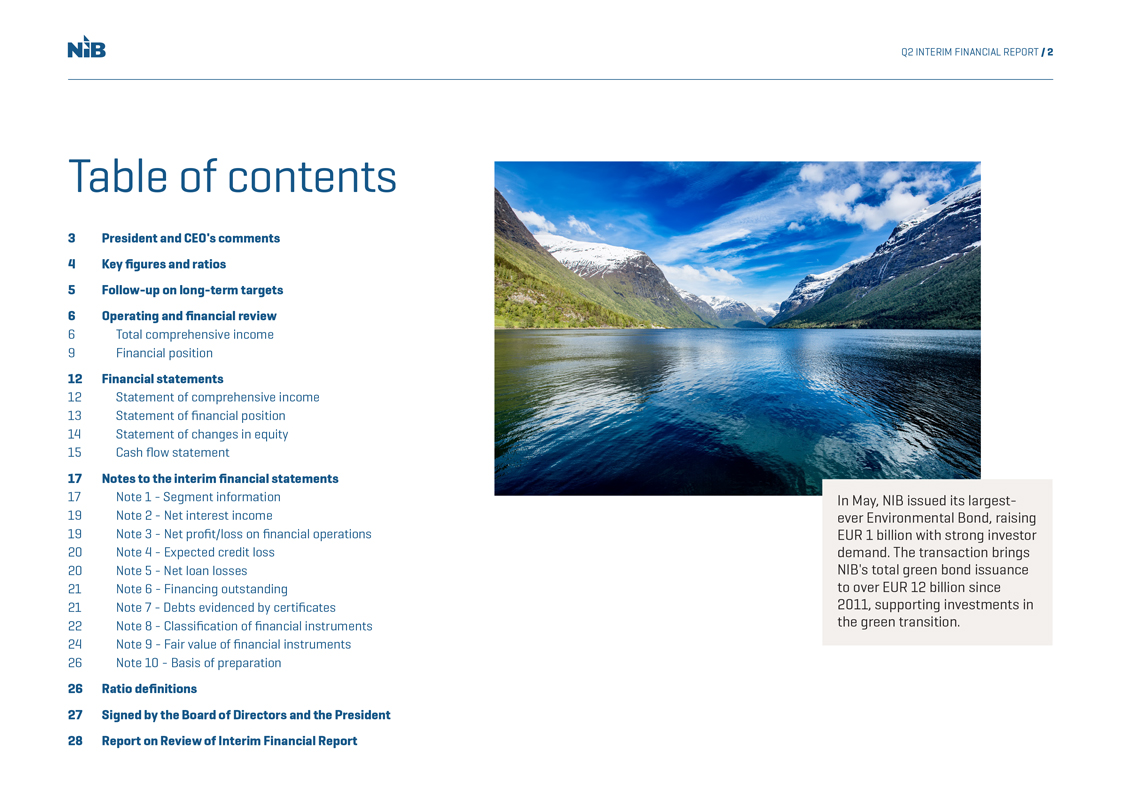
NIB Q2 INTERIM FINANCIAL REPORT / 2 Table of contents 3 President and CEO’s comments 4 Key figures and ratios 5 Follow-up on long-term targets 6 Operating and financial review 6 Total comprehensive income 9 Financial position 12 Financial statements 12 Statement of comprehensive income 13 Statement of financial position 14 Statement of changes in equity 15 Cash flow statement 17 Notes to the interim financial statements 17 Note 1 - Segment information 19 Note 2 - Net interest income 19 Note 3 - Net profit/loss on financial operations 20 Note 4 - Expected credit loss 20 Note 5 - Net loan losses 21 Note 6 - Financing outstanding 21 Note 7 - Debts evidenced by certificates 22 Note 8 - Classification of financial instruments 24 Note 9 - Fair value of financial instruments 26 Note 10 - Basis of preparation 26 Ratio definitions 27 Signed by the Board of Directors and the President 28 Report on Review of Interim Financial Report In May, NIB issued its largest-ever Environmental Bond, raising EUR 1 billion with strong investor demand. The transaction brings NIB’s total green bond issuance to over EUR 12 billion since 2011, supporting investments in the green transition.
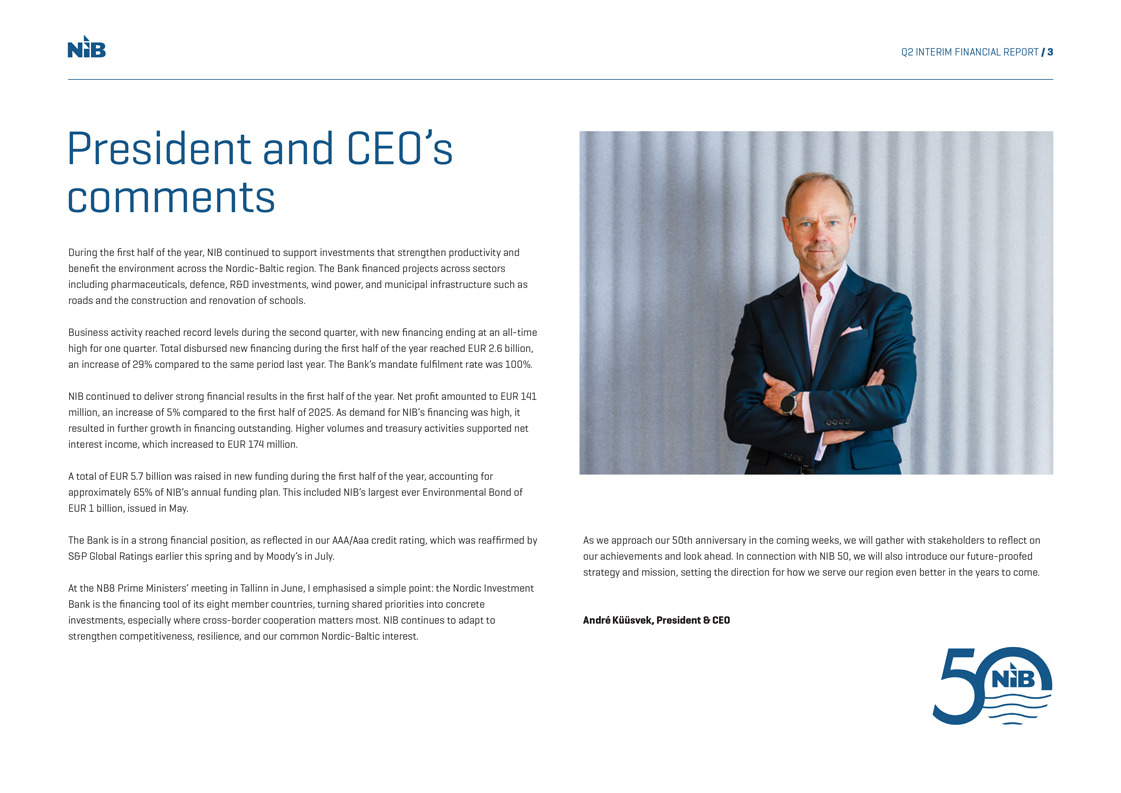
NIB Q2 INTERIM FINANCIAL REPORT / 3 President and CEO’s comments During the first half of the year, NIB continued to support investments that strengthen productivity and benefit the environment across the Nordic-Baltic region. The Bank financed projects across sectors including pharmaceuticals, defence, R&D investments, wind power, and municipal infrastructure such as roads and the construction and renovation of schools. Business activity reached record levels during the second quarter, with new financing ending at an all-time high for one quarter. Total disbursed new financing during the first half of the year reached EUR 2.6 billion, an increase of 29% compared to the same period last year. The Bank’s mandate fulfilment rate was 100%. NIB continued to deliver strong financial results in the first half of the year. Net profit amounted to EUR 141 million, an increase of 5% compared to the first half of 2025. As demand for NIB’s financing was high, it resulted in further growth in financing outstanding. Higher volumes and treasury activities supported net interest income, which increased to EUR 174 million. A total of EUR 5.7 billion was raised in new funding during the first half of the year, accounting for approximately 65% of NIB’s annual funding plan. This included NIB’s largest ever Environmental Bond of EUR 1 billion, issued in May. The Bank is in a strong financial position, as reflected in our AAA/Aaa credit rating, which was reaffirmed by S&P Global Ratings earlier this spring and by Moody’s in July. At the NB8 Prime Ministers’ meeting in Tallinn in June, I emphasised a simple point: the Nordic Investment Bank is the financing tool of its eight member countries, turning shared priorities into concrete investments, especially where cross-border cooperation matters most. NIB continues to adapt to strengthen competitiveness, resilience, and our common Nordic-Baltic interest. As we approach our 50th anniversary in the coming weeks, we will gather with stakeholders to reflect on our achievements and look ahead. In connection with NIB 50, we will also introduce our future-proofed strategy and mission, setting the direction for how we serve our region even better in the years to come. André Küüsvek, President & CEO
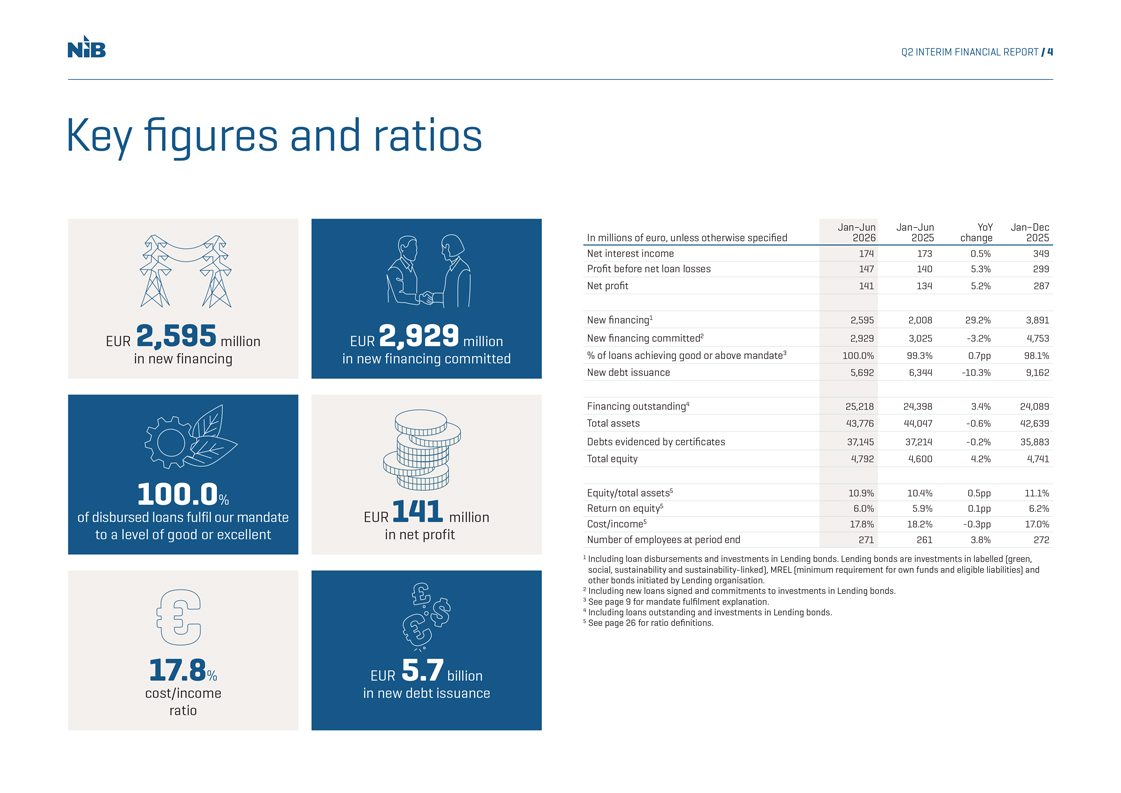
NIB Q2 INTERIM FINANCIAL REPORT / 4 Key figures and ratios EUR 2,595 million in new financing EUR 2,929 million in new financing committed 100.0% of disbursed loans fulfil our mandate to a level of good or excellent EUR 141 million in net profit Jan–Jun Jan–Jun YoY Jan–Dec In millions of euro, unless otherwise specified 20262025 change 2025 Net interest income 1741730.5%349 Profit before net loan losses 1471405.3%299 Net profit 1411345.2%287 2,5952,929 New financing 12,5952,00829.2%3,891 EUR million EUR million New financing committed 22,9293,025-3.2%4,753 in new financing in new financing committed % of loans achieving good or above mandate 3100.0%99.3%0.7pp98.1% New debt issuance 5,6926,344-10.3%9,162 Financing outstanding 425,21824,3983.4%24,089 Total assets 43,77644,047-0.6%42,639 Debts evidenced by certificates 37,14537,214-0.2%35,883 Total equity 4,7924,6004.2%4,741 100.0% Equity/total assets 510.9%10.4%0.5pp11.1% of disbursed loans fulfil our mandate EUR 141 million Return on equity 56.0%5.9%0.1pp6.2% Cost/income 517.8%18.2%-0.3pp17.0% to a level of good or excellent in net profit Number of employees at period end 2712613.8%272 1 Including loan disbursements and investments in Lending bonds. Lending bonds are investments in labelled (green, social, sustainability and sustainability-linked), MREL (minimum requirement for own funds and eligible liabilities) and other bonds initiated by Lending organisation. 2 Including new loans signed and commitments to investments in Lending bonds. 3 See page 9 for mandate fulfilment explanation. 4 Including loans outstanding and investments in Lending bonds. 5 See page 26 for ratio definitions. 17.8% EUR 5.7 billion cost/income in new debt issuance ratio
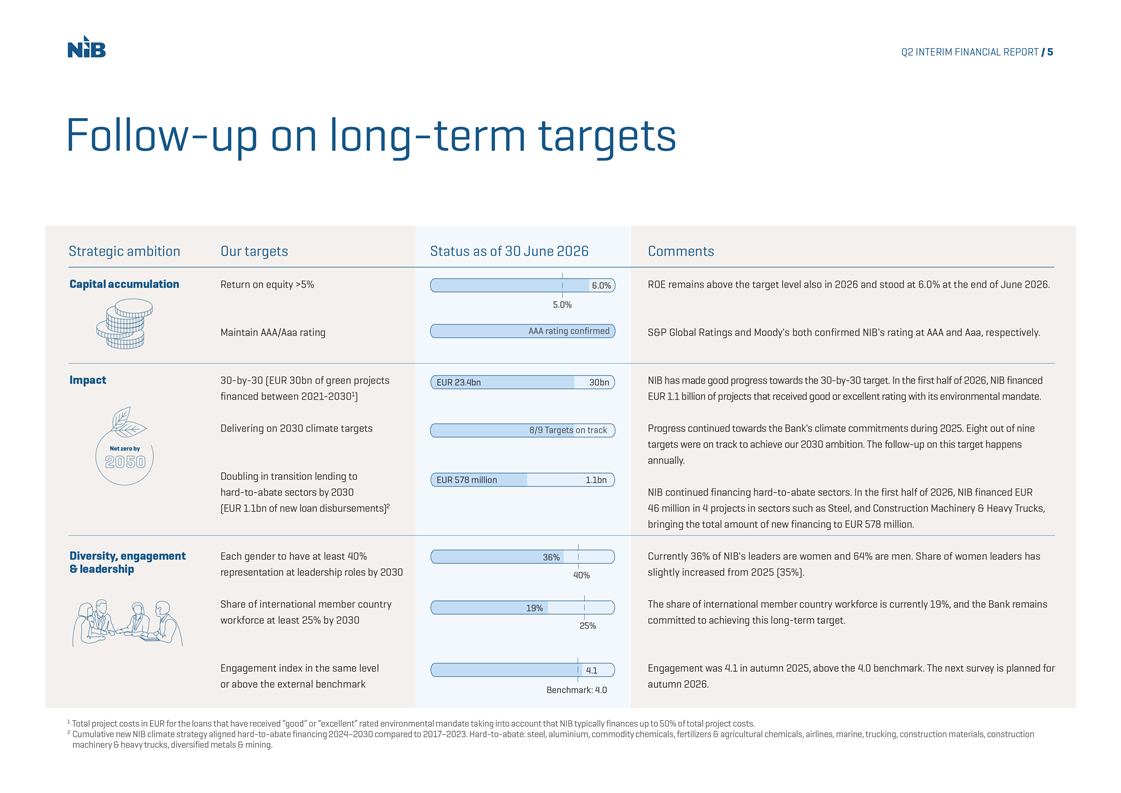
NIB Q2 INTERIM FINANCIAL REPORT / 5 Follow-up on long-term targets Strategic ambition Our targets Status as of 30 June 2026 Capital accumulation Return on equity >5%6.0% 5.0% Maintain AAA/Aaa rating AAA rating confirmed Comments ROE remains above the target level also in 2026 and stood at 6.0% at the end of June 2026. S&P Global Ratings and Moody’s both confirmed NIB’s rating at AAA and Aaa, respectively. Impact 30-by-30 (EUR 30 bn of green projects EUR 23.4 bn 30 bn NIB has made good progress towards the 30-by-30 target. In the first half of 2026, NIB financed financed between 2021-20301) EUR 1.1 billion of projects that received good or excellent rating with its environmental mandate. Delivering on 2030 climate targets 8/9 Targets on track Progress continued towards the Bank’s climate commitments during 2025. Eight out of nine Net zero by 2050 targets were on track to achieve our 2030 ambition. The follow-up on this target happens annually. Doubling in transition lending to EUR 578 million 1.1 bn hard-to-abate sectors by 2030 NIB continued financing hard-to-abate sectors. In the first half of 2026, NIB financed EUR (EUR 1.1 bn of new loan disbursements) 246 million in 4 projects in sectors such as Steel, and Construction Machinery & Heavy Trucks, bringing the total amount of new financing to EUR 578 million. Diversity, engagement Each gender to have at least 40%36% Currently 36% of NIB’s leaders are women and 64% are men. Share of women leaders has & leadership representation at leadership roles by 203040% slightly increased from 2025 (35%). Share of international member country 19% The share of international member country workforce is currently 19%, and the Bank remains workforce at least 25% by 2030 committed to achieving this long-term target. 25% Engagement index in the same level 4.1 Engagement was 4.1 in autumn 2025, above the 4.0 benchmark. The next survey is planned for or above the external bench mark autumn 2026. Benchmark: 4.0 1 Total project costs in EUR for the loans that have received “good” or “excellent” rated environmental mandate taking into account that NIB typically finances up to 50% of total project costs. 2 Cumulative new NIB climate strategy aligned hard-to-abate financing 2024–2030 compared to 2017–2023. Hard-to-abate: steel, aluminium, commodity chemicals, fertilizers & agricultural chemicals, airlines, marine, trucking, construction materials, construction machinery & heavy trucks, diversified metals & mining.
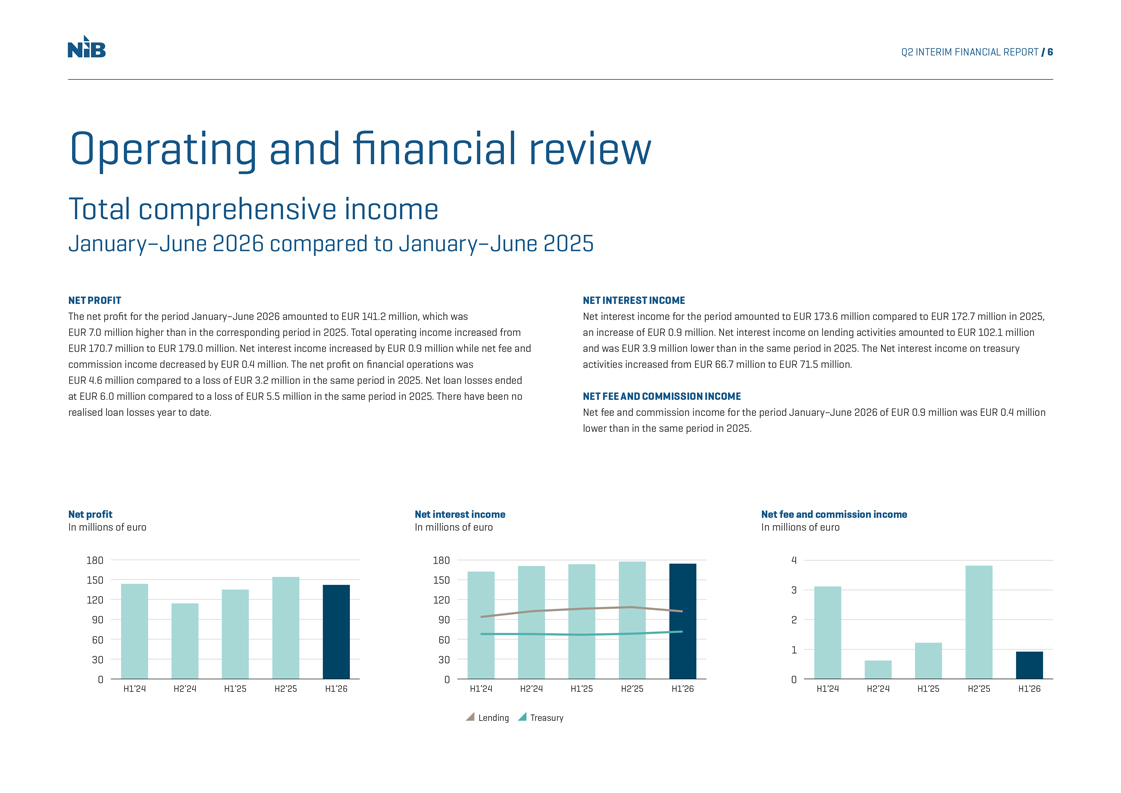
NIB Q2 INTERIM FINANCIAL REPORT / 6 Operating and financial review Total comprehensive income January–June 2026 compared to January–June 2025 NET PROFIT The net profit for the period January–June 2026 amounted to EUR 141.2 million, which was EUR 7.0 million higher than in the corresponding period in 2025. Total operating income increased from EUR 170.7 million to EUR 179.0 million. Net interest income increased by EUR 0.9 million while net fee and commission income decreased by EUR 0.4 million. The net profit on financial operations was EUR 4.6 million compared to a loss of EUR 3.2 million in the same period in 2025. Net loan losses ended at EUR 6.0 million compared to a loss of EUR 5.5 million in the same period in 2025. There have been no realised loan losses year to date. NET INTEREST INCOME Net interest income for the period amounted to EUR 173.6 million compared to EUR 172.7 million in 2025, an increase of EUR 0.9 million. Net interest income on lending activities amounted to EUR 102.1 million and was EUR 3.9 million lower than in the same period in 2025. The Net interest income on treasury activities increased from EUR 66.7 million to EUR 71.5 million. NET FEE AND COMMISSION INCOME Net fee and commission income for the period January–June 2026 of EUR 0.9 million was EUR 0.4 million lower than in the same period in 2025. Net profit Net interest income Net fee and commission income In millions of euro In millions of euro In millions of euro 1801804 150150 3 120120 90902 6060 1 3030 000 H1’24 H2’24 H1’25 H2’25 H1’26 H1’24 H2’24 H1’25 H2’25 H1’26 H1’24 H2’24 H1’25 H2’25 H1’26 Lending Treasury
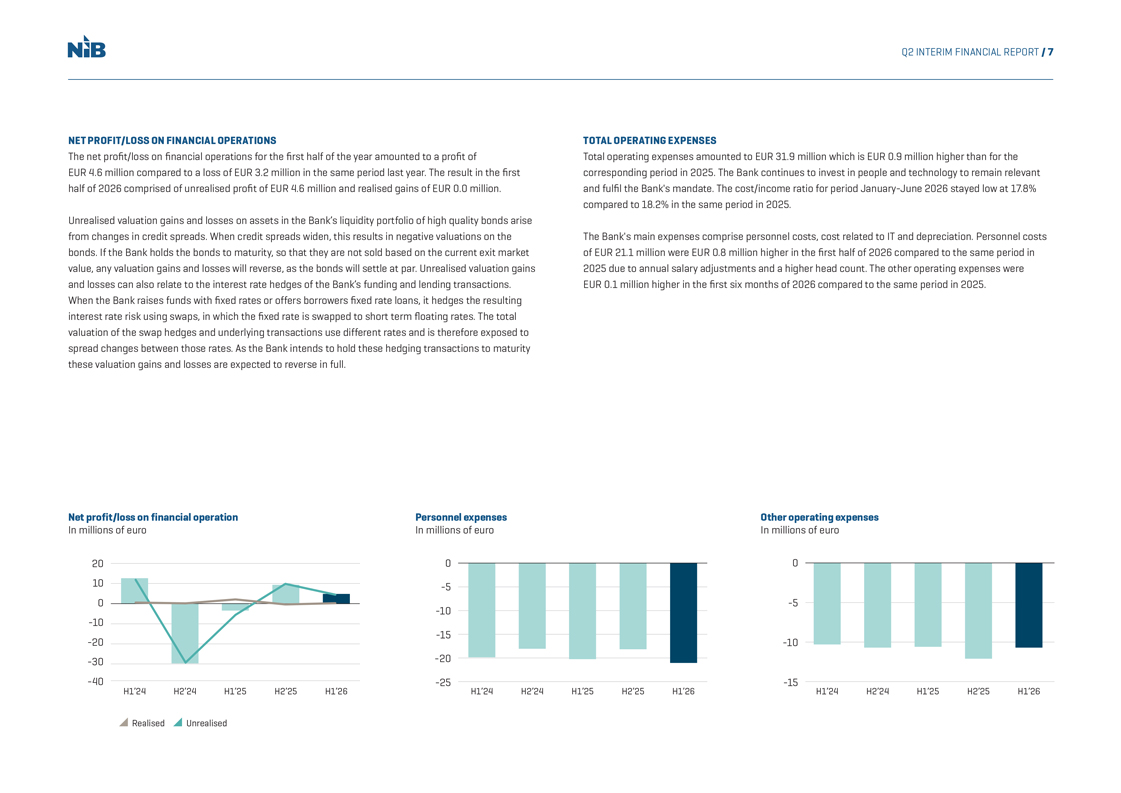
NIB Q2 INTERIM FINANCIAL REPORT / 7 NET PROFIT/LOSS ON FINANCIAL OPERATIONS The net profit/loss on financial operations for the first half of the year amounted to a profit of EUR 4.6 million compared to a loss of EUR 3.2 million in the same period last year. The result in the first half of 2026 comprised of unrealised profit of EUR 4.6 million and realised gains of EUR 0.0 million. Unrealised valuation gains and losses on assets in the Bank’s liquidity portfolio of high quality bonds arise from changes in credit spreads. When credit spreads widen, this results in negative valuations on the bonds. If the Bank holds the bonds to maturity, so that they are not sold based on the current exit market value, any valuation gains and losses will reverse, as the bonds will settle at par. Unrealised valuation gains and losses can also relate to the interest rate hedges of the Bank’s funding and lending transactions. When the Bank raises funds with fixed rates or offers borrowers fixed rate loans, it hedges the resulting interest rate risk using swaps, in which the fixed rate is swapped to short term floating rates. The total valuation of the swap hedges and underlying transactions use different rates and is therefore exposed to spread changes between those rates. As the Bank intends to hold these hedging transactions to maturity these valuation gains and losses are expected to reverse in full. Net profit/loss on financial operation In millions of euro Personnel expenses In millions of euro TOTAL OPERATING EXPENSES Total operating expenses amounted to EUR 31.9 million which is EUR 0.9 million higher than for the corresponding period in 2025. The Bank continues to invest in people and technology to remain relevant and fulfil the Bank’s mandate. The cost/income ratio for period January-June 2026 stayed low at 17.8% compared to 18.2% in the same period in 2025. The Bank’s main expenses comprise personnel costs, cost related to IT and depreciation. Personnel costs of EUR 21.1 million were EUR 0.8 million higher in the first half of 2026 compared to the same period in 2025 due to annual salary adjustments and a higher head count. The other operating expenses were EUR 0.1 million higher in the first six months of 2026 compared to the same period in 2025. Net profit/loss on financial operation In millions of euro Personnel expenses Other operating expenses In millions of euro 20 00 10-5 0-5 -10 -10 -15 -20-10 -30-20 -40-25-15 H1’24 H2’24 H1’25 H2’25 H1’26 H1’24 H2’24 H1’25 H2’25 H1’26 H1’24 H2’24 H1’25 H2’25 H1’26 Realised Unrealised
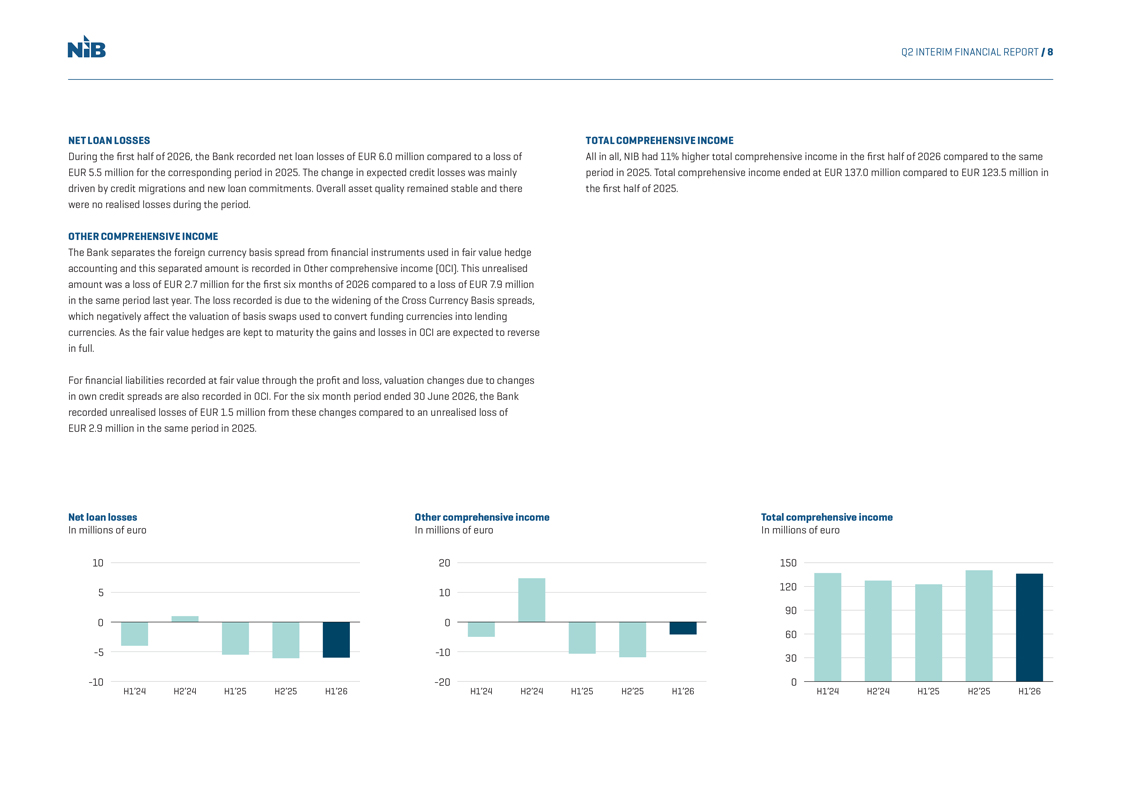
NIB Q2 INTERIM FINANCIAL REPORT / 8 NET LOAN LOSSES During the first half of 2026, the Bank recorded net loan losses of EUR 6.0 million compared to a loss of EUR 5.5 million for the corresponding period in 2025. The change in expected credit losses was mainly driven by credit migrations and new loan commitments. Overall asset quality remained stable and there were no realised losses during the period. OTHER COMPREHENSIVE INCOME The Bank separates the foreign currency basis spread from financial instruments used in fair value hedge accounting and this separated amount is recorded in Other comprehensive income (OCI). This unrealised amount was a loss of EUR 2.7 million for the first six months of 2026 compared to a loss of EUR 7.9 million in the same period last year. The loss recorded is due to the widening of the Cross Currency Basis spreads, which negatively affect the valuation of basis swaps used to convert funding currencies into lending currencies. As the fair value hedges are kept to maturity the gains and losses in OCI are expected to reverse in full. For financial liabilities recorded at fair value through the profit and loss, valuation changes due to changes in own credit spreads are also recorded in OCI. For the six month period ended 30 June 2026, the Bank recorded unrealised losses of EUR 1.5 million from these changes compared to an unrealised loss of EUR 2.9 million in the same period in 2025. TOTAL COMPREHENSIVE INCOME All in all, NIB had 11% higher total comprehensive income in the first half of 2026 compared to the same period in 2025. Total comprehensive income ended at EUR 137.0 million compared to EUR 123.5 million in the first half of 2025. Net loan losses Other comprehensive income Total comprehensive income In millions of euro In millions of euro In millions of euro 10 20 150 5 10 120 90 0 0 60 -5-10 30 -10-20 0 H1’24 H2’24 H1’25 H2’25 H1’26 H1’24 H2’24 H1’25 H2’25 H1’26 H1’24 H2’24 H1’25 H2’25 H1’26
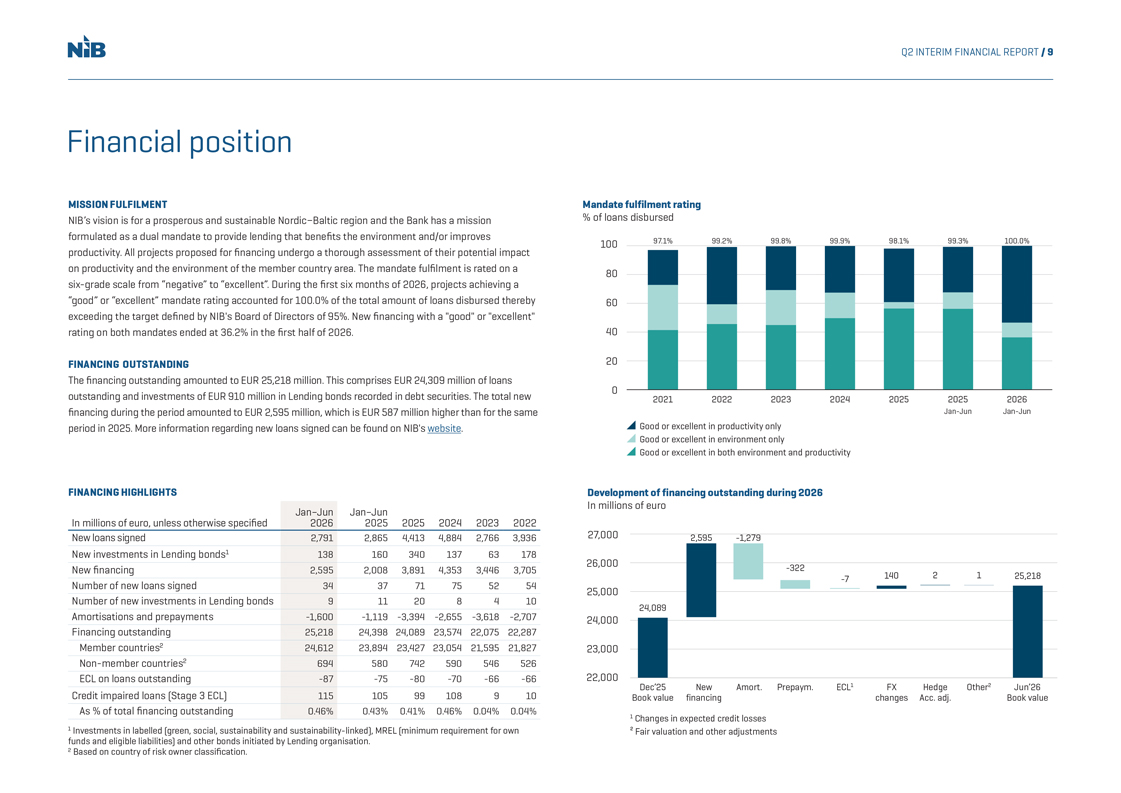
NIB Q2 INTERIM FINANCIAL REPORT / 9 Financial position MISSION FULFILMENT NIB’s vision is for a prosperous and sustainable Nordic-Baltic region and the Bank has a mission formulated as a dual mandate to provide lending that benefits the environment and/or improves productivity. All projects proposed for financing undergo a thorough assessment of their potential impact on productivity and the environment of the member country area. The mandate fulfilment is rated on a six-grade scale from “negative” to “excellent”. During the first six months of 2026, projects achieving a “good” or “excellent” mandate rating accounted for 100.0% of the total amount of loans disbursed thereby exceeding the target defined by NIB’s Board of Directors of 95%. New financing with a “good” or “excellent” rating on both mandates ended at 36.2% in the first half of 2026. FINANCING OUTSTANDING The financing outstanding amounted to EUR 25,218 million. This comprises EUR 24,309 million of loans outstanding and investments of EUR 910 million in Lending bonds recorded in debt securities. The total new financing during the period amounted to EUR 2,595 million, which is EUR 587 million higher than for the same period in 2025. More information regarding new loans signed can be found on NIB’s website. FINANCING HIGHLIGHTS Jan–Jun Jan–Jun In millions of euro, unless otherwise specified 202620252025202420232022 New loans signed 2,7912,8654,4134,8842,7663,936 New investments in Lending bonds 113816034013763178 New financing 2,5952,0083,8914,3533,4463,705 Number of new loans signed 343771755254 Number of new investments in Lending bonds 911208410 Amortisations and prepayments -1,600-1,119-3,394-2,655-3,618-2,707 Financing outstanding 25,21824,39824,08923,57422,07522,287 Member countries 224,61223,89423,42723,05421,59521,827 Non-member countries 2694580742590546526 ECL on loans outstanding -87-75-80-70-66-66 Credit impaired loans (Stage 3 ECL) 11510599108910 As % of total financing outstanding 0.46%0.43%0.41%0.46%0.04%0.04% 1 Investments in labelled (green, social, sustainability and sustainability-linked), MREL (minimum requirement for own funds and eligible liabilities) and other bonds initiated by Lending organisation. 2 Based on country of risk owner classification. Mandate fulfilment rating % of loans disbursed 10097.1%99.2%99.8%99.9%98.1%99.3%100.0% 80 60 40 20 0 2021202220232024202520252026 Jan-Jun Jan-Jun ...11111 Good or excellent in productivity only ...11111 Good or excellent in environment only ...11111Good or excellent in both environment and productivity Development of financing outstanding during 2026 In millions of euro 27,0002,595-1,279 26,000322 -71402125,218 25,000- 24,089 24,000 23,000 22,000 Dec’25 NewAmort. Prepaym. ECL1FX Hedge Other2 Jun’26 Book value financing changes Acc. adj. Book value 1 Changes in expected credit losses ² Fair valuation and other adjustments
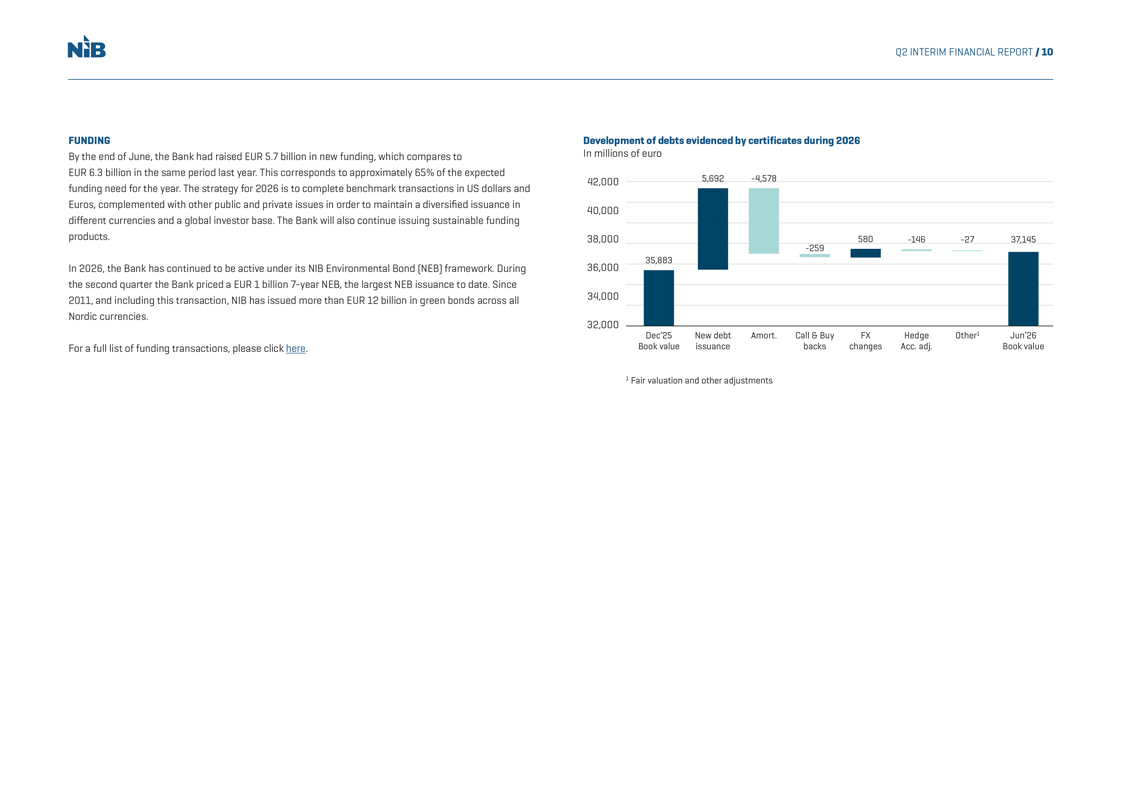
NIB Q2 INTERIM FINANCIAL REPORT / 10 FUNDING By the end of June, the Bank had raised EUR 5.7 billion in new funding, which compares to EUR 6.3 billion in the same period last year. This corresponds to approximately 65% of the expected funding need for the year. The strategy for 2026 is to complete benchmark transactions in US dollars and Euros, complemented with other public and private issues in order to maintain a diversified issuance in different currencies and a global investor base. The Bank will also continue issuing sustainable funding products. In 2026, the Bank has continued to be active under its NIB Environmental Bond (NEB) framework. During the second quarter the Bank priced a EUR 1 billion 7-year NEB, the largest NEB issuance to date. Since 2011, and including this transaction, NIB has issued more than EUR 12 billion in green bonds across all Nordic currencies. For a full list of funding transactions, please click here. Development of debts evidenced by certificates during 2026 In millions of euro 42,000 5,692-4,578 40,000 38,000580-146-2737,145 -259-- 35,883 36,000 34,000 32,000 Dec’25 New debt Amort. Call & Buy FX Hedge Other1 Jun’26 Book value issuance backs changes Acc. adj. Book value 1 Fair valuation and other adjustments
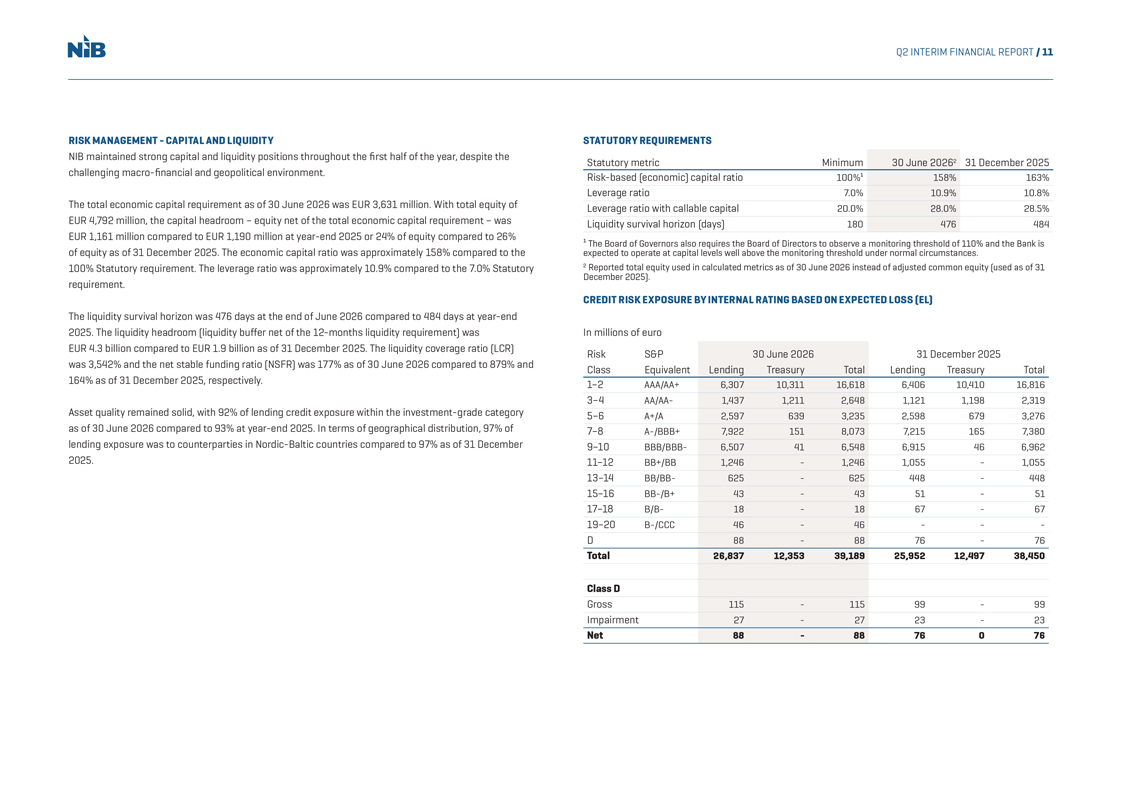
NIB Q2 INTERIM FINANCIAL REPORT / 11 RISK MANAGEMENT—CAPITAL AND LIQUIDITY NIB maintained strong capital and liquidity positions throughout the first half of the year, despite the challenging macro-financial and geopolitical environment. The total economic capital requirement as of 30 June 2026 was EUR 3,631 million. With total equity of EUR 4,792 million, the capital headroom – equity net of the total economic capital requirement – was EUR 1,161 million compared to EUR 1,190 million at year-end 2025 or 24% of equity compared to 26% of equity as of 31 December 2025. The economic capital ratio was approximately 158% compared to the 100% Statutory requirement. The leverage ratio was approximately 10.9% compared to the 7.0% Statutory requirement. The liquidity survival horizon was 476 days at the end of June 2026 compared to 484 days at year-end 2025. The liquidity headroom (liquidity buffer net of the 12-months liquidity requirement) was EUR 4.3 billion compared to EUR 1.9 billion as of 31 December 2025. The liquidity coverage ratio (LCR) was 3,542% and the net stable funding ratio (NSFR) was 177% as of 30 June 2026 compared to 879% and 164% as of 31 December 2025, respectively. Asset quality remained solid, with 92% of lending credit exposure within the investment-grade category as of 30 June 2026 compared to 93% at year-end 2025. In terms of geographical distribution, 97% of lending exposure was to counterparties in Nordic-Baltic countries compared to 97% as of 31 December 2025. STATUTORY REQUIREMENTS Statutory metricMinimum30 June 2026231 December 2025 Risk-based (economic) capital ratio100%¹158%163% Leverage ratio7.0%10.9%10.8% Leverage ratio with callable capital20.0%28.0%28.5% Liquidity survival horizon (days)180476484 ¹ expected The Board to of operate Governors at capital also requires levels well the above Board the of monitoring Directors to threshold observe a under monitoring normal threshold circumstances of 110% . and the Bank is 2 Reported total equity used in calculated metrics as of 30 June 2026 instead of adjusted common equity (used as of 31 December 2025). CREDIT RISK EXPOSURE BY INTERNAL RATING BASED ON EXPECTED LOSS (EL) In millions of euro RiskS&P30 June 202631 December 2025 ClassEquivalentLendingTreasuryTotalLendingTreasuryTotal 1–2AAA/AA+6,30710,31116,6186,40610,41016,816 3–4AA/AA-1,4371,2112,6481,1211,1982,319 5–6A+/A2,5976393,2352,5986793,276 7–8A-/BBB+7,9221518,0737,2151657,380 9–10BBB/BBB-6,507416,5486,915466,962 11–12BB+/BB1,246-1,2461,055-1,055 13–14BB/BB-625-625448-448 15–16BB-/B+43-4351-51 17–18B/B-18-1867-67 19–20B-/CCC46-46--- D88-8876-76 Total26,83712,35339,18925,95212,49738,450 Class D Gross115-11599-99 Impairment27-2723-23 Net88-8876076
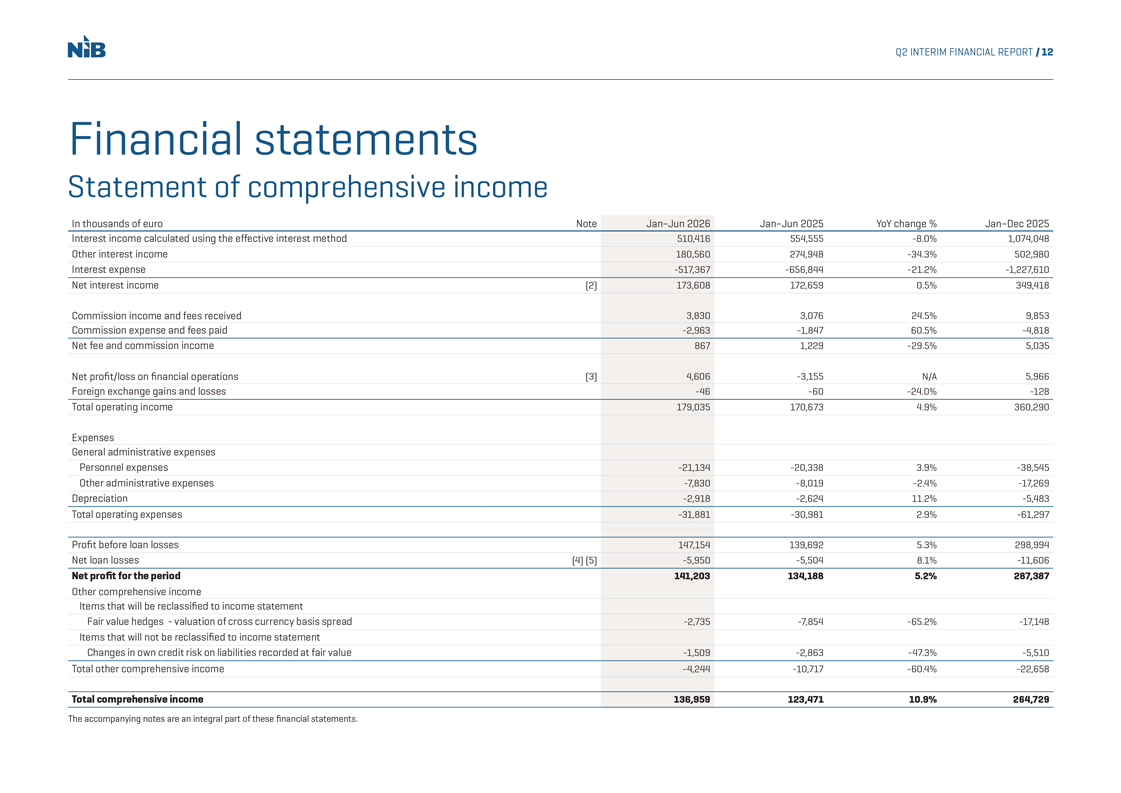
NIB Q2 INTERIM FINANCIAL REPORT / 12 Financial statements Statement of comprehensive income In thousands of euroNoteJan–Jun 2026Jan–Jun 2025YoY change %Jan–Dec 2025 Interest income calculated using the effective interest method510,416554,555-8.0%1,074,048 Other interest income180,560274,948-34.3%502,980 Interest expense-517,367-656,844-21.2%-1,227,610 Net interest income(2)173,608172,6590.5%349,418 Commission income and fees received3,8303,07624.5%9,853 Commission expense and fees paid-2,963-1,84760.5%-4,818 Net fee and commission income8671,229-29.5%5,035 Net profit/loss on financial operations(3)4,606-3,155N/A5,966 Foreign exchange gains and losses-46-60-24.0%-128 Total operating income179,035170,6734.9%360,290 Expenses General administrative expenses Personnel expenses-21,134-20,3383.9%-38,545 Other administrative expenses-7,830-8,019-2.4%-17,269 Depreciation-2,918-2,62411.2%-5,483 Total operating expenses-31,881-30,9812.9%-61,297 Profit before loan losses147,154139,6925.3%298,994 Net loan losses(4) (5)-5,950-5,5048.1%-11,606 Net profit for the period141,203134,1885.2%287,387 Other comprehensive income Items that will be reclassified to income statement Fair value hedges - valuation of cross currency basis spread-2,735-7,854-65.2%-17,148 Items that will not be reclassified to income statement Changes in own credit risk on liabilities recorded at fair value-1,509-2,863-47.3%-5,510 Total other comprehensive income-4,244-10,717-60.4%-22,658 Total comprehensive income136,959123,47110.9%264,729 The accompanying notes are an integral part of these financial statements.
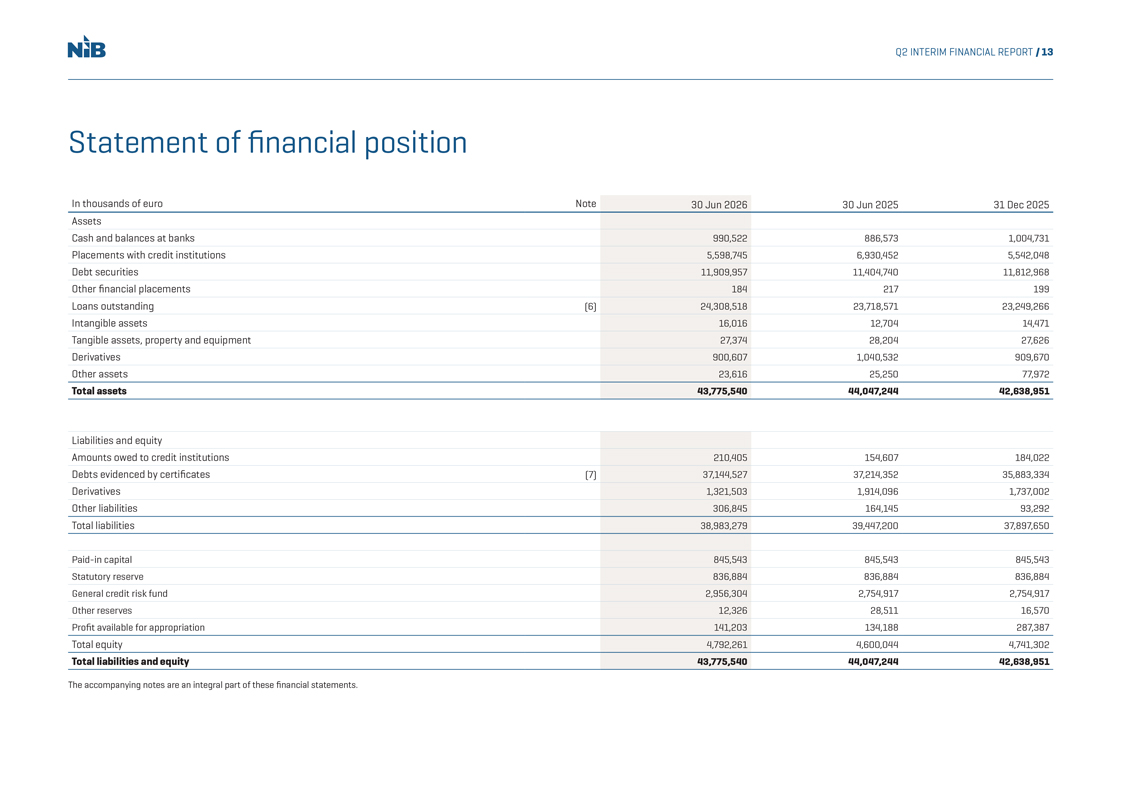
N1B Q2 INTERIM FINANCIAL REPORT / 13 Statement of financial position In thousands of euro Note 30 Jun 2026 30 Jun 2025 31 Dec 2025 Assets Cash and balances at banks 990,522 886,573 1,004,731 Placements with credit institutions 5,598,745 6,930,452 5,542,048 Debt securities 11,909,957 11,404,740 11,812,968 Other financial placements 184 217 199 Loans outstanding (6) 24,308,518 23,718,571 23,249,266 Intangible assets 16,016 12,704 14,471 Tangible assets, property and equipment 27,374 28,204 27,626 Derivatives 900,607 1,040,532 909,670 Other assets 23,616 25,250 77,972 Total assets 43,775,540 44,047,244 42,638,951 Liabilities and equity Amounts owed to credit institutions 210,405 154,607 184,022 Debts evidenced by certificates (7) 37,144,527 37,214,352 35,883,334 Derivatives 1,321,503 1,914,096 1,737,002 Other liabilities 306,845 164,145 93,292 Total liabilities 38,983,279 39,447,200 37,897,650 Paid-in capital 845,543 845,543 845,543 Statutory reserve 836,884 836,884 836,884 General credit risk fund 2,956,304 2,754,917 2,754,917 Other reserves 12,326 28,511 16,570 Profit available for appropriation 141,203 134,188 287,387 Total equity 4,792,261 4,600,044 4,741,302 Total liabilities and equity 43,775,540 44,047,244 42,638,951 The accompanying notes are an integral part of these financial statements.
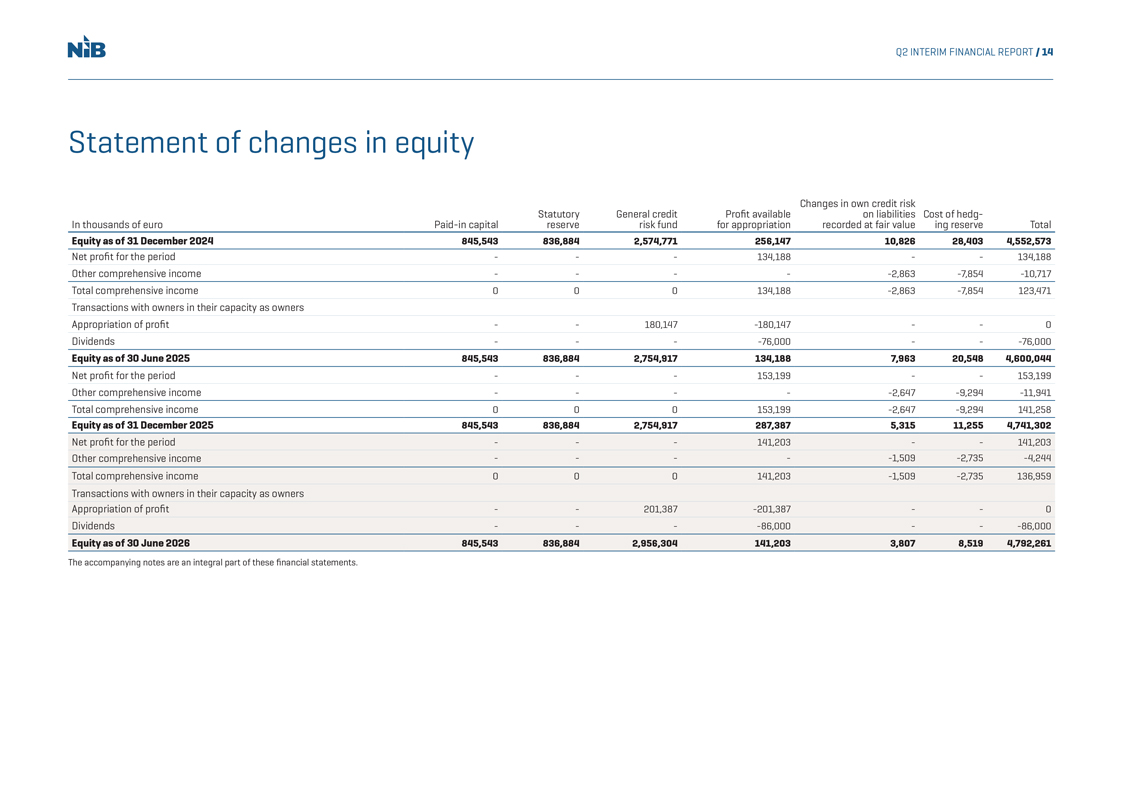
N1B Q2 INTERIM FINANCIAL REPORT / 14 Statement of changes in equity Changes in own credit risk Statutory General credit Profit available on liabilities Cost of hedg- ing reserve In thousands of euro Paid-in capital reserve risk fund for appropriation recorded at fair value Total Equity as of 31 December 2024 845,543 836,884 2,574,771 256,147 10,826 28,403 4,552,573 Net profit for the period - - -134,188 - - 134,188 Other comprehensive income - - - - -2,863 -7,854 -10,717 Total comprehensive income 0 0 0 134,188 -2,863 -7,854 123,471 Transactions with owners in their capacity as owners Appropriation of profit - - 180,147 -180,147 - - 0 Dividends - - - -76,000 - - -76,000 Equity as of 30 June 2025 845,543 836,884 2,754,917 134,188 7,963 20,548 4,600,044 Net profit for the period - - - 153,199 - - 153,199 Other comprehensive income - - - - -2,647 -9,294 -11,941 Total comprehensive income 0 0 0 153,199 -2,647- 9,294 141,258 Equity as of 31 December 2025 845,543 836,884 2,754,917 287,387 5,315 11,255 4,741,302 Net profit for the period - - - 141,203 - - 141,203 Other comprehensive income - - - - -1,509 -2,735 -4,244 Total comprehensive income 0 0 0 141,203 -1,509 -2,735 136,959 Transactions with owners in their capacity as owners Appropriation of profit - - 201,387 -201,387--0 Dividends - - - -86,000 - - -86,000 Equity as of 30 June 2026 845,543 836,884 2,956,304 141,203 3,807 8,519 4,792,261 The accompanying notes are an integral part of these financial statements.
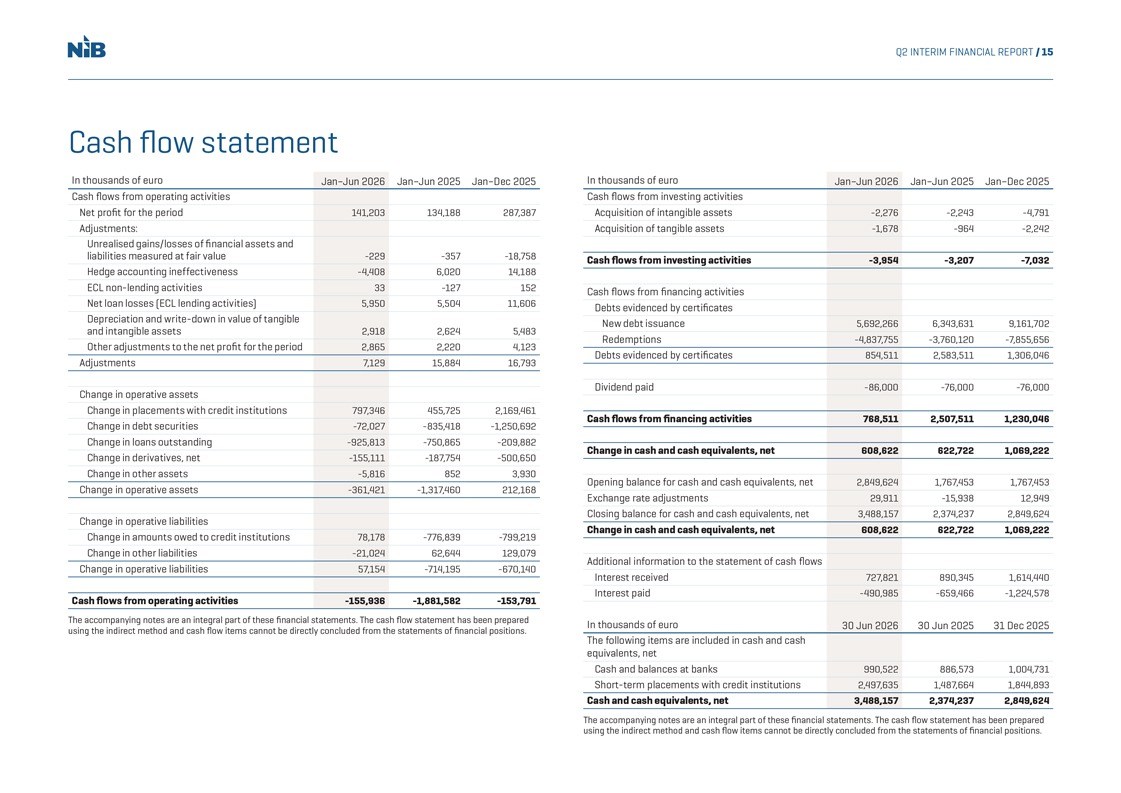
N1B Q2 INTERIM FINANCIAL REPORT / 15 Cash flow statement In thousands of euroJan–Jun 2026Jan–Jun 2025Jan–Dec 2025 Cash flows from operating activities Net profit for the period141,203134,188287,387 Adjustments: Unrealised gains/losses of financial assets and liabilities measured at fair value-229-357-18,758 Hedge accounting ineffectiveness-4,4086,02014,188 ECL non-lending activities33-127152 Net loan losses (ECL lending activities)5,9505,50411,606 Depreciation and write-down in value of tangible and intangible assets2,9182,6245,483 Other adjustments to the net profit for the period2,8652,2204,123 Adjustments7,12915,88416,793 Change in operative assets Change in placements with credit institutions797,346455,7252,169,461 Change in debt securities-72,027-835,418-1,250,692 Change in loans outstanding-925,813-750,865-209,882 Change in derivatives, net-155,111-187,754-500,650 Change in other assets-5,8168523,930 Change in operative assets-361,421-1,317,460212,168 Change in operative liabilities Change in amounts owed to credit institutions78,178-776,839-799,219 Change in other liabilities-21,02462,644129,079 Change in operative liabilities57,154-714,195-670,140 Cash flows from operating activities-155,936-1,881,582-153,791 The accompanying notes are an integral part of these financial statements. The cash flow statement has been prepared using the indirect method and cash flow items cannot be directly concluded from the statements of financial positions. In thousands of euroJan–Jun 2026Jan–Jun 2025Jan–Dec 2025 Cash flows from investing activities Acquisition of intangible assets-2,276-2,243-4,791 Acquisition of tangible assets-1,678-964-2,242 Cash flows from investing activities-3,954-3,207-7,032 Cash flows from financing activities Debts evidenced by certificates New debt issuance5,692,2666,343,6319,161,702 Redemptions-4,837,755-3,760,120-7,855,656 Debts evidenced by certificates854,5112,583,5111,306,046 Dividend paid-86,000-76,000-76,000 Cash flows from financing activities768,5112,507,5111,230,046 Change in cash and cash equivalents, net608,622622,7221,069,222 Opening balance for cash and cash equivalents, net2,849,6241,767,4531,767,453 Exchange rate adjustments29,911-15,93812,949 Closing balance for cash and cash equivalents, net3,488,1572,374,2372,849,624 Change in cash and cash equivalents, net608,622622,7221,069,222 Additional information to the statement of cash flows Interest received727,821890,3451,614,440 Interest paid-490,985-659,466-1,224,578 In thousands of euro30 Jun 202630 Jun 202531 Dec 2025 The following items are included in cash and cash equivalents, net Cash and balances at banks990,522886,5731,004,731 Short-term placements with credit institutions2,497,6351,487,6641,844,893 Cash and cash equivalents, net3,488,1572,374,2372,849,624 The accompanying notes are an integral part of these financial statements. The cash flow statement has been prepared using the indirect method and cash flow items cannot be directly concluded from the statements of financial positions.
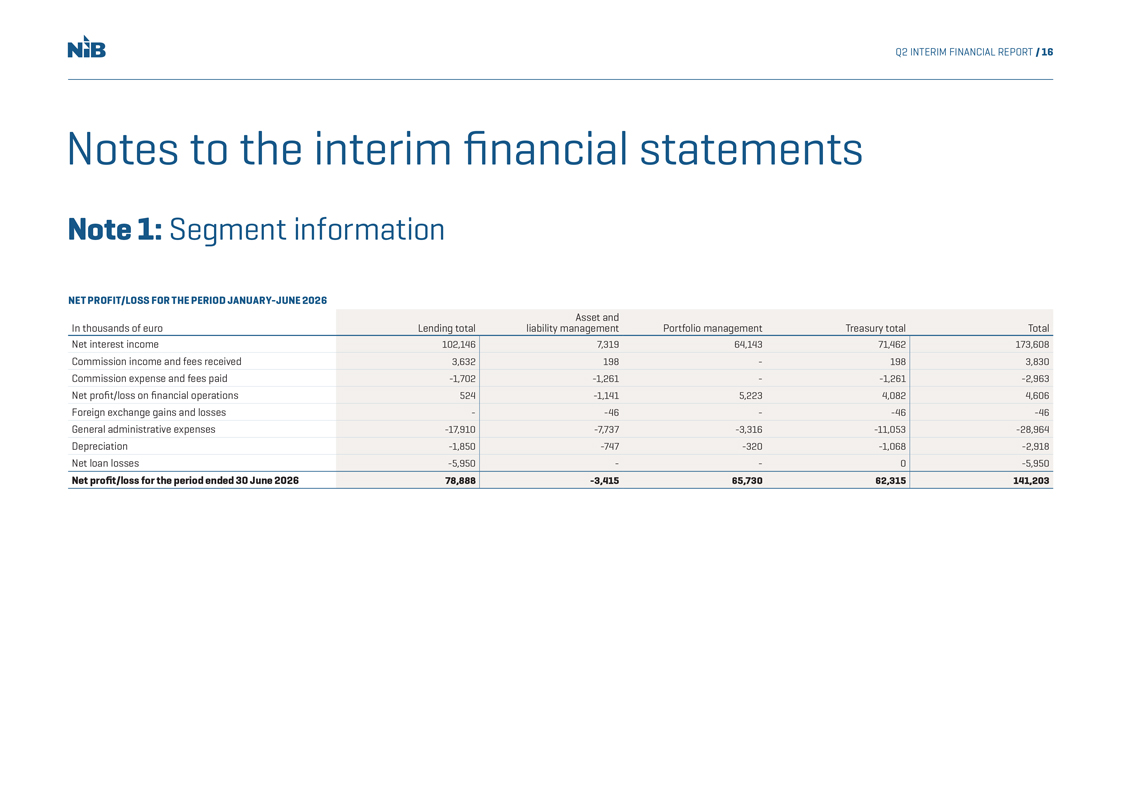
N1B Q2 INTERIM FINANCIAL REPORT / 16 Notes to the interim financial statements Note 1: Segment information NET PROFIT/LOSS FOR THE PERIOD JANUARY-JUNE 2026 In thousands of euroLending total Asset and liability managementPortfolio managementTreasury totalTotal Net interest income 102,1467,31964,14371,462173,608 Commission income and fees received3,632198-1983,830 Commission expense and fees paid-1,702-1,261--1,261-2,963 Net profit/loss on financial operations524-1,1415,2234,0824,606 Foreign exchange gains and losses--46--46-46 General administrative expenses-17,910-7,737-3,316-11,053-28,964 Depreciation-1,850-747-320-1,068-2,918 Net loan losses-5,950--0-5,950 Net profit/loss for the period ended 30 June 202678,888-3,41565,73062,315141,203
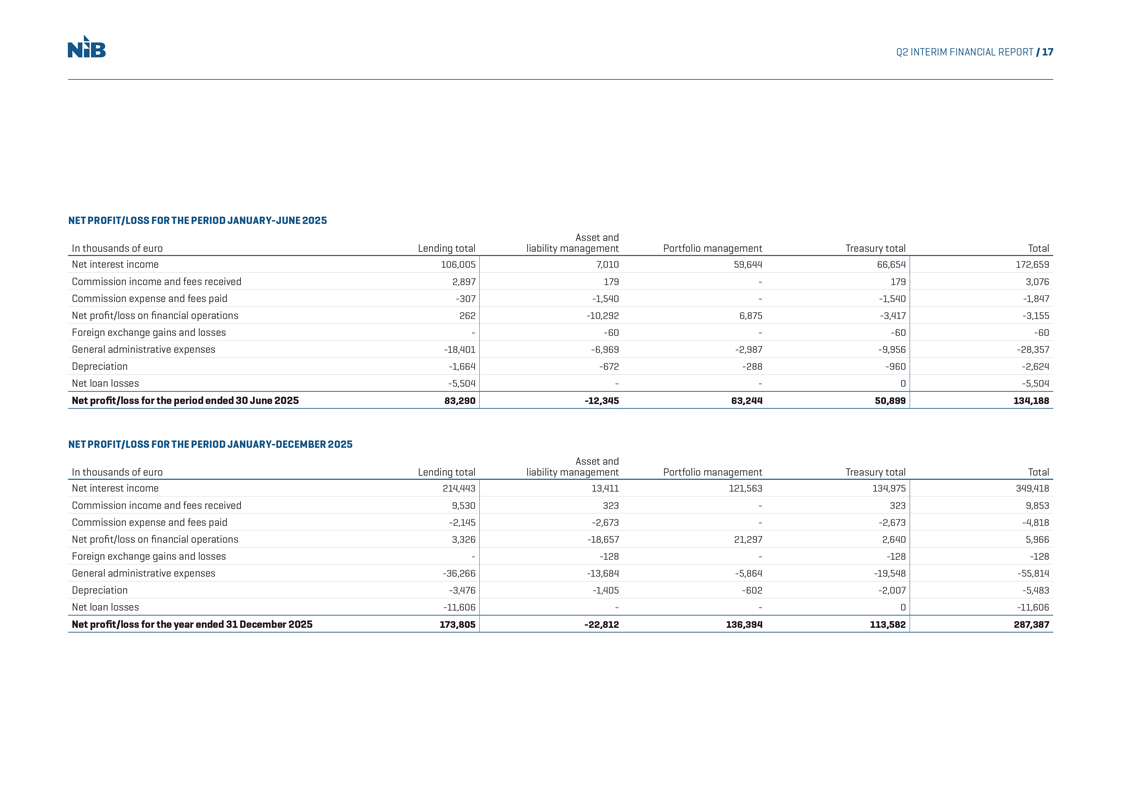
N1B Q2 INTERIM FINANCIAL REPORT / 17 NET PROFIT/LOSS FOR THE PERIOD JANUARY-JUNE 2025 Asset and In thousands of euroLending totalliability managementPortfolio managementTreasury totalTotal Net interest income 106,0057,01059,64466,654172,659 Commission income and fees received2,897179-1793,076 Commission expense and fees paid-307-1,540--1,540-1,847 Net profit/loss on financial operations262-10,2926,875-3,417-3,155 Foreign exchange gains and losses--60--60-60 General administrative expenses-18,401-6,969-2,987-9,956-28,357 Depreciation-1,664-672-288-960-2,624 Net loan losses-5,504--0-5,504 Net profit/loss for the period ended 30 June 202583,290-12,34563,24450,899134,188 NET PROFIT/LOSS FOR THE PERIOD JANUARY-DECEMBER 2025 Asset and In thousands of euroLending totalliability managementPortfolio managementTreasury totalTotal Net interest income 214,44313,411121,563134,975349,418 Commission income and fees received9,530323-3239,853 Commission expense and fees paid-2,145-2,673--2,673-4,818 Net profit/loss on financial operations3,326-18,65721,2972,6405,966 Foreign exchange gains and losses--128--128-128 General administrative expenses-36,266-13,684-5,864-19,548-55,814 Depreciation-3,476-1,405-602-2,007-5,483 Net loan losses-11,606--0-11,606 Net profit/loss for the year ended 31 December 2025173,805-22,812136,394113,582287,387
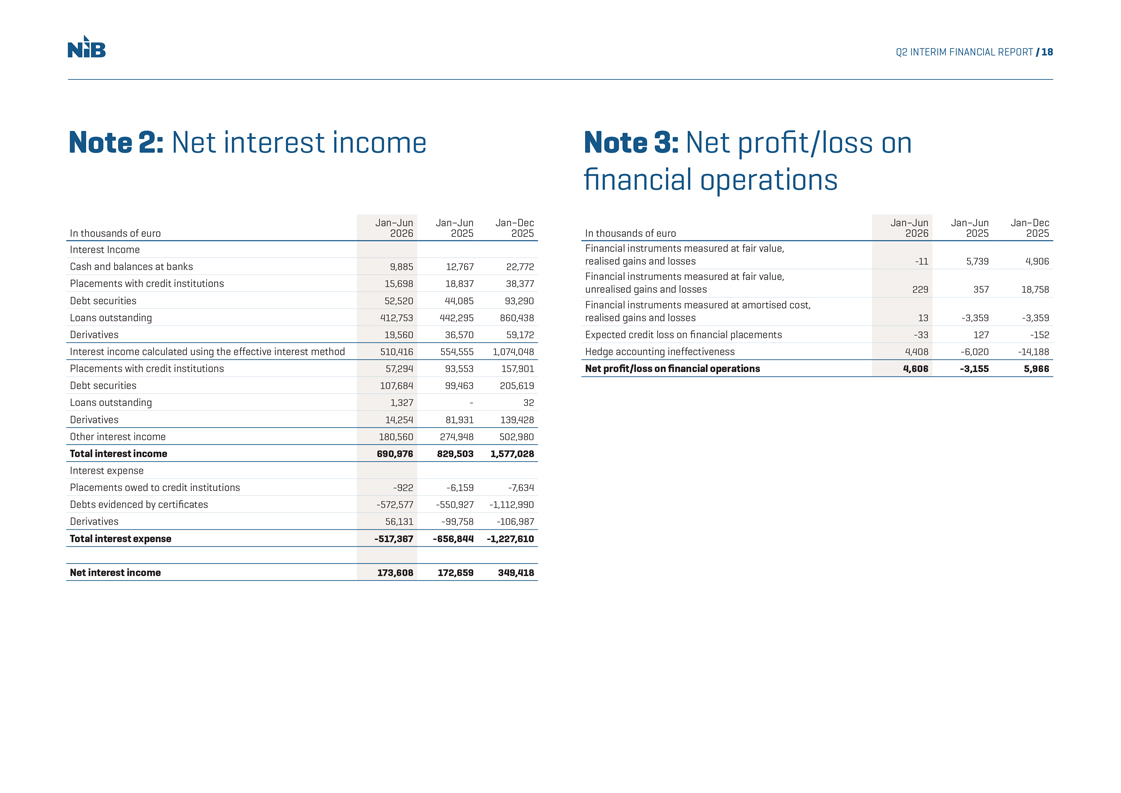
NIB Q2 INTERIM FINANCIAL REPORT / 18 Note 2: Net interest income Note 3: Net profit/loss on financial operations Jan–JunJan–JunJan–DecJan–JunJan–JunJan–Dec In thousands of euro202620252025In thousands of euro202620252025 Interest IncomeFinancial instruments measured at fair value, Cash and balances at banks9,88512,76722,772realised gains and losses -115,7394,906 Financial instruments measured at fair value, Placements with credit institutions15,69818,83738,377unrealised gains and losses 22935718,758 Debt securities52,52044,08593,290Financial instruments measured at amortised cost, Loans outstanding412,753442,295860,438realised gains and losses 13-3,359-3,359 Derivatives19,56036,57059,172Expected credit loss on financial placements-33127-152 Interest income calculated using the effective interest method510,416554,5551,074,048Hedge accounting ineffectiveness4,408-6,020-14,188 Placements with credit institutions57,29493,553157,901Net profit/loss on financial operations4,606-3,1555,966 Debt securities107,68499,463205,619 Loans outstanding1,327-32 Derivatives14,25481,931139,428 Other interest income180,560274,948502,980 Total interest income690,976829,5031,577,028 Interest expense Placements owed to credit institutions-922-6,159-7,634 Debts evidenced by certificates-572,577-550,927-1,112,990 Derivatives56,131-99,758-106,987 Total interest expense-517,367-656,844-1,227,610 Net interest income173,608172,659349,418
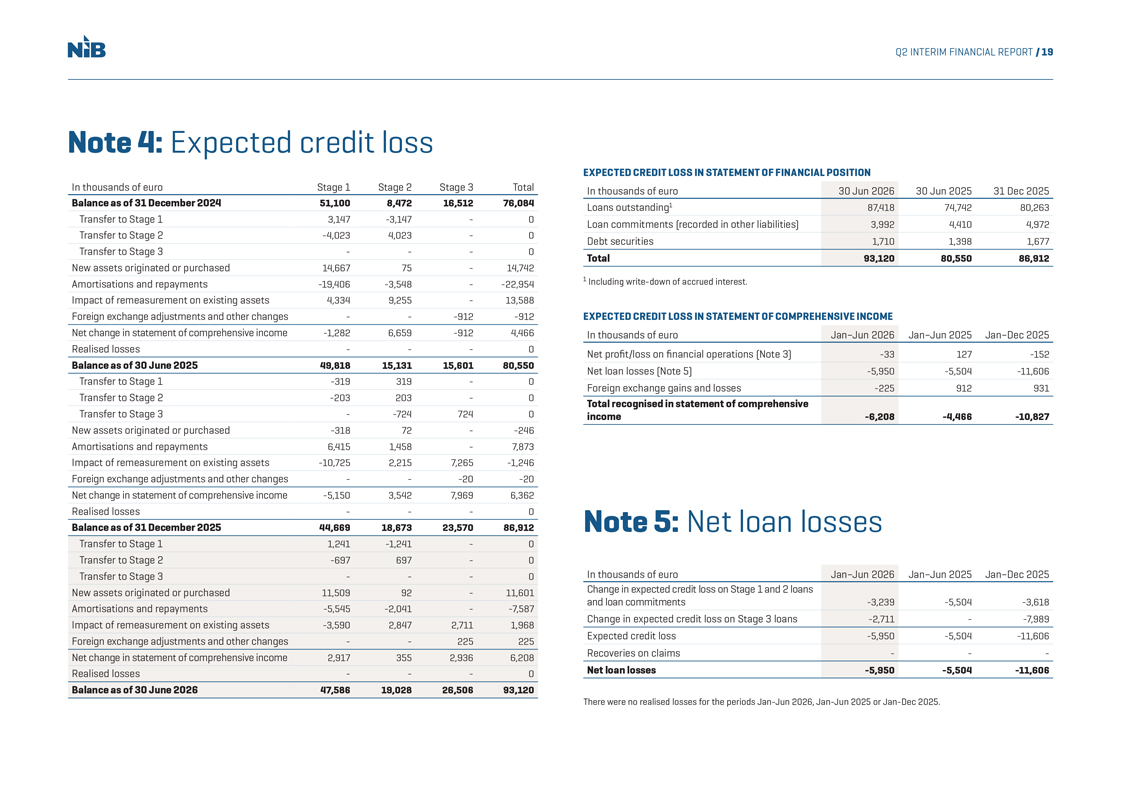
NIB Q2 INTERIM FINANCIAL REPORT / 19 Note 4: Expected credit loss In thousands of euro Stage 1 Stage 2 Stage 3 Total Balance as of 31 December 202451,1008,47216,51276,084 Transfer to Stage 13,147-3,147-0 Transfer to Stage 2-4,0234,023-0 Transfer to Stage 3---0 New assets originated or purchased14,66775-14,742 Amortisations and repayments -19,406-3,548--22,954 Impact of remeasurement on existing assets 4,3349,255-13,588 Foreign exchange adjustments and other changes ---912-912 Net change in statement of comprehensive income -1,2826,659-9124,466 Realised losses ---0 Balance as of 30 June 202549,81815,13115,60180,550 Transfer to Stage 1-319319-0 Transfer to Stage 2-203203-0 Transfer to Stage 3--7247240 New assets originated or purchased -31872--246 Amortisations and repayments 6,4151,458-7,873 Impact of remeasurement on existing assets -10,7252,2157,265-1,246 Foreign exchange adjustments and other changes ---20-20 Net change in statement of comprehensive income -5,1503,5427,9696,362 Realised losses ---0 Balance as of 31 December 202544,66918,67323,57086,912 Transfer to Stage 1 1,241-1,241-0 Transfer to Stage 2 -697697-0 Transfer to Stage 3 ---0 New assets originated or purchased 11,50992-11,601 Amortisations and repayments -5,545-2,041--7,587 Impact of remeasurement on existing assets -3,5902,8472,7111,968 Foreign exchange adjustments and other changes --225225 Net change in statement of comprehensive income 2,9173552,9366,208 Realised losses ---0 Balance as of 30 June 2026 47,58619,02826,50693,120 EXPECTED CREDIT LOSS IN STATEMENT OF FINANCIAL POSITION In thousands of euro 30 Jun 2026 30 Jun 2025 31 Dec 2025 Loans outstanding 187,41874,74280,263 Loan commitments (recorded in other liabilities) 3,9924,4104,972 Debt securities 1,7101,3981,677 Total 93,12080,55086,912 1 Including write-down of accrued interest. EXPECTED CREDIT LOSS IN STATEMENT OF COMPREHENSIVE INCOME In thousands of euro Jan–Jun 2026 Jan–Jun 2025 Jan–Dec 2025 Net profit/loss on financial operations (Note 3) -33127-152 Net loan losses (Note 5) -5,950-5,504-11,606 Foreign exchange gains and losses -225912931 Total recognised in statement of comprehensive income -6,208-4,466-10,827 Note 5: Net loan losses In thousands of euro Jan–Jun 2026 Jan–Jun 2025 Jan–Dec 2025 Change in expected credit loss on Stage 1 and 2 loans and loan commitments -3,239-5,504-3,618 Change in expected credit loss on Stage 3 loans -2,711--7,989 Expected credit loss -5,950-5,504-11,606 Recoveries on claims --- Net loan losses-5,950-5,504-11,606 There were no realised losses for the periods Jan-Jun 2026, Jan-Jun 2025 or Jan-Dec 2025.
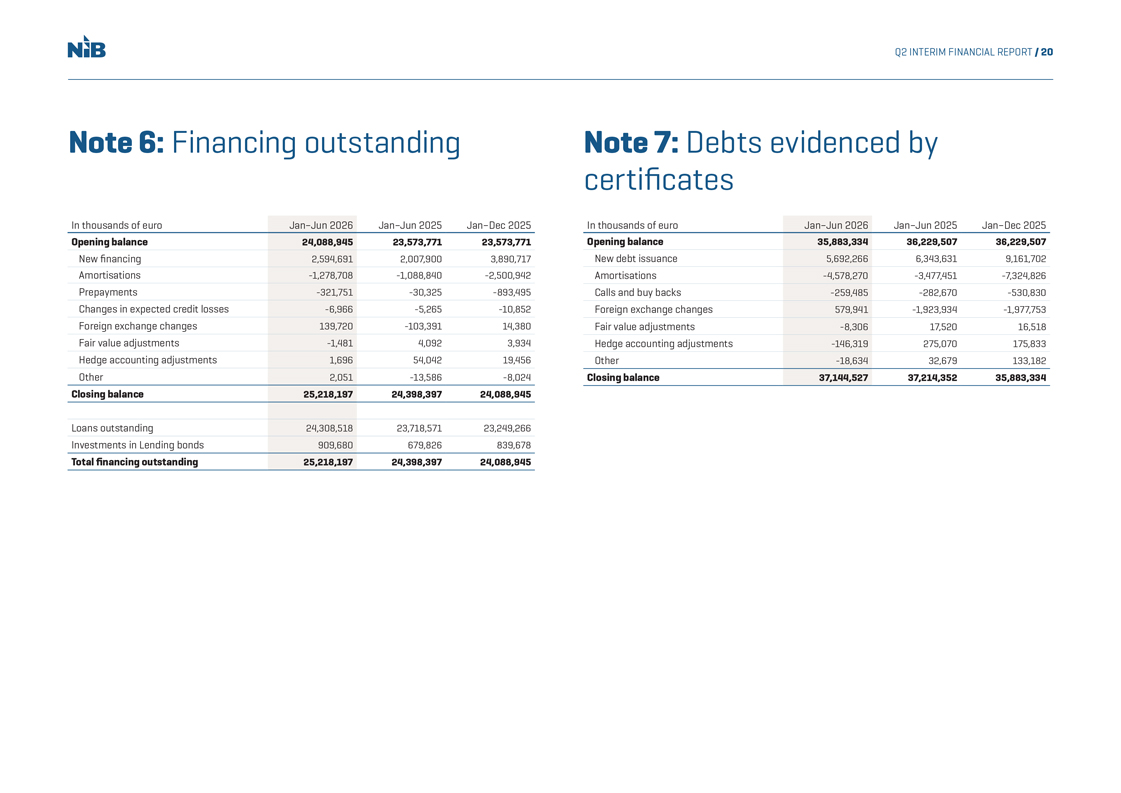
N1B Q2 INTERIM FINANCIAL REPORT / 20 Note 6: Financing outstanding Note 7: Debts evidenced by certificates In thousands of euroJan–Jun 2026Jan–Jun 2025Jan–Dec 2025In thousands of euroJan–Jun 2026Jan–Jun 2025Jan–Dec 2025 Opening balance24,088,94523,573,77123,573,771Opening balance35,883,33436,229,50736,229,507 New financing2,594,6912,007,9003,890,717New debt issuance5,692,2666,343,6319,161,702 Amortisations -1,278,708-1,088,840-2,500,942Amortisations -4,578,270-3,477,451-7,324,826 Prepayments-321,751-30,325-893,495Calls and buy backs-259,485-282,670-530,830 Changes in expected credit losses-6,966-5,265-10,852Foreign exchange changes579,941-1,923,934-1,977,753 Foreign exchange changes139,720-103,39114,380Fair value adjustments-8,30617,52016,518 Fair value adjustments-1,4814,0923,934Hedge accounting adjustments-146,319275,070175,833 Hedge accounting adjustments1,69654,04219,456Other-18,63432,679133,182 Other2,051-13,586-8,024Closing balance37,144,52737,214,35235,883,334 Closing balance25,218,19724,398,39724,088,945 Loans outstanding24,308,51823,718,57123,249,266 Investments in Lending bonds909,680679,826839,678 Total financing outstanding25,218,19724,398,39724,088,945
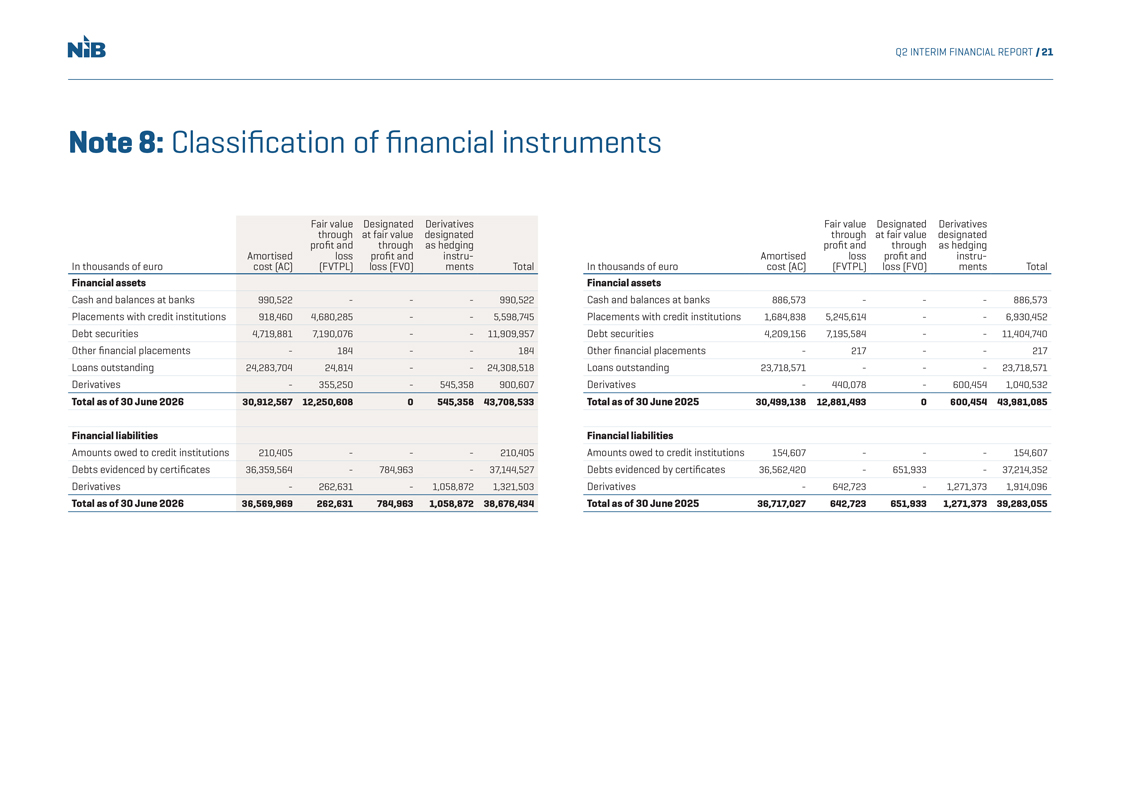
N1B Q2 INTERIM FINANCIAL REPORT / 21 Note 8: Classification of financial instruments
In thousands of euro
Amortised cost (AC)
Fair value through profit and loss (FVTPL)
Designated at fair value through profit and loss
(FVO)
Derivatives designated as hedging instru- ments
Total Financial assets
Cash and balances at banks 990,522 - - - 990,522
Placements with credit
institutions 918,460 4,680,285 - - 5,598,745
Debt securities 4,719,881 7,190,076 - - 11,909,957
Other financial placements - 184 - - 184
Loans outstanding 24,283,704 24,814 - - 24,308,518
Derivatives - 355,250 - 545,358 900,607
Total as of 30 June 2026 30,912,567
12,250,608 0 545,358 43,708,533
Financial liabilities
Amounts owed to credit
institutions 210,405 - - - 210,405
Debts evidenced by certificates 36,359,564 - 784,963 - 37,144,527
Derivatives - 262,631 - 1,058,872 1,321,503
Total as of 30 June 2026 36,569,969 262,631
784,963 1,058,872 38,676,434
In thousands of euro
Amortised cost (AC)
Fair value through profit and loss (FVTPL)
Designated at fair value through
profit and loss (FVO)
Derivatives designated as hedging instru- ments
Total
Financial assets
Cash and balances at banks 886,573 - - - 886,573
Placements with credit institutions 1,684,838 5,245,614 - - 6,930,452
Debt securities
4,209,156 7,195,584 - - 11,404,740
Other financial placements - 217 - - 217
Loans outstanding 23,718,571 - - - 23,718,571
Derivatives - 440,078 - 600,454
1,040,532
Total as of 30 June 2025 30,499,138 12,881,493 0 600,454 43,981,085
Financial liabilities
Amounts owed to credit institutions 154,607 - - -
154,607
Debts evidenced by certificates 36,562,420 - 651,933 - 37,214,352
Derivatives - 642,723 - 1,271,373 1,914,096
Total as of 30 June 2025
36,717,027 642,723 651,933 1,271,373 39,283,055
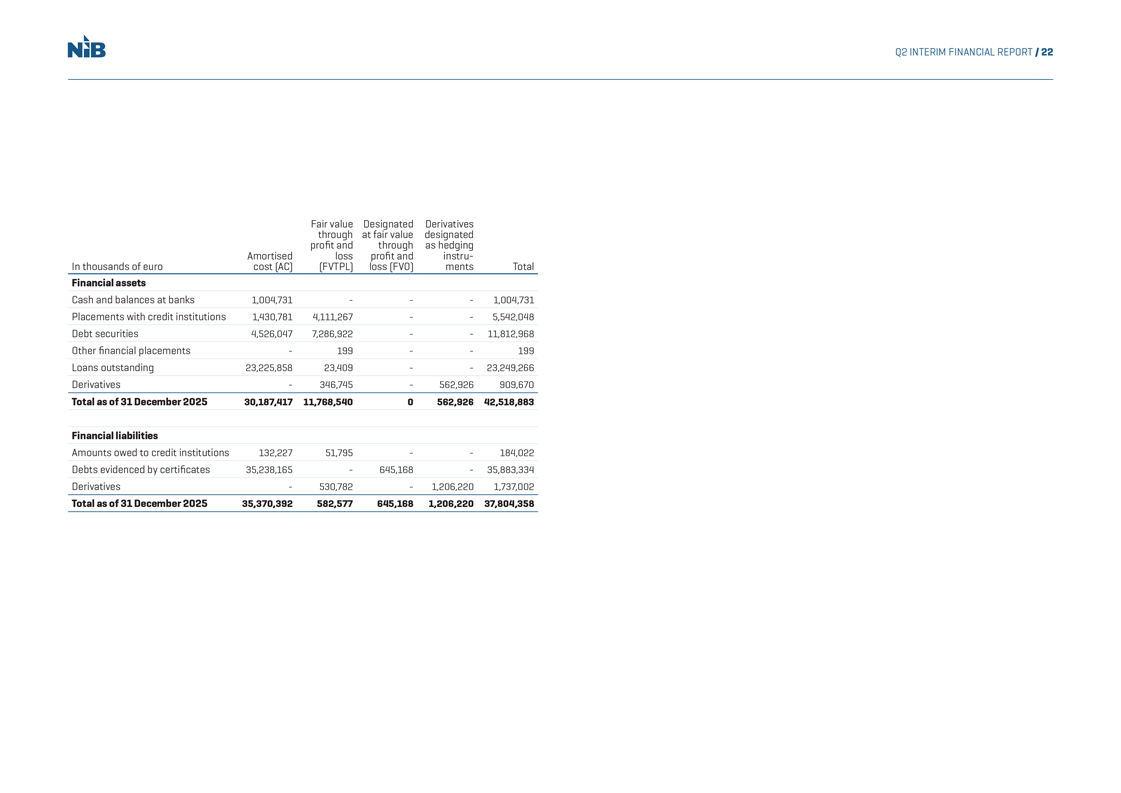
In thousands of euro
Amortised cost (AC)
Fair value through profit and loss (FVTPL)
Designated at fair value through profit and loss (FVO)
Derivatives designated as hedging
instru- ments
Total
Financial assets
Cash and balances at banks 1,004,731 - - - 1,004,731
Placements with credit institutions
1,430,781 4,111,267 - - 5,542,048
Debt securities 4,526,047 7,286,922 - - 11,812,968
Other financial placements - 199 - - 199
Loans outstanding 23,225,858 23,409 - - 23,249,266
Derivatives - 346,745 - 562,926 909,670
Total as of 31 December 2025
30,187,417 11,768,540 0 562,926 42,518,883
Financial liabilities
Amounts owed
to credit institutions 132,227 51,795 - - 184,022
Debts evidenced by certificates 35,238,165 - 645,168 - 35,883,334
Derivatives - 530,782 - 1,206,220 1,737,002
Total as of 31 December 2025 35,370,392 582,577
645,168 1,206,220 37,804,358
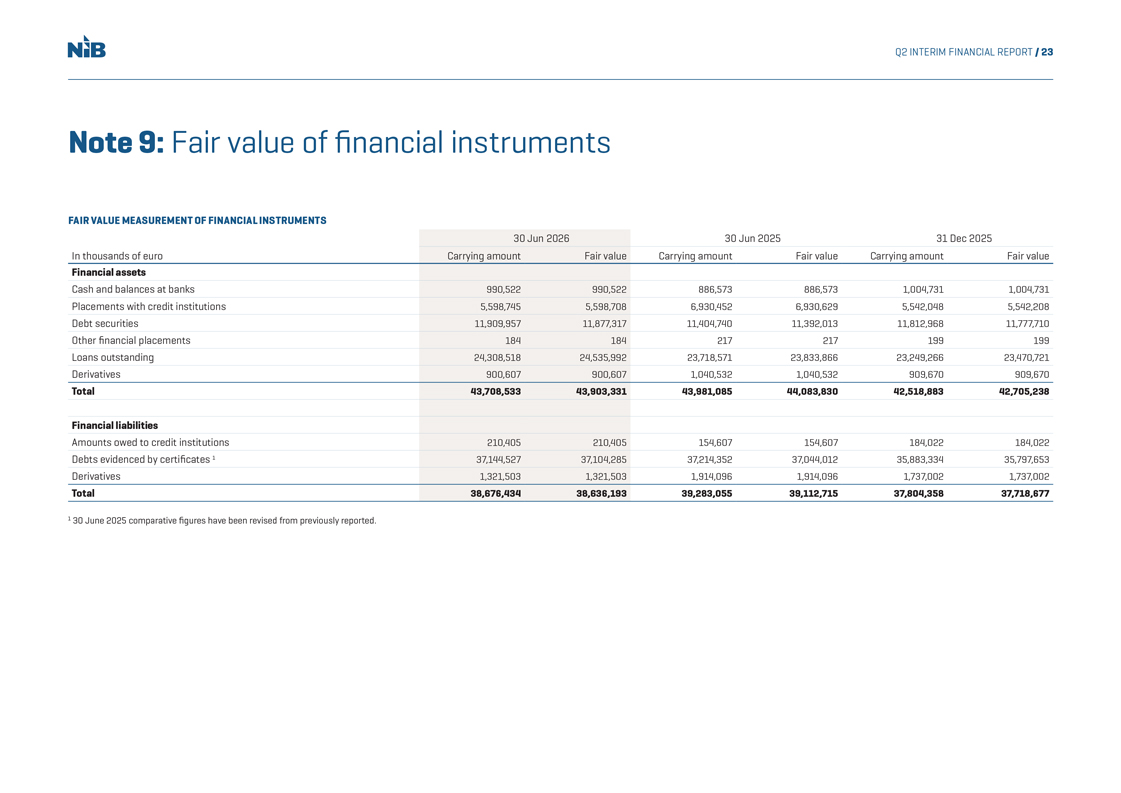
NIB Q2 INTERIM FINANCIAL REPORT / 23 Note 9: Fair value of financial instruments FAIR VALUE MEASUREMENT OF FINANCIAL INSTRUMENTS 30 Jun 2026 30 Jun 2025 31 Dec 2025 In thousands of euro Carrying amount Fair value Carrying amount Fair value Carrying amount Fair value Financial assets Cash and balances at banks 990,522990,522886,573886,5731,004,7311,004,731 Placements with credit institutions 5,598,7455,598,7086,930,4526,930,6295,542,0485,542,208 Debt securities 11,909,95711,877,31711,404,74011,392,01311,812,96811,777,710 Other financial placements 184184217217199199 Loans outstanding 24,308,51824,535,99223,718,57123,833,86623,249,26623,470,721 Derivatives 900,607900,6071,040,5321,040,532909,670909,670 Total 43,708,53343,903,33143,981,08544,083,83042,518,88342,705,238 Financial liabilities Amounts owed to credit institutions 210,405210,405154,607154,607184,022184,022 Debts evidenced by certificates 137,144,52737,104,28537,214,35237,044,01235,883,33435,797,653 Derivatives 1,321,5031,321,5031,914,0961,914,0961,737,0021,737,002 Total 38,676,43438,636,19339,283,05539,112,71537,804,35837,718,677 1 30 June 2025 comparative figures have been revised from previously reported.
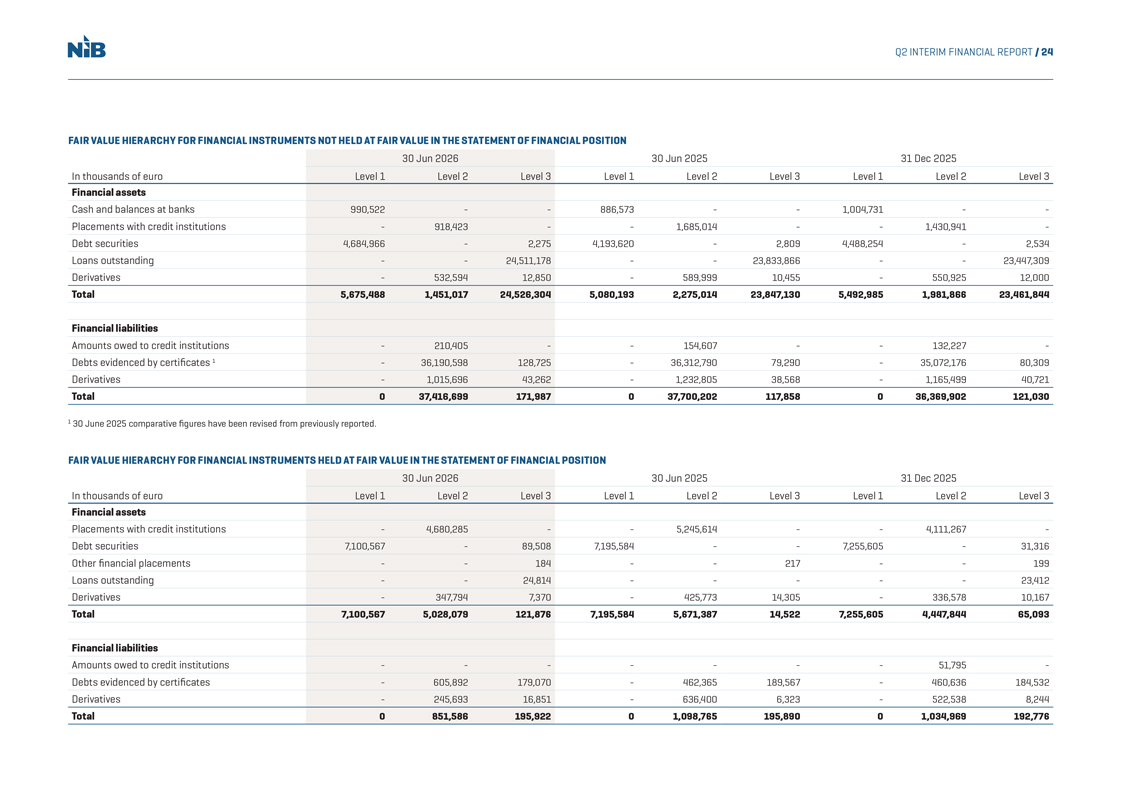
NIB Q2 INTERIM FINANCIAL REPORT / 24 FAIR VALUE HIERARCHY FOR FINANCIAL INSTRUMENTS NOT HELD AT FAIR VALUE IN THE STATEMENT OF FINANCIAL POSITION 30 Jun 2026 30 Jun 2025 31 Dec 2025 In thousands of euro Level 1 Level 2 Level 3 Level 1 Level 2 Level 3 Level 1 Level 2 Level 3 Financial assets Cash and balances at banks 990,522--886,573--1,004,731-- Placements with credit institutions -918,423--1,685,014--1,430,941- Debt securities 4,684,966-2,2754,193,620-2,8094,488,254-2,534 Loans outstanding --24,511,178--23,833,866--23,447,309 Derivatives -532,59412,850-589,99910,455-550,92512,000 Total 5,675,4881,451,01724,526,3045,080,1932,275,01423,847,1305,492,9851,981,86623,461,844 Financial liabilities Amounts owed to credit institutions -210,405--154,607--132,227- Debts evidenced by certificates 1-36,190,598128,725-36,312,79079,290-35,072,17680,309 Derivatives -1,015,69643,262-1,232,80538,568-1,165,49940,721 Total 037,416,699171,987037,700,202117,858036,369,902121,030 1 30 June 2025 comparative figures have been revised from previously reported. FAIR VALUE HIERARCHY FOR FINANCIAL INSTRUMENTS HELD AT FAIR VALUE IN THE STATEMENT OF FINANCIAL POSITION 30 Jun 2026 30 Jun 2025 31 Dec 2025 In thousands of euro Level 1 Level 2 Level 3 Level 1 Level 2 Level 3 Level 1 Level 2 Level 3 Financial assets Placements with credit institutions -4,680,285--5,245,614--4,111,267- Debt securities 7,100,567-89,5087,195,584--7,255,605-31,316 Other financial placements --184--217--199 Loans outstanding --24,814-----23,412 Derivatives -347,7947,370-425,77314,305-336,57810,167 Total 7,100,5675,028,079121,8767,195,5845,671,38714,5227,255,6054,447,84465,093 Financial liabilities Amounts owed to credit institutions -------51,795- Debts evidenced by certificates -605,892179,070-462,365189,567-460,636184,532 Derivatives -245,69316,851-636,4006,323-522,5388,244 Total 0851,586195,92201,098,765195,89001,034,969192,776
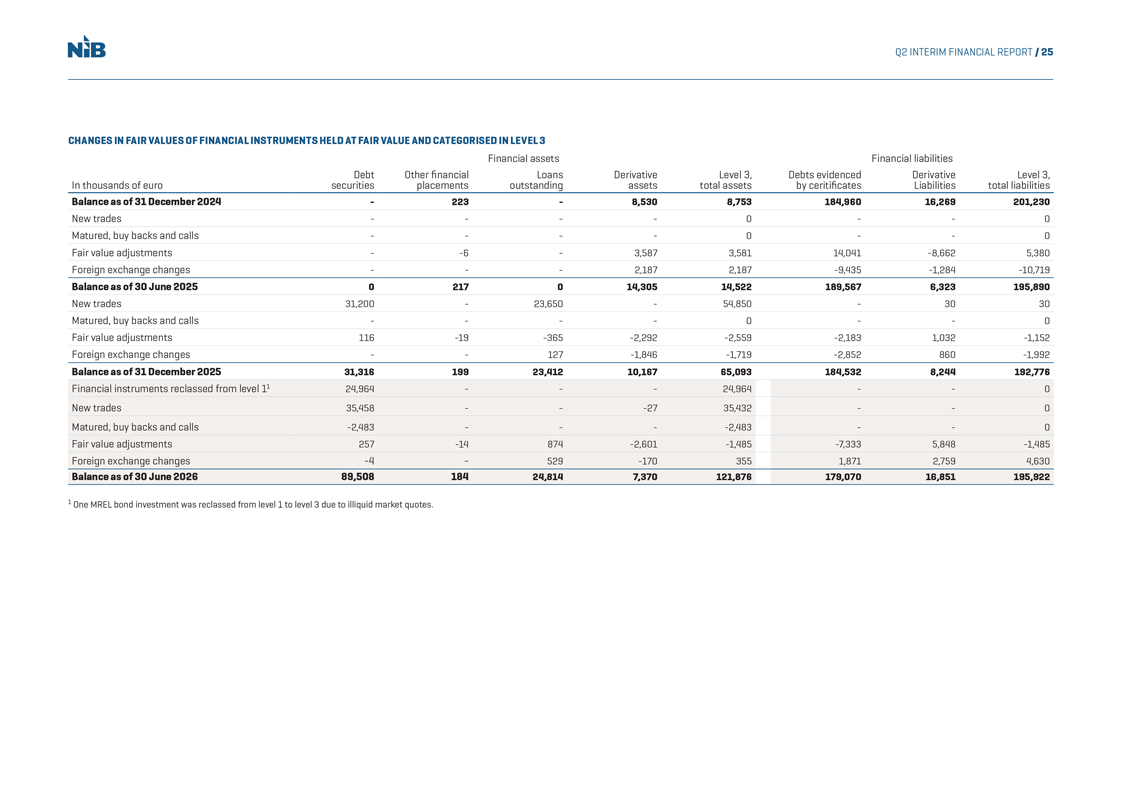
NIB Q2 INTERIM FINANCIAL REPORT / 25 CHANGES IN FAIR VALUES OF FINANCIAL INSTRUMENTS HELD AT FAIR VALUE AND CATEGORISED IN LEVEL 3 Financial assets Financial liabilities Debt Other financial Loans Derivative Level 3, Debts evidenced Derivative Level 3, In thousands of euro securities placements outstanding assets total assets by ceritificates Liabilities total liabilities Balance as of 31 December 2024 - 223 - 8,530 8,753184,96016,269201,230 New trades ----0--0 Matured, buy backs and calls ----0--0 Fair value adjustments --6-3,5873,58114,041-8,6625,38 0 Foreign exchange changes ---2,1872,187-9,435-1,284-10,719 Balance as of 30 June 20250217014,30514,522189,5676,323195,890 New trades 31,200-23,650-54,850-3030 Matured, buy backs and calls ----0--0 Fair value adjustments 116-19-365-2,292-2,559-2,1831,032-1,152 Foreign exchange changes --127-1,846-1,719-2,852860-1,992 Balance as of 31 December 202531,31619923,41210,16765,093184,5328,244192,776 Financial instruments reclassed from level 1124,964---24,964--0 New trades 35,458---2735,432--0 Matured, buy backs and calls -2,483----2,483--0 Fair value adjustments 257-14874-2,601-1,485-7,3335,848-1,485 Foreign exchange changes -4-529-1703551,8712,7594,630 Balance as of 30 June 2026 89,50818424,8147,370121,876179,07016,851195,922 1 One MREL bond investment was reclassed from level 1 to level 3 due to illiquid market quotes.
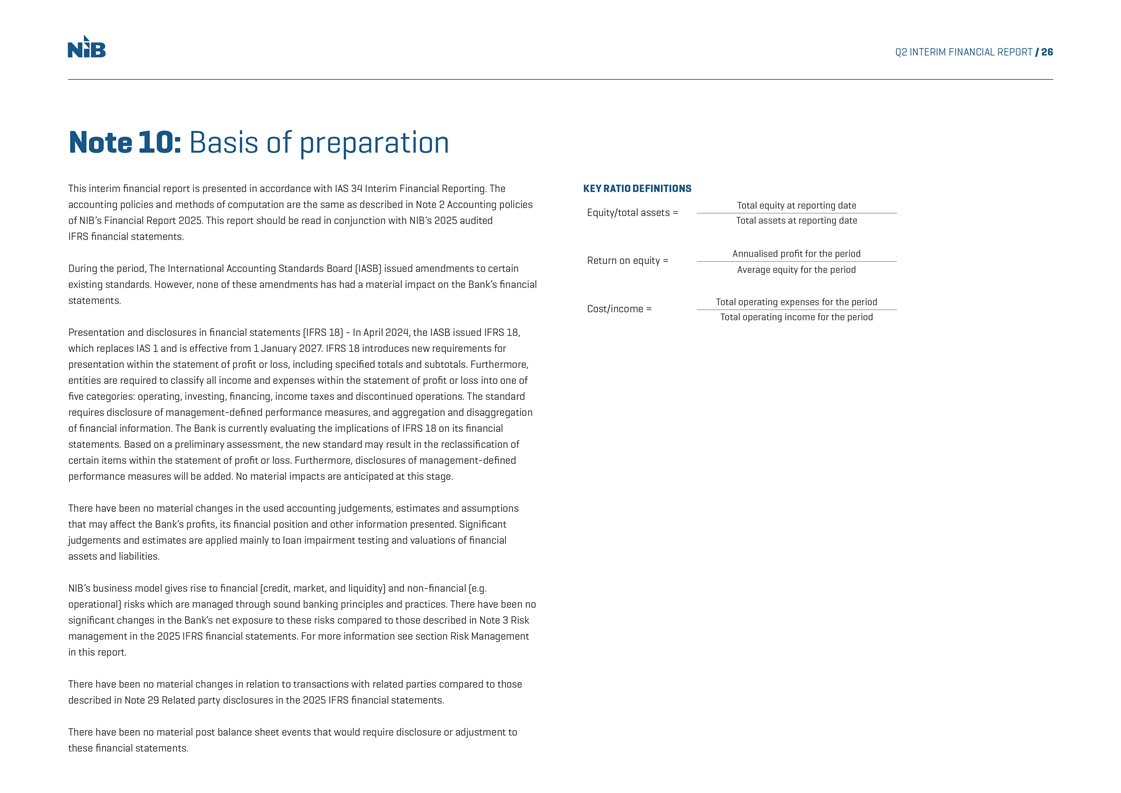
NIB Q2 INTERIM FINANCIAL REPORT / 26 Note 10: Basis of preparation This interim financial report is presented in accordance with IAS 34 Interim Financial Reporting. The accounting policies and methods of computation are the same as described in Note 2 Accounting policies of NIB’s Financial Report 2025. This report should be read in conjunction with NIB’s 2025 audited IFRS financial statements. During the period, The International Accounting Standards Board (IASB) issued amendments to certain existing standards. However, none of these amendments has had a material impact on the Bank’s financial statements. Presentation and disclosures in financial statements (IFRS 18) - In April 2024, the IASB issued IFRS 18, which replaces IAS 1 and is effective from 1 January 2027. IFRS 18 introduces new requirements for presentation within the statement of profit or loss, including specified totals and subtotals. Furthermore, entities are required to classify all income and expenses within the statement of profit or loss into one of five categories: operating, investing, financing, income taxes and discontinued operations. The standard requires disclosure of management-defined performance measures, and aggregation and disaggregation of financial information. The Bank is currently evaluating the implications of IFRS 18 on its financial statements. Based on a preliminary assessment, the new standard may result in the reclassification of certain items within the statement of profit or loss. Furthermore, disclosures of management-defined performance measures will be added. No material impacts are anticipated at this stage. There have been no material changes in the used accounting judgements, estimates and assumptions that may affect the Bank’s profits, its financial position and other information presented. Significant judgements and estimates are applied mainly to loan impairment testing and valuations of financial assets and liabilities. NIB’s business model gives rise to financial (credit, market, and liquidity) and non-financial (e.g. operational) risks which are managed through sound banking principles and practices. There have been no significant changes in the Bank’s net exposure to these risks compared to those described in Note 3 Risk management in the 2025 IFRS financial statements. For more information see section Risk Management in this report. There have been no material changes in relation to transactions with related parties compared to those described in Note 29 Related party disclosures in the 2025 IFRS financial statements. There have been no material post balance sheet events that would require disclosure or adjustment to these financial statements. KEY RATIO DEFINITIONS Equity/total assets = Total equity at reporting date Total assets at reporting date Return on equity = Annualised profit for the period Average equity for the period Cost/income = Total operating expenses for the period Total operating income for the period
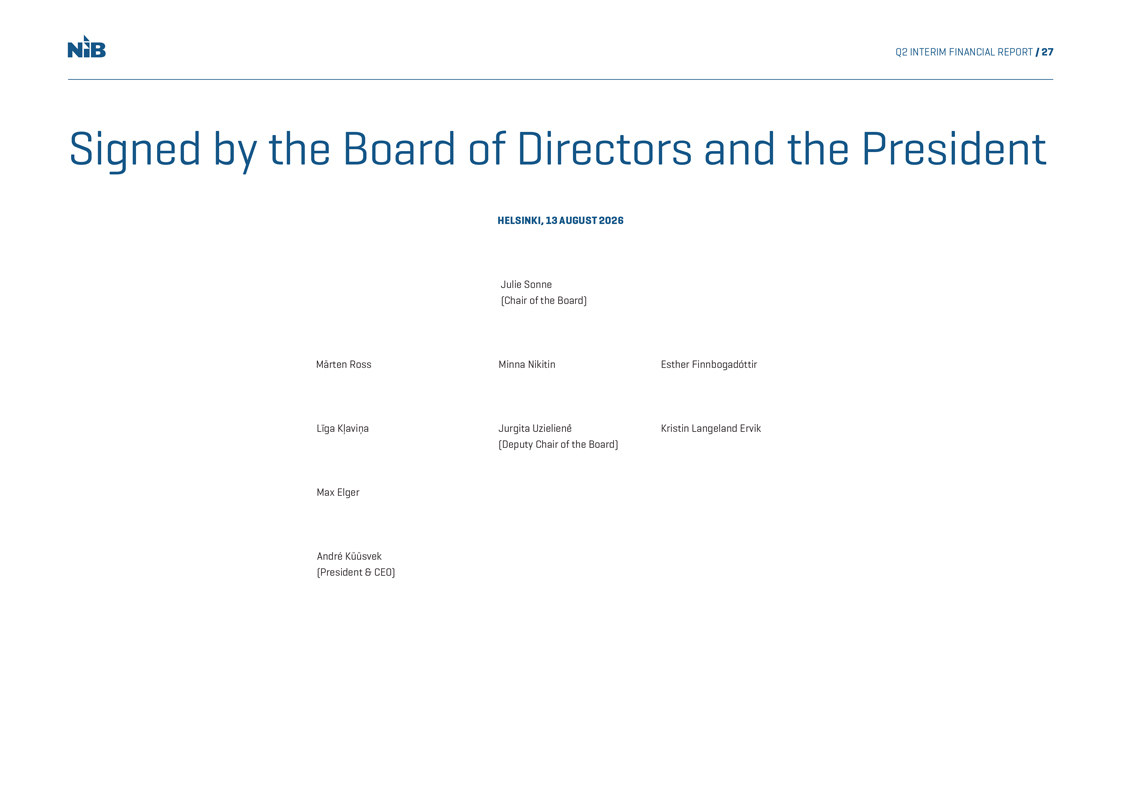
NIB Q2 INTERIM FINANCIAL REPORT / 27 Signed by the Board of Directors and the President HELSINKI, 13 AUGUST 2026 Julie Sonne (Chair of the Board) Märten Ross Minna Nikitin Esther Finnbogadóttir Līga Kļaviņa Jurgita Uzielienė Kristin Langeland Ervik (Deputy Chair of the Board) Max Elger André Küüsvek (President & CEO)
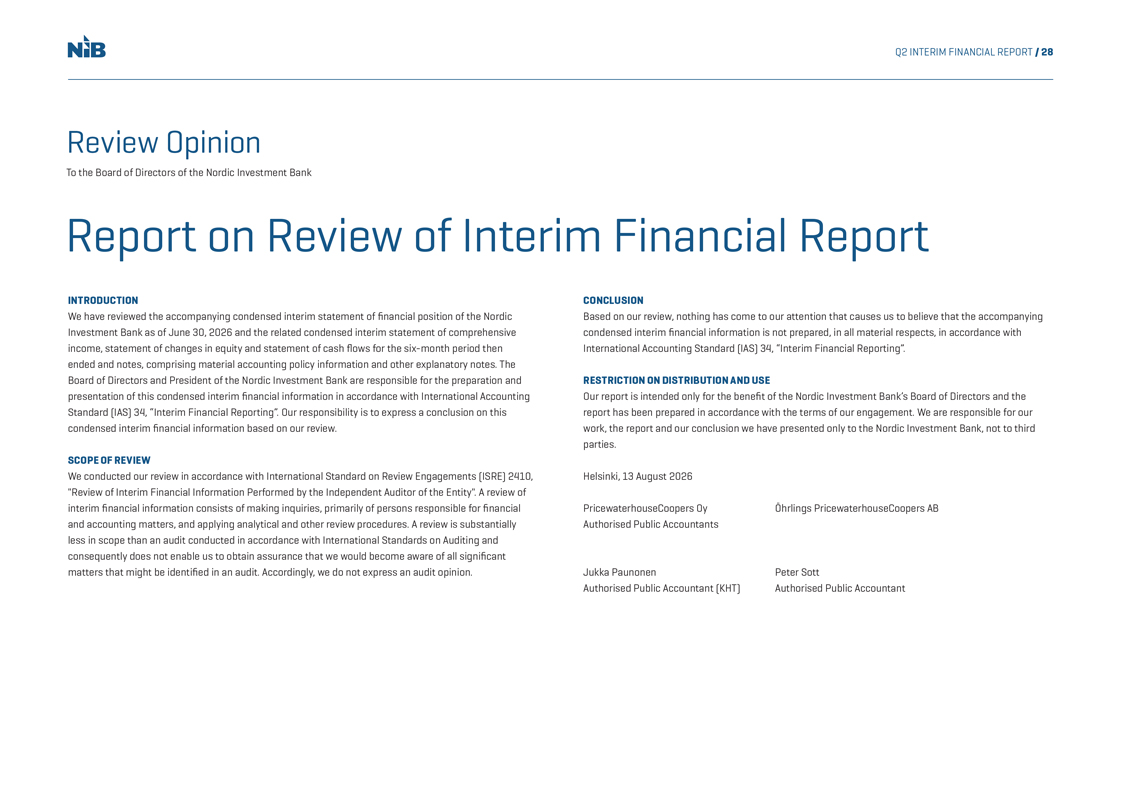
NiB Q2 INTERIM FINANCIAL REPORT / 28 Review Opinion To the Board of Directors of the Nordic Investment Bank Report on Review of Interim Financial Report INTRODUCTION We have reviewed the accompanying condensed interim statement of financial position of the Nordic Investment Bank as of June 30, 2026 and the related condensed interim statement of comprehensive income, statement of changes in equity and statement of cash flows for the six-month period then ended and notes, comprising material accounting policy information and other explanatory notes. The Board of Directors and President of the Nordic Investment Bank are responsible for the preparation and presentation of this condensed interim financial information in accordance with International Accounting Standard (IAS) 34, “Interim Financial Reporting”. Our responsibility is to express a conclusion on this condensed interim financial information based on our review. SCOPE OF REVIEW We conducted our review in accordance with International Standard on Review Engagements (ISRE) 2410, “Review of Interim Financial Information Performed by the Independent Auditor of the Entity”. A review of interim financial information consists of making inquiries, primarily of persons responsible for financial and accounting matters, and applying analytical and other review procedures. A review is substantially less in scope than an audit conducted in accordance with International Standards on Auditing and consequently does not enable us to obtain assurance that we would become aware of all significant matters that might be identified in an audit. Accordingly, we do not express an audit opinion. CONCLUSION Based on our review, nothing has come to our attention that causes us to believe that the accompanying condensed interim financial information is not prepared, in all material respects, in accordance with International Accounting Standard (IAS) 34, “Interim Financial Reporting”. RESTRICTION ON DISTRIBUTION AND USE Our report is intended only for the benefit of the Nordic Investment Bank’s Board of Directors and the report has been prepared in accordance with the terms of our engagement. We are responsible for our work, the report and our conclusion we have presented only to the Nordic Investment Bank, not to third parties. Helsinki, 13 August 2026 PricewaterhouseCoopers Oy Öhrlings PricewaterhouseCoopers AB Authorised Public Accountants Jukka Paunonen Peter Sott Authorised Public Accountant (KHT) Authorised Public Accountant
CONTACT Kim Skov Jensen Jens Hellerup Jukka Ahonen Vice President & CFO Senior Director, Chief Corporate Affairs Officer kim.jensen@nib.int Head of Treasury jukka.ahonen@nib.int jens.hellerup@nib.int For more information about the Nordic Investment Bank, visit www.nib.int