
CIBC CARIBBEAN BANK LIMITED AND SUBSIDIARIES Consolidated and Carve-out Financial Statements Years Ended October 31, 2025 and 2024
1 Ernst & Young Ltd. Caves Corporate Centre West Bay Street & Blake Road Nassau N-3231 The Bahamas Tel: +242 502 6000 Fax: +242 502 6095 ey.com A member firm of Ernst & Young Global Limited Report of Independent Auditors To The Board Of Directors CIBC Caribbean Bank Limited Report on the Audit of the Consolidated and Carve-out Financial Statements Opinion We have audited the consolidated and carve-out financial statements of CIBC Caribbean Bank Limited (the Bank) and its subsidiaries (together, the Group), which comprise the consolidated and carve-out statements of financial position as of October 31, 2025 and 2024, and the related consolidated and carve-out statements of income, comprehensive income, changes in equity and cash flows for the years then ended, and related notes (collectively referred to as the “consolidated and carve-out financial statements”). In our opinion, the accompanying consolidated and carve-out financial statements present fairly, in all material respects, the financial position of the Group at October 31, 2025 and 2024, and the results of its operations and its cash flows for the years then ended in accordance with IFRS Accounting standards promulgated by the International Accounting Standards Board. Basis for Opinion We conducted our audits in accordance with auditing standards generally accepted in the United States of America (GAAS). Our responsibilities under those standards are further described in the Auditor’s Responsibilities for the Audit of the consolidated and carve-out financial statements section of our report. We are required to be independent of the Group and to meet our other ethical responsibilities in accordance with the relevant ethical requirements relating to our audits. We believe that the audit evidence we have obtained is sufficient and appropriate to provide a basis for our opinion. Responsibilities of Management for the Consolidated and Carve-out Financial Statements Management is responsible for the preparation and fair presentation of the consolidated and carve- out financial statements in accordance with the IFRS Accounting Standards promulgated by the International Accounting Standards Board, and for the design, implementation, and maintenance of internal control relevant to the preparation and fair presentation of consolidated and carve-out financial statements that are free of material misstatement, whether due to fraud or error.
2 A member firm of Ernst & Young Global Limited In preparing the consolidated and carve-out financial statements, management is responsible for assessing the Group’s ability to continue as a going concern for at least but not limited to, twelve months from the end of the reporting period; disclosing, as applicable, matters related to going concern; and using the going concern basis of accounting unless management either intends to liquidate the Group or to cease operations, or has no realistic alternative but to do so. Auditor’s Responsibilities for the Audit of the Consolidated and Carve-out Financial Statements Our objectives are to obtain reasonable assurance about whether the consolidated and carve-out financial statements as a whole are free of material misstatement, whether due to fraud or error, and to issue an auditor’s report that includes our opinion. Reasonable assurance is a high level of assurance but is not absolute assurance and therefore is not a guarantee that an audit conducted in accordance with GAAS will always detect a material misstatement when it exists. The risk of not detecting a material misstatement resulting from fraud is higher than for one resulting from error, as fraud may involve collusion, forgery, intentional omissions, misrepresentations, or the override of internal control. Misstatements are considered material if there is a substantial likelihood that, individually or in the aggregate, they would influence the judgment made by a reasonable user based on the consolidated and carve-out financial statements. In performing an audit in accordance with GAAS, we: • Exercise professional judgment and maintain professional skepticism throughout the audit. • Identify and assess the risks of material misstatement of the consolidated and carve-out financial statements, whether due to fraud or error, and design and perform audit procedures responsive to those risks. Such procedures include examining, on a test basis, evidence regarding the amounts and disclosures in the consolidated and carve-out financial statements. • Obtain an understanding of internal control relevant to the audit in order to design audit procedures that are appropriate in the circumstances, but not for the purpose of expressing an opinion on the effectiveness of the Group’s internal control. Accordingly, no such opinion is expressed. • Evaluate the appropriateness of accounting policies used and the reasonableness of significant accounting estimates made by management, as well as evaluate the overall presentation of the consolidated and carve-out financial statements.

3 A member firm of Ernst & Young Global Limited • Conclude whether, in our judgment, there are conditions or events, considered in the aggregate, that raise substantial doubt about the Group’s ability to continue as a going concern for a reasonable period of time. We are required to communicate with those charged with governance regarding, among other matters, the planned scope and timing of the audit, significant audit findings, and certain internal control-related matters that we identified during the audit. August 14, 2026
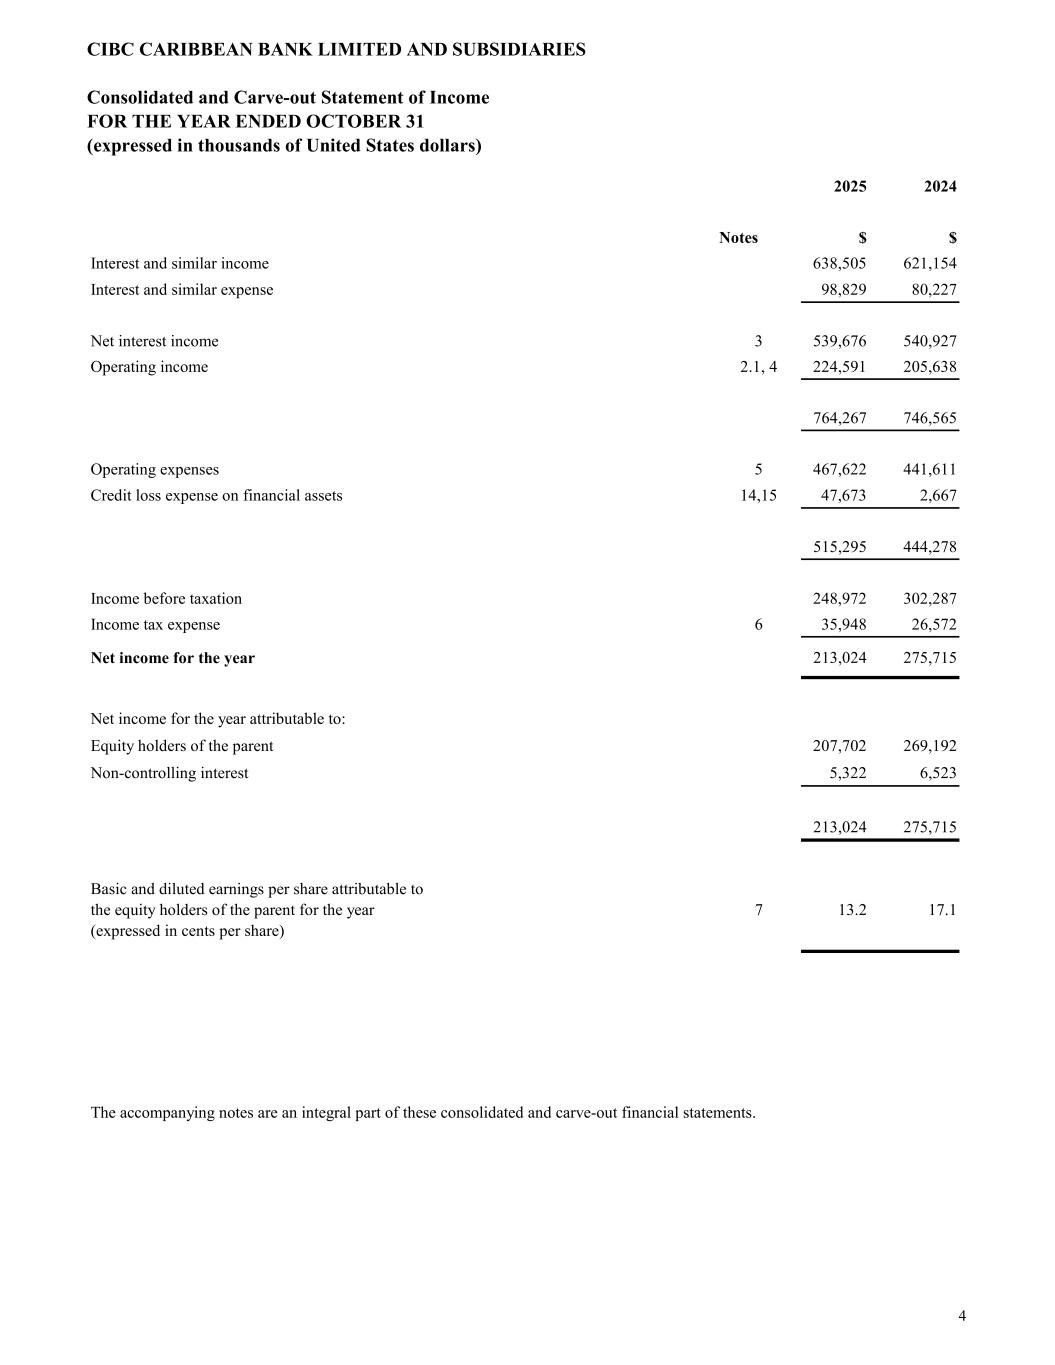
CIBC CARIBBEAN BANK LIMITED AND SUBSIDIARIES Consolidated and Carve-out Statement of Income FOR THE YEAR ENDED OCTOBER 31 (expressed in thousands of United States dollars) 2025 2024 Notes $ $ Interest and similar income 638,505 621,154 Interest and similar expense 98,829 80,227 Net interest income 3 539,676 540,927 Operating income 2.1, 4 224,591 205,638 764,267 746,565 Operating expenses 5 467,622 441,611 Credit loss expense on financial assets 14,15 47,673 2,667 515,295 444,278 Income before taxation 248,972 302,287 Income tax expense 6 35,948 26,572 Net income for the year 213,024 275,715 Net income for the year attributable to: Equity holders of the parent 207,702 269,192 Non-controlling interest 5,322 6,523 213,024 275,715 Basic and diluted earnings per share attributable to the equity holders of the parent for the year (expressed in cents per share) 7 13.2 17.1 The accompanying notes are an integral part of these consolidated and carve-out financial statements. 4
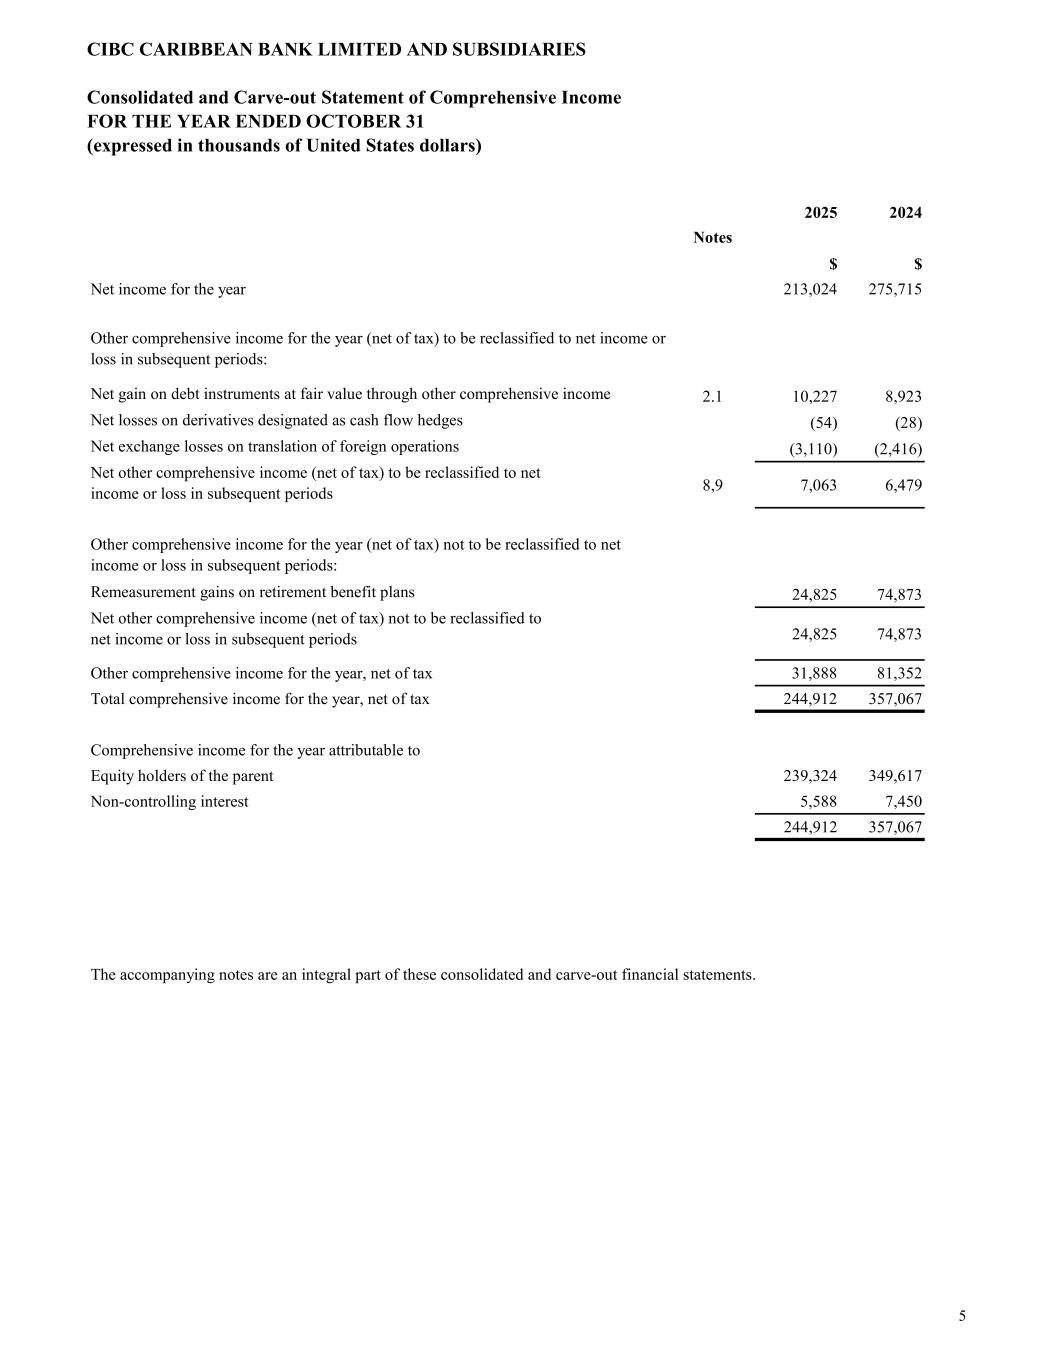
CIBC CARIBBEAN BANK LIMITED AND SUBSIDIARIES Consolidated and Carve-out Statement of Comprehensive Income FOR THE YEAR ENDED OCTOBER 31 (expressed in thousands of United States dollars) 2025 2024 $ $ Net income for the year 213,024 275,715 Net gain on debt instruments at fair value through other comprehensive income 2.1 10,227 8,923 Net losses on derivatives designated as cash flow hedges (54) (28) Net exchange losses on translation of foreign operations (3,110) (2,416) 8,9 7,063 6,479 Remeasurement gains on retirement benefit plans 24,825 74,873 24,825 74,873 Other comprehensive income for the year, net of tax 31,888 81,352 Total comprehensive income for the year, net of tax 244,912 357,067 Comprehensive income for the year attributable to Equity holders of the parent 239,324 349,617 Non-controlling interest 5,588 7,450 244,912 357,067 The accompanying notes are an integral part of these consolidated and carve-out financial statements. Notes Other comprehensive income for the year (net of tax) to be reclassified to net income or loss in subsequent periods: Net other comprehensive income (net of tax) to be reclassified to net income or loss in subsequent periods Other comprehensive income for the year (net of tax) not to be reclassified to net income or loss in subsequent periods: Net other comprehensive income (net of tax) not to be reclassified to net income or loss in subsequent periods 5
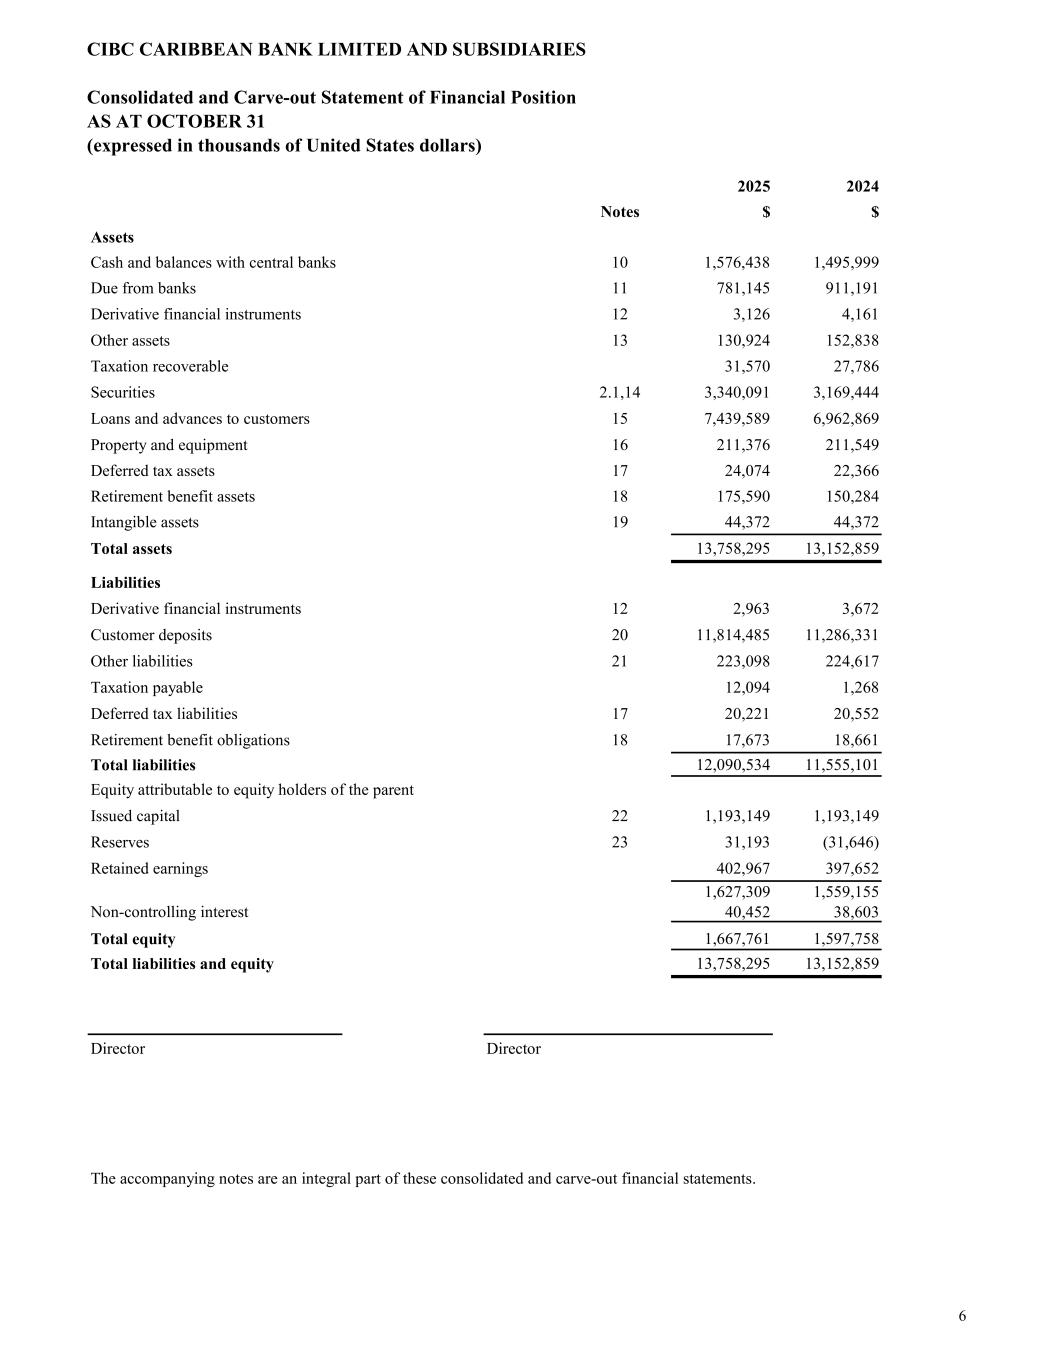
CIBC CARIBBEAN BANK LIMITED AND SUBSIDIARIES Consolidated and Carve-out Statement of Financial Position AS AT OCTOBER 31 (expressed in thousands of United States dollars) 2025 2024 Notes $ $ Assets Cash and balances with central banks 10 1,576,438 1,495,999 Due from banks 11 781,145 911,191 Derivative financial instruments 12 3,126 4,161 Other assets 13 130,924 152,838 Taxation recoverable 31,570 27,786 Securities 2.1,14 3,340,091 3,169,444 Loans and advances to customers 15 7,439,589 6,962,869 Property and equipment 16 211,376 211,549 Deferred tax assets 17 24,074 22,366 Retirement benefit assets 18 175,590 150,284 Intangible assets 19 44,372 44,372 Total assets 13,758,295 13,152,859 Liabilities Derivative financial instruments 12 2,963 3,672 Customer deposits 20 11,814,485 11,286,331 Other liabilities 21 223,098 224,617 Taxation payable 12,094 1,268 Deferred tax liabilities 17 20,221 20,552 Retirement benefit obligations 18 17,673 18,661 Total liabilities 12,090,534 11,555,101 Equity attributable to equity holders of the parent Issued capital 22 1,193,149 1,193,149 Reserves 23 31,193 (31,646) Retained earnings 402,967 397,652 1,627,309 1,559,155 Non-controlling interest 40,452 38,603 Total equity 1,667,761 1,597,758 Total liabilities and equity 13,758,295 13,152,859 Director Director The accompanying notes are an integral part of these consolidated and carve-out financial statements. 6
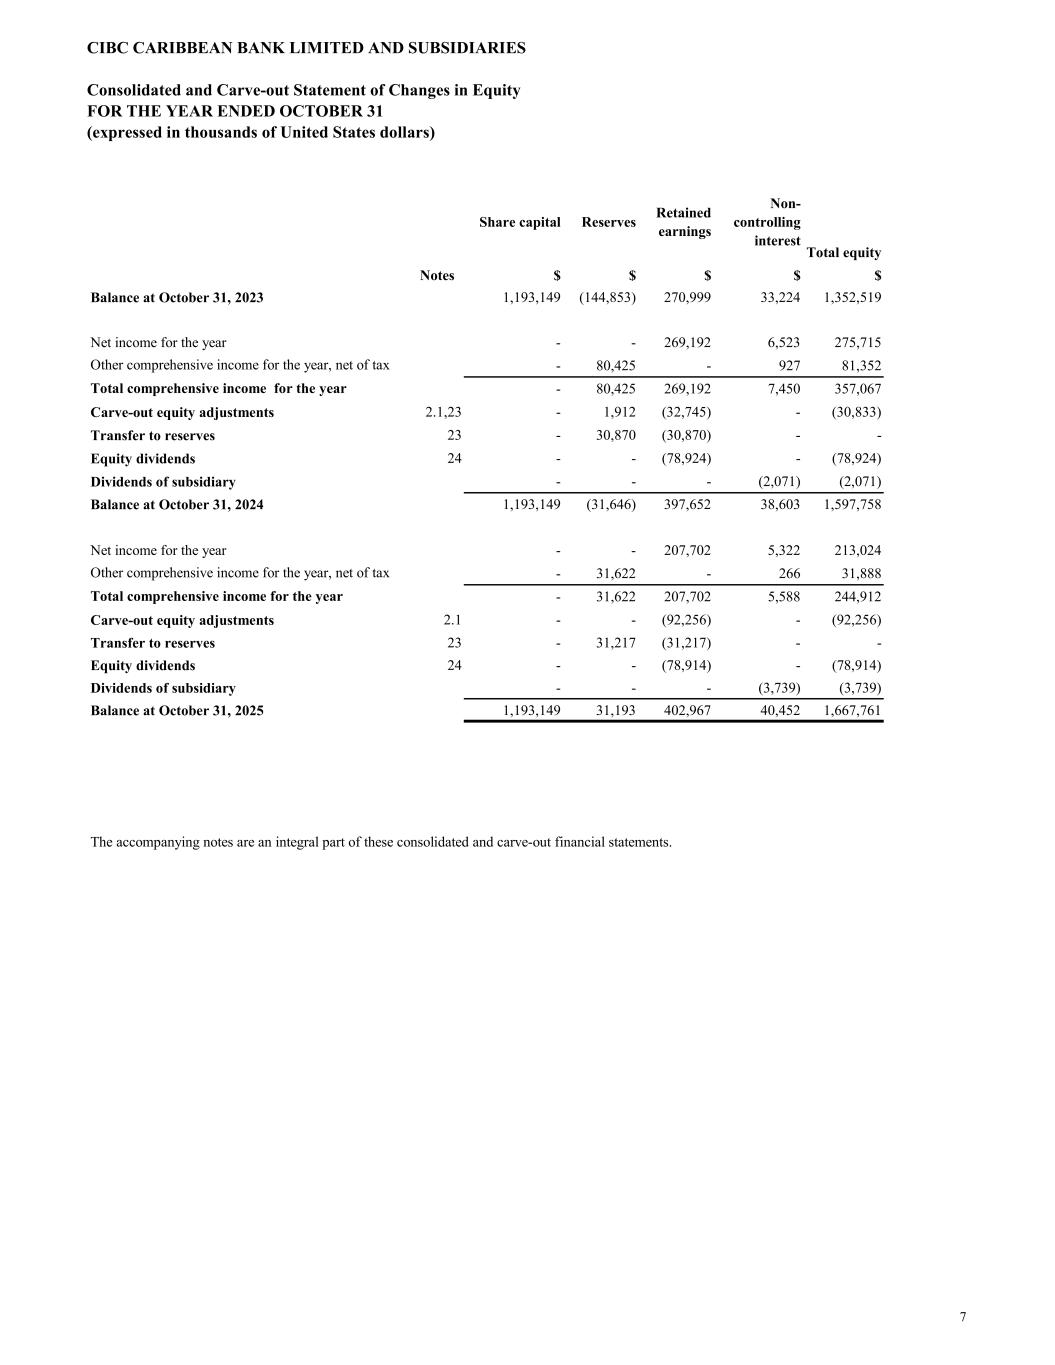
CIBC CARIBBEAN BANK LIMITED AND SUBSIDIARIES Consolidated and Carve-out Statement of Changes in Equity FOR THE YEAR ENDED OCTOBER 31 (expressed in thousands of United States dollars) Notes $ $ $ $ $ Balance at October 31, 2023 1,193,149 (144,853) 270,999 33,224 1,352,519 Net income for the year - - 269,192 6,523 275,715 - 80,425 - 927 81,352 - 80,425 269,192 7,450 357,067 Carve-out equity adjustments 2.1,23 - 1,912 (32,745) - (30,833) Transfer to reserves 23 - 30,870 (30,870) - - Equity dividends 24 - - (78,924) - (78,924) Dividends of subsidiary - - - (2,071) (2,071) Balance at October 31, 2024 1,193,149 (31,646) 397,652 38,603 1,597,758 Net income for the year - - 207,702 5,322 213,024 - 31,622 - 266 31,888 - 31,622 207,702 5,588 244,912 Carve-out equity adjustments 2.1 - - (92,256) - (92,256) Transfer to reserves 23 - 31,217 (31,217) - - Equity dividends 24 - - (78,914) - (78,914) Dividends of subsidiary - - - (3,739) (3,739) Balance at October 31, 2025 1,193,149 31,193 402,967 40,452 1,667,761 The accompanying notes are an integral part of these consolidated and carve-out financial statements. Other comprehensive income for the year, net of tax Total comprehensive income for the year Other comprehensive income for the year, net of tax Total comprehensive income for the year Non- controlling interest Total equity Share capital Reserves Retained earnings 7
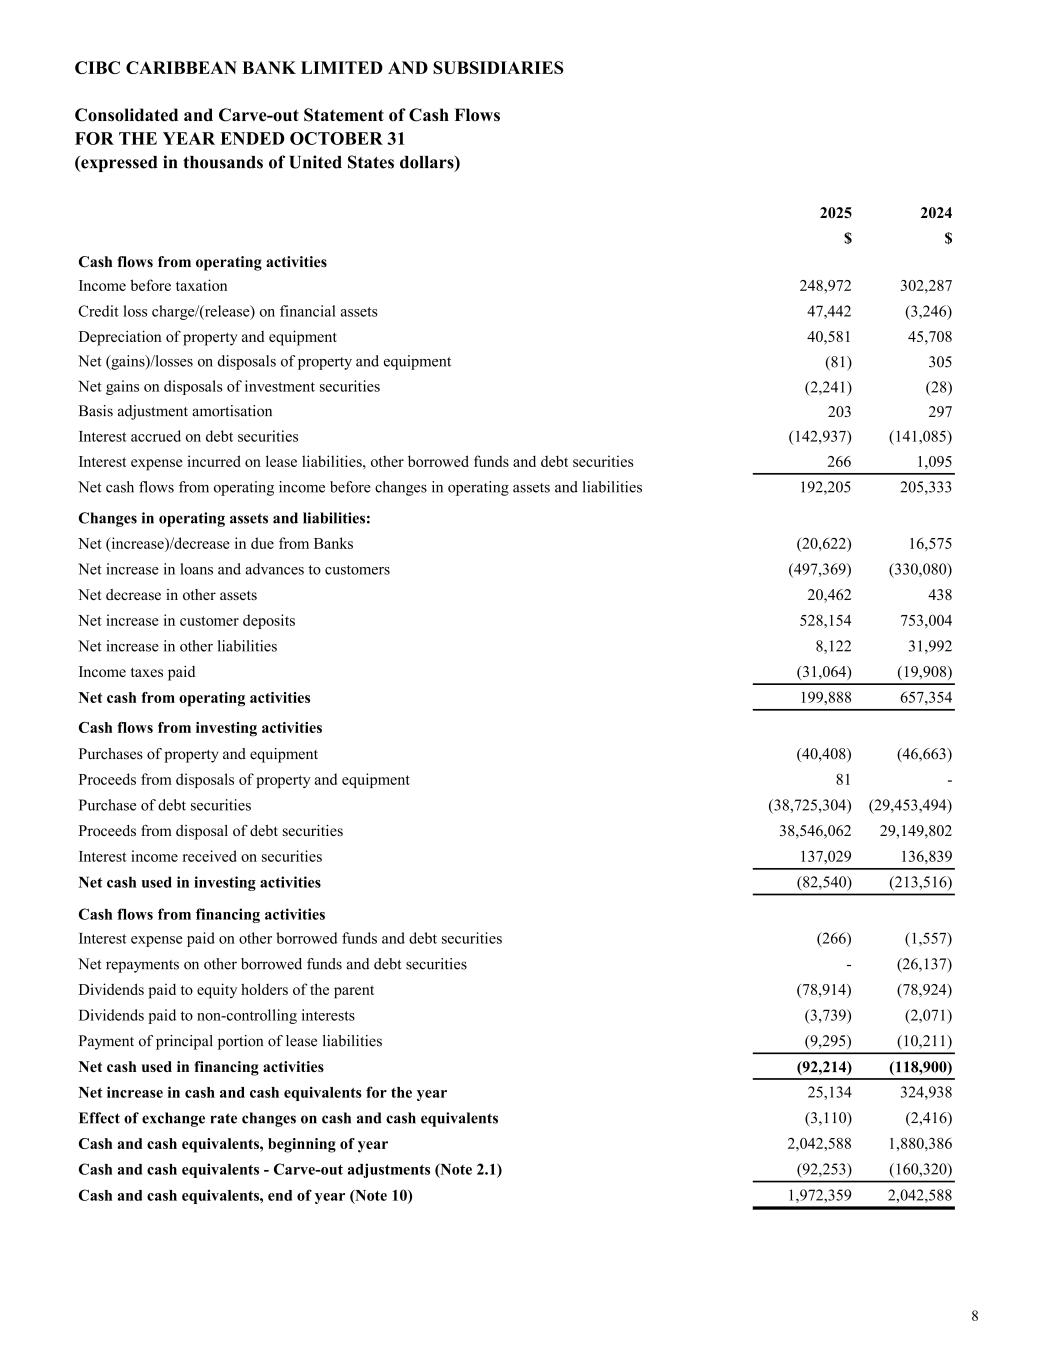
CIBC CARIBBEAN BANK LIMITED AND SUBSIDIARIES Consolidated and Carve-out Statement of Cash Flows FOR THE YEAR ENDED OCTOBER 31 (expressed in thousands of United States dollars) 2025 2024 $ $ Cash flows from operating activities Income before taxation 248,972 302,287 Credit loss charge/(release) on financial assets 47,442 (3,246) Depreciation of property and equipment 40,581 45,708 (81) 305 (2,241) (28) 203 297 Interest accrued on debt securities (142,937) (141,085) Interest expense incurred on lease liabilities, other borrowed funds and debt securities 266 1,095 Net cash flows from operating income before changes in operating assets and liabilities 192,205 205,333 Changes in operating assets and liabilities: Net (increase)/decrease in due from Banks (20,622) 16,575 Net increase in loans and advances to customers (497,369) (330,080) Net decrease in other assets 20,462 438 Net increase in customer deposits 528,154 753,004 Net increase in other liabilities 8,122 31,992 Income taxes paid (31,064) (19,908) Net cash from operating activities 199,888 657,354 Purchases of property and equipment (40,408) (46,663) Proceeds from disposals of property and equipment 81 - Purchase of debt securities (38,725,304) (29,453,494) Proceeds from disposal of debt securities 38,546,062 29,149,802 Interest income received on securities 137,029 136,839 Net cash used in investing activities (82,540) (213,516) Interest expense paid on other borrowed funds and debt securities (266) (1,557) Net repayments on other borrowed funds and debt securities - (26,137) Dividends paid to equity holders of the parent (78,914) (78,924) Dividends paid to non-controlling interests (3,739) (2,071) Payment of principal portion of lease liabilities (9,295) (10,211) Net cash used in financing activities (92,214) (118,900) Net increase in cash and cash equivalents for the year 25,134 324,938 Effect of exchange rate changes on cash and cash equivalents (3,110) (2,416) Cash and cash equivalents, beginning of year 2,042,588 1,880,386 Cash and cash equivalents - Carve-out adjustments (Note 2.1) (92,253) (160,320) Cash and cash equivalents, end of year (Note 10) 1,972,359 2,042,588 Cash flows from financing activities Net (gains)/losses on disposals of property and equipment Basis adjustment amortisation Net gains on disposals of investment securities Cash flows from investing activities 8
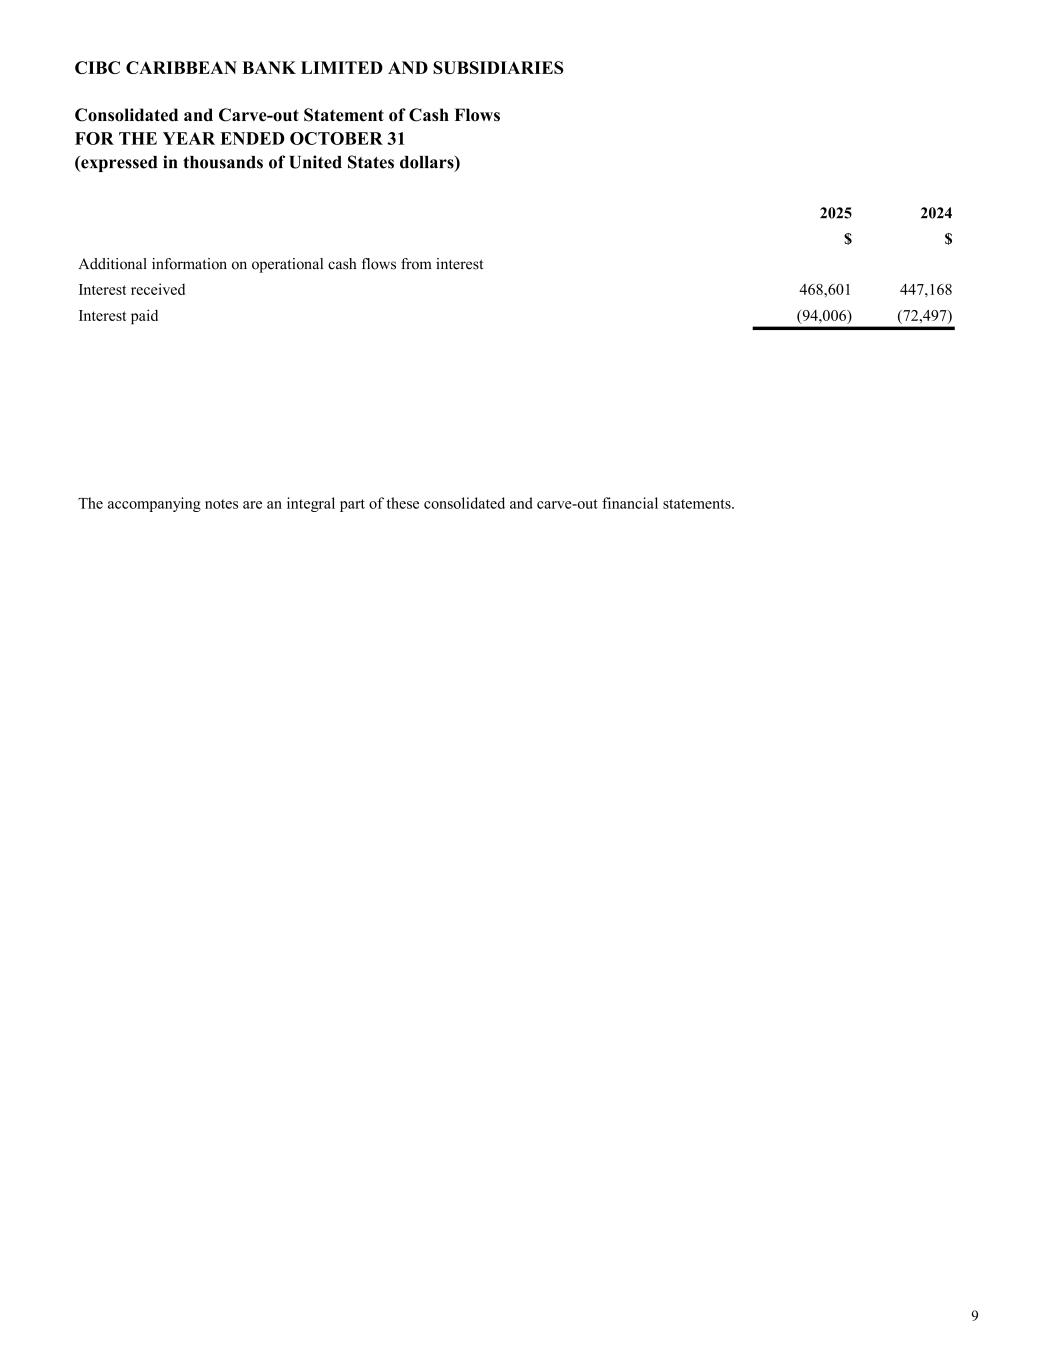
CIBC CARIBBEAN BANK LIMITED AND SUBSIDIARIES Consolidated and Carve-out Statement of Cash Flows FOR THE YEAR ENDED OCTOBER 31 (expressed in thousands of United States dollars) 2025 2024 $ $ Additional information on operational cash flows from interest Interest received 468,601 447,168 Interest paid (94,006) (72,497) The accompanying notes are an integral part of these consolidated and carve-out financial statements. 9
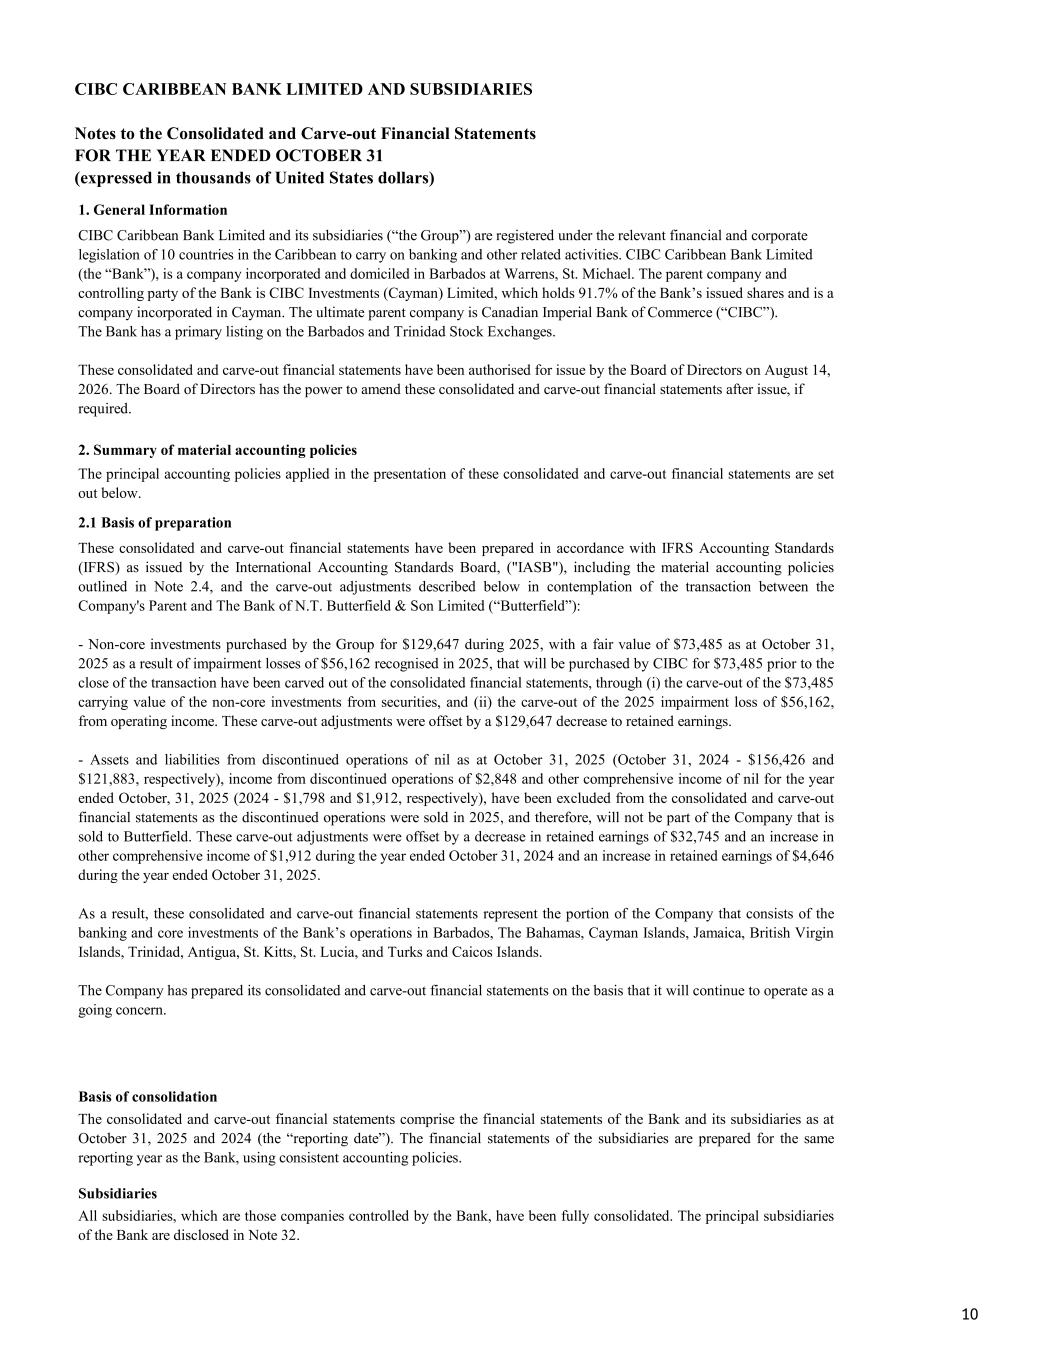
CIBC CARIBBEAN BANK LIMITED AND SUBSIDIARIES Notes to the Consolidated and Carve-out Financial Statements FOR THE YEAR ENDED OCTOBER 31 (expressed in thousands of United States dollars) CIBC Caribbean Bank Limited and its subsidiaries (“the Group”) are registered under the relevant financial and corporate legislation of 10 countries in the Caribbean to carry on banking and other related activities. CIBC Caribbean Bank Limited (the “Bank”), is a company incorporated and domiciled in Barbados at Warrens, St. Michael. The parent company and controlling party of the Bank is CIBC Investments (Cayman) Limited, which holds 91.7% of the Bank’s issued shares and is a company incorporated in Cayman. The ultimate parent company is Canadian Imperial Bank of Commerce (“CIBC”). The Bank has a primary listing on the Barbados and Trinidad Stock Exchanges. These consolidated and carve-out financial statements have been authorised for issue by the Board of Directors on August 14, 2026. The Board of Directors has the power to amend these consolidated and carve-out financial statements after issue, if required. 2. Summary of material accounting policies 1. General Information The principal accounting policies applied in the presentation of these consolidated and carve-out financial statements are set out below. The consolidated and carve-out financial statements comprise the financial statements of the Bank and its subsidiaries as at October 31, 2025 and 2024 (the “reporting date”). The financial statements of the subsidiaries are prepared for the same reporting year as the Bank, using consistent accounting policies. All subsidiaries, which are those companies controlled by the Bank, have been fully consolidated. The principal subsidiaries of the Bank are disclosed in Note 32. 2.1 Basis of preparation Basis of consolidation Subsidiaries These consolidated and carve-out financial statements have been prepared in accordance with IFRS Accounting Standards (IFRS) as issued by the International Accounting Standards Board, ("IASB"), including the material accounting policies outlined in Note 2.4, and the carve-out adjustments described below in contemplation of the transaction between the Company's Parent and The Bank of N.T. Butterfield & Son Limited (“Butterfield”): - Non‑core investments purchased by the Group for $129,647 during 2025, with a fair value of $73,485 as at October 31, 2025 as a result of impairment losses of $56,162 recognised in 2025, that will be purchased by CIBC for $73,485 prior to the close of the transaction have been carved out of the consolidated financial statements, through (i) the carve-out of the $73,485 carrying value of the non‑core investments from securities, and (ii) the carve-out of the 2025 impairment loss of $56,162, from operating income. These carve-out adjustments were offset by a $129,647 decrease to retained earnings. - Assets and liabilities from discontinued operations of nil as at October 31, 2025 (October 31, 2024 - $156,426 and $121,883, respectively), income from discontinued operations of $2,848 and other comprehensive income of nil for the year ended October, 31, 2025 (2024 - $1,798 and $1,912, respectively), have been excluded from the consolidated and carve-out financial statements as the discontinued operations were sold in 2025, and therefore, will not be part of the Company that is sold to Butterfield. These carve-out adjustments were offset by a decrease in retained earnings of $32,745 and an increase in other comprehensive income of $1,912 during the year ended October 31, 2024 and an increase in retained earnings of $4,646 during the year ended October 31, 2025. As a result, these consolidated and carve-out financial statements represent the portion of the Company that consists of the banking and core investments of the Bank’s operations in Barbados, The Bahamas, Cayman Islands, Jamaica, British Virgin Islands, Trinidad, Antigua, St. Kitts, St. Lucia, and Turks and Caicos Islands. The Company has prepared its consolidated and carve-out financial statements on the basis that it will continue to operate as a going concern. 10
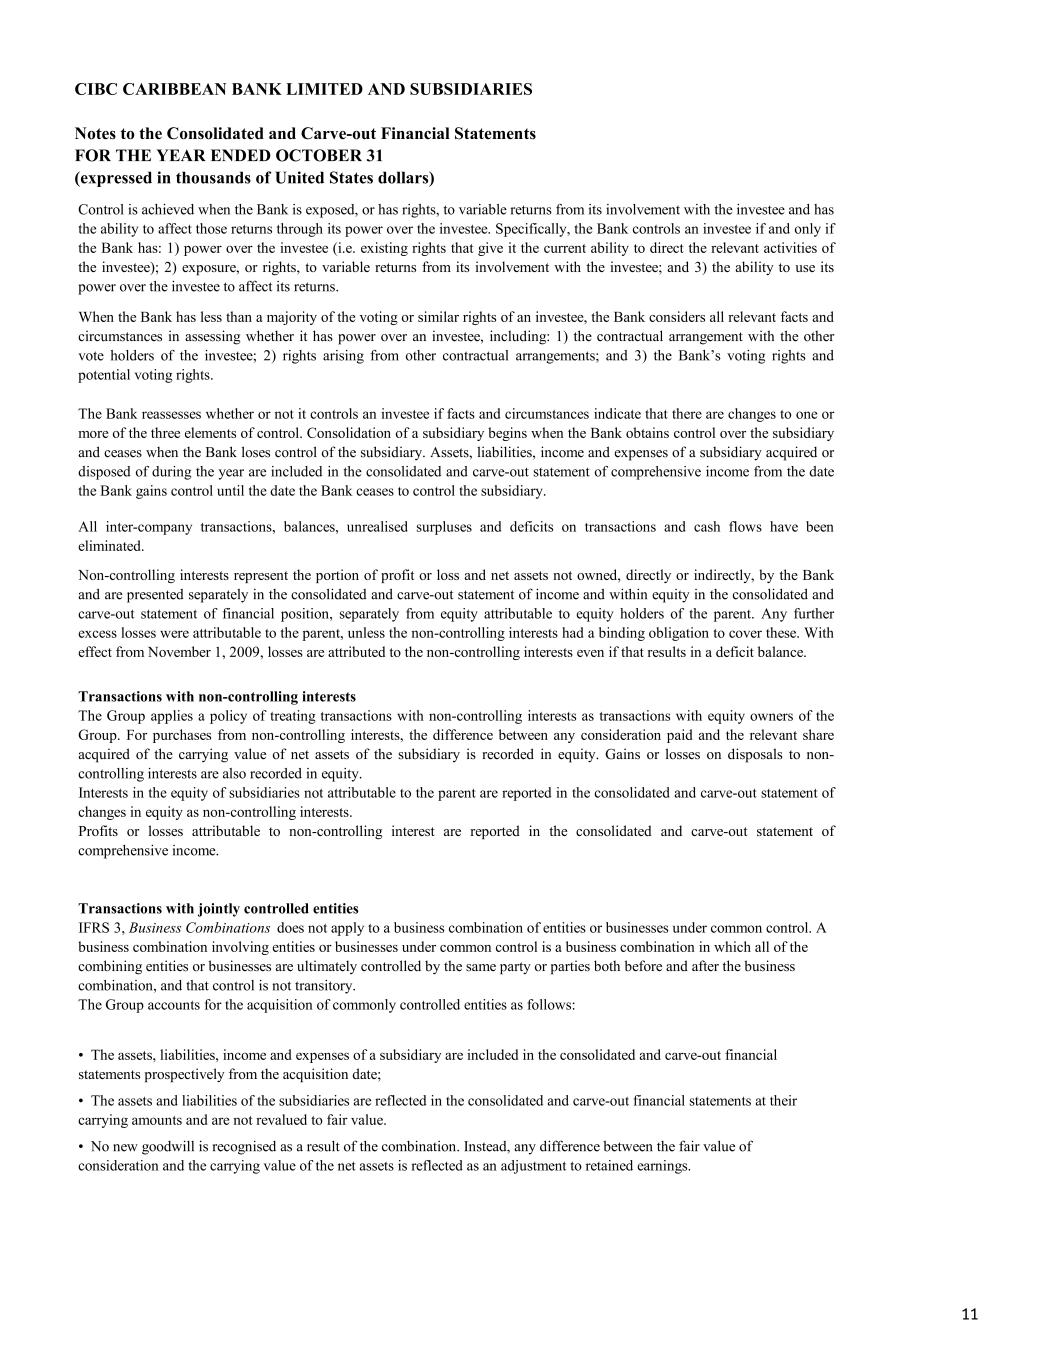
CIBC CARIBBEAN BANK LIMITED AND SUBSIDIARIES Notes to the Consolidated and Carve-out Financial Statements FOR THE YEAR ENDED OCTOBER 31 (expressed in thousands of United States dollars) Control is achieved when the Bank is exposed, or has rights, to variable returns from its involvement with the investee and has the ability to affect those returns through its power over the investee. Specifically, the Bank controls an investee if and only if the Bank has: 1) power over the investee (i.e. existing rights that give it the current ability to direct the relevant activities of the investee); 2) exposure, or rights, to variable returns from its involvement with the investee; and 3) the ability to use its power over the investee to affect its returns. When the Bank has less than a majority of the voting or similar rights of an investee, the Bank considers all relevant facts and circumstances in assessing whether it has power over an investee, including: 1) the contractual arrangement with the other vote holders of the investee; 2) rights arising from other contractual arrangements; and 3) the Bank’s voting rights and potential voting rights. The Bank reassesses whether or not it controls an investee if facts and circumstances indicate that there are changes to one or more of the three elements of control. Consolidation of a subsidiary begins when the Bank obtains control over the subsidiary and ceases when the Bank loses control of the subsidiary. Assets, liabilities, income and expenses of a subsidiary acquired or disposed of during the year are included in the consolidated and carve-out statement of comprehensive income from the date the Bank gains control until the date the Bank ceases to control the subsidiary. All inter-company transactions, balances, unrealised surpluses and deficits on transactions and cash flows have been eliminated. Non-controlling interests represent the portion of profit or loss and net assets not owned, directly or indirectly, by the Bank and are presented separately in the consolidated and carve-out statement of income and within equity in the consolidated and carve-out statement of financial position, separately from equity attributable to equity holders of the parent. Any further excess losses were attributable to the parent, unless the non-controlling interests had a binding obligation to cover these. With effect from November 1, 2009, losses are attributed to the non-controlling interests even if that results in a deficit balance. Transactions with non-controlling interests The Group applies a policy of treating transactions with non-controlling interests as transactions with equity owners of the Group. For purchases from non-controlling interests, the difference between any consideration paid and the relevant share acquired of the carrying value of net assets of the subsidiary is recorded in equity. Gains or losses on disposals to non- controlling interests are also recorded in equity. Interests in the equity of subsidiaries not attributable to the parent are reported in the consolidated and carve-out statement of changes in equity as non-controlling interests. Profits or losses attributable to non-controlling interest are reported in the consolidated and carve-out statement of comprehensive income. • No new goodwill is recognised as a result of the combination. Instead, any difference between the fair value of consideration and the carrying value of the net assets is reflected as an adjustment to retained earnings. • The assets, liabilities, income and expenses of a subsidiary are included in the consolidated and carve-out financial statements prospectively from the acquisition date; • The assets and liabilities of the subsidiaries are reflected in the consolidated and carve-out financial statements at their carrying amounts and are not revalued to fair value. Transactions with jointly controlled entities IFRS 3, Business Combinations does not apply to a business combination of entities or businesses under common control. A business combination involving entities or businesses under common control is a business combination in which all of the combining entities or businesses are ultimately controlled by the same party or parties both before and after the business combination, and that control is not transitory. The Group accounts for the acquisition of commonly controlled entities as follows: 11
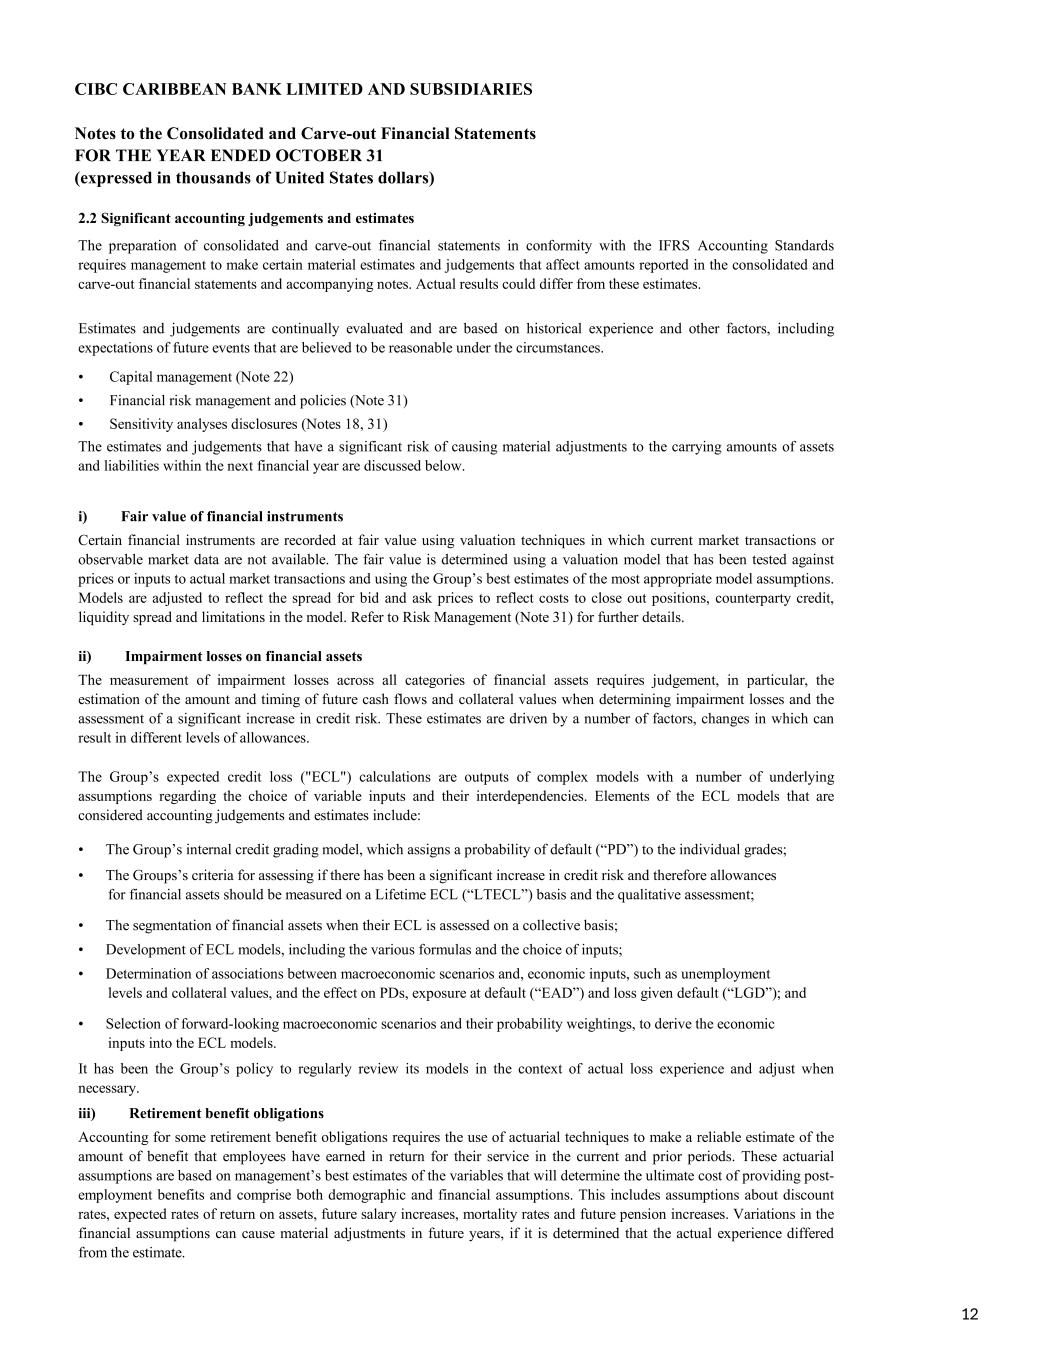
CIBC CARIBBEAN BANK LIMITED AND SUBSIDIARIES Notes to the Consolidated and Carve-out Financial Statements FOR THE YEAR ENDED OCTOBER 31 (expressed in thousands of United States dollars) 2.2 Significant accounting judgements and estimates Accounting for some retirement benefit obligations requires the use of actuarial techniques to make a reliable estimate of the amount of benefit that employees have earned in return for their service in the current and prior periods. These actuarial assumptions are based on management’s best estimates of the variables that will determine the ultimate cost of providing post- employment benefits and comprise both demographic and financial assumptions. This includes assumptions about discount rates, expected rates of return on assets, future salary increases, mortality rates and future pension increases. Variations in the financial assumptions can cause material adjustments in future years, if it is determined that the actual experience differed from the estimate. The preparation of consolidated and carve-out financial statements in conformity with the IFRS Accounting Standards requires management to make certain material estimates and judgements that affect amounts reported in the consolidated and carve-out financial statements and accompanying notes. Actual results could differ from these estimates. Estimates and judgements are continually evaluated and are based on historical experience and other factors, including expectations of future events that are believed to be reasonable under the circumstances. ii) Impairment losses on financial assets The Group’s expected credit loss ("ECL") calculations are outputs of complex models with a number of underlying assumptions regarding the choice of variable inputs and their interdependencies. Elements of the ECL models that are considered accounting judgements and estimates include: The estimates and judgements that have a significant risk of causing material adjustments to the carrying amounts of assets and liabilities within the next financial year are discussed below. • Capital management (Note 22) • Financial risk management and policies (Note 31) • Sensitivity analyses disclosures (Notes 18, 31) Certain financial instruments are recorded at fair value using valuation techniques in which current market transactions or observable market data are not available. The fair value is determined using a valuation model that has been tested against prices or inputs to actual market transactions and using the Group’s best estimates of the most appropriate model assumptions. Models are adjusted to reflect the spread for bid and ask prices to reflect costs to close out positions, counterparty credit, liquidity spread and limitations in the model. Refer to Risk Management (Note 31) for further details. • The Group’s internal credit grading model, which assigns a probability of default (“PD”) to the individual grades; • The Groups’s criteria for assessing if there has been a significant increase in credit risk and therefore allowances for financial assets should be measured on a Lifetime ECL (“LTECL”) basis and the qualitative assessment; i) Fair value of financial instruments • The segmentation of financial assets when their ECL is assessed on a collective basis; • Development of ECL models, including the various formulas and the choice of inputs; • Determination of associations between macroeconomic scenarios and, economic inputs, such as unemployment levels and collateral values, and the effect on PDs, exposure at default (“EAD”) and loss given default (“LGD”); and • Selection of forward-looking macroeconomic scenarios and their probability weightings, to derive the economic inputs into the ECL models. The measurement of impairment losses across all categories of financial assets requires judgement, in particular, the estimation of the amount and timing of future cash flows and collateral values when determining impairment losses and the assessment of a significant increase in credit risk. These estimates are driven by a number of factors, changes in which can result in different levels of allowances. It has been the Group’s policy to regularly review its models in the context of actual loss experience and adjust when necessary. iii) Retirement benefit obligations 12
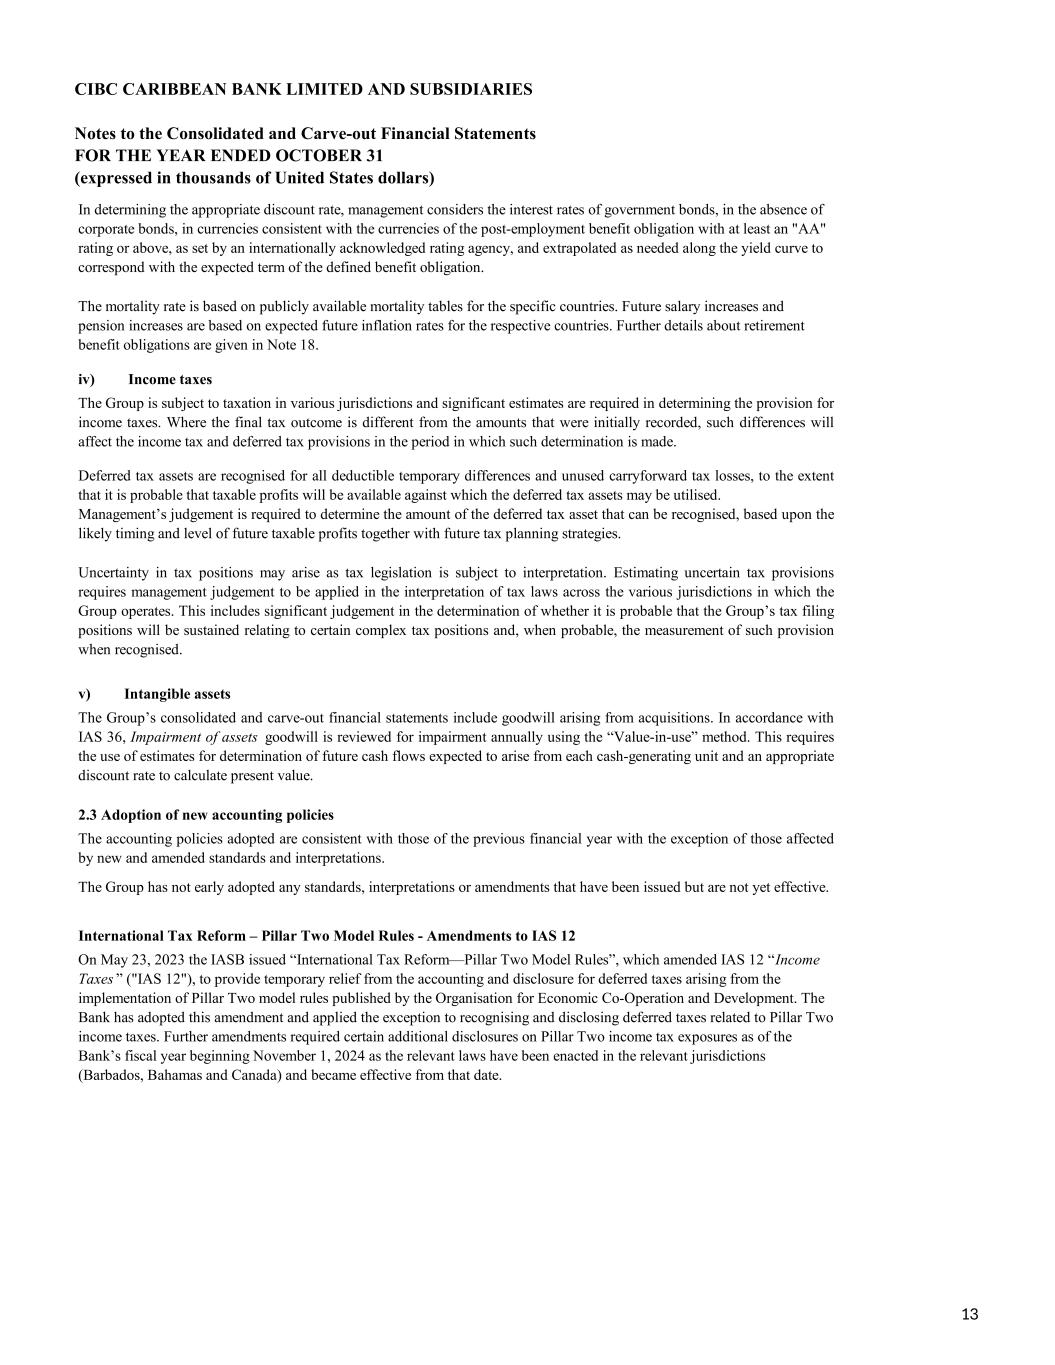
CIBC CARIBBEAN BANK LIMITED AND SUBSIDIARIES Notes to the Consolidated and Carve-out Financial Statements FOR THE YEAR ENDED OCTOBER 31 (expressed in thousands of United States dollars) In determining the appropriate discount rate, management considers the interest rates of government bonds, in the absence of corporate bonds, in currencies consistent with the currencies of the post-employment benefit obligation with at least an "AA" rating or above, as set by an internationally acknowledged rating agency, and extrapolated as needed along the yield curve to correspond with the expected term of the defined benefit obligation. On May 23, 2023 the IASB issued “International Tax Reform—Pillar Two Model Rules”, which amended IAS 12 “Income Taxes ” ("IAS 12"), to provide temporary relief from the accounting and disclosure for deferred taxes arising from the implementation of Pillar Two model rules published by the Organisation for Economic Co-Operation and Development. The Bank has adopted this amendment and applied the exception to recognising and disclosing deferred taxes related to Pillar Two income taxes. Further amendments required certain additional disclosures on Pillar Two income tax exposures as of the Bank’s fiscal year beginning November 1, 2024 as the relevant laws have been enacted in the relevant jurisdictions (Barbados, Bahamas and Canada) and became effective from that date. The Group has not early adopted any standards, interpretations or amendments that have been issued but are not yet effective. International Tax Reform – Pillar Two Model Rules - Amendments to IAS 12 The mortality rate is based on publicly available mortality tables for the specific countries. Future salary increases and pension increases are based on expected future inflation rates for the respective countries. Further details about retirement benefit obligations are given in Note 18. iv) Income taxes The Group is subject to taxation in various jurisdictions and significant estimates are required in determining the provision for income taxes. Where the final tax outcome is different from the amounts that were initially recorded, such differences will affect the income tax and deferred tax provisions in the period in which such determination is made. Deferred tax assets are recognised for all deductible temporary differences and unused carryforward tax losses, to the extent that it is probable that taxable profits will be available against which the deferred tax assets may be utilised. Management’s judgement is required to determine the amount of the deferred tax asset that can be recognised, based upon the likely timing and level of future taxable profits together with future tax planning strategies. Uncertainty in tax positions may arise as tax legislation is subject to interpretation. Estimating uncertain tax provisions requires management judgement to be applied in the interpretation of tax laws across the various jurisdictions in which the Group operates. This includes significant judgement in the determination of whether it is probable that the Group’s tax filing positions will be sustained relating to certain complex tax positions and, when probable, the measurement of such provision when recognised. v) Intangible assets The Group’s consolidated and carve-out financial statements include goodwill arising from acquisitions. In accordance with IAS 36, Impairment of assets goodwill is reviewed for impairment annually using the “Value-in-use” method. This requires the use of estimates for determination of future cash flows expected to arise from each cash-generating unit and an appropriate discount rate to calculate present value. 2.3 Adoption of new accounting policies The accounting policies adopted are consistent with those of the previous financial year with the exception of those affected by new and amended standards and interpretations. 13
CIBC CARIBBEAN BANK LIMITED AND SUBSIDIARIES Notes to the Consolidated and Carve-out Financial Statements FOR THE YEAR ENDED OCTOBER 31 (expressed in thousands of United States dollars) 2.4 Summary of material accounting policies Foreign currency translation i) Transactions and balances ii) Group companies On consolidation, exchange differences arising from the translation of the net investment in foreign operations, and of borrowings and other currency instruments designated as hedges of such investments, are taken to other comprehensive income. When a foreign operation is sold, the component of other comprehensive income relating to that particular foreign operation is recognised in the consolidated and carve-out statement of income as part of the gain or loss on sale. The Group uses derivative financial instruments such as forward currency contracts and interest rate swaps to manage its foreign currency risks and interest rate risks, respectively. Such derivative financial instruments are initially recognised at fair value on the date on which a derivative contract is entered into and are subsequently remeasured at fair value. The results and financial position of all Group entities, which have a functional currency different from the presentation currency are translated into the presentation currency as follows: Each entity in the Group determines its own functional currency, and items included in the financial statements of each entity are measured using that currency. The functional currency of the Bank is the United States dollar, and the consolidated and carve-out financial statements are presented in United States dollars as this currency is universally accepted and recognised in all the territories in which the Group operates. Transactions in foreign currencies are initially recorded by the Group entities at their respective functional currency rates prevailing at the date of the transaction. Monetary assets and liabilities denominated in foreign currencies are translated into the functional currency at rates prevailing at the reporting date, and non-monetary assets and liabilities are translated at historic rates. Revenue and expenses denominated in foreign currencies are translated into the Bank’s functional currency and then converted to the Group’s presentation currency using prevailing average monthly exchange rates. Realised and unrealised gains and losses on foreign currency positions are reported in income of the current year. Translation differences on non- monetary items, such as equities classified as debt securities at FVOCI, are included in the debt securities revaluation reserve in total comprehensive income. b) Income and expenses for each consolidated and carve-out statement of comprehensive income or consolidated and carve- out statement of income presented are translated at average exchange rates (unless this average is not a reasonable approximation of the cumulative effect of the rates prevailing on the transaction dates, in which case income and expenses are translated at the dates of the transactions); and c) All resulting exchange differences are recognised in other comprehensive income. Derivative financial instruments and hedge accounting a) Assets and liabilities for each statement of financial position presented are translated at the closing rate at the reporting date. Derivatives are carried as financial assets when the fair value is positive and as financial liabilities when the fair value is negative. Any gains or losses arising from changes in fair value on derivatives are taken directly to the consolidated and carve- out statement of income, except for the effective portion of cash flow hedges, which is recognised in other comprehensive income. For the purpose of hedge accounting, hedges are classified as: The principal accounting policies applied in the preparation of these consolidated and carve-out financial statements are set out below: • Fair value hedges when hedging the exposure to changes in the fair value of a recognised asset or liability or an unrecognised firm commitment (except for foreign currency risk). 14
CIBC CARIBBEAN BANK LIMITED AND SUBSIDIARIES Notes to the Consolidated and Carve-out Financial Statements FOR THE YEAR ENDED OCTOBER 31 (expressed in thousands of United States dollars) Interest income and expense We designate cash flow hedges as part of interest rate risk management strategies that use derivatives to mitigate our risk from variable cash flows by effectively converting certain variable-rate financial instruments to fixed-rate financial instruments. • The Group elected, as a policy choice permitted under IFRS 9, Financial Instruments ("IFRS 9"), to continue to apply hedge accounting in accordance with IAS 39. • Differences in timing of cash flows of hedged items and hedging instruments • Different interest rate curves applied to discount the hedged items and hedging instruments Fair value hedge For hedging relationships which are designated and qualify as fair value hedges and that prove to be highly effective in relation to the hedged risk, changes in the fair value of the derivatives are recorded in the consolidated and carve-out statement of income, along with the corresponding change in fair value of the hedged asset or liability that is attributable to that specific hedged risk. If the hedge no longer meets the criteria for hedge accounting, an adjustment to the carrying amount of a hedged interest-bearing financial instrument is amortised to net profit or loss over the remaining period to maturity. Cash flow hedge The effective portion of changes in the fair value of derivatives that are designated and qualify as cash flow hedges is recognised in other comprehensive income. The gain or loss relating to the ineffective portion is recognised immediately in the consolidated and carve-out statement of income. Amounts accumulated in other comprehensive income are recycled to the consolidated and carve-out statement of income in the periods in which the hedged item will affect profit or loss (for example, when the forecast sale that is hedged takes place). When a hedging instrument expires or is sold, or when a hedge no longer meets the criteria for hedge accounting, any cumulative gain or loss existing in other comprehensive income at that time remains in other comprehensive income and is recognised when the forecast transaction is ultimately recognised in the consolidated and carve-out statement of income. When a forecast transaction is no longer expected to occur, the cumulative gain or loss that was reported in other comprehensive income is immediately transferred to the consolidated and carve-out statement of income. Certain derivative instruments do not qualify for hedge accounting or are not so designated, and changes in the fair value of these derivatives are included in net trading gains or losses within operating income. Interest income and expense are recorded using the effective interest rate ("EIR") method for all financial instruments measured at amortised cost and financial instruments designated at fair value through profit or loss ("FVPL"). Interest income on financial assets measured at fair value through other comprehensive income ("FVOCI") are also recorded by using the EIR method. The EIR is the rate that exactly discounts estimated future cash receipts through the expected life of the financial instrument or, when appropriate, a shorter period, to the net carrying amount of the financial asset. When calculating the EIR, we estimate future cash flows considering all contractual terms of the financial instrument, but not future credit losses. • Derivatives used as hedging instruments having a non-nil fair value at the time of designation • The effect of changes in counterparties’ credit risk on the fair values of hedging instruments or hedged items Hedges, which meet the Group’s strict criteria for hedge accounting, are accounted for as follows: At the inception of a hedge relationship, the Group formally designates and documents the hedge relationship to which the Group wishes to apply hedge accounting and the risk management objective and strategy for undertaking the hedge. The documentation includes identification of the hedging instrument, the hedged item or transaction, the nature of the risk being hedged and how the entity will assess the effectiveness of changes in the hedging instrument’s fair value in offsetting the exposure to changes in the hedged item’s fair value or cash flows attributable to the hedged risk. Such hedges are expected to be highly effective in achieving offsetting changes in fair value or cash flows and are assessed at inception and on a monthly basis to determine that they actually have been highly effective throughout the financial reporting periods for which they were designated. A hedge is considered to be highly effective if the changes in fair value or cash flows attributable to the hedged risk are expected to be offset by the hedging instrument in a range of 80% to 125%. Hedge ineffectiveness can arise from: • Cash flow hedges when hedging exposure to variability in cash flows that is either attributable to a particular risk associated with a recognised asset or liability or a highly probable forecast transaction or the foreign currency risk in an unrecognised firm commitment. 15
CIBC CARIBBEAN BANK LIMITED AND SUBSIDIARIES Notes to the Consolidated and Carve-out Financial Statements FOR THE YEAR ENDED OCTOBER 31 (expressed in thousands of United States dollars) Fees and commission income Underwriting and advisory fees are earned on debt and equity securities placements and transaction-based advisory services. Underwriting fees are typically recognised at the point in time when the transaction is completed. Advisory fees are generally recognised as revenue over the period of the engagement as the related services are provided or at the point in time when the transaction is completed. Credit services fees consist of loan syndication fees, loan commitment fees, negotiation and collection fees, credit advisory fees, letters of credit and guarantees and bonds fees. Credit fees are generally recognised over the period that the related services are provided, except for loan syndication fees, which are typically recognised at the point in time that the financing placement is completed. Letters of credit and guarantees and bonds fees are charged annually and cover a one-year period starting on the date that the contract was first issued. Card fees primarily include interchange income, over limit fees, cash advance fees, and annual fees. Card fees are recognised at the point in time the related services are provided, except for annual fees, which are recognised over the 12-month period to which they relate. The cost of credit card loyalty points is recognised as a reduction of interchange income when the loyalty points are issued for both self-managed and third-party loyalty points programs. Credit card loyalty point liabilities are recognised for self-managed loyalty point programs and are subject to periodic remeasurement to reflect the expected cost of redemption as this expectation changes over time. The EIR (and therefore, the amortised cost of the asset) is calculated by taking into account any discount or premium on acquisition, fees and costs that are an integral part of the EIR. The Bank recognises interest income using a rate of return that represents the best estimate of a constant rate of return over the expected life of the loan. Hence, it recognises the effect of potentially different interest rates charged at various stages, and other characteristics of the product life cycle (including prepayments, penalty interest and charges). If expectations regarding the cash flows on the financial asset are revised for reasons other than credit risk, the adjustment is booked as a positive or negative adjustment to the carrying amount of the asset in the consolidated and carve-out statement of financial position with an increase or reduction in interest income. The adjustment is subsequently amortised through interest and similar income in the consolidated and carve-out statement of income. The recognition of fee and commission income is determined by the purpose of the fee or commission and the terms specified in the contract with the customer. Revenue is recognised when, or as, a performance obligation is satisfied by transferring control of the service to the customer, in the amount of the consideration to which we expect to be entitled. Revenue may therefore be recognised at a point in time upon completion of the service or over time as the services are provided. When revenue is recognised over time, we are generally required to provide the services each period and we therefore measure our progress towards completion of the service based upon the time elapsed. When another party is involved in providing a service to a customer, we determine whether the nature of our performance obligation is that of a principal or an agent. If we control the service before it is transferred to the customer, we are acting as the principal and present revenue separately from the amount paid to the other party; otherwise we are the agent and present revenue net of the amount paid to the other party. Income, which forms an integral part of the effective interest rate of a financial instrument, continues to be recognised as an adjustment to the effective interest rate. The Group calculates interest income by applying the EIR to the gross carrying amount of financial assets other than credit- impaired assets. When a financial asset becomes credit-impaired (as set out in Note 15) and is, therefore, regarded as "Stage 3", the Group calculates interest income by applying the effective interest rate to the net amortised cost of the financial asset. If the financial assets cure (as outlined in Note 15) and are no longer credit-impaired, the Group reverts to calculating interest income on a gross basis. Interest income on financial assets mandatorily required to be measured at FVPL is recognised using the contractual interest rate. Deposit services fees arise from personal and business deposit accounts and cash management services. Monthly and annual fees are recognised over the period that the related services are provided. Transactional fees are recognised at the point in time the related services are provided. 16
CIBC CARIBBEAN BANK LIMITED AND SUBSIDIARIES Notes to the Consolidated and Carve-out Financial Statements FOR THE YEAR ENDED OCTOBER 31 (expressed in thousands of United States dollars) Customer loyalty programmes Financial instruments: initial recognition • FVPL. The Group only measures due from banks, loans and advances to customers and other securities at amortised cost if both of the following conditions are met: • The financial asset is held within a business model with the objective to hold financial assets in order to collect contractual cash flows and The Group classifies and measures its derivative and trading portfolio at FVPL as explained in summary of accounting policies. The Group may designate financial instruments at FVPL, if so doing eliminates or significantly reduces measurement or recognition inconsistencies. Financial liabilities, other than loan commitments and financial guarantees are measured at amortised cost. Financial assets and liabilities Due from banks, loans and advances to customers, financial securities at amortised cost • FVOCI; or • Amortised cost; Date of recognition The Group classifies all of its financial assets based on the business model for managing the assets and the asset’s contractual terms, measured at either: Day 1 profit or loss When the transaction price of the instrument differs from the fair value at origination and the fair value is based on a valuation technique using only inputs observable in market transactions, the Group recognises the difference between the transaction price and fair value in net trading income. In those cases where fair value is based on models for which some of the inputs are not observable, the difference between the transaction price and the fair value is deferred and is only recognised in profit or loss when the inputs become observable, or when the instrument is derecognised. Measurement categories of financial assets and liabilities Financial assets and liabilities, with the exception of loans and advances to customers and customer deposits, are initially recognised on the settlement date, which is the date that an asset is delivered to or by the Group. This includes regular way trades: purchases or sales of financial assets that require delivery of assets within the time frame generally established by regulation or convention in the market place. Loans and advances to customers are recognised when funds are transferred to the customers’ accounts. The Group recognises balances due to customers when funds are transferred to the Bank. Initial measurement of financial instruments The classification of financial instruments at initial recognition depends on their contractual terms and the business model for managing the instruments. Financial instruments are initially measured at their fair value except in the case of financial assets and financial liabilities recorded at FVPL, where transaction costs are added to, or subtracted from, this amount. Trade receivables are measured at the transaction price. When the fair value of financial instruments at initial recognition differs from the transaction price, the Group accounts for the Day 1 profit or loss, as described below. Investment management fees are primarily based on the respective value of the assets under management ("AUM") or assets under administration ("AUA") and are recognised over the period that the related services are provided. Investment management fees are generally calculated based on point-in-time AUM and AUA balances. Custodial fees are recognised as revenue over the applicable service period, which is generally the contract term. The Group offers customer points programmes through its Credit Card products. A portion of the net fee revenues are deferred in relation to award credits under customer loyalty programmes as a separately identifiable revenue component. The amount deferred represents the fair value of the award credits and is recognised when the awards are utilised or are expired. 17

CIBC CARIBBEAN BANK LIMITED AND SUBSIDIARIES Notes to the Consolidated and Carve-out Financial Statements FOR THE YEAR ENDED OCTOBER 31 (expressed in thousands of United States dollars) The Solely payments of principal and interest (“SPPI”) test • It is settled at a future date. The Group uses derivative financial instruments to manage its foreign currency risks and interest rate risks, respectively. Such derivative financial instruments are initially recognised at fair value on the date on which a derivative contract is entered into and are subsequently remeasured at fair value. The Group enters into derivative transactions with various counterparties including the parent, CIBC. These include interest rate swaps, futures, credit default swaps, cross-currency swaps, forward foreign exchange contracts and options on interest rates, foreign currencies and equities. Derivatives are carried as assets when their fair value is positive and as liabilities when their fair value is negative. The notional amount and fair value of such derivatives are disclosed separately in Note 12. Changes in the fair value of derivatives are included in net trading income unless hedge accounting is applied. Hedge accounting disclosures are provided in Note 12. A derivative is a financial instrument or other contract with all three of the following characteristics: As a second step of its classification process the Group assesses the contractual terms of financial assets to identify whether they meet the SPPI test. "Principal" for the purpose of this test is defined as the fair value of the financial asset at initial recognition and may change over the life of the financial asset (for example, if there are repayments of principal or amortisation of the premium/discount). • The expected frequency, value and timing of sales are also important aspects of the Group’s assessment. • The contractual terms of the financial asset give rise on specified dates to cash flows that are solely payments of principal and interest ("SPPI") on the principal amount outstanding. The details of these conditions are outlined below. Business model assessment The Group determines its business model at the level that best reflects how it manages groups of financial assets to achieve its business objective. The Group’s business model is not assessed on an instrument-by-instrument basis, but at a higher level of aggregated portfolios and is based on observable factors such as: • Its value changes in response to the change in a specified interest rate, financial instrument price, commodity price, foreign exchange rate, index of prices or rates, credit rating or credit index, or other variable, provided that, in the case of a non-financial variable, it is not specific to a party to the contract (i.e., the "underlying"). • It requires no initial net investment or an initial net investment that is smaller than would be required for other types of contracts expected to have a similar response to changes in market factors. • How the performance of the business model and the financial assets held within that business model are evaluated and reported to the entity’s key management personnel; • The risks that affect the performance of the business model (and the financial assets held within that business model) and, in particular, the way those risks are managed; • How managers of the business are compensated (for example, whether the compensation is based on the fair value of the assets managed or on the contractual cash flows collected); and Derivatives recorded at fair value through profit or loss The business model assessment is based on reasonably expected scenarios without taking "worst case" or "stress case" scenarios into account. If cash flows after initial recognition are realised in a way that is different from the Group’s original expectations, the Group does not change the classification of the remaining financial assets held in that business model, but incorporates such information when assessing newly originated or newly purchased financial assets going forward. The most significant elements of interest within a lending arrangement are typically the consideration for the time value of money and credit risk. To perform the SPPI assessment, the Group applies judgement and considers relevant factors such as the currency in which the financial asset is denominated, and the period for which the interest rate is set. In contrast, contractual terms that introduce a more than de minimis exposure to risks or volatility in the contractual cash flows that are unrelated to a basic lending arrangement do not give rise to contractual cash flows that are SPPI on the amount outstanding. In such cases, the financial asset is required to be measured at FVPL. 18
CIBC CARIBBEAN BANK LIMITED AND SUBSIDIARIES Notes to the Consolidated and Carve-out Financial Statements FOR THE YEAR ENDED OCTOBER 31 (expressed in thousands of United States dollars) Financial guarantees, letters of credit and undrawn loan commitments The Group issues financial guarantees, letters of credit and loan commitments. The Group’s liability under each guarantee is measured at the higher of the amount initially recognised less cumulative amortisation and an ECL allowance. Financial assets and financial liabilities at fair value through profit or loss Financial assets and financial liabilities in this category are those that are not held for trading and have been either designated by management upon initial recognition or are mandatorily required to be measured at fair value under IFRS 9. Management only designates an instrument at FVPL upon initial recognition when one of the following criteria are met. Such designation is determined on an instrument-by-instrument basis: • The designation eliminates, or significantly reduces, the inconsistent treatment that would otherwise arise from measuring the assets or liabilities or recognising gains or losses on them on a different basis; or • The liabilities are part of a group of financial liabilities, which are managed and their performance evaluated on a fair value basis, in accordance with a documented risk management or investment strategy; or • The liabilities contain one or more embedded derivatives, unless they do not significantly modify the cash flows that would otherwise be required by the contract, or it is clear with little or no analysis when a similar instrument is first considered that separation of the embedded derivative(s) is prohibited. Debt instruments at FVOCI The Group applies the category under IFRS 9 of debt instruments measured at FVOCI when both of the following conditions are met: • The instrument is held within a business model, the objective of which is achieved by both collecting contractual cash flows and selling financial assets; and • The contractual terms of the financial asset meet the SPPI test. FVOCI debt instruments are subsequently measured at fair value with gains and losses arising due to changes in fair value recognised in other comprehensive income ("OCI"). Interest income and foreign exchange gains and losses are recognised in profit or loss in the same manner as for financial assets measured at amortised cost. The ECL calculation for debt instruments at FVOCI is shown in Note 14. Where the Group holds more than one investment in the same security, they are deemed to be disposed of on a first–in, first–out basis. On derecognition, cumulative gains or losses previously recognised in OCI are reclassified from OCI to profit or loss. Financial assets and financial liabilities at FVPL are recorded in the consolidated and carve-out statement of financial position at fair value. Changes in fair value are recorded in profit and loss with the exception of movements in fair value of liabilities designated at FVPL due to changes in the Group’s own credit risk. Such changes in fair value are recorded in OCI and do not get recycled to the profit or loss. Interest earned or incurred on instruments designated at FVPL is accrued in interest income or interest expense respectively using the EIR, taking into account any discount/premium and qualifying transaction costs being an integral part of the instrument. Interest earned on assets mandatorily required to be measured at FVPL is recorded using the contractual interest rate. Dividend income from equity instruments measured at FVPL is recorded in profit or loss as other operating income when the right to the payment has been established. Upon initial recognition, the Group occasionally elects to classify irrevocably some of its equity investments as equity instruments at FVOCI when they meet the definition of equity under IAS 32 Financial Instruments: Presentation and are not held for trading. Such classification is determined on an instrument-by-instrument basis. Gains and losses on these equity instruments are never recycled to profit. Dividends are recognised in profit or loss as other operating income when the right of the payment has been established, except when the Group benefits from such proceeds as a recovery of part of the cost of the instrument, in which case, such gains are recorded in OCI. Equity instruments at FVOCI are not subject to an impairment assessment. Equity instruments at FVOCI 19

CIBC CARIBBEAN BANK LIMITED AND SUBSIDIARIES Notes to the Consolidated and Carve-out Financial Statements FOR THE YEAR ENDED OCTOBER 31 (expressed in thousands of United States dollars) - - - The Group has no obligation to pay amounts to the eventual recipients unless it has collected equivalent amounts from the original asset, excluding short-term advances with the right to full recovery of the amount lent plus accrued interest at market rates; The Group cannot sell or pledge the original asset other than as security to the eventual recipients; and The Group has to remit any cash flows it collects on behalf of the eventual recipients without material delay. In addition, the Group is not entitled to reinvest such cash flows, except for investments in cash or cash equivalents including interest earned, during the period between the collection date and the date of required remittance to the eventual recipients. Financial assets A financial asset (or, where applicable, a part of a financial asset or part of a group of similar financial assets) is derecognised when the rights to receive cash flows from the financial asset have expired. The Group also derecognises the financial asset if it has both transferred the financial asset and the transfer qualifies for derecognition. The Group has transferred the financial asset if, and only if, either: • The Group has transferred its contractual rights to receive cash flows from the financial asset; or • It retains the rights to the cash flows, but has assumed an obligation to pay the received cash flows in full without material delay to a third party under a ‘pass–through’ arrangement; and • Pass-through arrangements are transactions whereby the Group retains the contractual rights to receive the cash flows of a financial asset (the ‘original asset’), but assumes a contractual obligation to pay those cash flows to one or more entities (the ‘eventual recipients’), when all of the following three conditions are met: Derecognition due to substantial modification of terms and conditions When assessing whether or not to derecognise a loan to a customer, the Group considers the following factors: • Change in currency of the loan; • Introduction of an equity feature; • Change in counterparty; and • If the modification is such that the instrument would no longer meet the SPPI criterion. If the modification does not result in cash flows that are substantially different, the modification does not result in derecognition. Based on the change in cash flows discounted at the original EIR, the Group records a modification gain or loss, to the extent that an impairment loss has not already been recorded. Reclassification of financial assets and liabilities The Group does not reclassify its financial assets subsequent to their initial recognition, apart from the exceptional circumstances in which the Group acquires, disposes of, or terminates a business line. Financial liabilities are never reclassified. The Group previously reclassified one of its financial assets from loans and advances to debt instruments at amortised cost. No financial liabilities were reclassified. Derecognition of financial assets and liabilities Undrawn loan commitments and letters of credits are commitments under which, over the duration of the commitment, the Group is required to provide a loan with pre-specified terms to the customer. These contracts are in the scope of the ECL requirements and attract allowances based on credit quality. The nominal contractual value of financial guarantees, letters of credit and undrawn loan commitments, where the loan agreed to be provided is on market terms, is not recorded in the consolidated and carve-out statement of financial position. The nominal values of these instruments together with the corresponding ECLs are disclosed in Note 15. The Group derecognises a financial asset, such as a loan to a customer, when the terms and conditions have been renegotiated to the extent that, substantially, it becomes a new loan, with the difference recognised as a derecognition gain or loss, to the extent that an impairment loss has not already been recorded. The newly recognised loans are classified as Stage 2 for ECL measurement purposes, unless the new loan is deemed to be purchased or originated credit impaired ("POCI"). 20
CIBC CARIBBEAN BANK LIMITED AND SUBSIDIARIES Notes to the Consolidated and Carve-out Financial Statements FOR THE YEAR ENDED OCTOBER 31 (expressed in thousands of United States dollars) Based on the above process, the Group allocates its loans into Stage 1, Stage 2, Stage 3 and POCI, as described below: • Stage 1: When loans are first recognised, the Group recognises an allowance based on 12mECLs. Stage 1 loans also include facilities where the credit risk has improved and the loan has been reclassified from Stage 2. The 12mECL is the portion of LTECLs that represent the ECLs that result from default events on a financial instrument that are possible within the 12 months after the reporting date. Both LTECLs and 12mECLs are calculated on either an individual basis or a collective basis, depending on the nature of the underlying portfolio of financial instruments. Where the financial asset meets the definition of POCI, the allowance is based on the change in the ECLs over the life of the asset. The Group has established a policy to perform an assessment, at the end of each reporting period, of whether a financial instrument’s credit risk has increased significantly since initial recognition, by considering the change in the risk of default occurring over the remaining life of the financial instrument. This is further explained in Note 28. A financial liability is derecognised when the obligation under the liability is discharged, cancelled or expires. Where an existing financial liability is replaced by another from the same lender on substantially different terms, or the terms of an existing liability are substantially modified, such an exchange or modification is treated as a derecognition of the original liability and the recognition of a new liability. The difference between the carrying value of the original financial liability and the consideration paid is recognised in profit or loss. Impairment of financial assets Overview of the ECL principles The Group records an allowance for expected credit losses for all loans and other debt financial assets not held at FVPL, together with loan commitments and financial guarantee contracts, in this section all referred to as "financial instruments". Equity instruments are not subject to impairment under IFRS 9. The ECL allowance is based on the credit losses expected to arise over the life of the asset (the lifetime expected credit loss or LTECL), unless there has been no significant increase in credit risk since origination, in which case the allowance is based on the 12 months’ expected credit loss ("12mECL") as outlined in Note 14. The Group’s policies for determining if there has been a significant increase in credit risk are set out in Note 2.2. • The Group has neither transferred nor retained substantially all the risks and rewards of the asset, but has transferred control of the asset. The Group considers control to be transferred if and only if, the transferee has the practical ability to sell the asset in its entirety to an unrelated third party and is able to exercise that ability unilaterally and without imposing additional restrictions on the transfer. When the Group has neither transferred nor retained substantially all the risks and rewards and has retained control of the asset, the asset continues to be recognised only to the extent of the Group’s continuing involvement, in which case the Group also recognises an associated liability. The transferred asset and the associated liability are measured on a basis that reflects the rights and obligations that the Group has retained. Continuing involvement that takes the form of a guarantee over the transferred asset is measured at the lower of the original carrying amount of the asset and the maximum amount of consideration the Group could be required to pay. If continuing involvement takes the form of a written or purchased option (or both) on the transferred asset, the continuing involvement is measured at the value the Group would be required to pay upon repurchase. In the case of a written put option on an asset that is measured at fair value, the extent of the entity’s continuing involvement is limited to the lower of the fair value of the transferred asset and the option exercise price. Financial liabilities A transfer only qualifies for derecognition if either: • The Group has transferred substantially all the risks and rewards of the asset; or 21
CIBC CARIBBEAN BANK LIMITED AND SUBSIDIARIES Notes to the Consolidated and Carve-out Financial Statements FOR THE YEAR ENDED OCTOBER 31 (expressed in thousands of United States dollars) • Stage 2: When a financial asset has shown a significant increase in credit risk since origination, the Group records an allowance for the LTECLs. The mechanics are similar to those explained above, but PDs are estimated over the lifetime of the instrument. The expected cash shortfalls are discounted by an approximation to the original EIR. • Stage 3: For financial assets considered credit-impaired, the Group recognises the LTECLs for these loans. The method is similar to that for Stage 2 assets, with the PD set at 100%. The calculation of ECLs The Group calculates ECLs based on probability-weighted scenarios to measure the expected cash shortfalls, discounted at an approximation to the EIR. A cash shortfall is the difference between the cash flows that are due to an entity in accordance with the contract and the cash flows that the entity expects to receive. The mechanics of the ECL calculations are outlined below and the key elements are, as follows: • PD - The Probability of Default is an estimate of the likelihood of default over a given time horizon. A default may only happen at a certain time over the assessed period, if the facility has not been previously derecognised and is still in the portfolio. The concept of PDs is further explained in Note 2.2. • EAD - The Exposure at Default is an estimate of the exposure at a future default date, taking into account expected changes in the exposure after the reporting date, including repayments of principal and interest, whether scheduled by contract or otherwise, expected drawdowns on committed facilities, and accrued interest from missed payments. The EAD is further explained in Note 2.2. • LGD - The Loss Given Default is an estimate of the loss arising in the case where a default occurs at a given time. It is based on the difference between the contractual cash flows due and those that the lender would expect to receive, including from the realisation of any collateral. It is usually expressed as a percentage of the EAD. The LGD is further explained in Note 2.2. The mechanics of the ECL method are summarised below: • Stage 1: The 12mECL is calculated as the portion of LTECLs that represent the ECLs that result from default events on a financial instrument that are possible within the 12 months after the reporting date. The Group calculates the 12mECL allowance based on the expectation of a default occurring in the 12 months following the reporting date. These expected 12-month default probabilities are applied to a forecast EAD and multiplied by the expected LGD and discounted by an approximation to the original EIR. • Stage 2: When a loan has shown a significant increase in credit risk since origination, the Group records an allowance for the LTECLs. Stage 2 loans also include facilities, where the credit risk has improved and the loan has been reclassified from Stage 3. • Stage 3: Loans considered credit-impaired (as outlined in Note 2.2). The Group records an allowance for the LTECLs. • POCI: Purchased originated credit impaired assets are financial assets that are credit impaired on initial recognition. POCI assets are recorded at fair value at original recognition and interest income is subsequently recognised based on a credit-adjusted EIR. ECLs are only recognised or released to the extent that there is a subsequent change in the expected credit losses. ECL allowances for POCI assets are reported in Stage 3. For financial assets for which the Group has no reasonable expectations of recovering either the entire outstanding amount, or a proportion thereof, the gross carrying amount of the financial asset is reduced. This is considered a (partial) derecognition of the financial asset. When estimating the ECLs, the Group considers among other factors the risk rating category and aging of the financial asset. Each of these is associated with different PDs, EADs and LGDs. When relevant, it also incorporates how defaulted loans and investments are expected to be recovered, including the value of collateral or the amount that might be received for selling the asset. With the exception of credit cards and other revolving facilities, the maximum period for which the credit losses are determined is the contractual life of a financial instrument unless the Group has the legal right to call it earlier. 22
CIBC CARIBBEAN BANK LIMITED AND SUBSIDIARIES Notes to the Consolidated and Carve-out Financial Statements FOR THE YEAR ENDED OCTOBER 31 (expressed in thousands of United States dollars) Forward looking information Credit cards and other revolving facilities The Group’s product offering includes a variety of corporate and retail overdraft and credit cards facilities, in which the Group has the right to cancel and/or reduce the facilities with one day’s notice. The Group does not limit its exposure to credit losses to the contractual notice period, but instead calculates ECL over a period that reflects the Group’s expectations of the customers’ behaviour, its likelihood of default and the Group’s future risk mitigation procedures, which could include reducing or cancelling the facilities. The ongoing assessment of whether a significant increase in credit risk has occurred for revolving facilities is similar to other lending products. This is based on shifts in the customer’s internal credit grade or history of delinquency, as explained in Note 28, but greater emphasis is also given to qualitative factors such as changes in usage. The calculation of ECLs, including the estimation of the expected period of exposure and discount rate is made on a collective basis for corporate and retail products. The collective assessments are made separately for portfolios of facilities with similar credit risk characteristics. In its ECL models, the Group relies on a broad range of forward-looking information as economic inputs, such as but not limited to: • Financial guarantee contracts: The Group estimates ECLs by applying the PD and LGD to the exposure, and this amount is discounted at an approximation to the interest rate relevant to the exposure. The ECLs related to financial guarantee contracts are recognised within credit loss on financial assets. Debt instruments measured at FVOCI The ECLs for debt instruments measured at FVOCI do not reduce the carrying amount of these financial assets in the consolidated and carve-out statement of financial position, which remains at fair value. Instead, an amount equal to the allowance that would arise if the assets were measured at amortised cost is recognised in OCI as an accumulated impairment amount, with a corresponding charge to profit or loss. The accumulated loss recognised in OCI is recycled to the profit and loss upon derecognition of the assets. Purchased or originated credit impaired financial assets (POCI) For POCI financial assets, the Group only recognises the cumulative changes in LTECL since initial recognition in the loss allowance. • POCI: These are financial assets that are credit impaired on initial recognition. The Group only recognises the cumulative changes in lifetime ECLs since initial recognition, based on a probability-weighting scenarios, discounted by the credit adjusted EIR. • GDP growth or nominal GDP; • Unemployment rate; • Consumer price index and inflation; and • Interest rates. For the majority of our loan portfolios, our forecast of forward-looking information variables is established from a “base case” or most likely scenario. For most of the forward-looking information variables related to the Group’s businesses, we have forecast scenarios by individual territories. In forming the “base case” scenario, we consider the forecasts of monetary authorities such as the International Monetary Fund, World Bank and regional regulatory/ statutory bodies. We then derive reasonably possible “upside case” and “downside case” scenarios using the historical performance of variables that are above and below our “base case” along with the application of management judgment. • Loan commitments and letters of credit: When estimating 12mECL for undrawn loan commitments, the Group applies the PD and LGD to the undrawn amount, and this amount is discounted at an approximation to the expected EIR on the loan. For credit cards and revolving facilities that include both a loan and an undrawn commitment, ECLs are calculated and presented together with the loan. For loan commitments and letters of credit, the ECL is recognised within Provisions. 23
CIBC CARIBBEAN BANK LIMITED AND SUBSIDIARIES Notes to the Consolidated and Carve-out Financial Statements FOR THE YEAR ENDED OCTOBER 31 (expressed in thousands of United States dollars) A probability weighting is assigned to our “base case”, “upside case” and “downside case” scenarios based on management judgment. The inputs and models used for calculating ECLs may not always capture all characteristics of the market at the date of the consolidated and carve-out financial statements. To reflect this, qualitative adjustments or overlays are occasionally made as temporary adjustments when such differences are significantly material. The use of management overlays requires the application of significant expert judgement that may impact the amount and timing of the ECL allowance being recognised. As such, overlays are continuously reviewed for relevance and accuracy. In its normal course of business, the Group does not physically repossess properties or other assets in its retail portfolio, but engages external agents to recover funds, generally at auction, to settle outstanding debt. Any surplus funds are returned to the customers/obligors. As a result of this practice, the residential properties under legal repossession processes are not recorded on the consolidated and carve-out statement of financial position. Write-offs Financial assets are written off either partially or in their entirety only when the Group has judged that there is no realistic prospect of future recovery. If the amount to be written off is greater than the accumulated loss allowance, the difference is first treated as an addition to the allowance that is then applied against the gross carrying amount. Any subsequent recoveries are credited to credit loss expense. Forborne and modified loans Collateral valuation To mitigate its credit risks on financial assets, the Group seeks to use collateral, where possible. The collateral comes in various forms, such as cash, securities, letters of credit/guarantees, real estate, receivables, inventories, other non-financial assets and credit enhancements such as netting agreements. Collateral, unless repossessed, is not recorded on the Group’s consolidated and carve-out statement of financial position. However, the fair value of collateral affects the calculation of ECLs. It is generally assessed, at a minimum, at inception and reassessed on a quarterly basis. Details of the impact of the Group’s various credit enhancements are disclosed in Note 15. The Group’s credit risk management policies include requirements relating to collateral valuation and management, including verification requirements and legal certainty. Valuations are updated periodically depending upon the nature of the collateral. Management monitors the market value of collateral and requests additional collateral in accordance with the underlying agreement during its periodic review of loan accounts in arrears. Policies are in place to monitor the existence of undesirable concentration in the collateral supporting the Group’s credit exposure. Collateral repossessed The Group’s policy is to determine whether a repossessed asset can be best used for its internal operations or should be sold. Assets determined to be useful for the internal operations are transferred to their relevant asset category at the lower of their repossessed value or the carrying value of the original secured asset. Assets for which selling is determined to be a better option are transferred to assets held for sale at their fair value (if financial assets) and fair value less cost to sell for non- financial assets at the repossession date in line with the Group’s policy. The Group sometimes makes concessions or modifications to the original terms of loans as a response to the borrower’s financial difficulties, rather than taking possession of or to otherwise enforce collection of collateral. The Group considers a loan forborne when such concessions or modifications are provided as a result of the borrower’s present or expected financial difficulties and the Group would not have agreed to them if the borrower had been financially healthy. Indicators of financial difficulties include defaults on covenants, or significant concerns raised by the Credit Risk Department. Forbearance may involve extending the payment arrangements and the agreement of new loan conditions. Once the terms have been renegotiated, any impairment is measured using the original EIR as calculated before the modification of terms. It is the Group’s policy to monitor forborne loans to help ensure that future payments continue to be likely to occur. Derecognition decisions and classification between Stage 2 and Stage 3 are determined on a case-by-case basis. If these procedures identify a loss in relation to a loan, it is disclosed and managed as an impaired Stage 3 forborne asset until it is collected or written off. 24
CIBC CARIBBEAN BANK LIMITED AND SUBSIDIARIES Notes to the Consolidated and Carve-out Financial Statements FOR THE YEAR ENDED OCTOBER 31 (expressed in thousands of United States dollars) Offsetting financial instruments Financial assets and liabilities are offset and the net amount reported in the consolidated and carve-out statement of financial position when there is a legally enforceable right to offset the recognised amounts and there is an intention to settle on a net basis, or realise the asset and settle the liability simultaneously. Intangible assets Intangible assets acquired separately are measured on initial recognition at cost. The cost of intangible assets acquired in a business combination is their fair value at the date of acquisition. An intangible asset is only recognised when its cost can be reliably measured, and it is probable that the expected future economic benefits attributable to it will flow to the Group. Following initial recognition, intangible assets are carried at cost less any accumulated amortisation and accumulated impairment losses. Internally generated intangibles, excluding capitalised development costs, are not capitalised and the related expenditure is reflected in profit or loss in the period in which the expenditure is incurred. The useful lives of intangible assets are assessed as either finite or indefinite. Intangible assets with finite lives are amortised over the useful economic life and assessed for impairment whenever there is an indication that the intangible asset may be impaired. Intangible assets with indefinite useful lives are not amortised, but are tested for impairment annually, either individually or at the cash-generating unit level. Intangible assets acquired in business combinations prior to November 1, 2009, are accounted for as follows: i) Goodwill Sale and repurchase agreements Securities sold subject to linked repurchase agreements (“repos”) are retained in the consolidated and carve-out financial statements as investment securities and the counterparty liability is included in other borrowed funds. Securities purchased under agreements to resell are recorded as loans and advances to other banks or customers as appropriate. The difference between sale and repurchase price is treated as interest and accrued over the life of repurchase agreements using the effective interest method. When the loan has been renegotiated or modified but not derecognised, the Group also reassesses whether there has been a significant increase in credit risk, as set out in Note 31. The Group also considers whether the assets should be classified as Stage 3. Once an asset has been classified as forborne, it will remain forborne for a minimum probation period according to the regulatory rules in each country. In order for the loan to be reclassified out of the forborne category, the customer has to meet all of the following criteria: • All of its facilities have to be considered performing; • The probation period has passed from the date the forborne contract was considered performing; • Regular payments of more than an insignificant amount of principal or interest have been made during at least half of the probation period; and • The customer does not have any contract that is more than 30 days past due. Details of forborne assets are disclosed in Note 31. If modifications are substantial, the loan is derecognised. An impairment loss is recognised for the amount by which the asset’s carrying value exceeds its recoverable amount. The recoverable amount is the higher of an asset’s fair value less costs to sell and value in use. Goodwill represents the excess of the cost of an acquisition over the fair value of the net identifiable assets of the acquired subsidiary undertaking at the date of acquisition and is reported in the consolidated and carve-out statement of financial position as an intangible asset. Goodwill is tested annually for impairment at third quarter or when circumstances indicate that the carrying value may be impaired and carried at cost less accumulated impairment losses. Goodwill is allocated to the lowest levels for which there are separately identifiable cash flows (cash-generating units) for the purpose of impairment testing. 25
CIBC CARIBBEAN BANK LIMITED AND SUBSIDIARIES Notes to the Consolidated and Carve-out Financial Statements FOR THE YEAR ENDED OCTOBER 31 (expressed in thousands of United States dollars) Depreciation of owned assets is computed on the straight-line method at rates considered adequate to write off the cost of depreciable assets, less salvage, over their estimated useful lives. The annual rates used are: - Buildings - Leasehold improvements - Equipment, furniture and vehicles 2½% 10% or over the life of the lease 20 – 50% Non-current assets (or disposal groups) held for sale Non-current assets (or disposal groups) are classified as assets held for sale when their carrying amount is to be recovered principally through a sale transaction and a sale is considered highly probable. They are stated at the lower of carrying amount and fair value less costs to sell. Property and equipment All property and equipment are stated at historical cost less accumulated depreciation, with the exception of land which is not depreciated. Historical cost includes expenditures that are directly attributable to the acquisition of the items. Land and buildings comprise mainly of branches and offices. Subsequent costs are included in the assets carrying amount or are recognised as a separate asset, as appropriate, only when it is probable that future economic benefits associated with the item will flow to the Group and the cost of the item can be measured reliably. All other repairs and maintenance are charged to the consolidated and carve-out statement of income during the financial period in which they are incurred. Right-of-use assets are presented together with property and equipment in the consolidated and carve-out statement of financial position. Refer to the accounting policy for leases below. As a lessee The Group applies a single recognition and measurement approach for all leases, except for short-term leases and leases of low-value assets. The Group recognises lease liabilities to make lease payments and right-of-use assets representing the right to use the underlying assets. Right-of-use assets The Group recognises right-of-use assets at the commencement date of the lease (i.e. the date the underlying asset is available for use). Right-of-use assets are measured at cost, less any accumulated depreciation and impairment losses, and adjusted for any remeasurement of lease liabilities. The cost of right-of-use assets includes the amount of lease liabilities recognised, initial direct costs incurred, and lease payments made at or before the commencement date less any lease incentives received. Right- of-use assets are depreciated on a straight-line basis over the lease term. Right-of-use assets are depreciated over the life of the lease. Depreciation methods, useful lives and residual values are reviewed at each annual reporting date and are adjusted if appropriate. Assets that are subject to depreciation are reviewed for impairment whenever events or changes in circumstances indicate that the carrying amount may not be recoverable. Where the carrying amount of an asset is greater than its estimated recoverable amount, it is written down immediately to its recoverable amount. The asset’s recoverable amount is the higher of the asset’s fair value less costs to sell and the value in use. Gains and losses on disposal of property and equipment are determined by reference to it carrying amount and are taken into account in determining net income. Leases The Group assesses at contract inception whether a contract is, or contains, a lease. That is, if the contract conveys the right to control the use of an identified asset for a period of time in exchange for consideration. The Group leases various buildings for extended periods. Contracts may contain both lease and non-lease components, however where the Group has a lease, it has elected not to separate these components and instead accounts for these as a single lease component. 26
CIBC CARIBBEAN BANK LIMITED AND SUBSIDIARIES Notes to the Consolidated and Carve-out Financial Statements FOR THE YEAR ENDED OCTOBER 31 (expressed in thousands of United States dollars) The right-of-use assets are presented within Note 16 Property and equipment and are subject to similar impairment in line with the Group’s impairment policy for non-financial assets. At the commencement date of the lease, the Group recognises lease liabilities measured at the present value of lease payments to be made over the lease term. The lease payments include fixed payments (less any lease incentives receivable), variable lease payments that depend on an index or a rate, and amounts expected to be paid under residual value guarantees. The lease payments also include the exercise price of a purchase option reasonably certain to be exercised by the Group and payments of penalties for terminating the lease, if the lease term reflects exercising the option to terminate. Variable lease payments that do not depend on an index or a rate are recognised as expenses in the period in which the event or condition that triggers the payment occurs. A lease contract is modified, and the lease modification is not accounted for as a separate lease, in which case the lease liability is remeasured by discounting the revised lease payments using a revised discount rate. The lease liabilities are presented within other liabilities on the consolidated and carve-out statement of financial position. As a lessor Leases in which the Group does not transfer substantially all the risks and rewards incidental to ownership of an asset are classified as operating leases. Rental income arising is accounted for on a straight-line basis over the lease terms and is included in revenue in the consolidated and carve-out statement of income due to its operating nature. Initial direct costs incurred in negotiating and arranging an operating lease are added to the carrying amount of the leased asset and recognised over the lease term on the same basis as rental income. Contingent rents are recognised as revenue in the period in which they are earned. Determination of the lease term for lease contracts with renewal and termination options (as a lessee) The Group determines the lease term as the non-cancellable term of the lease, together with any periods covered by an option to extend the lease if it is reasonably certain to be exercised, or any periods covered by an option to terminate the lease, if it is reasonably certain not to be exercised. The Group has several lease contracts that include extension and termination options. The Group applies judgement in evaluating whether it is reasonably certain whether or not to exercise the option to renew or terminate the lease. That is, it considers all relevant factors that create an economic incentive for it to exercise either the renewal or termination. After the commencement date, the Group reassesses the lease term if there is a significant event or change in circumstances that is within its control that affects its ability to exercise or not to exercise the option to renew or to terminate (e.g., construction of significant leasehold improvements or significant customisation of the leased asset). Lease liabilities The lease term has changed or there is a change in the assessment of exercise of a purchase option, in which case the lease liability is remeasured by discounting the revised lease payments using a revised discount rate; The lease payments change due to changes in an index or rate or a change in expected payment under a guaranteed residual value, in which cases the lease liability is remeasured by discounting the revised lease payments using the initial discount rate (unless the lease payments change is due to a change in a floating interest rate, in which case a revised discount rate is used); or The lease liability is subsequently measured by increasing the carrying amount to reflect interest on the lease liability (using the effective interest method) and by reducing the carrying amount to reflect the lease payments made. The Group remeasures the lease liability (and makes a corresponding adjustment to the related right-of-use asset) whenever: 27
CIBC CARIBBEAN BANK LIMITED AND SUBSIDIARIES Notes to the Consolidated and Carve-out Financial Statements FOR THE YEAR ENDED OCTOBER 31 (expressed in thousands of United States dollars) Estimating the incremental borrowing rate The Group cannot readily determine the interest rate implicit in the lease, therefore, it uses its incremental borrowing rate (‘IBR’) to measure lease liabilities. The IBR is the rate of interest that the Group would have to pay to borrow over a similar term, and with a similar security, the funds necessary to obtain an asset of a similar value to the right-of-use asset in a similar economic environment. The IBR therefore reflects what the Group "would have to pay", which requires estimation when no observable rates are available (such as for subsidiaries that do not enter into financing transactions) or when they need to be adjusted to reflect the terms and conditions of the lease (for example, when leases are not in the subsidiary’s functional currency). The Group estimates the IBR using observable inputs (such as market interest rates) when available and is required to make certain entity-specific adjustments (such as the subsidiary’s stand-alone credit rating, or to reflect the terms and conditions of the lease). Amounts due from lessees under finance leases mainly relate to the leasing of vehicles and equipment and are recorded under loans and advances to customers in the consolidated and carve-out statement of financial position at the amount of the net investment in the leases. At the commencement of the lease term, the Group recognises finance leases at amounts equal to the fair value of the leased asset or, if lower, the present value of the minimum lease payments. To calculate the present value of the lease payments, the interest rate stipulated in the finance lease is used. Finance lease income is allocated to accounting periods so as to reflect a constant periodic rate of return on the Group’s net investment in the lease. Restructuring provisions are recognised only when the recognition criteria for provisions are fulfilled. The Group has a constructive obligation when a detailed formal plan identifies the business or part of the business concerned, the location and number of employees affected, a detailed estimate of the associated costs, and an appropriate timeline. Furthermore, the employees affected have been notified of the plan’s main features. If the effect of the time value of money is material, provisions are discounted using a current pre-tax rate that reflects, when appropriate, the risks specific to the liability. When discounting is used, the increase in the provision due to the passage of time is recognised as a finance cost. To determine the incremental borrowing rate, the Group uses a build-up approach, which incorporates internal Funds Transfer Pricing ("FTP") methodology to derive the discount rates, which are further duration adjusted to better reflect the amortising nature of the lease portfolio. The approach makes adjustments specific to the lease, e.g. term, country and currency. The Group is exposed to potential future increases in variable lease payments based on an index or rate, which are not included in the lease liability until they take effect. When adjustments to lease payments based on an index or rate take effect, the lease liability is reassessed and adjusted against the right-of-use asset. Finance leases Leases are classified as finance leases whenever the terms of the lease transfer substantially all the risks and rewards of ownership to the lessee. All other leases are classified as operating leases. Pension obligations The Group operates a number of pension plans, the assets of which are generally held in separate trustee-administered funds. The pension plans are generally funded by payments from the relevant Group companies, taking account of the recommendations of independent qualified actuaries. The Group has both defined benefit plans and defined contribution plans. A defined benefit plan is a pension plan that defines an amount of pension benefit to be provided, usually as a function of one or more factors such as age, years of service or compensation. A defined contribution plan is a pension plan under which the Group pays fixed contributions into a separate entity (a fund) and will have no legal or constructive obligation to pay further contributions if the fund does not hold sufficient assets to pay all employee benefits relating to employee service in the current and prior periods. Lease payments are allocated between principal and finance cost. The finance cost is charged to profit or loss over the lease period so as to produce a constant periodic rate of interest on the remaining balance of the liability for each period. Restructuring provisions Retirement benefit obligations 28
CIBC CARIBBEAN BANK LIMITED AND SUBSIDIARIES Notes to the Consolidated and Carve-out Financial Statements FOR THE YEAR ENDED OCTOBER 31 (expressed in thousands of United States dollars) Deferred tax Other post retirement obligations Some Group companies provide post-retirement healthcare benefits to their retirees. The entitlement to these benefits is usually based on the employee remaining in service up to retirement age and the completion of a minimum service period. The expected costs of these benefits are accrued over the period of employment, using a methodology similar to that for defined benefit pension plans. These obligations are valued annually by independent qualified actuaries. Deferred tax is provided in full, using the liability method, on temporary differences arising between the tax bases of assets and liabilities and their carrying amounts in the consolidated and carve-out financial statements. • The date of the plan amendment or curtailment; and • The date that the Group recognises restructuring-related costs. Net interest is calculated by applying the discount rate to the net defined benefit liability or asset. The Group recognises the following changes in the net defined benefit obligation as part of staff costs in the consolidated and carve-out statement of income: • Service costs comprising current service costs, past-service costs, gains and losses on curtailments and non-routine settlements • Net interest expense or income For defined contribution plans, the Group makes contributions to publicly or privately administered pension insurance plans on a mandatory, contractual or voluntary basis. Once the contributions have been paid, the Group has no further payment obligations. The regular contributions constitute net periodic costs for the year in which they are due and as such are included in staff costs. The Group’s contributions to the defined contribution pension plans are charged to the consolidated and carve- out statement of income in the year to which they relate. Remeasurements, comprising where applicable actuarial gains and losses, the effect of the asset ceiling, excluding net interest and the return on plan assets (excluding net interest), are recognised immediately in the consolidated and carve-out statement of financial position with a corresponding debit or credit to retained earnings through other comprehensive income in the period in which they occur. Remeasurements are not reclassified to profit or loss in subsequent periods. The asset or liability recognised in the consolidated and carve-out statement of financial position in respect of defined benefit pension plans is the present value of the defined benefit obligation at the reporting date minus the fair value of plan assets, together with adjustments for unrecognised actuarial gains/losses and past service cost. The defined benefit obligation is calculated annually by independent actuaries using the projected unit credit method. The principal temporary differences arise from depreciation on property and equipment, revaluation of certain financial assets and liabilities, provisions for pensions and tax losses carried forward; and in relation to acquisitions, on the difference between the fair values of the net assets acquired and their tax base. Currently enacted or substantially enacted tax rates are used to determine deferred taxes. Tax payable on profits, based on the applicable tax law in each jurisdiction, is recognised as an expense in the period in which profits arise. Deferred tax assets relating to the carryforward of unused tax losses are recognised to the extent that it is probable that future taxable profit will be available against which the tax losses can be utilised. Deferred tax related to fair value remeasurement of FVOCI debt securities, which is charged or credited directly to other comprehensive income, is also credited or charged directly to other comprehensive income and is subsequently recognised in the consolidated and carve-out statement of income together with the realised gain or loss. The present value of the defined benefit obligation is determined by the estimated future cash outflows using interest rates of government securities, which have terms to maturity approximating the terms of the related liability. Most of the pension plans are final salary plans and the charge for such pension plans, representing the net periodic pension cost less employee contributions, is included in staff costs. Past service costs are recognised in profit or loss on the earlier of: 29
CIBC CARIBBEAN BANK LIMITED AND SUBSIDIARIES Notes to the Consolidated and Carve-out Financial Statements FOR THE YEAR ENDED OCTOBER 31 (expressed in thousands of United States dollars) The Group commonly acts as trustees and in other fiduciary capacities that result in the holding or placing of assets on behalf of individuals, trusts, retirement benefit plans and other institutions. These assets and income arising thereon are excluded from these consolidated and carve-out financial statements, as they are not assets of the Group. We classify financial instruments as a liability or equity based on the substance of the contractual arrangement. An instrument is classified as a liability if it is a contractual obligation to deliver cash or another financial asset, or to exchange financial assets or financial liabilities at potentially unfavourable terms. A contract is also classified as a liability if it is a non-derivative and could obligate us to deliver a variable number of our own shares or it is a derivative other than one that can be settled by the delivery of a fixed amount of cash or another financial asset for a fixed number of our own equity. Compensation is provided to certain employees and directors in the form of share-based awards. Awards granted are converted into Performance Share Units ("PSUs") based on our parent’s CIBC share price at the award date. The PSUs also attract notional dividends which are reinvested in additional share units. The compensation expense for share-based awards is recognised from the service commencement date to the earlier of the contractual vesting date or the employee’s retirement eligible date. For grants regularly awarded in the annual incentive compensation cycle ("annual incentive grant"), the service commencement date is considered to be the start of the fiscal year that precedes the fiscal year in which the grant is made. The service commencement date in respect of special awards granted outside of the annual cycle is the grant date. The amount of compensation expense recognised is based on management’s best estimate of the number of share-based awards expected to vest, including estimates of expected forfeitures, which are revised periodically as appropriate. For the annual incentive grant, compensation expense is recognised from the service commencement date based on the estimated fair value of the forthcoming grant with the estimated fair value adjusted to the actual fair value at the grant date. Liabilities and equity Fiduciary activities Under the PSU plan, where grants are settled in the cash equivalent of CIBC common shares, changes in the obligation which arise from fluctuations in the market price of CIBC common shares, and revised estimates of the performance factor, net of related hedges, are recognised in the consolidated and carve-out statement of income as compensation expense in proportion to the award recognised. The performance factor ranges from 75% to 125% of the initial number of units awarded based on the Bank’s performance. Share capital Share issue costs Shares issued for cash are accounted for at the issue price less any transaction costs associated with the issue. Shares issued as consideration for the purchase of assets, or a business, are recorded at the market price on the date of issue. Dividends on common shares Dividends on common shares are recognised in equity in the period in which they are declared. Dividends for the year that are declared after the reporting date are not reflected in these consolidated and carve-out financial statements. Share-based payments Basic and diluted earnings per share is calculated by dividing the net profit attributable to equity holders of the parent by the weighted average number of common shares (excluding treasury shares) outstanding during the year. Earnings per share 30
CIBC CARIBBEAN BANK LIMITED AND SUBSIDIARIES Notes to the Consolidated and Carve-out Financial Statements FOR THE YEAR ENDED OCTOBER 31 (expressed in thousands of United States dollars) • In the principal market for the asset or liability; or • In the absence of a principal market, in the most advantageous market for the asset or liability. The principal or the most advantageous market must be accessible to the Group. The fair value of an asset or a liability is measured using the assumptions that market participants would use when pricing the asset or liability, assuming that market participants act in their economic best interest. A fair value measurement of a non-financial asset takes into account a market participant’s ability to generate economic benefits by using the asset in its highest and best use or by selling it to another market participant that would use the asset in its highest and best use. The Group uses valuation techniques that are appropriate in the circumstances and for which sufficient data are available to measure fair value, maximising the use of relevant observable inputs and minimising the use of unobservable inputs. In the ordinary course of its business, the Group is a party to a number of legal proceedings, including regulatory investigations in which claims for substantial monetary damages are asserted against CIBC and its subsidiaries. Legal provisions are established if, in the opinion of management, it is both probable that an outflow of economic benefits will be required to resolve the matter and a reliable estimate can be made of the amount of the obligation. If the reliable estimate of probable loss involves a range of potential outcomes within which a specific amount appears to be a better estimate, that amount is accrued. If no specific amount within the range of potential outcomes appears to be a better estimate than any other amount, the midpoint in the range is accrued. In some instances, however, it is not possible either to determine whether an obligation is probable or to reliably estimate the amount of loss, in which case no accrual can be made. While there is inherent difficulty in predicting the outcome of legal proceedings, based on current knowledge and in consultation with legal counsel, we do not expect the outcome of these matters, individually or in aggregate, to have a material adverse effect on our consolidated and carve-out financial statements. However, the outcome of these matters, individually or in aggregate, may be material to our operating results for a particular reporting period. We regularly assess the adequacy of our litigation accruals and make the necessary adjustments to incorporate new information as it becomes available. Segment reporting Business segments are reported in a manner consistent with the internal reporting provided to the chief operating decision- maker. The chief operating decision-maker is the person or group that allocates resources to and assesses the performance of the business segments of an entity. The Group has determined the Group’s Executive Committee as its chief operating decision-maker. Interest income is reported net within revenue as management primarily relies on net interest income as a performance measure and not the gross income and expense. All transactions between business segments are conducted on an arm’s length basis, with intra-segment revenue and costs being eliminated on consolidation. Income and expenses directly associated with each segment are included in determining business segment performance. Fair value measurement The Group measures financial instruments, such as, derivatives, and FVOCI and FVPL debt securities, at fair value at each consolidated and carve-out statement of financial position date. Also, fair values of financial instruments measured at amortised cost are disclosed in Note 31. Fair value is the price that would be received to sell an asset or paid to transfer a liability in an orderly transaction between market participants at the measurement date. The fair value measurement is based on the presumption that the transaction to sell the asset or transfer the liability takes place either: Provisions and contingent liabilities 31
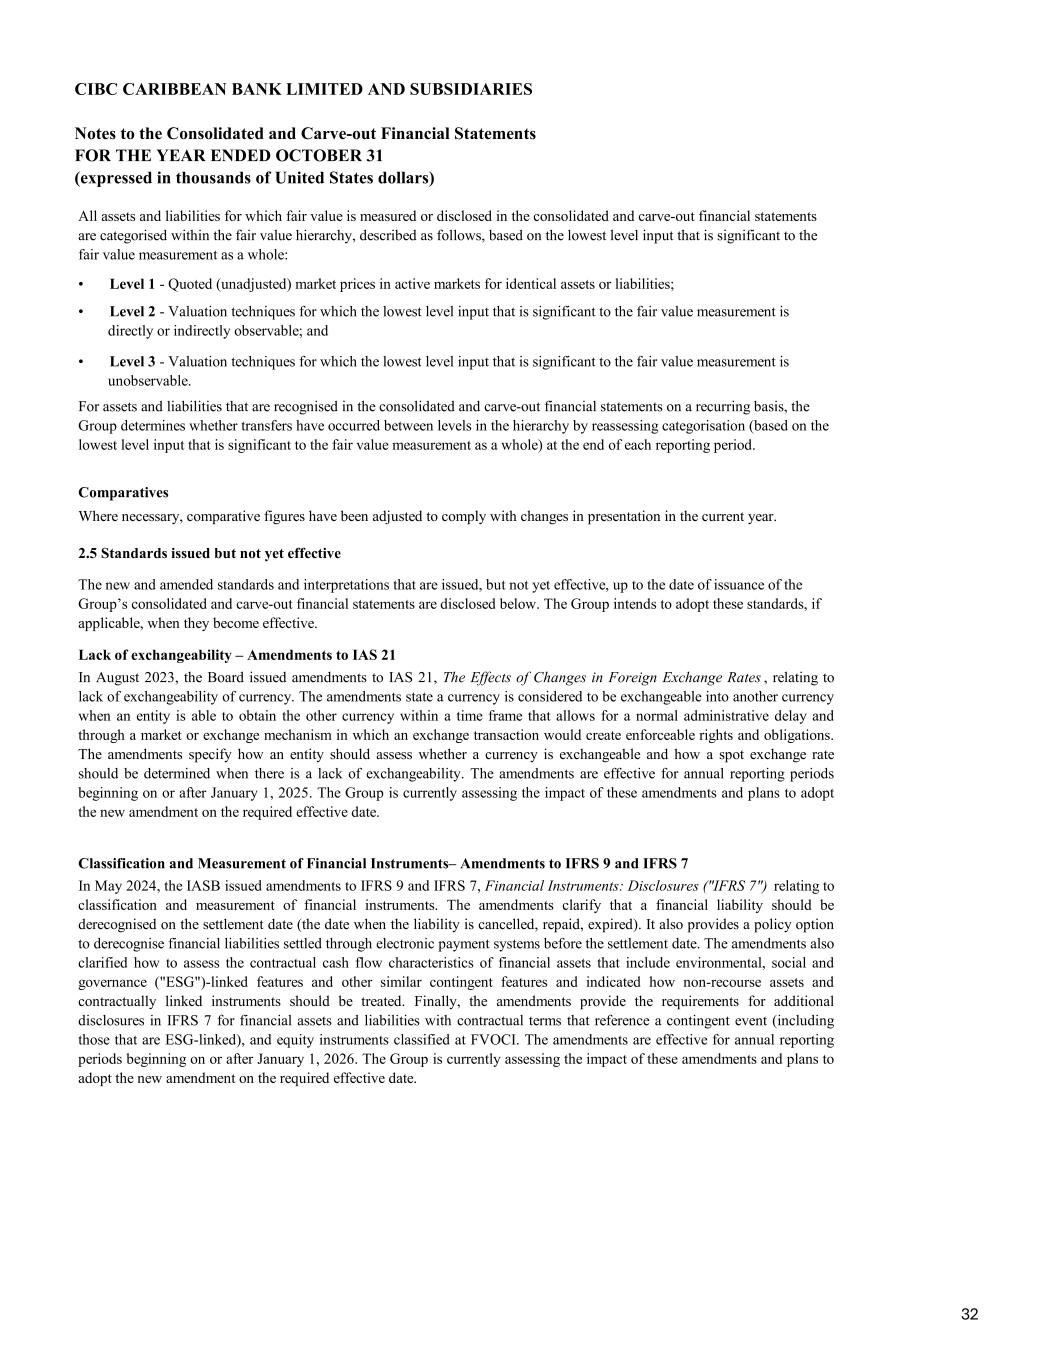
CIBC CARIBBEAN BANK LIMITED AND SUBSIDIARIES Notes to the Consolidated and Carve-out Financial Statements FOR THE YEAR ENDED OCTOBER 31 (expressed in thousands of United States dollars) For assets and liabilities that are recognised in the consolidated and carve-out financial statements on a recurring basis, the Group determines whether transfers have occurred between levels in the hierarchy by reassessing categorisation (based on the lowest level input that is significant to the fair value measurement as a whole) at the end of each reporting period. In August 2023, the Board issued amendments to IAS 21, The Effects of Changes in Foreign Exchange Rates , relating to lack of exchangeability of currency. The amendments state a currency is considered to be exchangeable into another currency when an entity is able to obtain the other currency within a time frame that allows for a normal administrative delay and through a market or exchange mechanism in which an exchange transaction would create enforceable rights and obligations. The amendments specify how an entity should assess whether a currency is exchangeable and how a spot exchange rate should be determined when there is a lack of exchangeability. The amendments are effective for annual reporting periods beginning on or after January 1, 2025. The Group is currently assessing the impact of these amendments and plans to adopt the new amendment on the required effective date. All assets and liabilities for which fair value is measured or disclosed in the consolidated and carve-out financial statements are categorised within the fair value hierarchy, described as follows, based on the lowest level input that is significant to the fair value measurement as a whole: • Level 1 - Quoted (unadjusted) market prices in active markets for identical assets or liabilities; • Level 2 - Valuation techniques for which the lowest level input that is significant to the fair value measurement is directly or indirectly observable; and • Level 3 - Valuation techniques for which the lowest level input that is significant to the fair value measurement is unobservable. Classification and Measurement of Financial Instruments– Amendments to IFRS 9 and IFRS 7 2.5 Standards issued but not yet effective The new and amended standards and interpretations that are issued, but not yet effective, up to the date of issuance of the Group’s consolidated and carve-out financial statements are disclosed below. The Group intends to adopt these standards, if applicable, when they become effective. Comparatives Where necessary, comparative figures have been adjusted to comply with changes in presentation in the current year. Lack of exchangeability – Amendments to IAS 21 In May 2024, the IASB issued amendments to IFRS 9 and IFRS 7, Financial Instruments: Disclosures ("IFRS 7") relating to classification and measurement of financial instruments. The amendments clarify that a financial liability should be derecognised on the settlement date (the date when the liability is cancelled, repaid, expired). It also provides a policy option to derecognise financial liabilities settled through electronic payment systems before the settlement date. The amendments also clarified how to assess the contractual cash flow characteristics of financial assets that include environmental, social and governance ("ESG")-linked features and other similar contingent features and indicated how non-recourse assets and contractually linked instruments should be treated. Finally, the amendments provide the requirements for additional disclosures in IFRS 7 for financial assets and liabilities with contractual terms that reference a contingent event (including those that are ESG-linked), and equity instruments classified at FVOCI. The amendments are effective for annual reporting periods beginning on or after January 1, 2026. The Group is currently assessing the impact of these amendments and plans to adopt the new amendment on the required effective date. 32
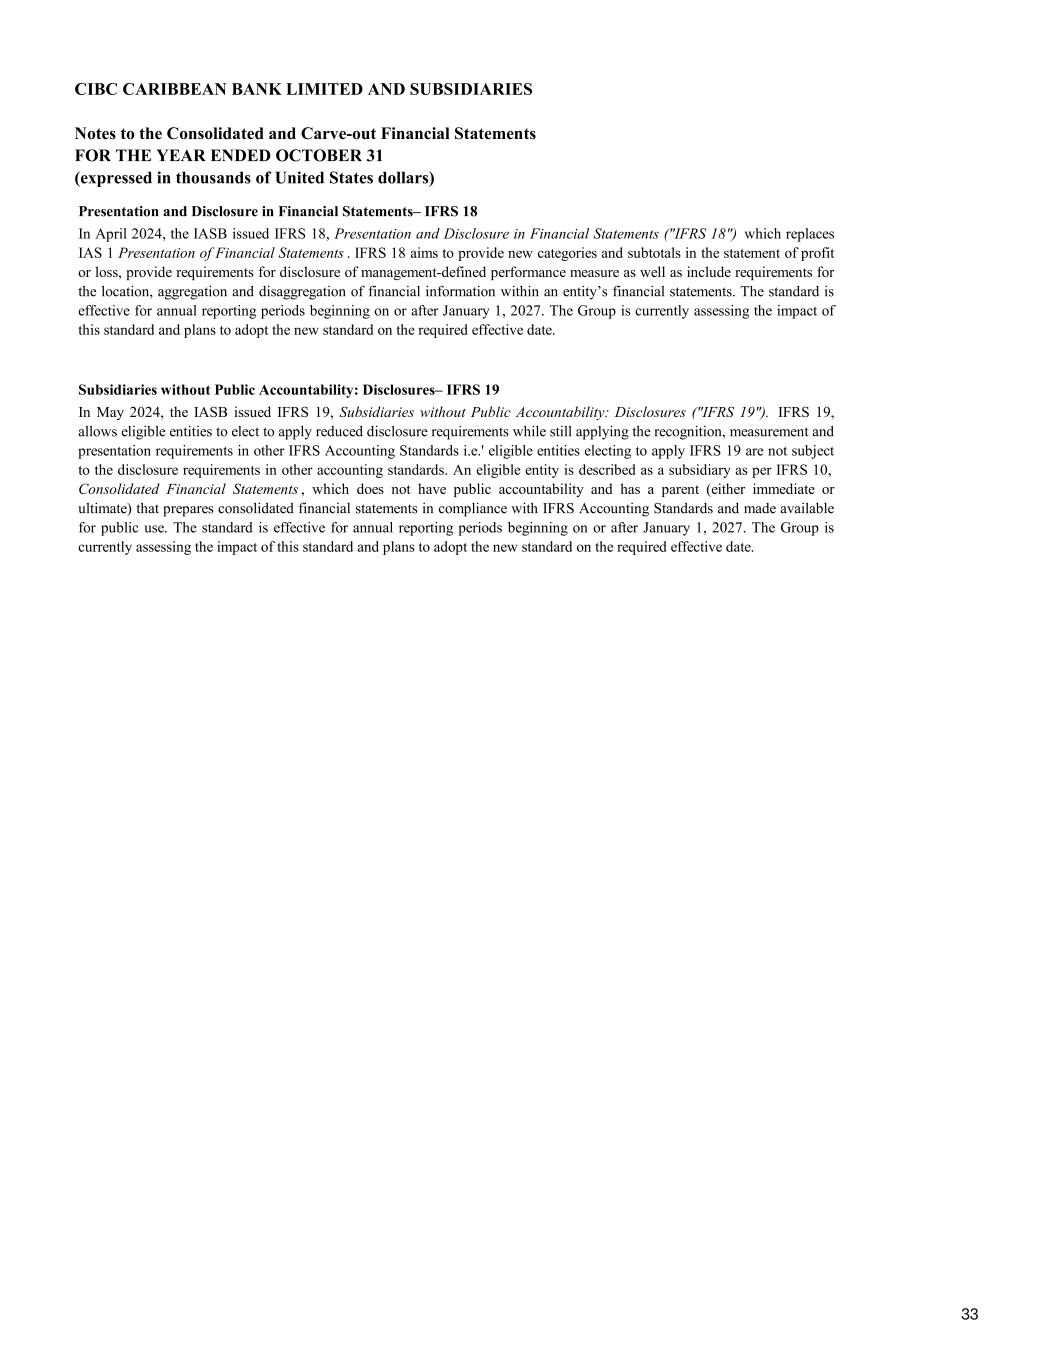
CIBC CARIBBEAN BANK LIMITED AND SUBSIDIARIES Notes to the Consolidated and Carve-out Financial Statements FOR THE YEAR ENDED OCTOBER 31 (expressed in thousands of United States dollars) In May 2024, the IASB issued IFRS 19, Subsidiaries without Public Accountability: Disclosures ("IFRS 19"). IFRS 19, allows eligible entities to elect to apply reduced disclosure requirements while still applying the recognition, measurement and presentation requirements in other IFRS Accounting Standards i.e.' eligible entities electing to apply IFRS 19 are not subject to the disclosure requirements in other accounting standards. An eligible entity is described as a subsidiary as per IFRS 10, Consolidated Financial Statements , which does not have public accountability and has a parent (either immediate or ultimate) that prepares consolidated financial statements in compliance with IFRS Accounting Standards and made available for public use. The standard is effective for annual reporting periods beginning on or after January 1, 2027. The Group is currently assessing the impact of this standard and plans to adopt the new standard on the required effective date. Presentation and Disclosure in Financial Statements– IFRS 18 In April 2024, the IASB issued IFRS 18, Presentation and Disclosure in Financial Statements ("IFRS 18") which replaces IAS 1 Presentation of Financial Statements . IFRS 18 aims to provide new categories and subtotals in the statement of profit or loss, provide requirements for disclosure of management-defined performance measure as well as include requirements for the location, aggregation and disaggregation of financial information within an entity’s financial statements. The standard is effective for annual reporting periods beginning on or after January 1, 2027. The Group is currently assessing the impact of this standard and plans to adopt the new standard on the required effective date. Subsidiaries without Public Accountability: Disclosures– IFRS 19 33
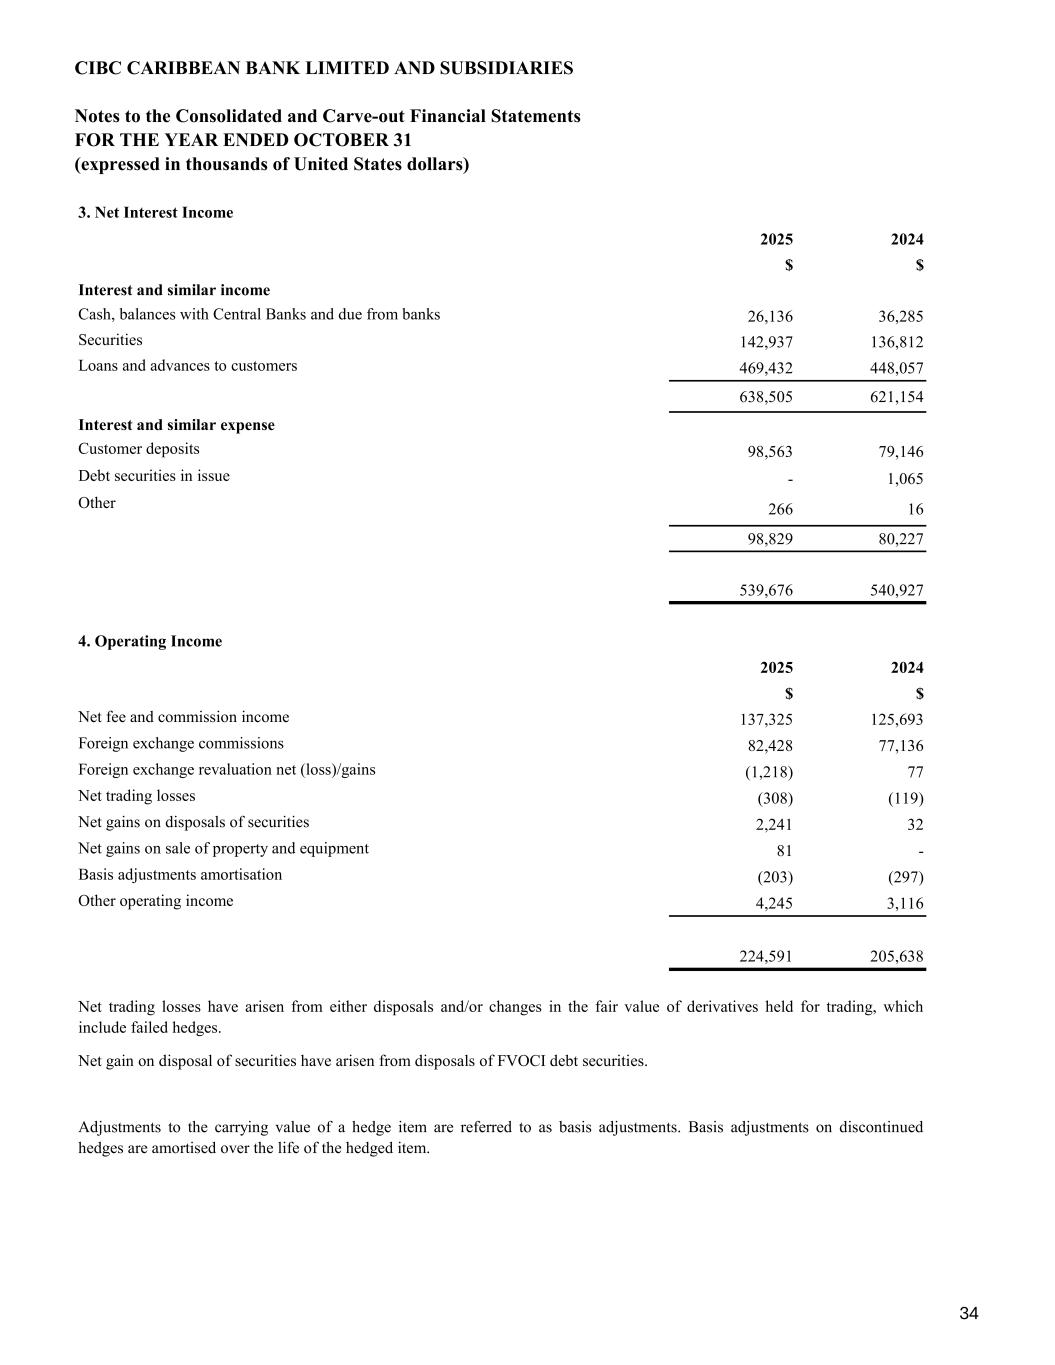
CIBC CARIBBEAN BANK LIMITED AND SUBSIDIARIES Notes to the Consolidated and Carve-out Financial Statements FOR THE YEAR ENDED OCTOBER 31 (expressed in thousands of United States dollars) 2025 2024 $ $ Cash, balances with Central Banks and due from banks 26,136 36,285 Securities 142,937 136,812 Loans and advances to customers 469,432 448,057 638,505 621,154 Customer deposits 98,563 79,146 Debt securities in issue - 1,065 Other 266 16 98,829 80,227 539,676 540,927 2025 2024 $ $ Net fee and commission income 137,325 125,693 Foreign exchange commissions 82,428 77,136 Foreign exchange revaluation net (loss)/gains (1,218) 77 Net trading losses (308) (119) Net gains on disposals of securities 2,241 32 Net gains on sale of property and equipment 81 - Basis adjustments amortisation (203) (297) Other operating income 4,245 3,116 224,591 205,638 3. Net Interest Income Interest and similar income Interest and similar expense 4. Operating Income Net trading losses have arisen from either disposals and/or changes in the fair value of derivatives held for trading, which include failed hedges. Adjustments to the carrying value of a hedge item are referred to as basis adjustments. Basis adjustments on discontinued hedges are amortised over the life of the hedged item. Net gain on disposal of securities have arisen from disposals of FVOCI debt securities. 34
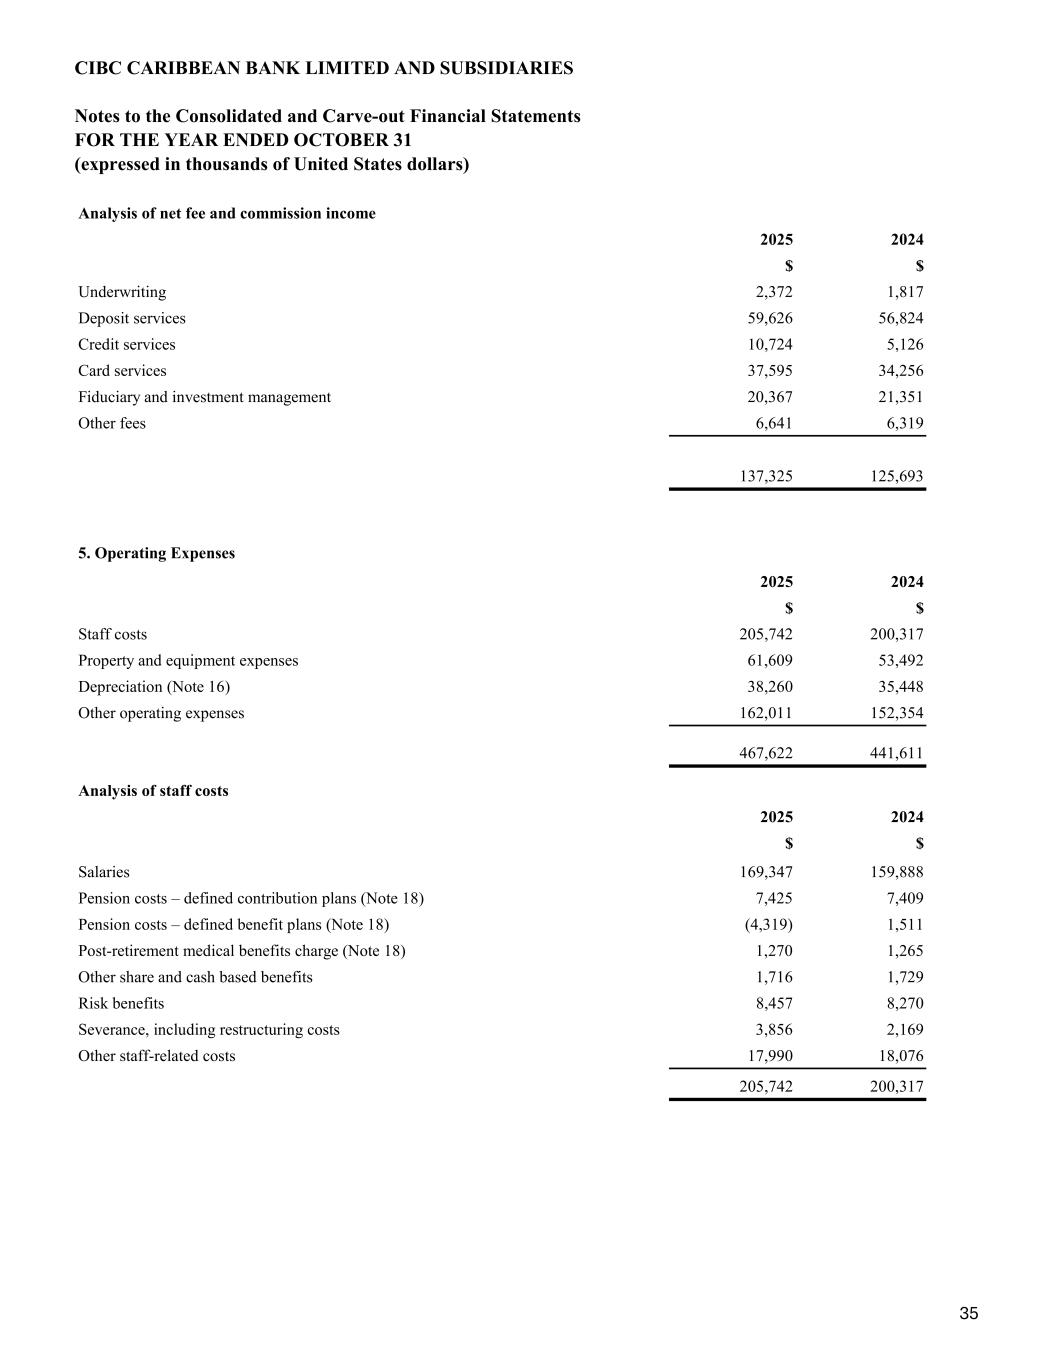
CIBC CARIBBEAN BANK LIMITED AND SUBSIDIARIES Notes to the Consolidated and Carve-out Financial Statements FOR THE YEAR ENDED OCTOBER 31 (expressed in thousands of United States dollars) Analysis of net fee and commission income 2025 2024 $ $ Underwriting 2,372 1,817 Deposit services 59,626 56,824 Credit services 10,724 5,126 Card services 37,595 34,256 Fiduciary and investment management 20,367 21,351 Other fees 6,641 6,319 137,325 125,693 2025 2024 $ $ Staff costs 205,742 200,317 Property and equipment expenses 61,609 53,492 Depreciation (Note 16) 38,260 35,448 Other operating expenses 162,011 152,354 467,622 441,611 Analysis of staff costs 2025 2024 $ $ Salaries 169,347 159,888 Pension costs – defined contribution plans (Note 18) 7,425 7,409 Pension costs – defined benefit plans (Note 18) (4,319) 1,511 Post-retirement medical benefits charge (Note 18) 1,270 1,265 Other share and cash based benefits 1,716 1,729 Risk benefits 8,457 8,270 Severance, including restructuring costs 3,856 2,169 Other staff-related costs 17,990 18,076 205,742 200,317 5. Operating Expenses 35
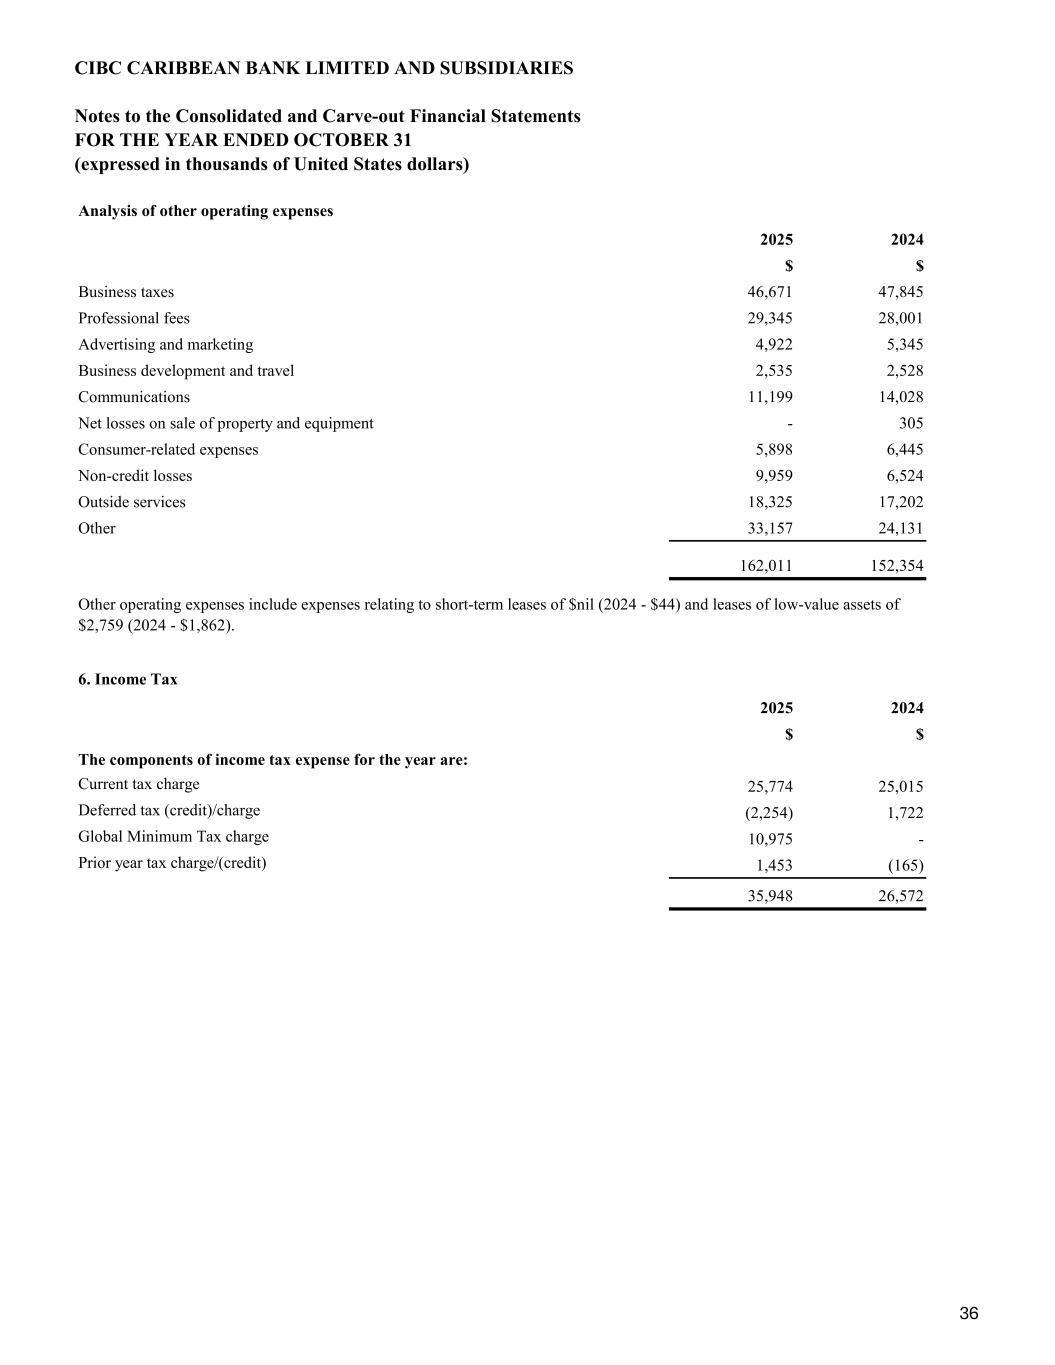
CIBC CARIBBEAN BANK LIMITED AND SUBSIDIARIES Notes to the Consolidated and Carve-out Financial Statements FOR THE YEAR ENDED OCTOBER 31 (expressed in thousands of United States dollars) 2025 2024 $ $ Business taxes 46,671 47,845 Professional fees 29,345 28,001 Advertising and marketing 4,922 5,345 Business development and travel 2,535 2,528 Communications 11,199 14,028 Net losses on sale of property and equipment - 305 Consumer-related expenses 5,898 6,445 Non-credit losses 9,959 6,524 Outside services 18,325 17,202 Other 33,157 24,131 162,011 152,354 2025 2024 $ $ Current tax charge 25,774 25,015 Deferred tax (credit)/charge (2,254) 1,722 Global Minimum Tax charge 10,975 - Prior year tax charge/(credit) 1,453 (165) 35,948 26,572 Other operating expenses include expenses relating to short-term leases of $nil (2024 - $44) and leases of low-value assets of $2,759 (2024 - $1,862). 6. Income Tax The components of income tax expense for the year are: Analysis of other operating expenses 36
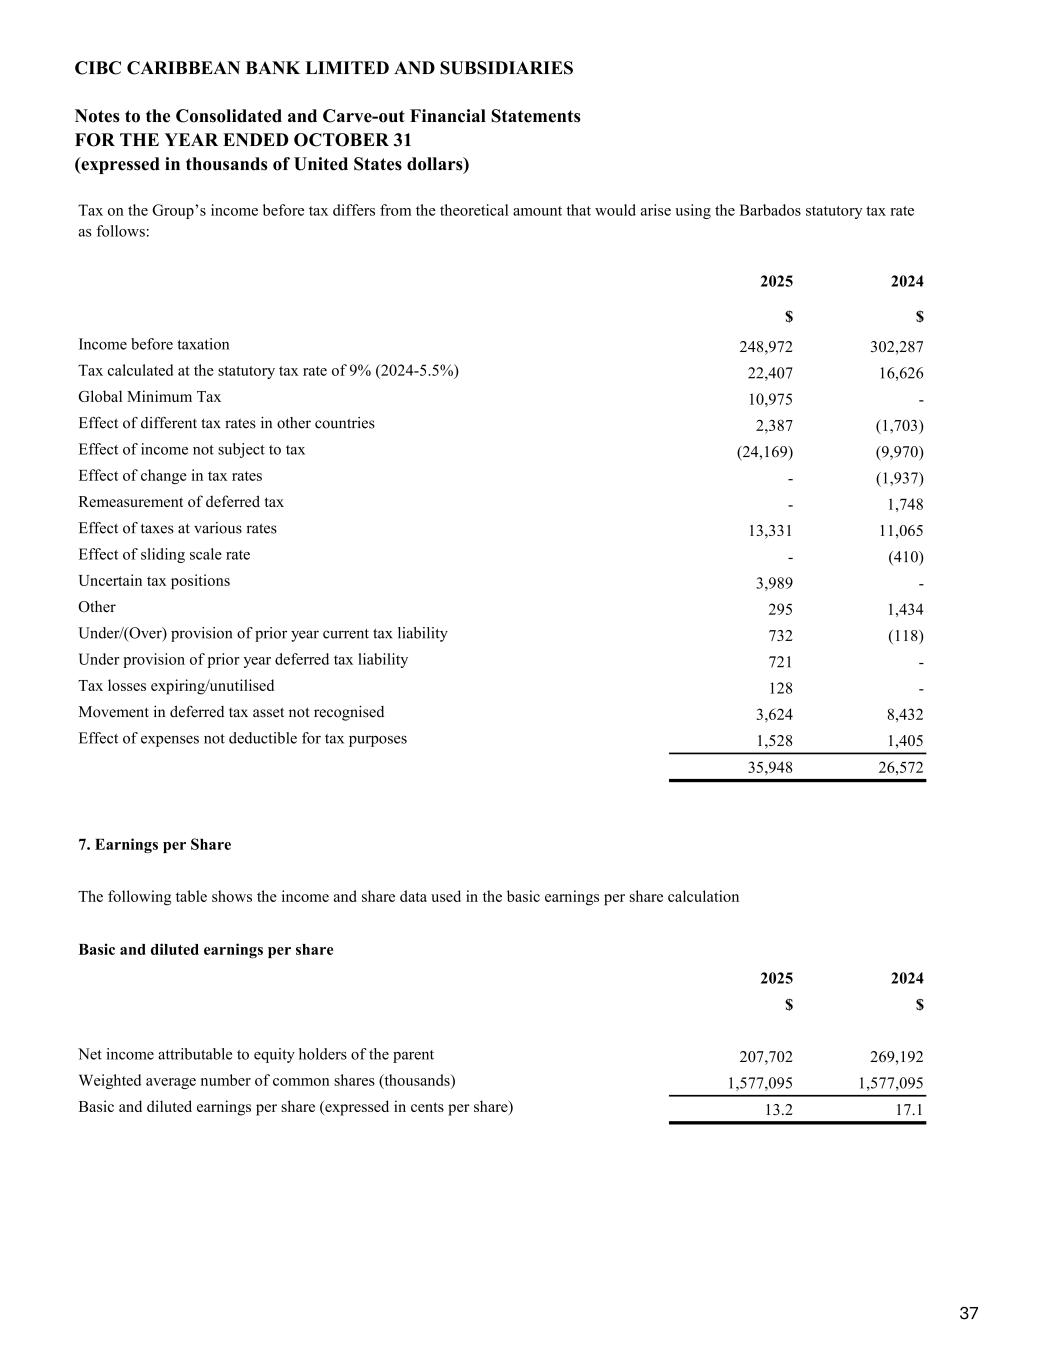
CIBC CARIBBEAN BANK LIMITED AND SUBSIDIARIES Notes to the Consolidated and Carve-out Financial Statements FOR THE YEAR ENDED OCTOBER 31 (expressed in thousands of United States dollars) 2025 2024 $ $ Income before taxation 248,972 302,287 Tax calculated at the statutory tax rate of 9% (2024-5.5%) 22,407 16,626 Global Minimum Tax 10,975 - Effect of different tax rates in other countries 2,387 (1,703) Effect of income not subject to tax (24,169) (9,970) Effect of change in tax rates - (1,937) Remeasurement of deferred tax - 1,748 Effect of taxes at various rates 13,331 11,065 Effect of sliding scale rate - (410) Uncertain tax positions 3,989 - Other 295 1,434 Under/(Over) provision of prior year current tax liability 732 (118) Under provision of prior year deferred tax liability 721 - Tax losses expiring/unutilised 128 - Movement in deferred tax asset not recognised 3,624 8,432 Effect of expenses not deductible for tax purposes 1,528 1,405 35,948 26,572 The following table shows the income and share data used in the basic earnings per share calculation Basic and diluted earnings per share 2025 2024 $ $ Net income attributable to equity holders of the parent 207,702 269,192 Weighted average number of common shares (thousands) 1,577,095 1,577,095 Basic and diluted earnings per share (expressed in cents per share) 13.2 17.1 Tax on the Group’s income before tax differs from the theoretical amount that would arise using the Barbados statutory tax rate as follows: 7. Earnings per Share 37
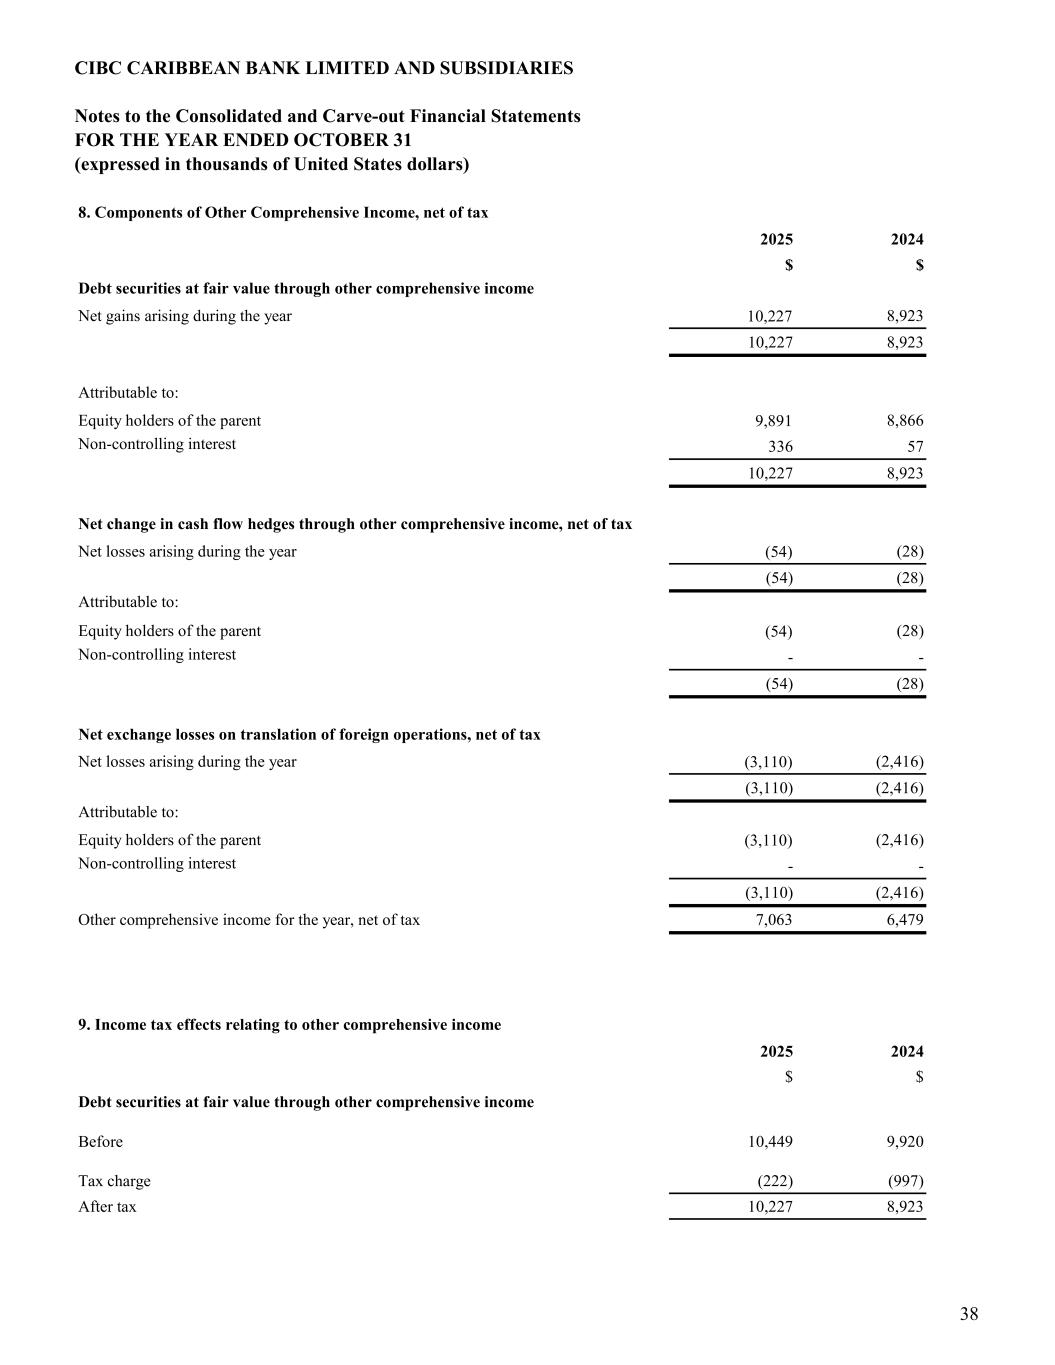
CIBC CARIBBEAN BANK LIMITED AND SUBSIDIARIES Notes to the Consolidated and Carve-out Financial Statements FOR THE YEAR ENDED OCTOBER 31 (expressed in thousands of United States dollars) 2025 2024 $ $ Debt securities at fair value through other comprehensive income Net gains arising during the year 10,227 8,923 10,227 8,923 Attributable to: Equity holders of the parent 9,891 8,866 336 57 10,227 8,923 Net change in cash flow hedges through other comprehensive income, net of tax Net losses arising during the year (54) (28) (54) (28) Attributable to: Equity holders of the parent (54) (28) - - (54) (28) Net exchange losses on translation of foreign operations, net of tax Net losses arising during the year (3,110) (2,416) (3,110) (2,416) Attributable to: Equity holders of the parent (3,110) (2,416) - - (3,110) (2,416) Other comprehensive income for the year, net of tax 7,063 6,479 2025 2024 $ $ Before 10,449 9,920 Tax charge (222) (997) After tax 10,227 8,923 Debt securities at fair value through other comprehensive income 9. Income tax effects relating to other comprehensive income 8. Components of Other Comprehensive Income, net of tax Non-controlling interest Non-controlling interest Non-controlling interest 38
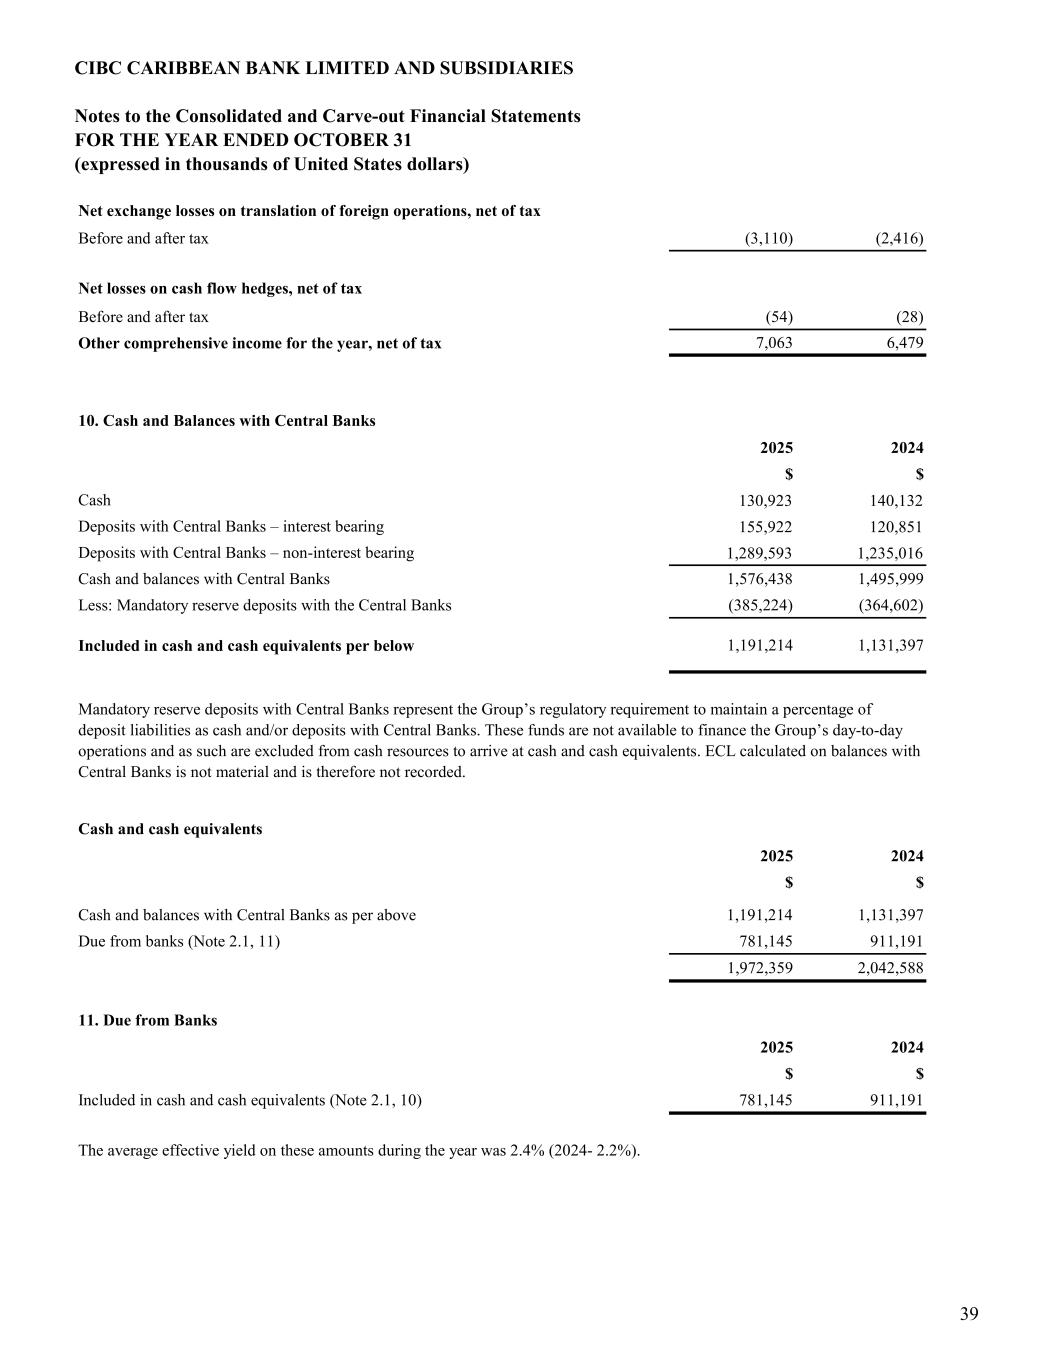
CIBC CARIBBEAN BANK LIMITED AND SUBSIDIARIES Notes to the Consolidated and Carve-out Financial Statements FOR THE YEAR ENDED OCTOBER 31 (expressed in thousands of United States dollars) Net exchange losses on translation of foreign operations, net of tax Before and after tax (3,110) (2,416) Before and after tax (54) (28) Other comprehensive income for the year, net of tax 7,063 6,479 2025 2024 $ $ Cash 130,923 140,132 Deposits with Central Banks – interest bearing 155,922 120,851 Deposits with Central Banks – non-interest bearing 1,289,593 1,235,016 Cash and balances with Central Banks 1,576,438 1,495,999 Less: Mandatory reserve deposits with the Central Banks (385,224) (364,602) Included in cash and cash equivalents per below 1,191,214 1,131,397 2025 2024 $ $ Cash and balances with Central Banks as per above 1,191,214 1,131,397 Due from banks (Note 2.1, 11) 781,145 911,191 1,972,359 2,042,588 2025 2024 $ $ Included in cash and cash equivalents (Note 2.1, 10) 781,145 911,191 Cash and cash equivalents 11. Due from Banks The average effective yield on these amounts during the year was 2.4% (2024- 2.2%). Mandatory reserve deposits with Central Banks represent the Group’s regulatory requirement to maintain a percentage of deposit liabilities as cash and/or deposits with Central Banks. These funds are not available to finance the Group’s day-to-day operations and as such are excluded from cash resources to arrive at cash and cash equivalents. ECL calculated on balances with Central Banks is not material and is therefore not recorded. 10. Cash and Balances with Central Banks Net losses on cash flow hedges, net of tax 39
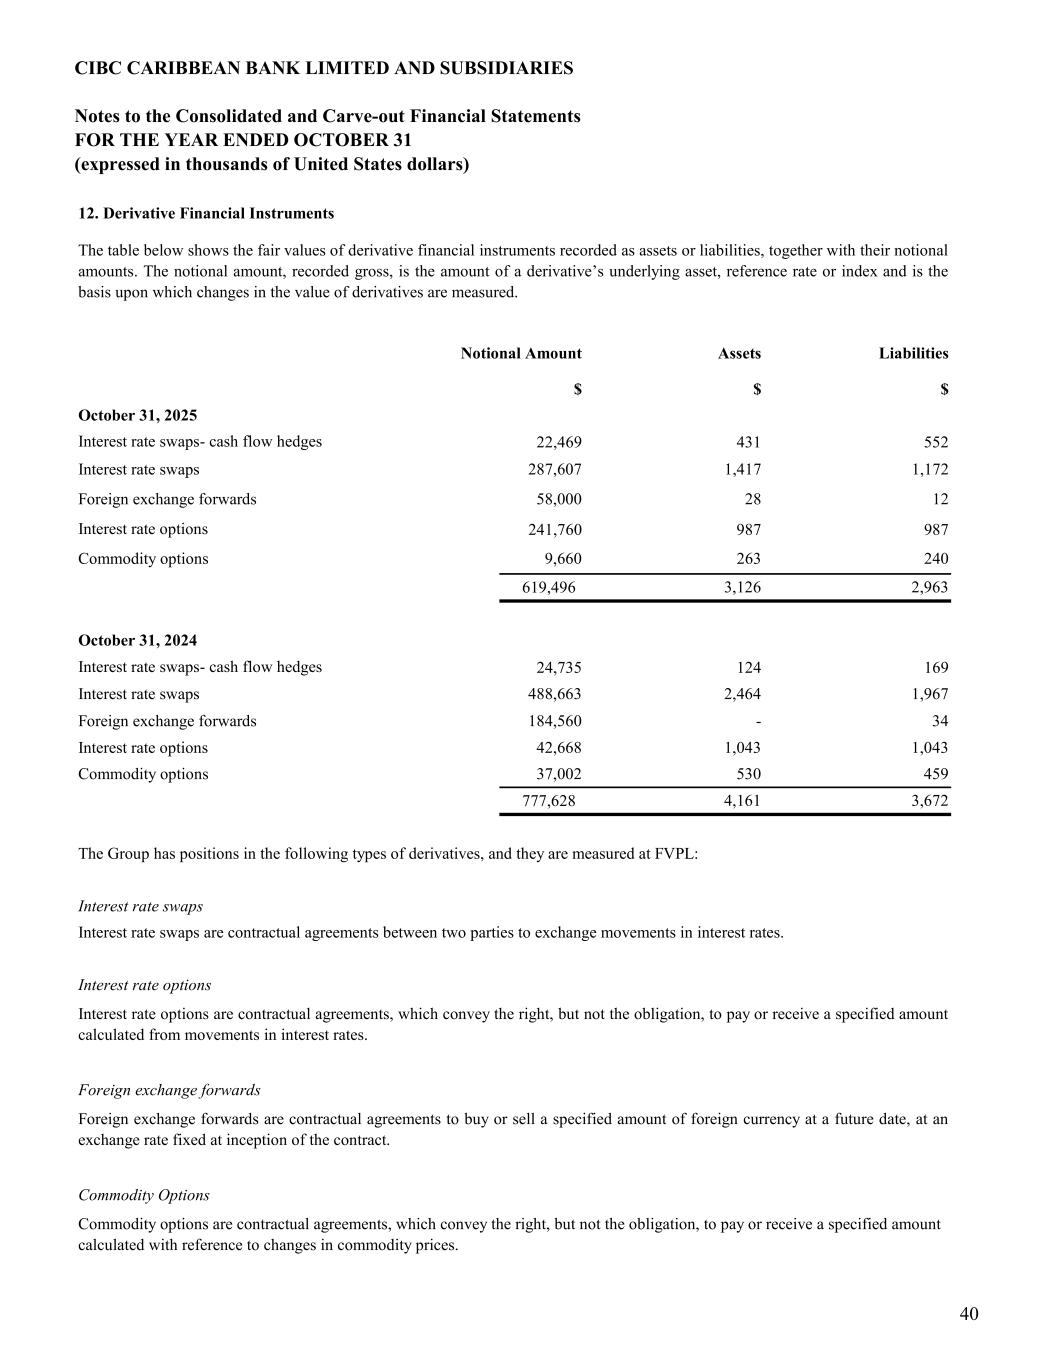
CIBC CARIBBEAN BANK LIMITED AND SUBSIDIARIES Notes to the Consolidated and Carve-out Financial Statements FOR THE YEAR ENDED OCTOBER 31 (expressed in thousands of United States dollars) 12. Derivative Financial Instruments 22,469 431 552 241,760 987 987 619,496 24,735 124 169 777,628 3,126 Commodity options 42,668 1,043 3,672 37,002 530 Foreign exchange forwards Foreign exchange forwards are contractual agreements to buy or sell a specified amount of foreign currency at a future date, at an exchange rate fixed at inception of the contract. 2,963 October 31, 2024 Interest rate swaps- cash flow hedges Interest rate swaps 488,663 Interest rate options The table below shows the fair values of derivative financial instruments recorded as assets or liabilities, together with their notional amounts. The notional amount, recorded gross, is the amount of a derivative’s underlying asset, reference rate or index and is the basis upon which changes in the value of derivatives are measured. Notional Amount $ 287,607 58,000 9,660 Assets $ 1,417 28 263 October 31, 2025 Commodity options Foreign exchange forwards Interest rate swaps Interest rate swaps- cash flow hedges Interest rate options Liabilities $ 1,172 12 240 1,043 184,560 The Group has positions in the following types of derivatives, and they are measured at FVPL: Interest rate swaps are contractual agreements between two parties to exchange movements in interest rates. Interest rate options Interest rate swaps Interest rate options are contractual agreements, which convey the right, but not the obligation, to pay or receive a specified amount calculated from movements in interest rates. Commodity Options Commodity options are contractual agreements, which convey the right, but not the obligation, to pay or receive a specified amount calculated with reference to changes in commodity prices. 4,161 459 2,464 1,967 Foreign exchange forwards - 34 40
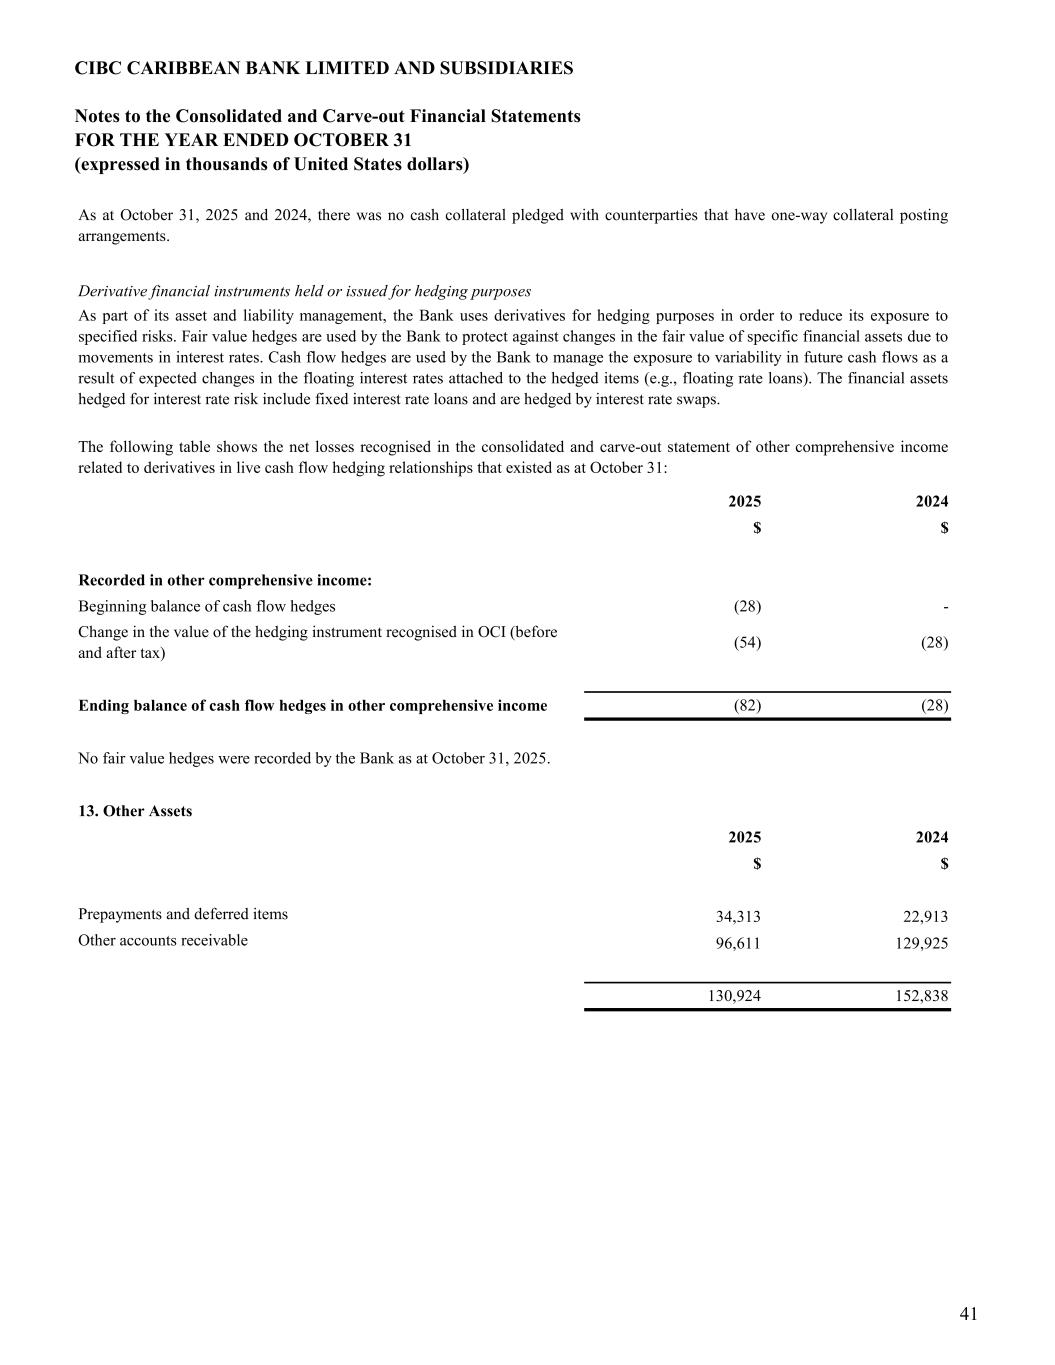
CIBC CARIBBEAN BANK LIMITED AND SUBSIDIARIES Notes to the Consolidated and Carve-out Financial Statements FOR THE YEAR ENDED OCTOBER 31 (expressed in thousands of United States dollars) 34,313 22,913 96,611 129,925 As at October 31, 2025 and 2024, there was no cash collateral pledged with counterparties that have one-way collateral posting arrangements. Derivative financial instruments held or issued for hedging purposes Other accounts receivable 130,924 The following table shows the net losses recognised in the consolidated and carve-out statement of other comprehensive income related to derivatives in live cash flow hedging relationships that existed as at October 31: 152,838 $ $ Prepayments and deferred items 13. Other Assets 2025 As part of its asset and liability management, the Bank uses derivatives for hedging purposes in order to reduce its exposure to specified risks. Fair value hedges are used by the Bank to protect against changes in the fair value of specific financial assets due to movements in interest rates. Cash flow hedges are used by the Bank to manage the exposure to variability in future cash flows as a result of expected changes in the floating interest rates attached to the hedged items (e.g., floating rate loans). The financial assets hedged for interest rate risk include fixed interest rate loans and are hedged by interest rate swaps. 2024 $ No fair value hedges were recorded by the Bank as at October 31, 2025. (54) (28) Recorded in other comprehensive income: Beginning balance of cash flow hedges Change in the value of the hedging instrument recognised in OCI (before and after tax) (28) 2025 (28)Ending balance of cash flow hedges in other comprehensive income (82) - $ 2024 41
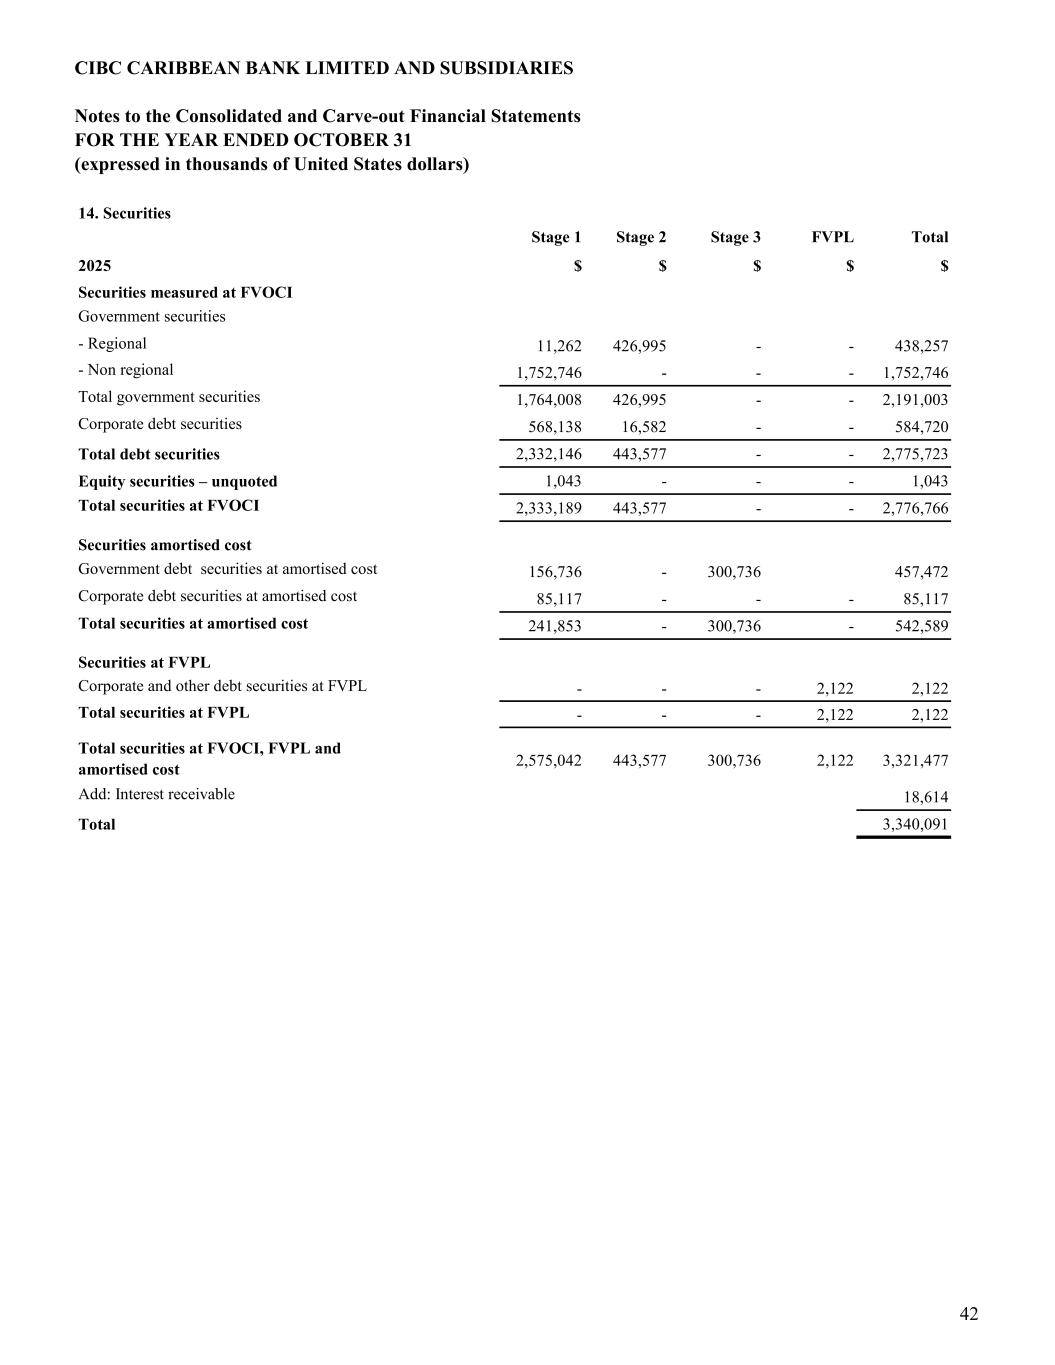
CIBC CARIBBEAN BANK LIMITED AND SUBSIDIARIES Notes to the Consolidated and Carve-out Financial Statements FOR THE YEAR ENDED OCTOBER 31 (expressed in thousands of United States dollars) 14. Securities Stage 1 Stage 2 Stage 3 FVPL Total 2025 $ $ $ $ $ Securities measured at FVOCI Government securities - Regional 11,262 426,995 - - 438,257 - Non regional 1,752,746 - - - 1,752,746 Total government securities 1,764,008 426,995 - - 2,191,003 Corporate debt securities 568,138 16,582 - - 584,720 Total debt securities 2,332,146 443,577 - - 2,775,723 Equity securities – unquoted 1,043 - - - 1,043 Total securities at FVOCI 2,333,189 443,577 - - 2,776,766 Securities amortised cost Government debt securities at amortised cost 156,736 - 300,736 457,472 Corporate debt securities at amortised cost 85,117 - - - 85,117 Total securities at amortised cost 241,853 - 300,736 - 542,589 Securities at FVPL Corporate and other debt securities at FVPL - - - 2,122 2,122 Total securities at FVPL - - - 2,122 2,122 2,575,042 443,577 300,736 2,122 3,321,477 Add: Interest receivable 18,614 Total 3,340,091 Total securities at FVOCI, FVPL and amortised cost 42
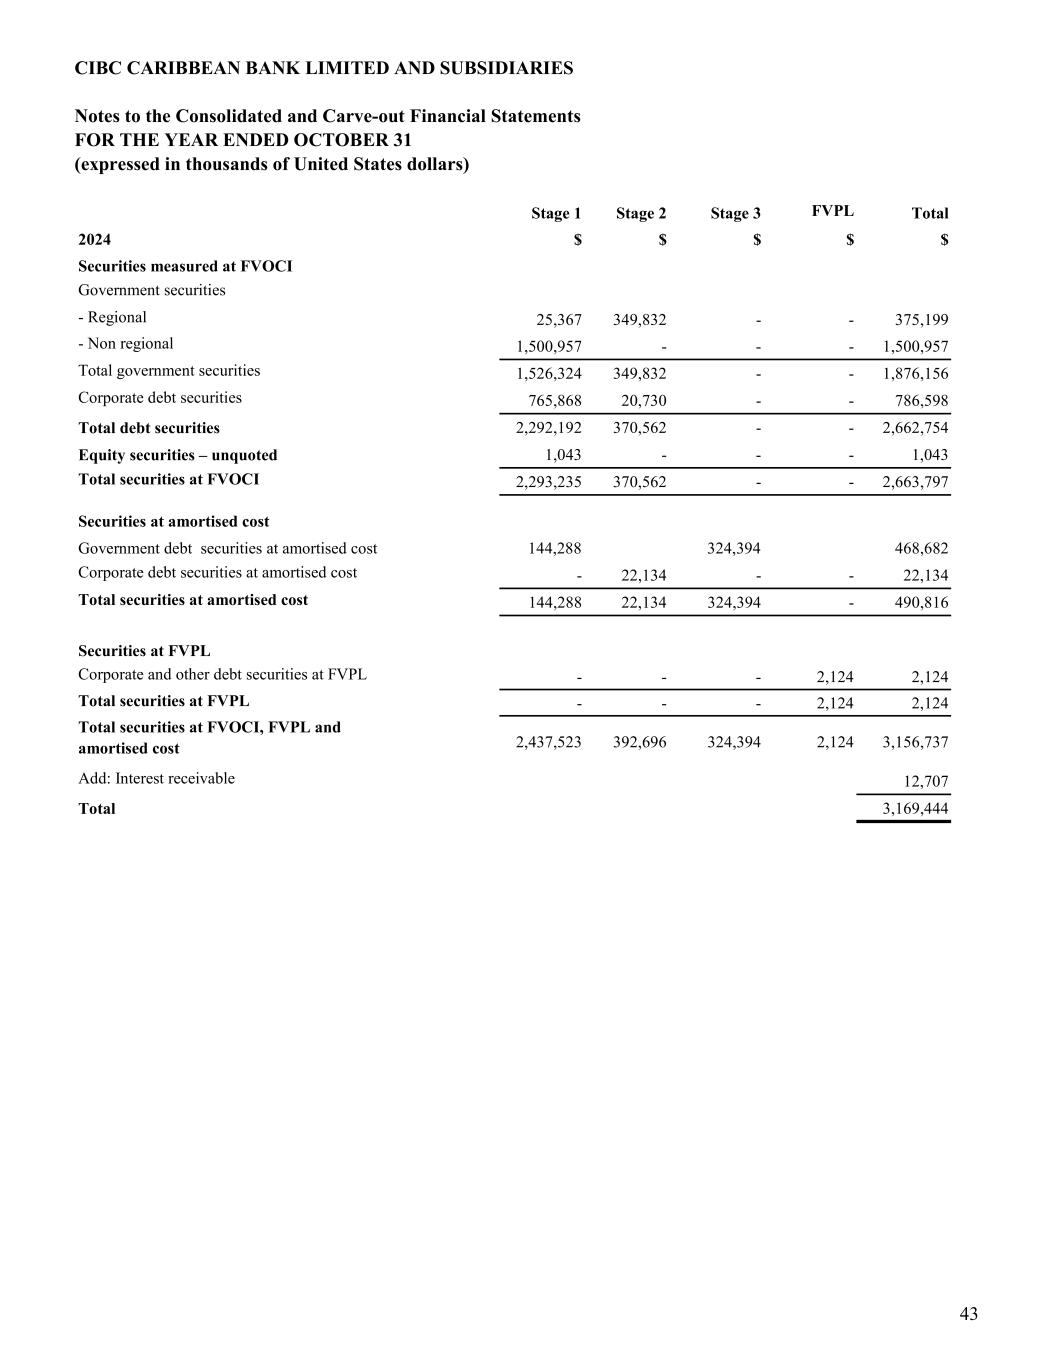
CIBC CARIBBEAN BANK LIMITED AND SUBSIDIARIES Notes to the Consolidated and Carve-out Financial Statements FOR THE YEAR ENDED OCTOBER 31 (expressed in thousands of United States dollars) Stage 1 Stage 2 Stage 3 FVPL Total 2024 $ $ $ $ $ Securities measured at FVOCI Government securities - Regional 25,367 349,832 - - 375,199 - Non regional 1,500,957 - - - 1,500,957 Total government securities 1,526,324 349,832 - - 1,876,156 Corporate debt securities 765,868 20,730 - - 786,598 Total debt securities 2,292,192 370,562 - - 2,662,754 Equity securities – unquoted 1,043 - - - 1,043 Total securities at FVOCI 2,293,235 370,562 - - 2,663,797 Securities at amortised cost Government debt securities at amortised cost 144,288 324,394 468,682 Corporate debt securities at amortised cost - 22,134 - - 22,134 Total securities at amortised cost 144,288 22,134 324,394 - 490,816 Securities at FVPL Corporate and other debt securities at FVPL - - - 2,124 2,124 Total securities at FVPL - - - 2,124 2,124 2,437,523 392,696 324,394 2,124 3,156,737 Add: Interest receivable 12,707 Total 3,169,444 Total securities at FVOCI, FVPL and amortised cost 43
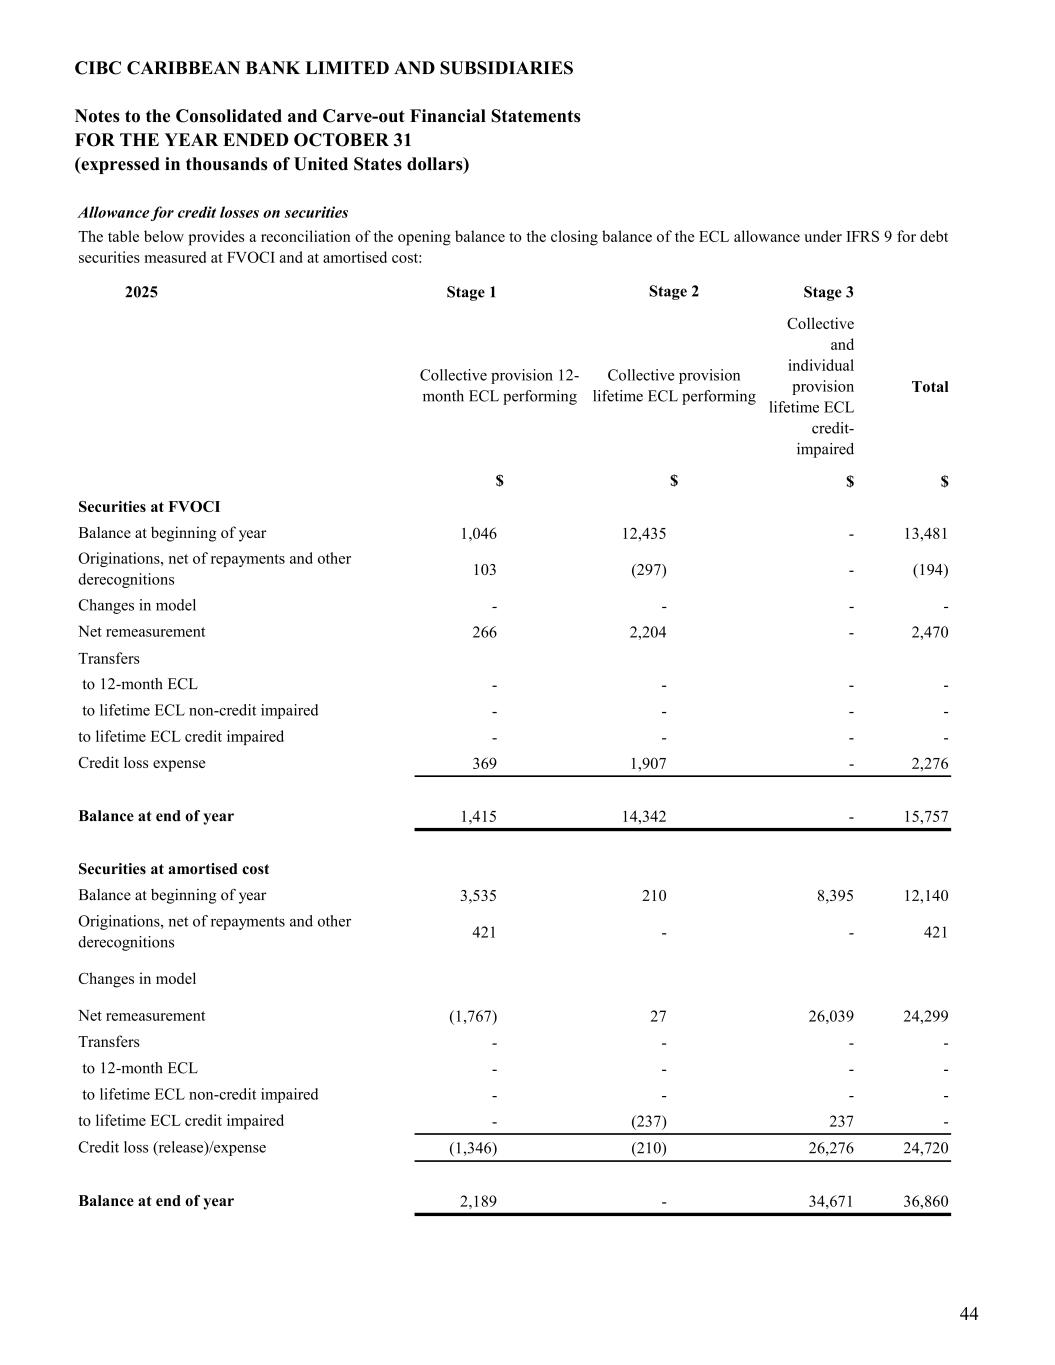
CIBC CARIBBEAN BANK LIMITED AND SUBSIDIARIES Notes to the Consolidated and Carve-out Financial Statements FOR THE YEAR ENDED OCTOBER 31 (expressed in thousands of United States dollars) 2025 Stage 1 Stage 3 Collective and individual provision lifetime ECL credit- impaired Total $ $ 1,046 12,435 - 13,481 103 (297) - (194) - - - - 266 2,204 - 2,470 Transfers - - - - - - - - - - - - 369 1,907 - 2,276 1,415 14,342 - 15,757 3,535 210 8,395 12,140 421 - - 421 (1,767) 27 26,039 24,299 - - - - - - - - - - - - - (237) 237 - (1,346) (210) 26,276 24,720 2,189 - 34,671 36,860 $ to lifetime ECL credit impaired Allowance for credit losses on securities Balance at end of year Securities at amortised cost Balance at beginning of year Originations, net of repayments and other derecognitions Net remeasurement Transfers Credit loss (release)/expense Securities at FVOCI Balance at beginning of year Originations, net of repayments and other derecognitions Changes in model The table below provides a reconciliation of the opening balance to the closing balance of the ECL allowance under IFRS 9 for debt securities measured at FVOCI and at amortised cost: Collective provision 12- month ECL performing Stage 2 Collective provision lifetime ECL performing to lifetime ECL non-credit impaired to lifetime ECL credit impaired Changes in model to 12-month ECL to lifetime ECL non-credit impaired Net remeasurement Credit loss expense Balance at end of year $ to 12-month ECL 44
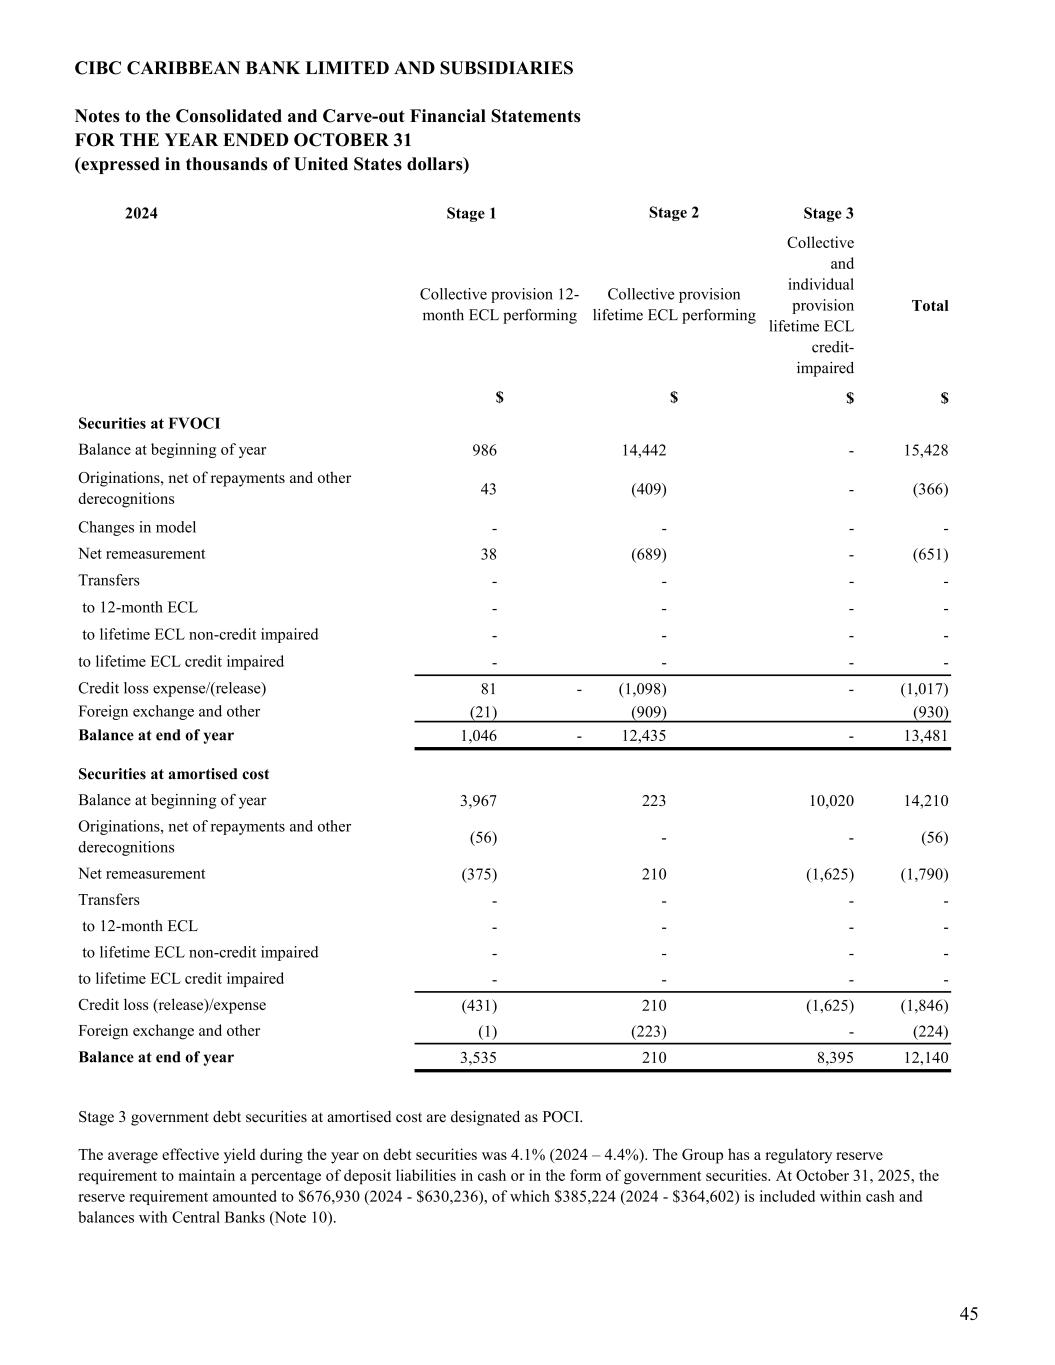
CIBC CARIBBEAN BANK LIMITED AND SUBSIDIARIES Notes to the Consolidated and Carve-out Financial Statements FOR THE YEAR ENDED OCTOBER 31 (expressed in thousands of United States dollars) 2024 Stage 1 Stage 3 Collective and individual provision lifetime ECL credit- impaired Total $ $ 986 14,442 - 15,428 43 (409) - (366) - - - - 38 (689) - (651) - - - - - - - - - - - - - - - - 81 - (1,098) - (1,017) (21) (909) (930) 1,046 - 12,435 - 13,481 3,967 223 10,020 14,210 (56) - - (56) (375) 210 (1,625) (1,790) - - - - - - - - - - - - - - - - (431) 210 (1,625) (1,846) (1) (223) - (224) 3,535 210 8,395 12,140 Balance at end of year Net remeasurement Collective provision lifetime ECL performing $ $ Balance at beginning of year Transfers Credit loss (release)/expense Balance at beginning of year Originations, net of repayments and other derecognitions Net remeasurement Transfers Credit loss expense/(release) Originations, net of repayments and other derecognitions Stage 3 government debt securities at amortised cost are designated as POCI. Securities at FVOCI Balance at end of year Securities at amortised cost to lifetime ECL credit impaired Foreign exchange and other to 12-month ECL to lifetime ECL non-credit impaired to lifetime ECL credit impaired Foreign exchange and other Stage 2 Collective provision 12- month ECL performing Changes in model to 12-month ECL to lifetime ECL non-credit impaired The average effective yield during the year on debt securities was 4.1% (2024 – 4.4%). The Group has a regulatory reserve requirement to maintain a percentage of deposit liabilities in cash or in the form of government securities. At October 31, 2025, the reserve requirement amounted to $676,930 (2024 - $630,236), of which $385,224 (2024 - $364,602) is included within cash and balances with Central Banks (Note 10). 45
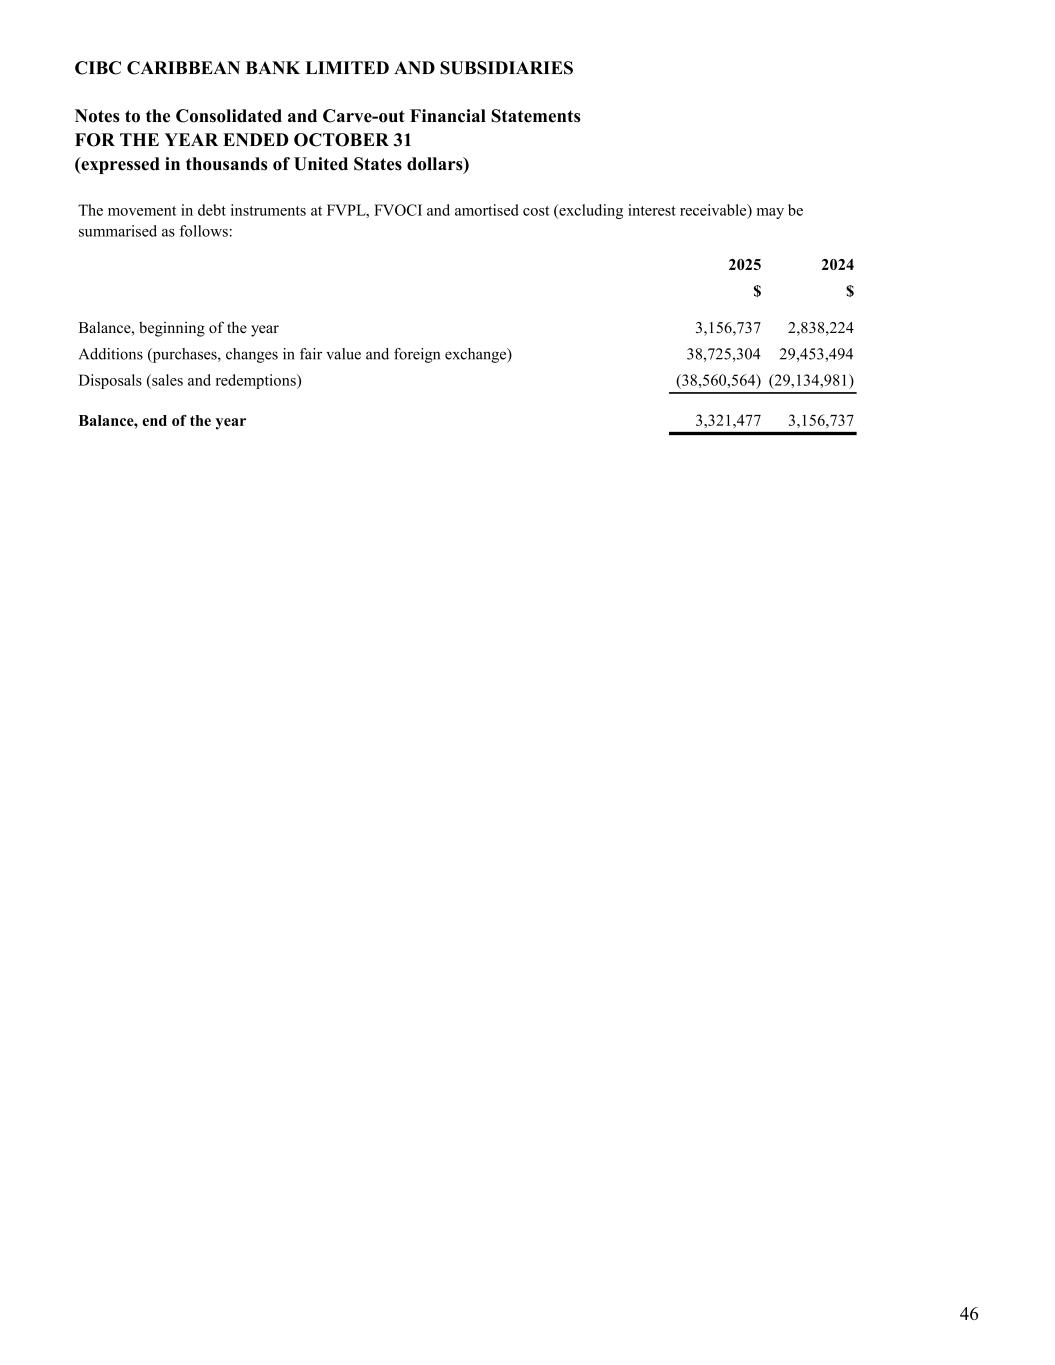
CIBC CARIBBEAN BANK LIMITED AND SUBSIDIARIES Notes to the Consolidated and Carve-out Financial Statements FOR THE YEAR ENDED OCTOBER 31 (expressed in thousands of United States dollars) 2025 2024 $ $ Balance, beginning of the year 3,156,737 2,838,224 Additions (purchases, changes in fair value and foreign exchange) 38,725,304 29,453,494 Disposals (sales and redemptions) (38,560,564) (29,134,981) Balance, end of the year 3,321,477 3,156,737 The movement in debt instruments at FVPL, FVOCI and amortised cost (excluding interest receivable) may be summarised as follows: 46
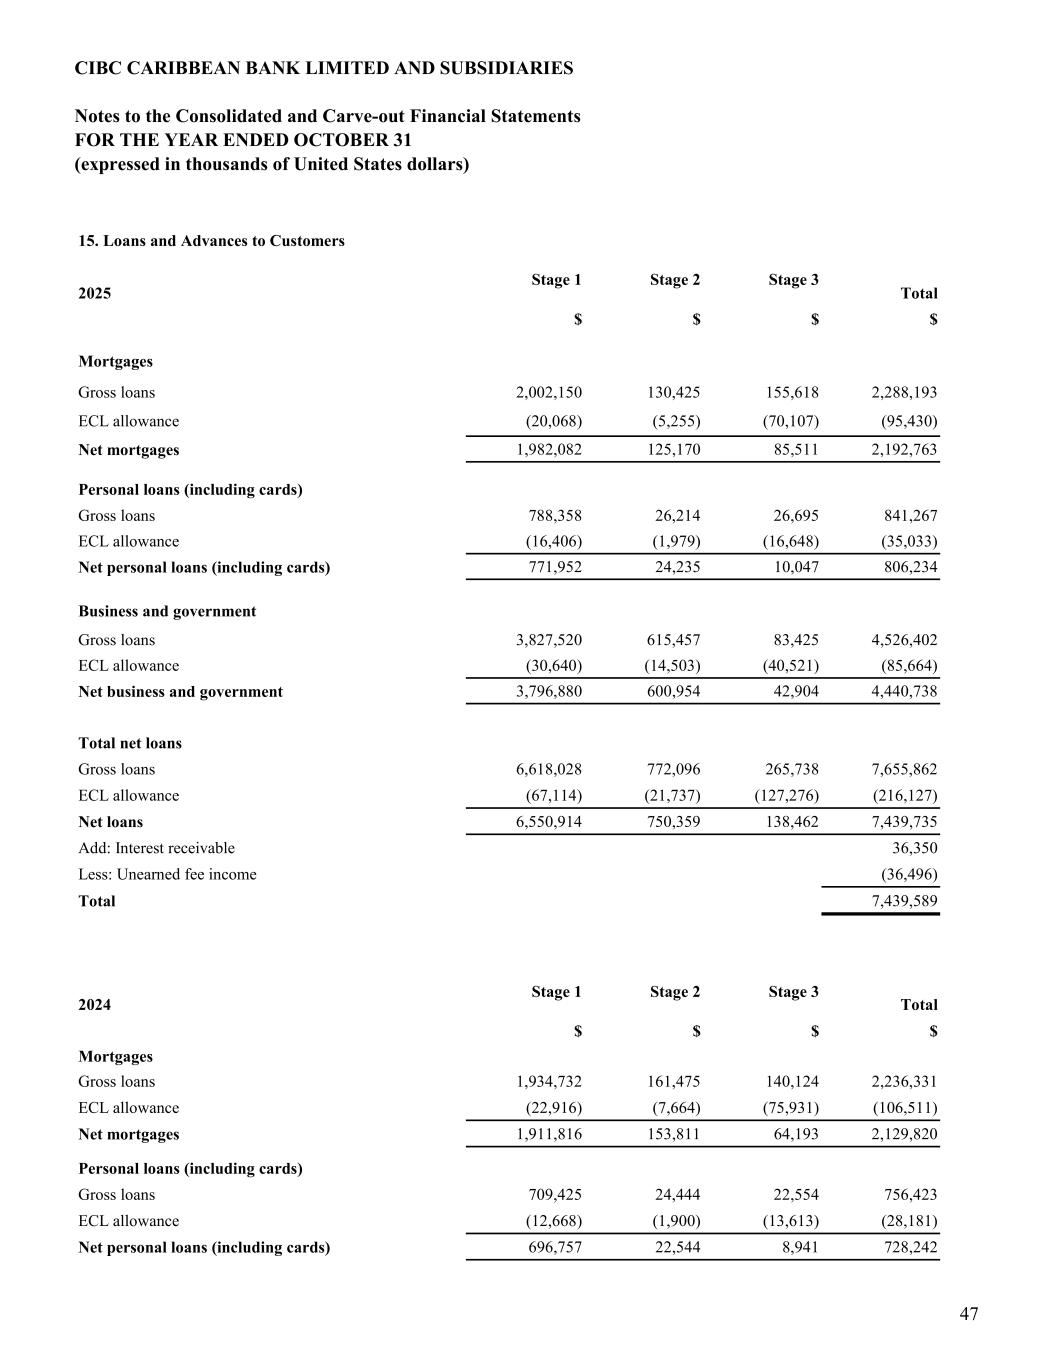
CIBC CARIBBEAN BANK LIMITED AND SUBSIDIARIES Notes to the Consolidated and Carve-out Financial Statements FOR THE YEAR ENDED OCTOBER 31 (expressed in thousands of United States dollars) 2025 Total $ $ $ $ Mortgages Gross loans 2,002,150 130,425 155,618 2,288,193 ECL allowance (20,068) (5,255) (70,107) (95,430) Net mortgages 1,982,082 125,170 85,511 2,192,763 Personal loans (including cards) Gross loans 788,358 26,214 26,695 841,267 ECL allowance (16,406) (1,979) (16,648) (35,033) Net personal loans (including cards) 771,952 24,235 10,047 806,234 Business and government Gross loans 3,827,520 615,457 83,425 4,526,402 ECL allowance (30,640) (14,503) (40,521) (85,664) Net business and government 3,796,880 600,954 42,904 4,440,738 Total net loans Gross loans 6,618,028 772,096 265,738 7,655,862 ECL allowance (67,114) (21,737) (127,276) (216,127) Net loans 6,550,914 750,359 138,462 7,439,735 Add: Interest receivable 36,350 Less: Unearned fee income (36,496) Total 7,439,589 2024 Total $ $ $ $ Mortgages Gross loans 1,934,732 161,475 140,124 2,236,331 ECL allowance (22,916) (7,664) (75,931) (106,511) Net mortgages 1,911,816 153,811 64,193 2,129,820 Personal loans (including cards) Gross loans 709,425 24,444 22,554 756,423 ECL allowance (12,668) (1,900) (13,613) (28,181) Net personal loans (including cards) 696,757 22,544 8,941 728,242 Stage 1 Stage 2 Stage 3 15. Loans and Advances to Customers Stage 1 Stage 2 Stage 3 47
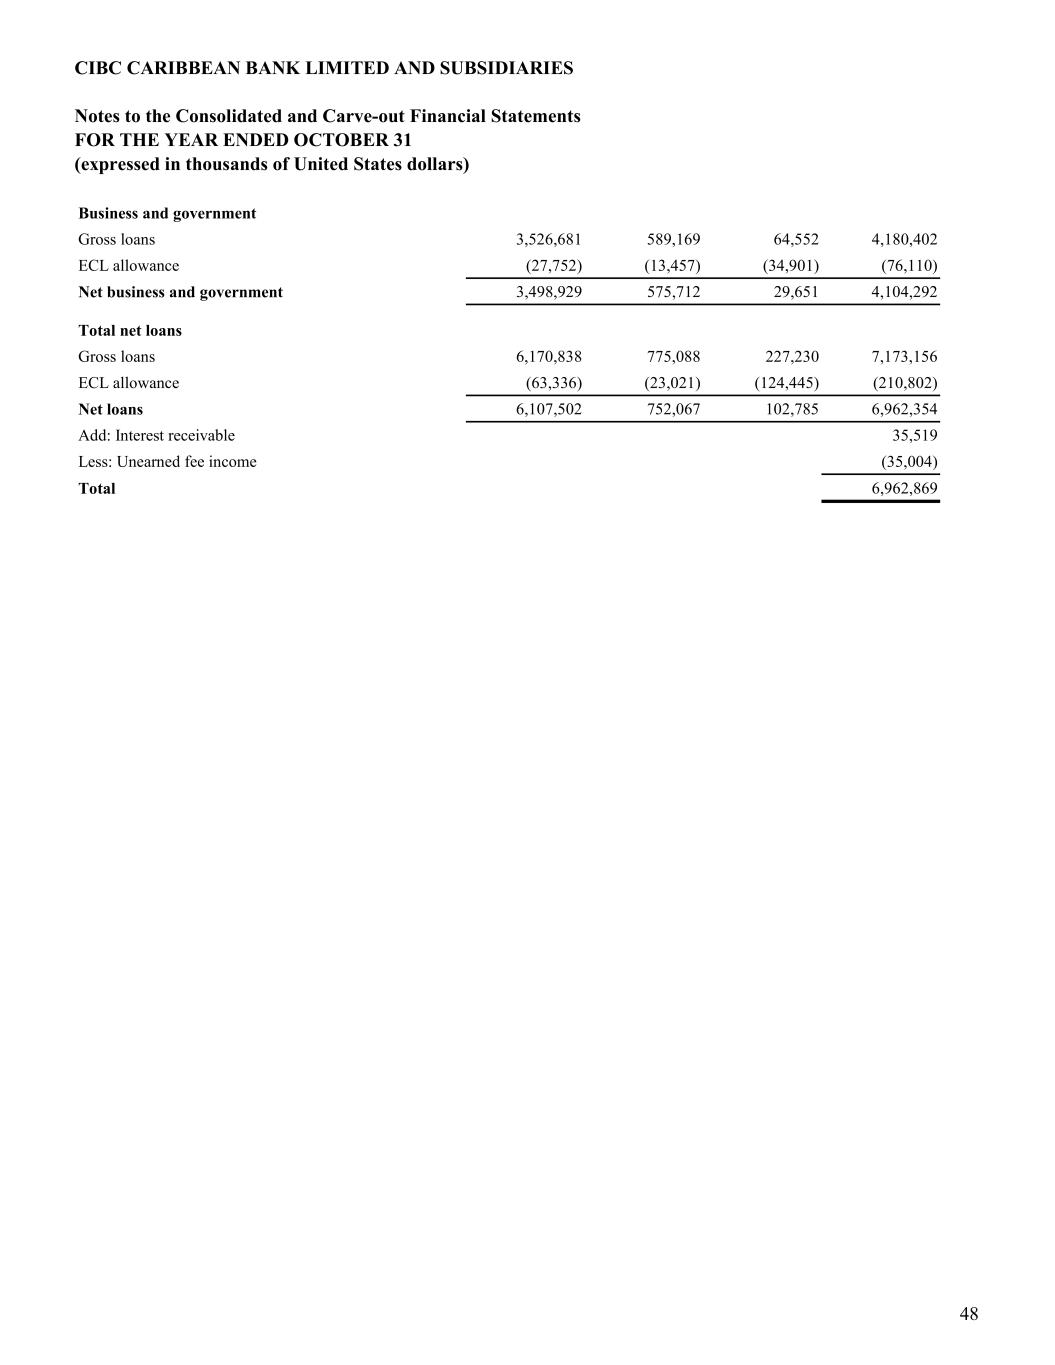
CIBC CARIBBEAN BANK LIMITED AND SUBSIDIARIES Notes to the Consolidated and Carve-out Financial Statements FOR THE YEAR ENDED OCTOBER 31 (expressed in thousands of United States dollars) Business and government Gross loans 3,526,681 589,169 64,552 4,180,402 ECL allowance (27,752) (13,457) (34,901) (76,110) Net business and government 3,498,929 575,712 29,651 4,104,292 Total net loans Gross loans 6,170,838 775,088 227,230 7,173,156 ECL allowance (63,336) (23,021) (124,445) (210,802) Net loans 6,107,502 752,067 102,785 6,962,354 Add: Interest receivable 35,519 Less: Unearned fee income (35,004) Total 6,962,869 48
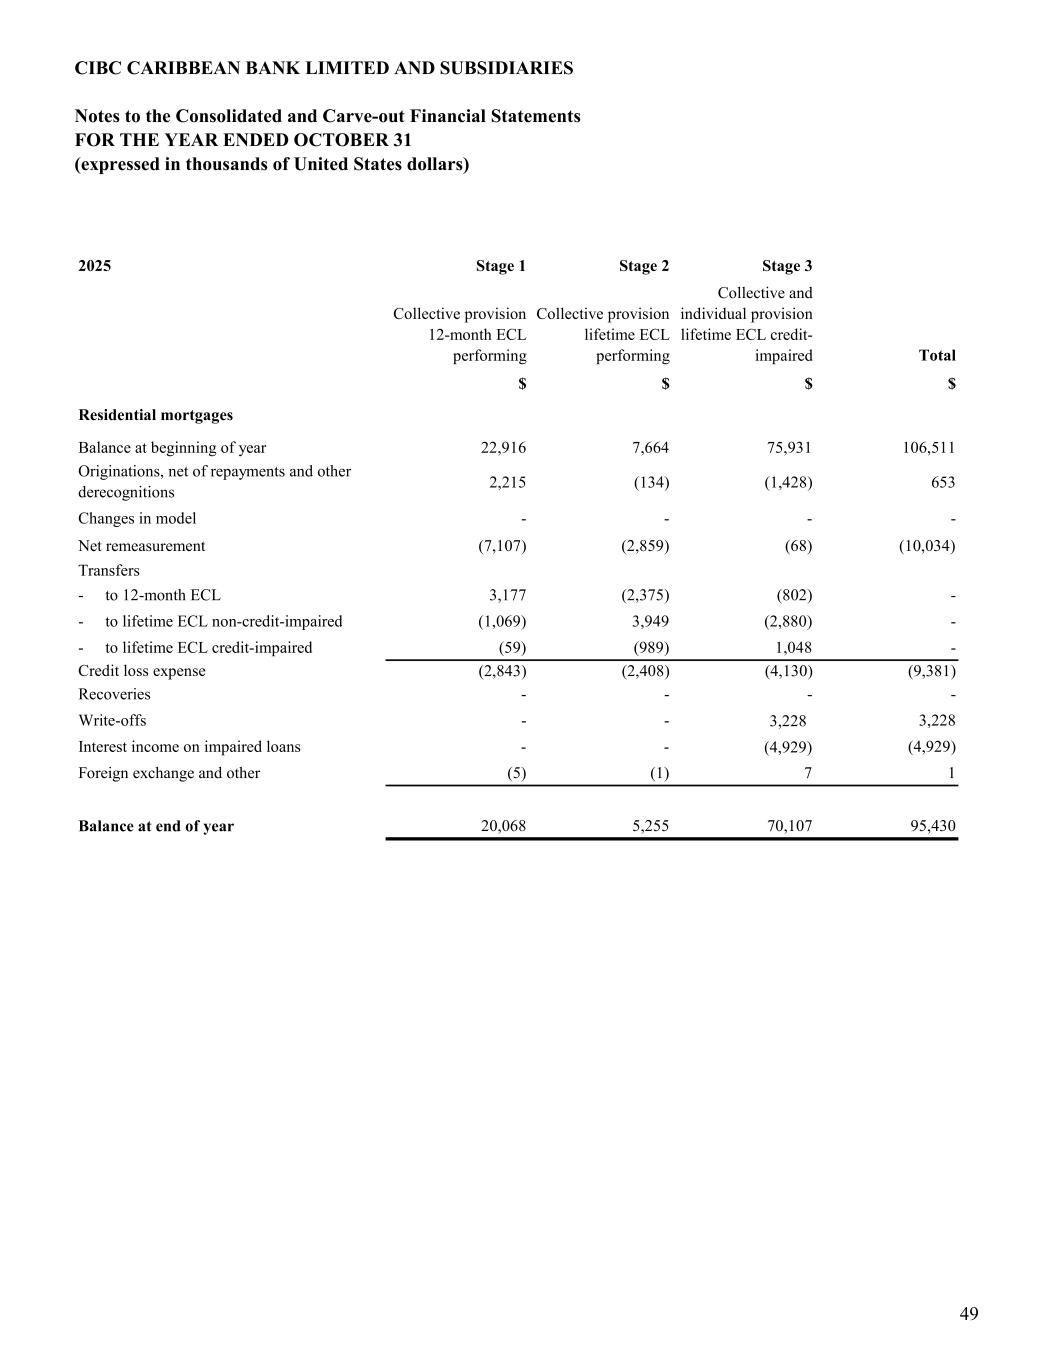
CIBC CARIBBEAN BANK LIMITED AND SUBSIDIARIES Notes to the Consolidated and Carve-out Financial Statements FOR THE YEAR ENDED OCTOBER 31 (expressed in thousands of United States dollars) 2025 Stage 1 Stage 2 Stage 3 Collective provision 12-month ECL performing Collective provision lifetime ECL performing Collective and individual provision lifetime ECL credit- impaired Total $ $ $ $ Balance at beginning of year 22,916 7,664 75,931 106,511 2,215 (134) (1,428) 653 Changes in model - - - - Net remeasurement (7,107) (2,859) (68) (10,034) Transfers - to 12-month ECL 3,177 (2,375) (802) - - to lifetime ECL non-credit-impaired (1,069) 3,949 (2,880) - - to lifetime ECL credit-impaired (59) (989) 1,048 - Credit loss expense (2,843) (2,408) (4,130) (9,381) Recoveries - - - - Write-offs - - 3,228 3,228 Interest income on impaired loans - - (4,929) (4,929) Foreign exchange and other (5) (1) 7 1 Balance at end of year 20,068 5,255 70,107 95,430 Originations, net of repayments and other derecognitions Residential mortgages 49
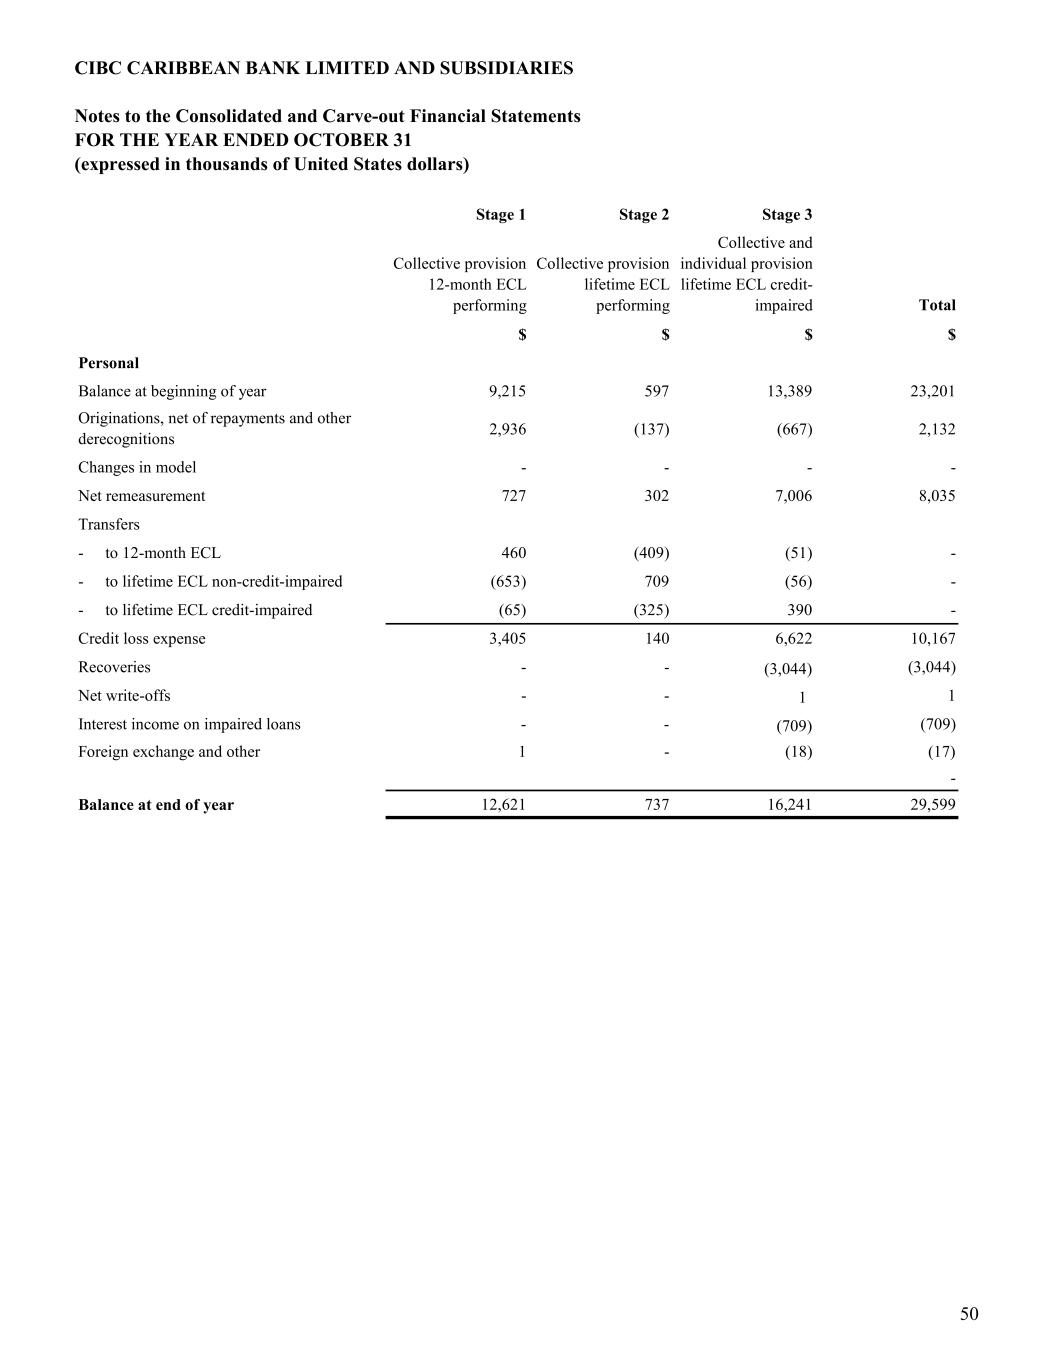
CIBC CARIBBEAN BANK LIMITED AND SUBSIDIARIES Notes to the Consolidated and Carve-out Financial Statements FOR THE YEAR ENDED OCTOBER 31 (expressed in thousands of United States dollars) Stage 1 Stage 2 Stage 3 Collective provision 12-month ECL performing Collective provision lifetime ECL performing Collective and individual provision lifetime ECL credit- impaired Total $ $ $ $ Personal Balance at beginning of year 9,215 597 13,389 23,201 2,936 (137) (667) 2,132 Changes in model - - - - Net remeasurement 727 302 7,006 8,035 Transfers - to 12-month ECL 460 (409) (51) - - to lifetime ECL non-credit-impaired (653) 709 (56) - - to lifetime ECL credit-impaired (65) (325) 390 - Credit loss expense 3,405 140 6,622 10,167 Recoveries - - (3,044) (3,044) Net write-offs - - 1 1 Interest income on impaired loans - - (709) (709) Foreign exchange and other 1 - (18) (17) - Balance at end of year 12,621 737 16,241 29,599 Originations, net of repayments and other derecognitions 50
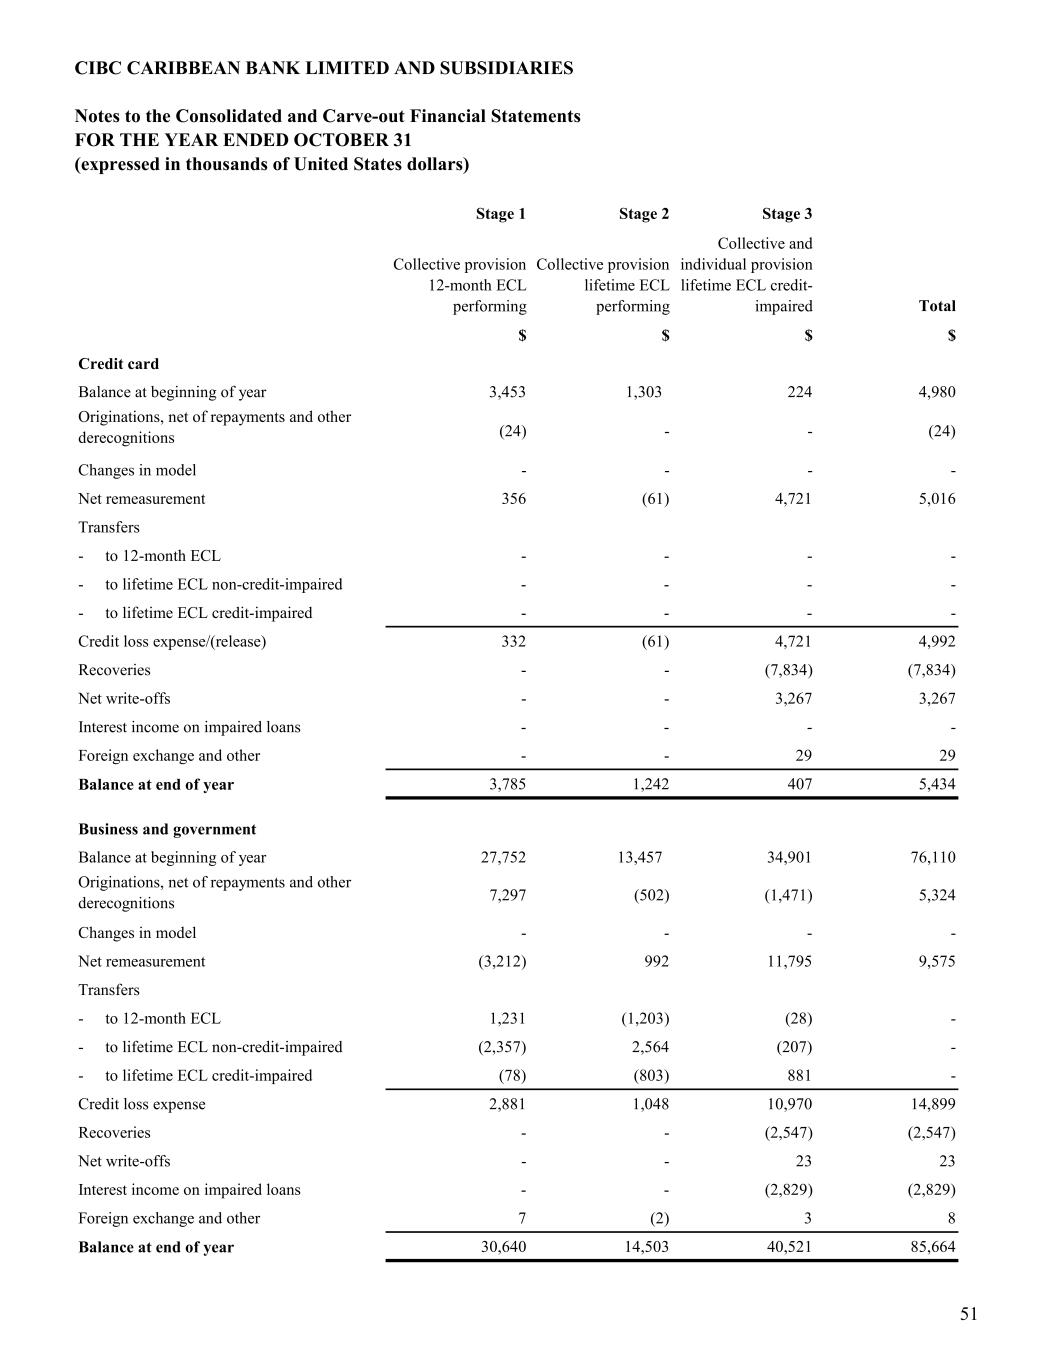
CIBC CARIBBEAN BANK LIMITED AND SUBSIDIARIES Notes to the Consolidated and Carve-out Financial Statements FOR THE YEAR ENDED OCTOBER 31 (expressed in thousands of United States dollars) Stage 1 Stage 2 Stage 3 Collective provision 12-month ECL performing Collective provision lifetime ECL performing Collective and individual provision lifetime ECL credit- impaired Total $ $ $ $ Credit card Balance at beginning of year 3,453 1,303 224 4,980 (24) - - (24) Changes in model - - - - Net remeasurement 356 (61) 4,721 5,016 Transfers - to 12-month ECL - - - - - to lifetime ECL non-credit-impaired - - - - - to lifetime ECL credit-impaired - - - - Credit loss expense/(release) 332 (61) 4,721 4,992 Recoveries - - (7,834) (7,834) Net write-offs - - 3,267 3,267 Interest income on impaired loans - - - - Foreign exchange and other - - 29 29 Balance at end of year 3,785 1,242 407 5,434 Business and government Balance at beginning of year 27,752 13,457 34,901 76,110 7,297 (502) (1,471) 5,324 Changes in model - - - - Net remeasurement (3,212) 992 11,795 9,575 Transfers - to 12-month ECL 1,231 (1,203) (28) - - to lifetime ECL non-credit-impaired (2,357) 2,564 (207) - - to lifetime ECL credit-impaired (78) (803) 881 - Credit loss expense 2,881 1,048 10,970 14,899 Recoveries - - (2,547) (2,547) Net write-offs - - 23 23 Interest income on impaired loans - - (2,829) (2,829) Foreign exchange and other 7 (2) 3 8 Balance at end of year 30,640 14,503 40,521 85,664 Originations, net of repayments and other derecognitions Originations, net of repayments and other derecognitions 51
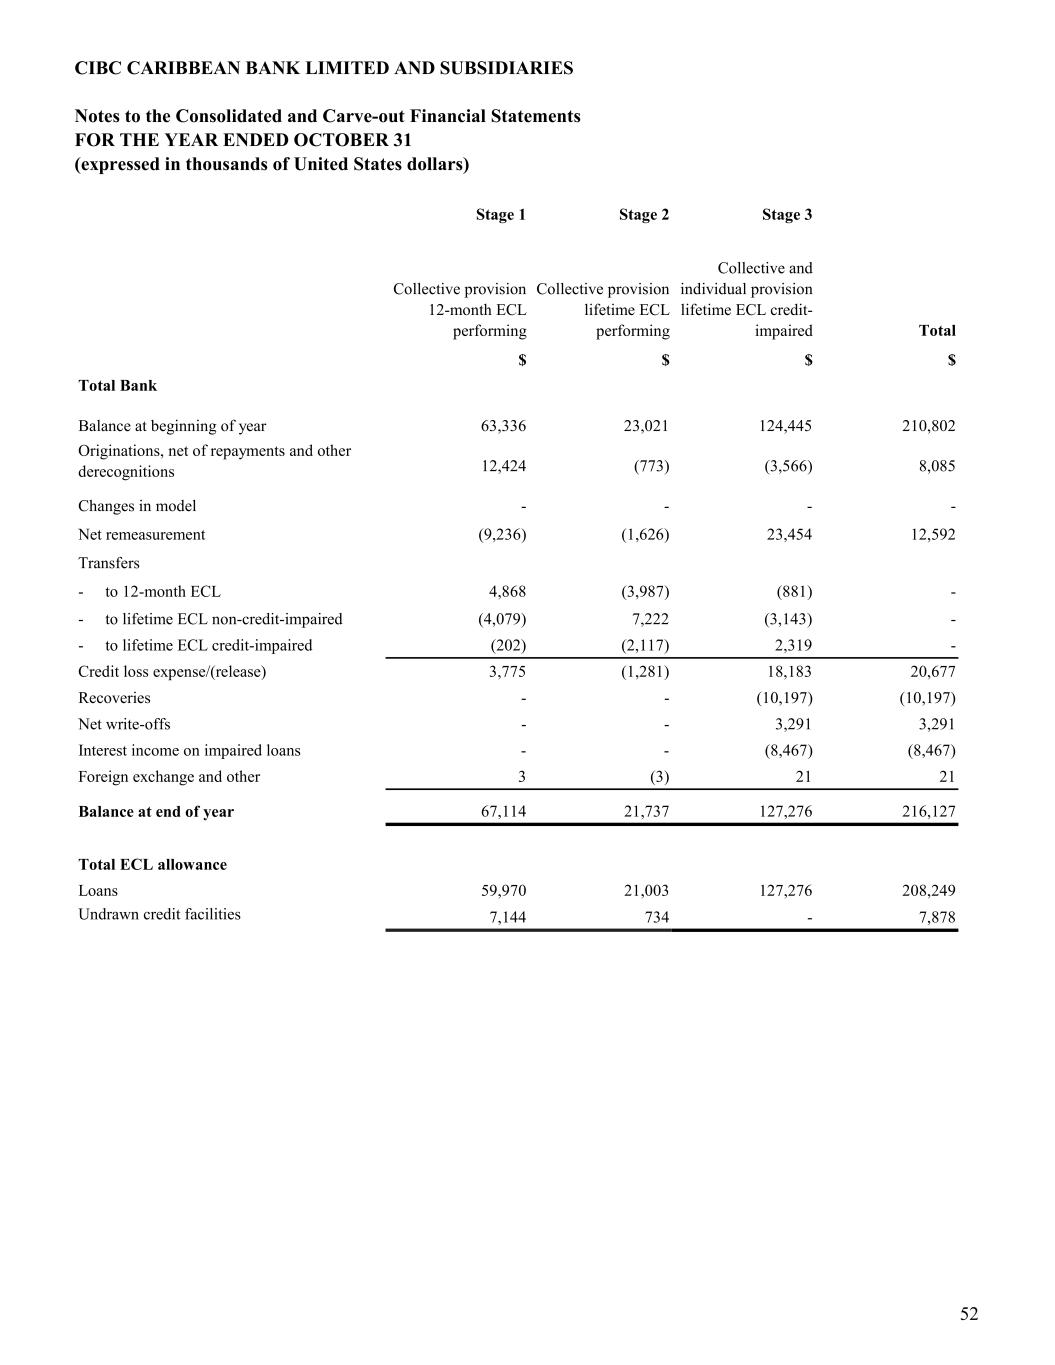
CIBC CARIBBEAN BANK LIMITED AND SUBSIDIARIES Notes to the Consolidated and Carve-out Financial Statements FOR THE YEAR ENDED OCTOBER 31 (expressed in thousands of United States dollars) Stage 1 Stage 2 Stage 3 Collective provision 12-month ECL performing Collective provision lifetime ECL performing Collective and individual provision lifetime ECL credit- impaired Total $ $ $ $ Total Bank Balance at beginning of year 63,336 23,021 124,445 210,802 12,424 (773) (3,566) 8,085 Changes in model - - - - Net remeasurement (9,236) (1,626) 23,454 12,592 Transfers - to 12-month ECL 4,868 (3,987) (881) - - to lifetime ECL non-credit-impaired (4,079) 7,222 (3,143) - - to lifetime ECL credit-impaired (202) (2,117) 2,319 - Credit loss expense/(release) 3,775 (1,281) 18,183 20,677 Recoveries - - (10,197) (10,197) Net write-offs - - 3,291 3,291 Interest income on impaired loans - - (8,467) (8,467) Foreign exchange and other 3 (3) 21 21 Balance at end of year 67,114 21,737 127,276 216,127 Total ECL allowance Loans 59,970 21,003 127,276 208,249 7,144 734 - 7,878 Originations, net of repayments and other derecognitions Undrawn credit facilities 52
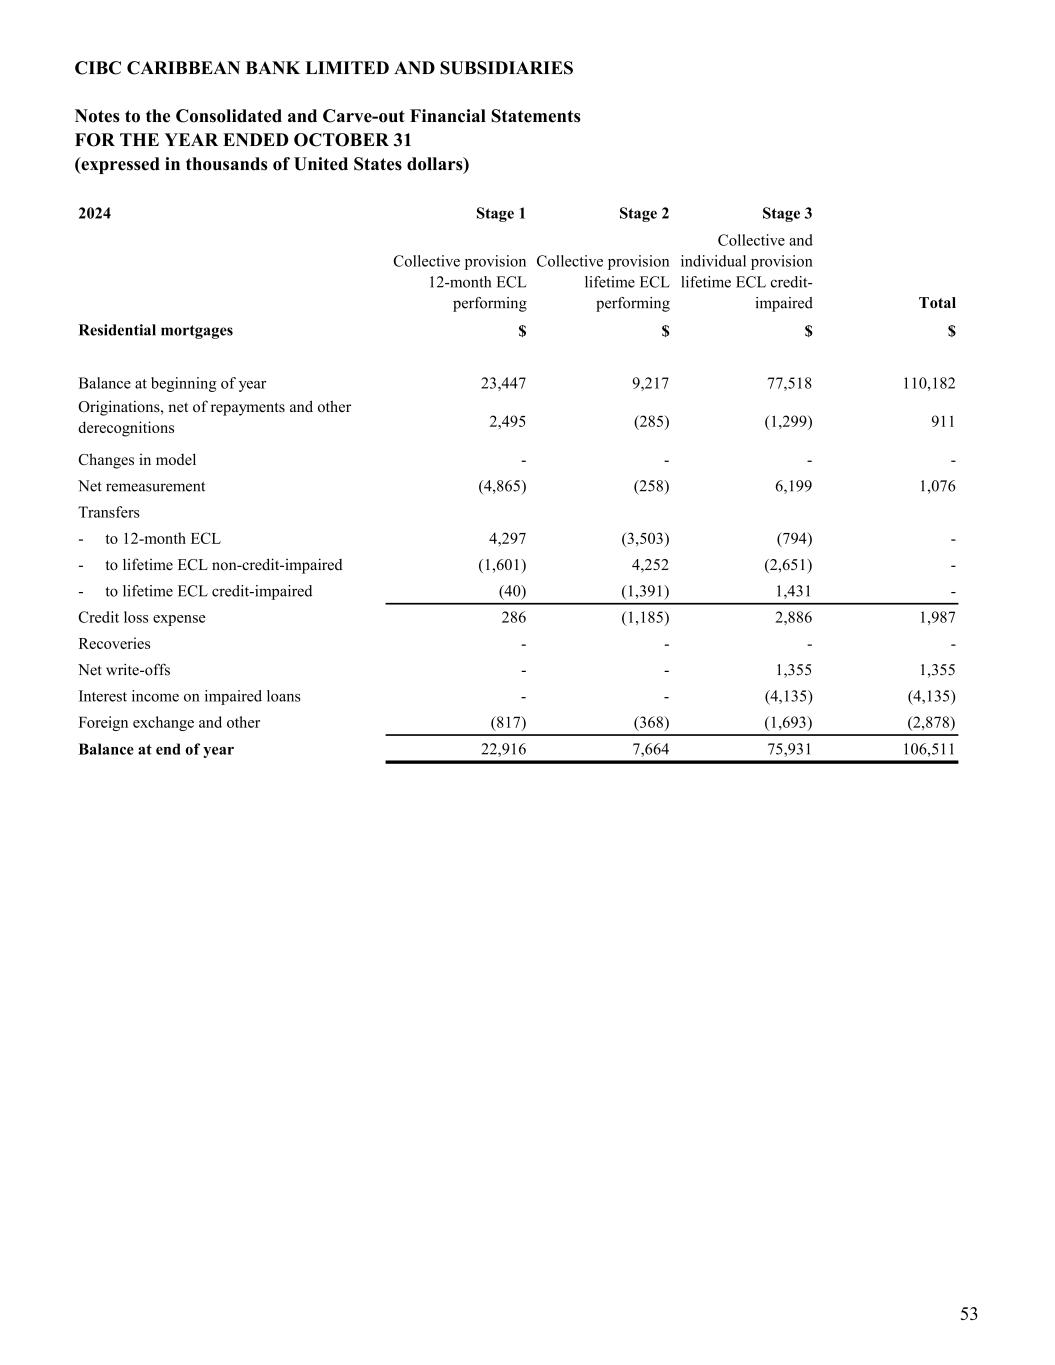
CIBC CARIBBEAN BANK LIMITED AND SUBSIDIARIES Notes to the Consolidated and Carve-out Financial Statements FOR THE YEAR ENDED OCTOBER 31 (expressed in thousands of United States dollars) 2024 Stage 1 Stage 2 Stage 3 Collective provision 12-month ECL performing Collective provision lifetime ECL performing Collective and individual provision lifetime ECL credit- impaired Total $ $ $ $ Balance at beginning of year 23,447 9,217 77,518 110,182 2,495 (285) (1,299) 911 Changes in model - - - - Net remeasurement (4,865) (258) 6,199 1,076 Transfers - to 12-month ECL 4,297 (3,503) (794) - - to lifetime ECL non-credit-impaired (1,601) 4,252 (2,651) - - to lifetime ECL credit-impaired (40) (1,391) 1,431 - Credit loss expense 286 (1,185) 2,886 1,987 Recoveries - - - - Net write-offs - - 1,355 1,355 Interest income on impaired loans - - (4,135) (4,135) Foreign exchange and other (817) (368) (1,693) (2,878) Balance at end of year 22,916 7,664 75,931 106,511 Originations, net of repayments and other derecognitions Residential mortgages 53
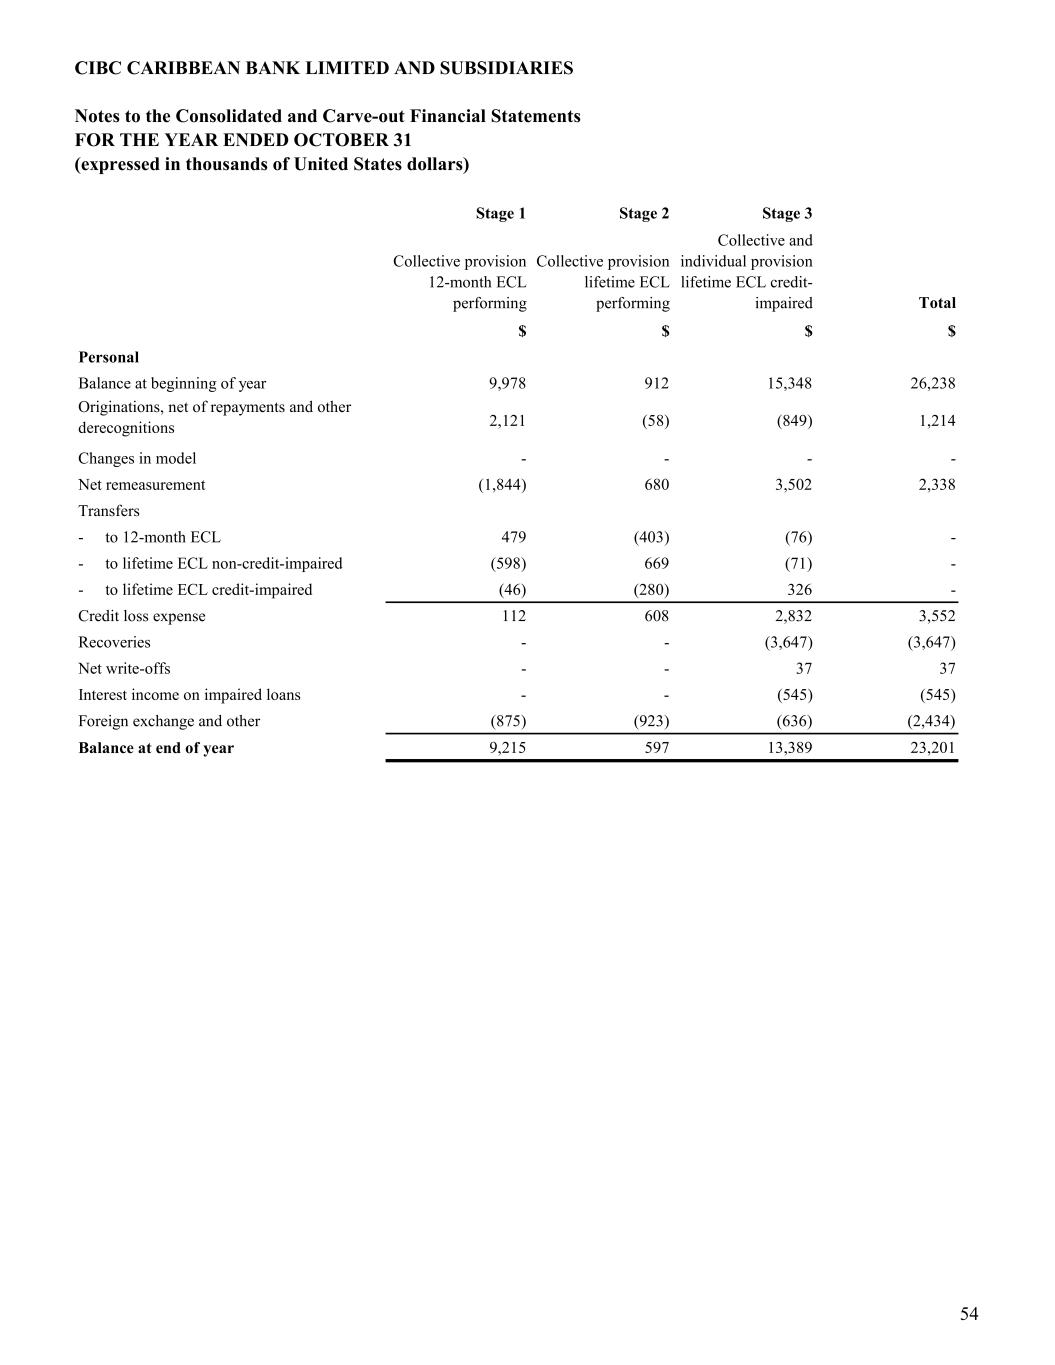
CIBC CARIBBEAN BANK LIMITED AND SUBSIDIARIES Notes to the Consolidated and Carve-out Financial Statements FOR THE YEAR ENDED OCTOBER 31 (expressed in thousands of United States dollars) Stage 1 Stage 2 Stage 3 Collective provision 12-month ECL performing Collective provision lifetime ECL performing Collective and individual provision lifetime ECL credit- impaired Total $ $ $ $ Personal Balance at beginning of year 9,978 912 15,348 26,238 2,121 (58) (849) 1,214 Changes in model - - - - Net remeasurement (1,844) 680 3,502 2,338 Transfers - to 12-month ECL 479 (403) (76) - - to lifetime ECL non-credit-impaired (598) 669 (71) - - to lifetime ECL credit-impaired (46) (280) 326 - Credit loss expense 112 608 2,832 3,552 Recoveries - - (3,647) (3,647) Net write-offs - - 37 37 Interest income on impaired loans - - (545) (545) Foreign exchange and other (875) (923) (636) (2,434) Balance at end of year 9,215 597 13,389 23,201 Originations, net of repayments and other derecognitions 54
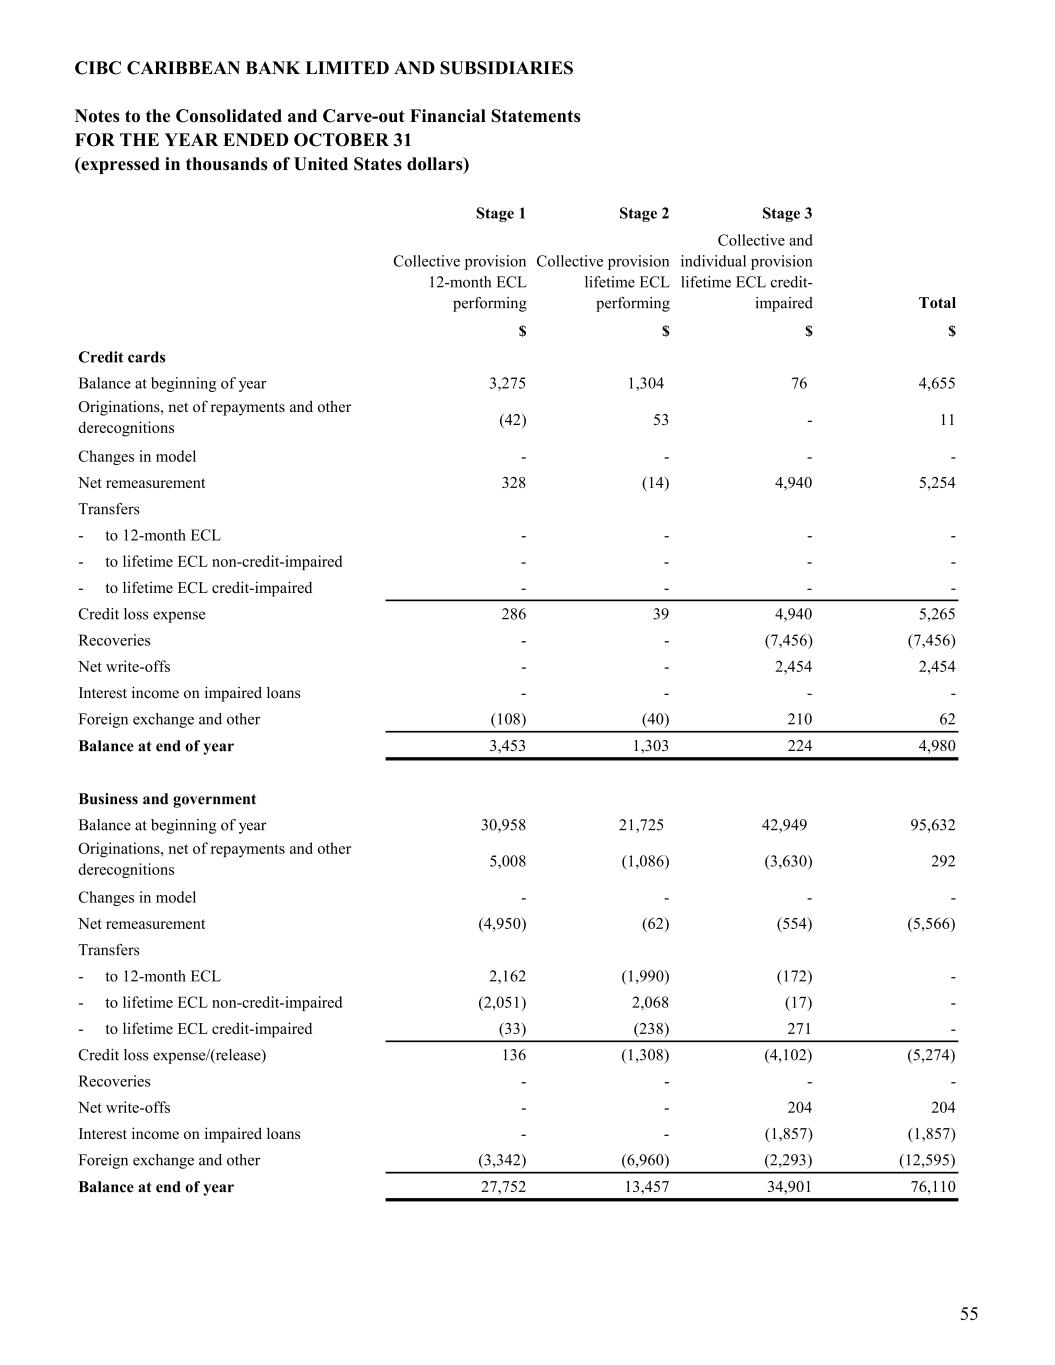
CIBC CARIBBEAN BANK LIMITED AND SUBSIDIARIES Notes to the Consolidated and Carve-out Financial Statements FOR THE YEAR ENDED OCTOBER 31 (expressed in thousands of United States dollars) Stage 1 Stage 2 Stage 3 Collective provision 12-month ECL performing Collective provision lifetime ECL performing Collective and individual provision lifetime ECL credit- impaired Total $ $ $ $ Credit cards Balance at beginning of year 3,275 1,304 76 4,655 (42) 53 - 11 Changes in model - - - - Net remeasurement 328 (14) 4,940 5,254 Transfers - to 12-month ECL - - - - - to lifetime ECL non-credit-impaired - - - - - to lifetime ECL credit-impaired - - - - Credit loss expense 286 39 4,940 5,265 Recoveries - - (7,456) (7,456) Net write-offs - - 2,454 2,454 Interest income on impaired loans - - - - Foreign exchange and other (108) (40) 210 62 Balance at end of year 3,453 1,303 224 4,980 Business and government Balance at beginning of year 30,958 21,725 42,949 95,632 5,008 (1,086) (3,630) 292 Changes in model - - - - Net remeasurement (4,950) (62) (554) (5,566) Transfers - to 12-month ECL 2,162 (1,990) (172) - - to lifetime ECL non-credit-impaired (2,051) 2,068 (17) - - to lifetime ECL credit-impaired (33) (238) 271 - Credit loss expense/(release) 136 (1,308) (4,102) (5,274) Recoveries - - - - Net write-offs - - 204 204 Interest income on impaired loans - - (1,857) (1,857) Foreign exchange and other (3,342) (6,960) (2,293) (12,595) Balance at end of year 27,752 13,457 34,901 76,110 Originations, net of repayments and other derecognitions Originations, net of repayments and other derecognitions 55
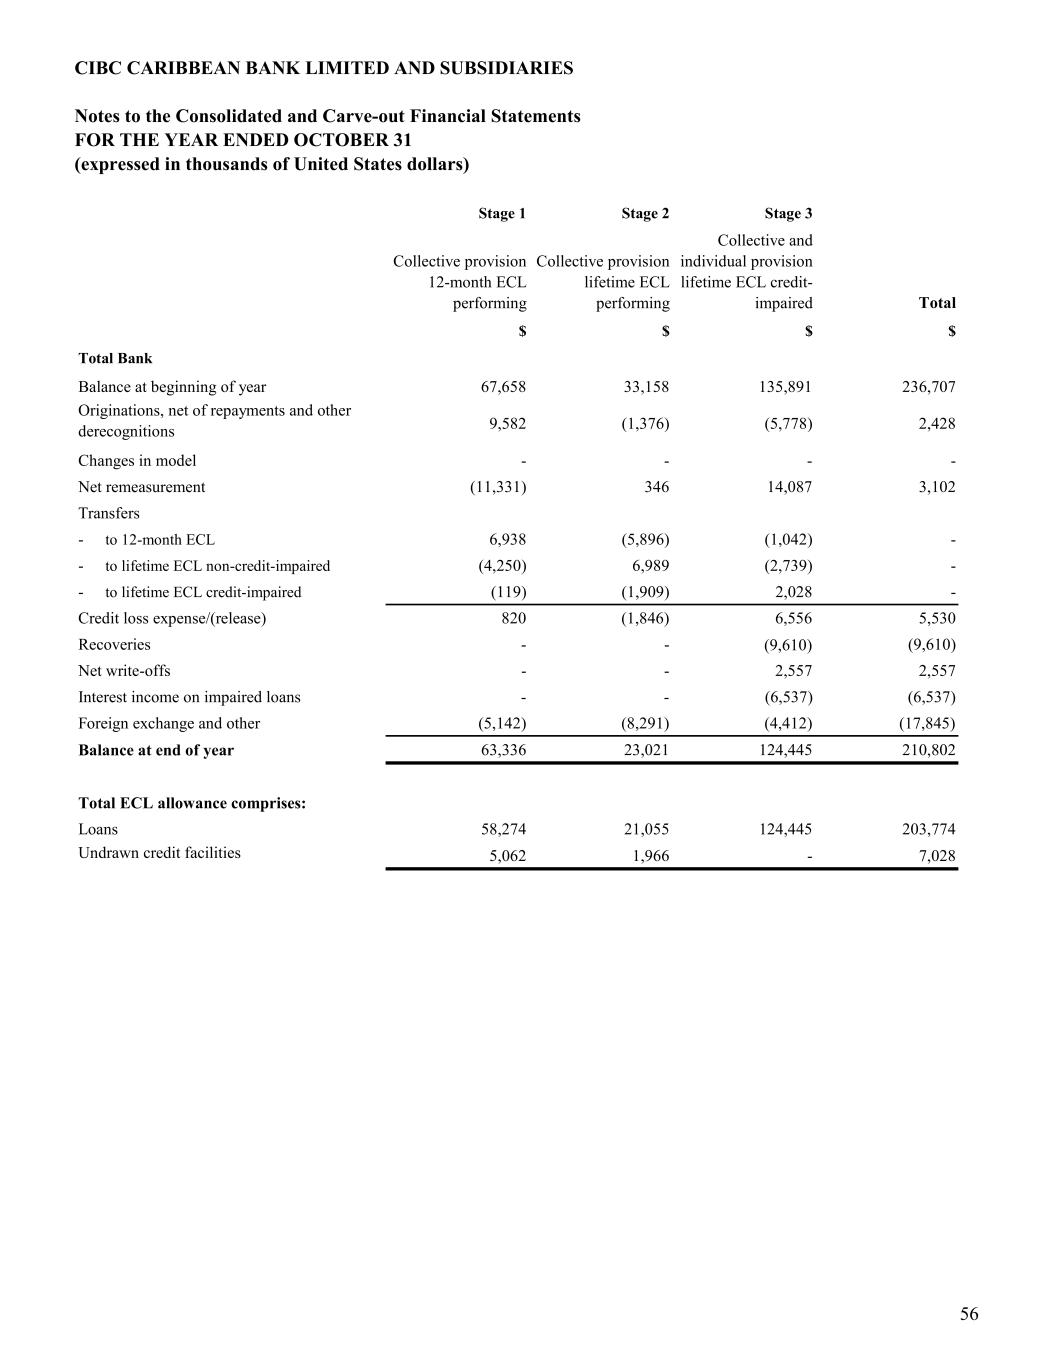
CIBC CARIBBEAN BANK LIMITED AND SUBSIDIARIES Notes to the Consolidated and Carve-out Financial Statements FOR THE YEAR ENDED OCTOBER 31 (expressed in thousands of United States dollars) Stage 1 Stage 2 Stage 3 Collective provision 12-month ECL performing Collective provision lifetime ECL performing Collective and individual provision lifetime ECL credit- impaired Total $ $ $ $ Balance at beginning of year 67,658 33,158 135,891 236,707 9,582 (1,376) (5,778) 2,428 Changes in model - - - - Net remeasurement (11,331) 346 14,087 3,102 Transfers - to 12-month ECL 6,938 (5,896) (1,042) - - to lifetime ECL non-credit-impaired (4,250) 6,989 (2,739) - - to lifetime ECL credit-impaired (119) (1,909) 2,028 - Credit loss expense/(release) 820 (1,846) 6,556 5,530 Recoveries - - (9,610) (9,610) Net write-offs - - 2,557 2,557 Interest income on impaired loans - - (6,537) (6,537) Foreign exchange and other (5,142) (8,291) (4,412) (17,845) Balance at end of year 63,336 23,021 124,445 210,802 Total ECL allowance comprises: Loans 58,274 21,055 124,445 203,774 5,062 1,966 - 7,028 Undrawn credit facilities Originations, net of repayments and other derecognitions Total Bank 56
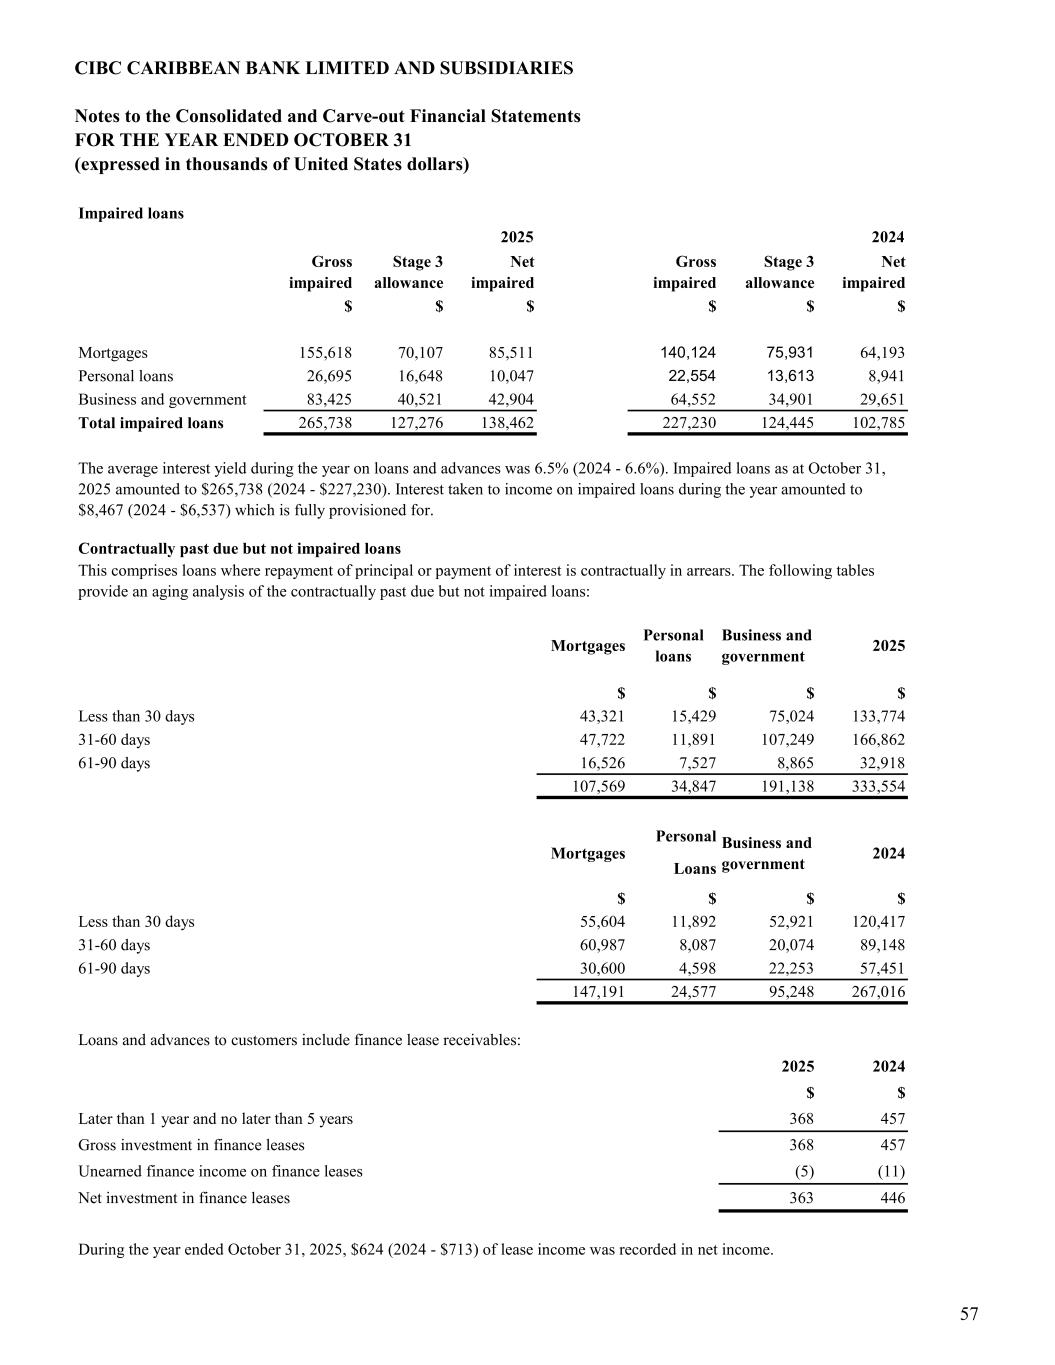
CIBC CARIBBEAN BANK LIMITED AND SUBSIDIARIES Notes to the Consolidated and Carve-out Financial Statements FOR THE YEAR ENDED OCTOBER 31 (expressed in thousands of United States dollars) Impaired loans 2025 2024 Gross impaired Stage 3 allowance Net impaired Gross impaired Stage 3 allowance Net impaired $ $ $ $ $ $ Mortgages 155,618 70,107 85,511 140,124 75,931 64,193 Personal loans 26,695 16,648 10,047 22,554 13,613 8,941 Business and government 83,425 40,521 42,904 64,552 34,901 29,651 Total impaired loans 265,738 127,276 138,462 227,230 124,445 102,785 Contractually past due but not impaired loans $ $ $ $ Less than 30 days 43,321 15,429 75,024 133,774 31-60 days 47,722 11,891 107,249 166,862 61-90 days 16,526 7,527 8,865 32,918 107,569 34,847 191,138 333,554 Personal Loans $ $ $ $ Less than 30 days 55,604 11,892 52,921 120,417 31-60 days 60,987 8,087 20,074 89,148 61-90 days 30,600 4,598 22,253 57,451 147,191 24,577 95,248 267,016 Loans and advances to customers include finance lease receivables: 2025 2024 $ $ Later than 1 year and no later than 5 years 368 457 Gross investment in finance leases 368 457 Unearned finance income on finance leases (5) (11) Net investment in finance leases 363 446 During the year ended October 31, 2025, $624 (2024 - $713) of lease income was recorded in net income. Mortgages 2024 The average interest yield during the year on loans and advances was 6.5% (2024 - 6.6%). Impaired loans as at October 31, 2025 amounted to $265,738 (2024 - $227,230). Interest taken to income on impaired loans during the year amounted to $8,467 (2024 - $6,537) which is fully provisioned for. This comprises loans where repayment of principal or payment of interest is contractually in arrears. The following tables provide an aging analysis of the contractually past due but not impaired loans: Mortgages 2025 Personal loans Business and government Business and government 57
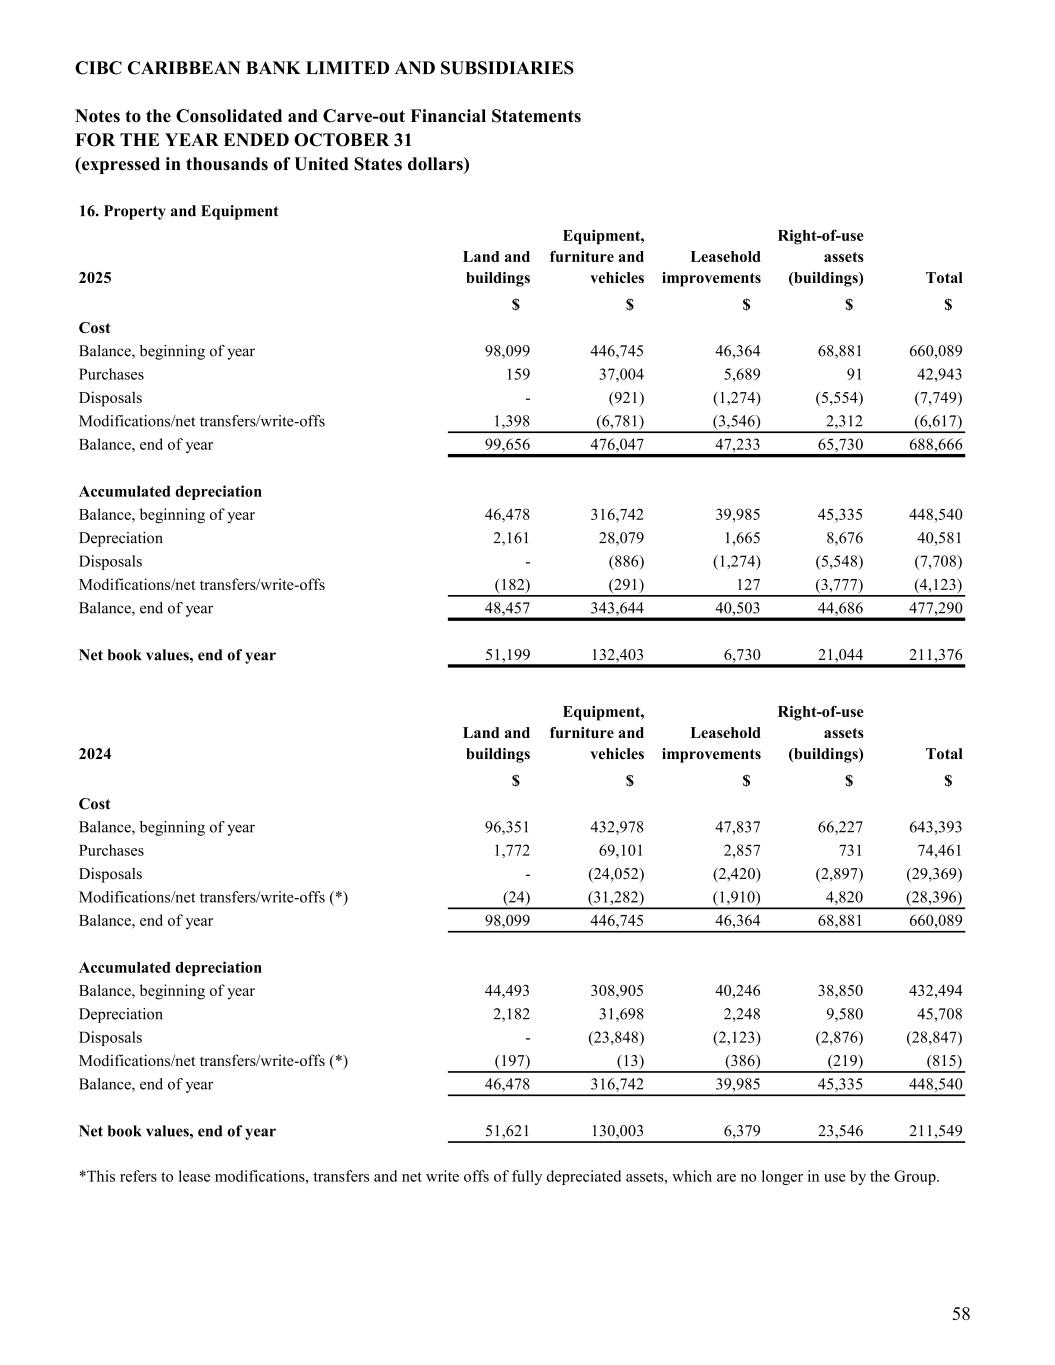
CIBC CARIBBEAN BANK LIMITED AND SUBSIDIARIES Notes to the Consolidated and Carve-out Financial Statements FOR THE YEAR ENDED OCTOBER 31 (expressed in thousands of United States dollars) 2025 Land and buildings Equipment, furniture and vehicles Leasehold improvements Right-of-use assets (buildings) Total $ $ $ $ $ Cost Balance, beginning of year 98,099 446,745 46,364 68,881 660,089 Purchases 159 37,004 5,689 91 42,943 Disposals - (921) (1,274) (5,554) (7,749) Modifications/net transfers/write-offs 1,398 (6,781) (3,546) 2,312 (6,617) Balance, end of year 99,656 476,047 47,233 65,730 688,666 Accumulated depreciation Balance, beginning of year 46,478 316,742 39,985 45,335 448,540 Depreciation 2,161 28,079 1,665 8,676 40,581 Disposals - (886) (1,274) (5,548) (7,708) Modifications/net transfers/write-offs (182) (291) 127 (3,777) (4,123) Balance, end of year 48,457 343,644 40,503 44,686 477,290 Net book values, end of year 51,199 132,403 6,730 21,044 211,376 2024 Land and buildings Equipment, furniture and vehicles Leasehold improvements Right-of-use assets (buildings) Total $ $ $ $ $ Cost Balance, beginning of year 96,351 432,978 47,837 66,227 643,393 Purchases 1,772 69,101 2,857 731 74,461 Disposals - (24,052) (2,420) (2,897) (29,369) Modifications/net transfers/write-offs (*) (24) (31,282) (1,910) 4,820 (28,396) Balance, end of year 98,099 446,745 46,364 68,881 660,089 Accumulated depreciation Balance, beginning of year 44,493 308,905 40,246 38,850 432,494 Depreciation 2,182 31,698 2,248 9,580 45,708 Disposals - (23,848) (2,123) (2,876) (28,847) Modifications/net transfers/write-offs (*) (197) (13) (386) (219) (815) Balance, end of year 46,478 316,742 39,985 45,335 448,540 Net book values, end of year 51,621 130,003 6,379 23,546 211,549 16. Property and Equipment *This refers to lease modifications, transfers and net write offs of fully depreciated assets, which are no longer in use by the Group. 58
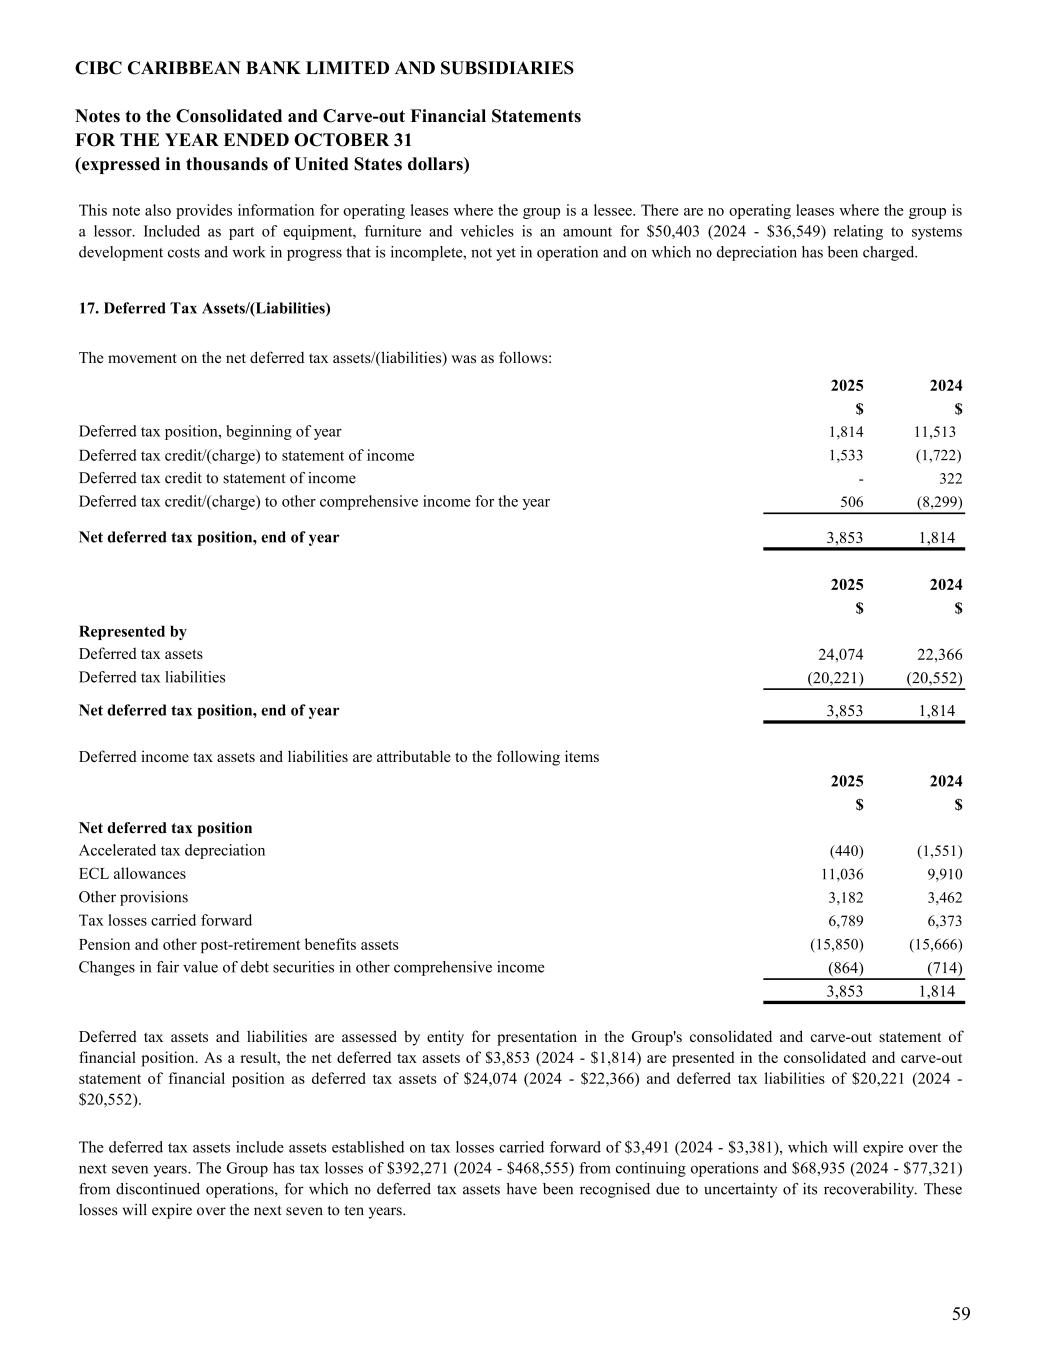
CIBC CARIBBEAN BANK LIMITED AND SUBSIDIARIES Notes to the Consolidated and Carve-out Financial Statements FOR THE YEAR ENDED OCTOBER 31 (expressed in thousands of United States dollars) 17. Deferred Tax Assets/(Liabilities) 2025 2024 $ $ 1,814 11,513 Deferred tax credit/(charge) to statement of income 1,533 (1,722) - 322 506 (8,299) 3,853 1,814 2025 2024 $ $ Represented by 24,074 22,366 (20,221) (20,552) 3,853 1,814 Deferred income tax assets and liabilities are attributable to the following items 2025 2024 $ $ Net deferred tax position (440) (1,551) 11,036 9,910 3,182 3,462 6,789 6,373 Pension and other post-retirement benefits assets (15,850) (15,666) (864) (714) 3,853 1,814 Tax losses carried forward Changes in fair value of debt securities in other comprehensive income The deferred tax assets include assets established on tax losses carried forward of $3,491 (2024 - $3,381), which will expire over the next seven years. The Group has tax losses of $392,271 (2024 - $468,555) from continuing operations and $68,935 (2024 - $77,321) from discontinued operations, for which no deferred tax assets have been recognised due to uncertainty of its recoverability. These losses will expire over the next seven to ten years. The movement on the net deferred tax assets/(liabilities) was as follows: Deferred tax assets Deferred tax liabilities Net deferred tax position, end of year Accelerated tax depreciation ECL allowances Other provisions Deferred tax assets and liabilities are assessed by entity for presentation in the Group's consolidated and carve-out statement of financial position. As a result, the net deferred tax assets of $3,853 (2024 - $1,814) are presented in the consolidated and carve-out statement of financial position as deferred tax assets of $24,074 (2024 - $22,366) and deferred tax liabilities of $20,221 (2024 - $20,552). This note also provides information for operating leases where the group is a lessee. There are no operating leases where the group is a lessor. Included as part of equipment, furniture and vehicles is an amount for $50,403 (2024 - $36,549) relating to systems development costs and work in progress that is incomplete, not yet in operation and on which no depreciation has been charged. Deferred tax position, beginning of year Deferred tax credit/(charge) to other comprehensive income for the year Net deferred tax position, end of year Deferred tax credit to statement of income 59
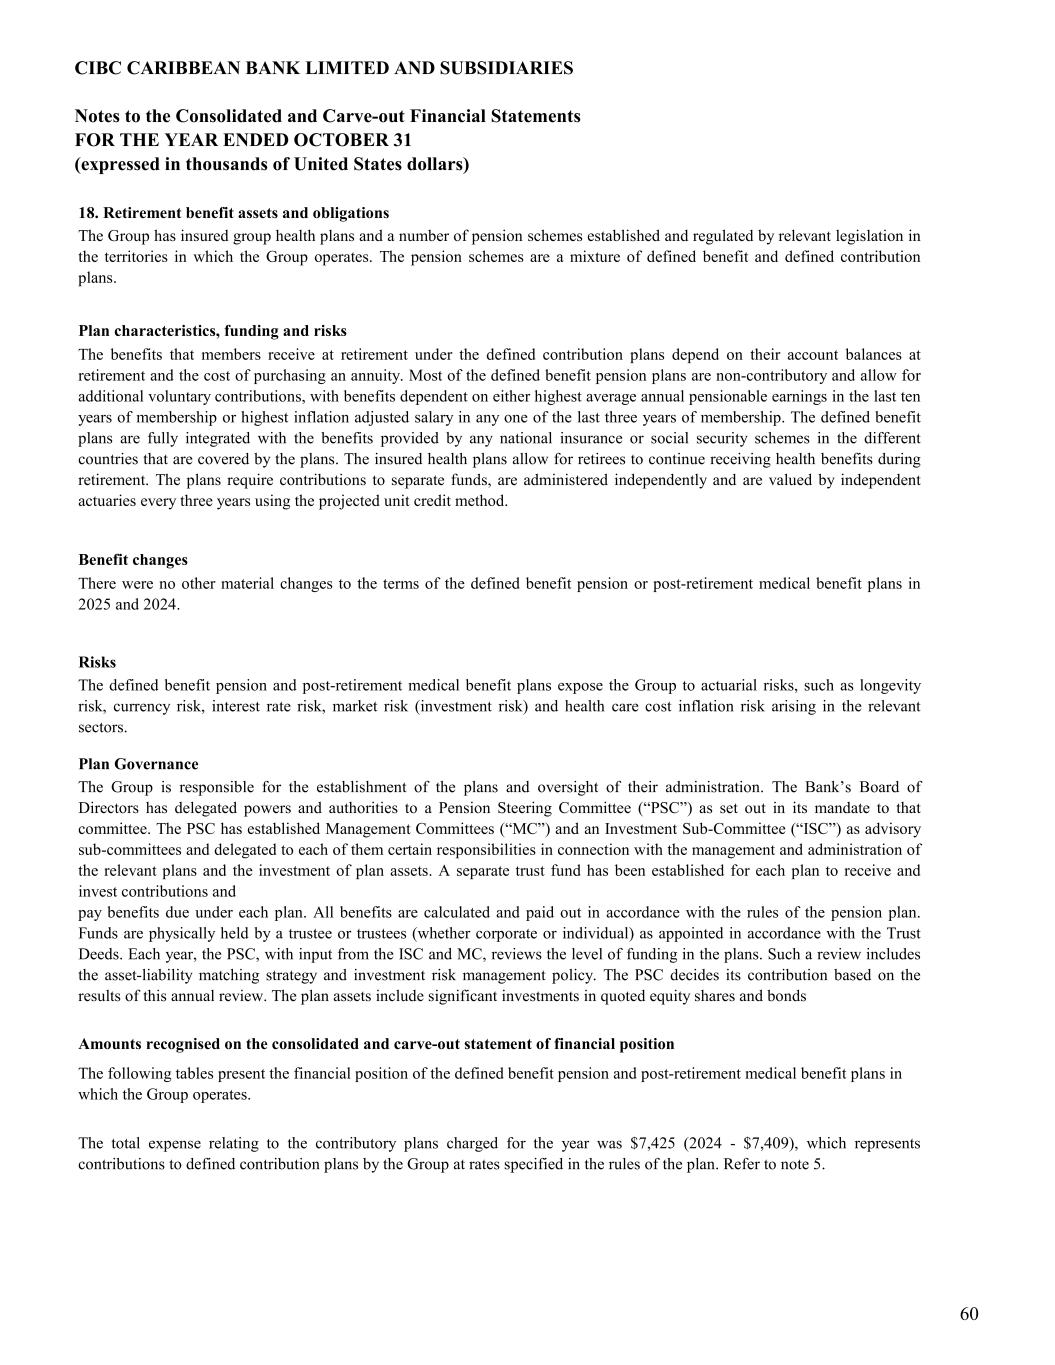
CIBC CARIBBEAN BANK LIMITED AND SUBSIDIARIES Notes to the Consolidated and Carve-out Financial Statements FOR THE YEAR ENDED OCTOBER 31 (expressed in thousands of United States dollars) 18. Retirement benefit assets and obligations Risks Plan Governance The total expense relating to the contributory plans charged for the year was $7,425 (2024 - $7,409), which represents contributions to defined contribution plans by the Group at rates specified in the rules of the plan. Refer to note 5. The defined benefit pension and post-retirement medical benefit plans expose the Group to actuarial risks, such as longevity risk, currency risk, interest rate risk, market risk (investment risk) and health care cost inflation risk arising in the relevant sectors. Amounts recognised on the consolidated and carve-out statement of financial position The Group is responsible for the establishment of the plans and oversight of their administration. The Bank’s Board of Directors has delegated powers and authorities to a Pension Steering Committee (“PSC”) as set out in its mandate to that committee. The PSC has established Management Committees (“MC”) and an Investment Sub-Committee (“ISC”) as advisory sub-committees and delegated to each of them certain responsibilities in connection with the management and administration of the relevant plans and the investment of plan assets. A separate trust fund has been established for each plan to receive and invest contributions and pay benefits due under each plan. All benefits are calculated and paid out in accordance with the rules of the pension plan. Funds are physically held by a trustee or trustees (whether corporate or individual) as appointed in accordance with the Trust Deeds. Each year, the PSC, with input from the ISC and MC, reviews the level of funding in the plans. Such a review includes the asset-liability matching strategy and investment risk management policy. The PSC decides its contribution based on the results of this annual review. The plan assets include significant investments in quoted equity shares and bonds The following tables present the financial position of the defined benefit pension and post-retirement medical benefit plans in which the Group operates. The Group has insured group health plans and a number of pension schemes established and regulated by relevant legislation in the territories in which the Group operates. The pension schemes are a mixture of defined benefit and defined contribution plans. Plan characteristics, funding and risks Benefit changes There were no other material changes to the terms of the defined benefit pension or post-retirement medical benefit plans in 2025 and 2024. The benefits that members receive at retirement under the defined contribution plans depend on their account balances at retirement and the cost of purchasing an annuity. Most of the defined benefit pension plans are non-contributory and allow for additional voluntary contributions, with benefits dependent on either highest average annual pensionable earnings in the last ten years of membership or highest inflation adjusted salary in any one of the last three years of membership. The defined benefit plans are fully integrated with the benefits provided by any national insurance or social security schemes in the different countries that are covered by the plans. The insured health plans allow for retirees to continue receiving health benefits during retirement. The plans require contributions to separate funds, are administered independently and are valued by independent actuaries every three years using the projected unit credit method. 60
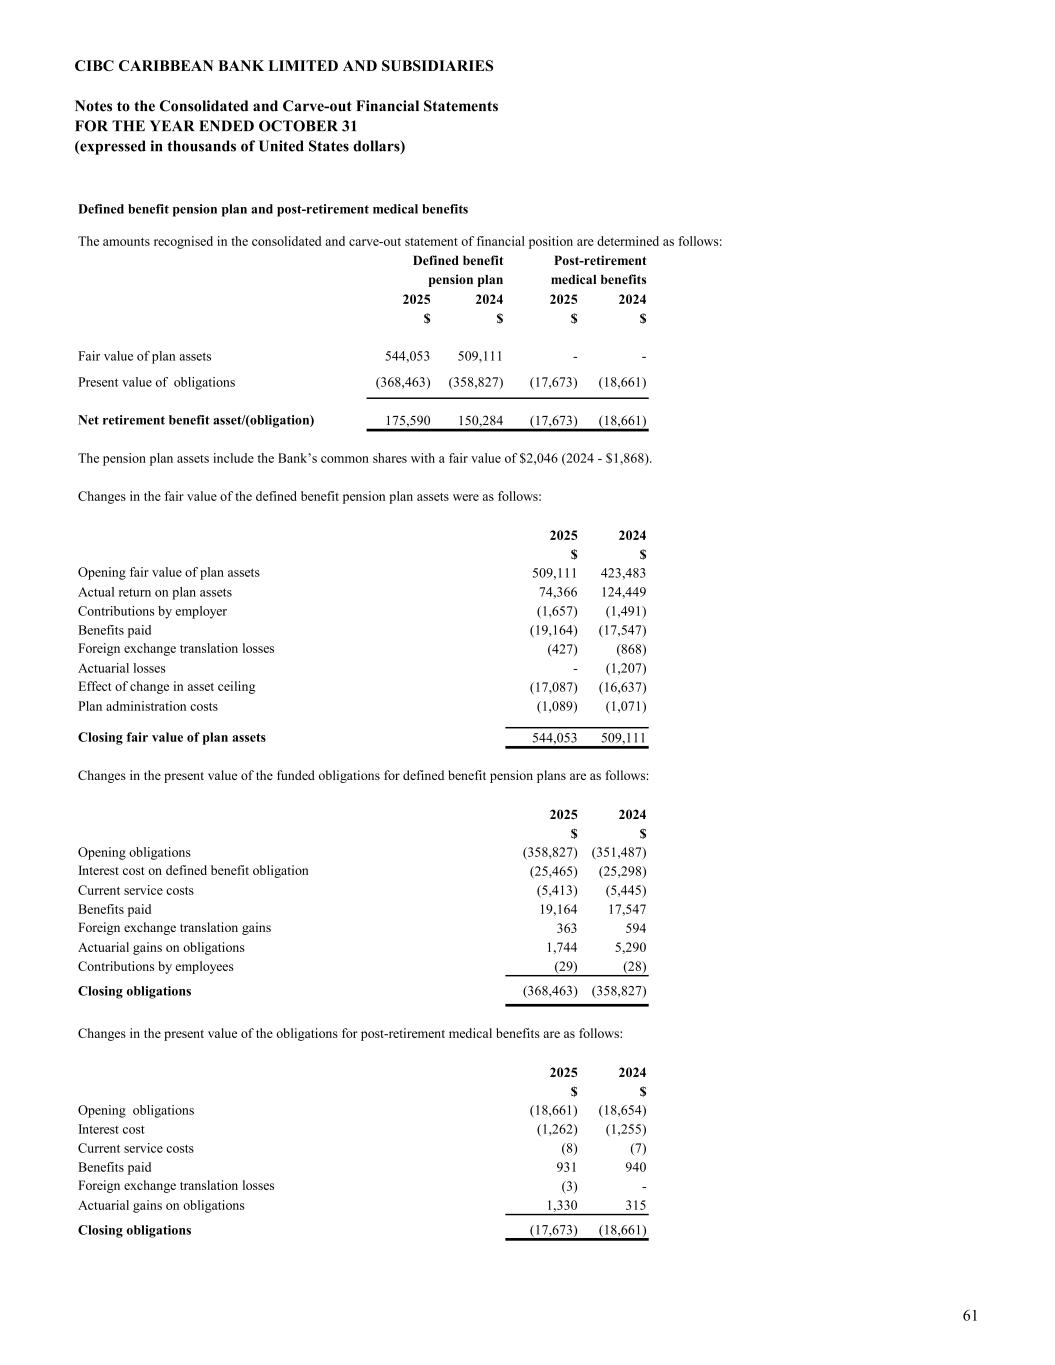
CIBC CARIBBEAN BANK LIMITED AND SUBSIDIARIES Notes to the Consolidated and Carve-out Financial Statements FOR THE YEAR ENDED OCTOBER 31 (expressed in thousands of United States dollars) 2025 2024 2025 2024 $ $ $ $ Fair value of plan assets 544,053 509,111 - - Present value of obligations (368,463) (358,827) (17,673) (18,661) 175,590 150,284 (17,673) (18,661) 2025 2024 $ $ 509,111 423,483 Actual return on plan assets 74,366 124,449 Contributions by employer (1,657) (1,491) Benefits paid (19,164) (17,547) (427) (868) Actuarial losses - (1,207) (17,087) (16,637) Plan administration costs (1,089) (1,071) 544,053 509,111 2025 2024 $ $ Opening obligations (358,827) (351,487) (25,465) (25,298) Current service costs (5,413) (5,445) Benefits paid 19,164 17,547 363 594 Actuarial gains on obligations 1,744 5,290 Contributions by employees (29) (28) Closing obligations (368,463) (358,827) 2025 2024 $ $ Opening obligations (18,661) (18,654) Interest cost (1,262) (1,255) Current service costs (8) (7) Benefits paid 931 940 (3) - Actuarial gains on obligations 1,330 315 - Closing obligations (17,673) (18,661) medical benefits Defined benefit pension plan and post-retirement medical benefits Changes in the fair value of the defined benefit pension plan assets were as follows: Changes in the present value of the obligations for post-retirement medical benefits are as follows: Changes in the present value of the funded obligations for defined benefit pension plans are as follows: Defined benefit Net retirement benefit asset/(obligation) Post-retirement pension plan The amounts recognised in the consolidated and carve-out statement of financial position are determined as follows: Opening fair value of plan assets Foreign exchange translation losses Effect of change in asset ceiling Closing fair value of plan assets The pension plan assets include the Bank’s common shares with a fair value of $2,046 (2024 - $1,868). Foreign exchange translation gains Foreign exchange translation losses Interest cost on defined benefit obligation 61
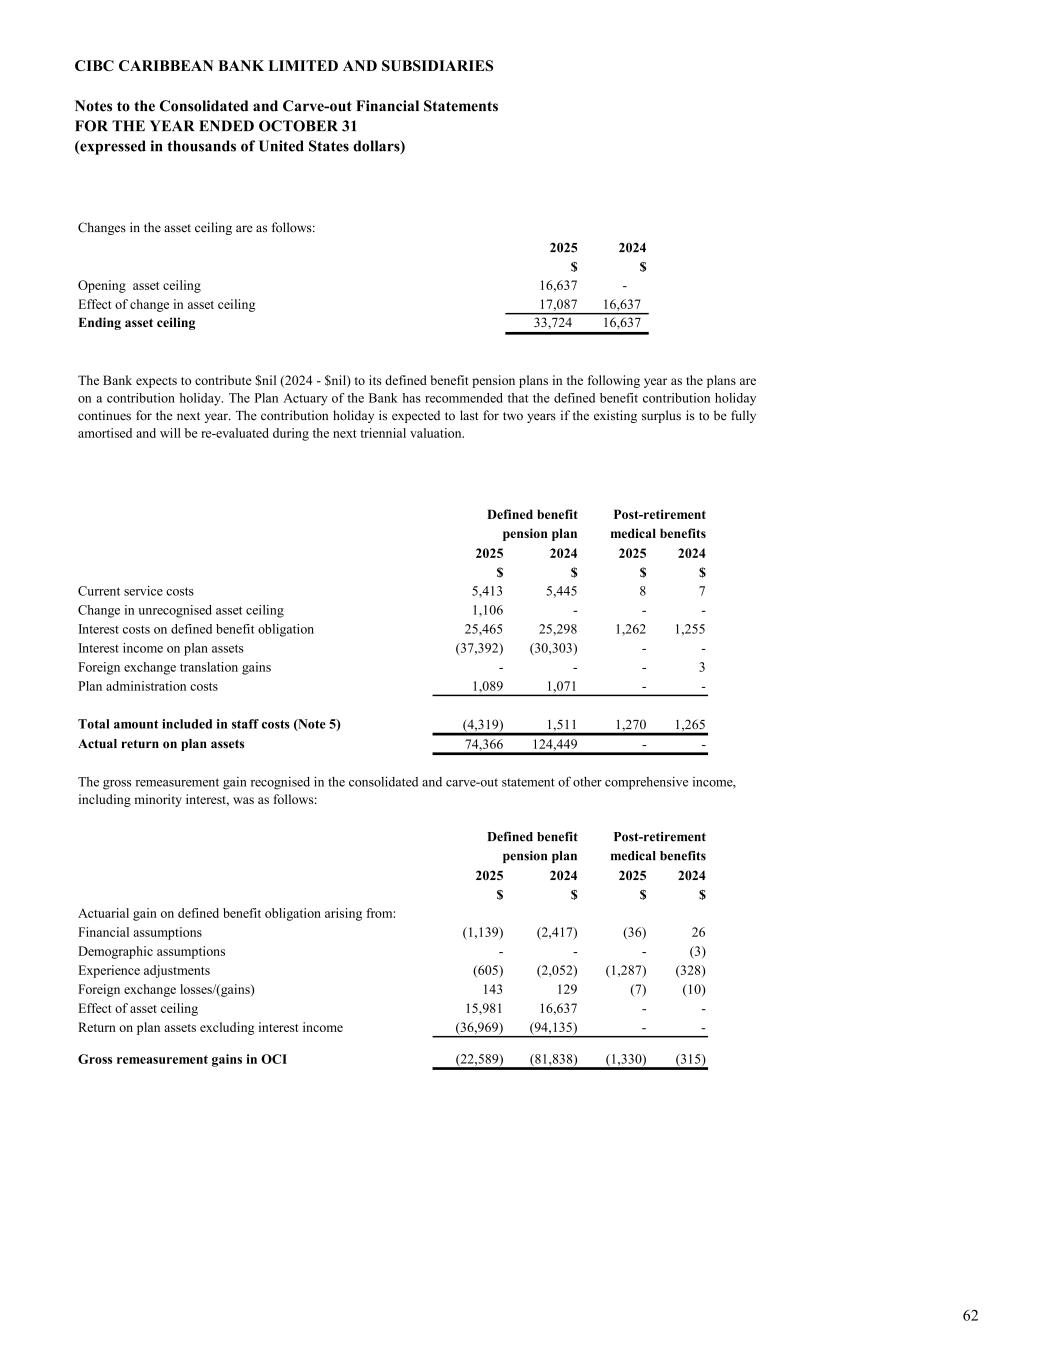
CIBC CARIBBEAN BANK LIMITED AND SUBSIDIARIES Notes to the Consolidated and Carve-out Financial Statements FOR THE YEAR ENDED OCTOBER 31 (expressed in thousands of United States dollars) 2025 2024 $ $ Opening asset ceiling 16,637 - Effect of change in asset ceiling 17,087 16,637 Ending asset ceiling 33,724 16,637 2025 2024 2025 2024 $ $ $ $ Current service costs 5,413 5,445 8 7 Change in unrecognised asset ceiling 1,106 - - - Interest costs on defined benefit obligation 25,465 25,298 1,262 1,255 Interest income on plan assets (37,392) (30,303) - - Foreign exchange translation gains - - - 3 Plan administration costs 1,089 1,071 - - (4,319) 1,511 1,270 1,265 74,366 124,449 - - 2025 2024 2025 2024 $ $ $ $ Actuarial gain on defined benefit obligation arising from: Financial assumptions (1,139) (2,417) (36) 26 Demographic assumptions - - - (3) Experience adjustments (605) (2,052) (1,287) (328) Foreign exchange losses/(gains) 143 129 (7) (10) Effect of asset ceiling 15,981 16,637 - - Return on plan assets excluding interest income (36,969) (94,135) - - Gross remeasurement gains in OCI (22,589) (81,838) (1,330) (315) Changes in the asset ceiling are as follows: medical benefits The gross remeasurement gain recognised in the consolidated and carve-out statement of other comprehensive income, including minority interest, was as follows: Defined benefit pension plan Post-retirement Total amount included in staff costs (Note 5) The Bank expects to contribute $nil (2024 - $nil) to its defined benefit pension plans in the following year as the plans are on a contribution holiday. The Plan Actuary of the Bank has recommended that the defined benefit contribution holiday continues for the next year. The contribution holiday is expected to last for two years if the existing surplus is to be fully amortised and will be re-evaluated during the next triennial valuation. Defined benefit Actual return on plan assets pension plan Post-retirement medical benefits 62
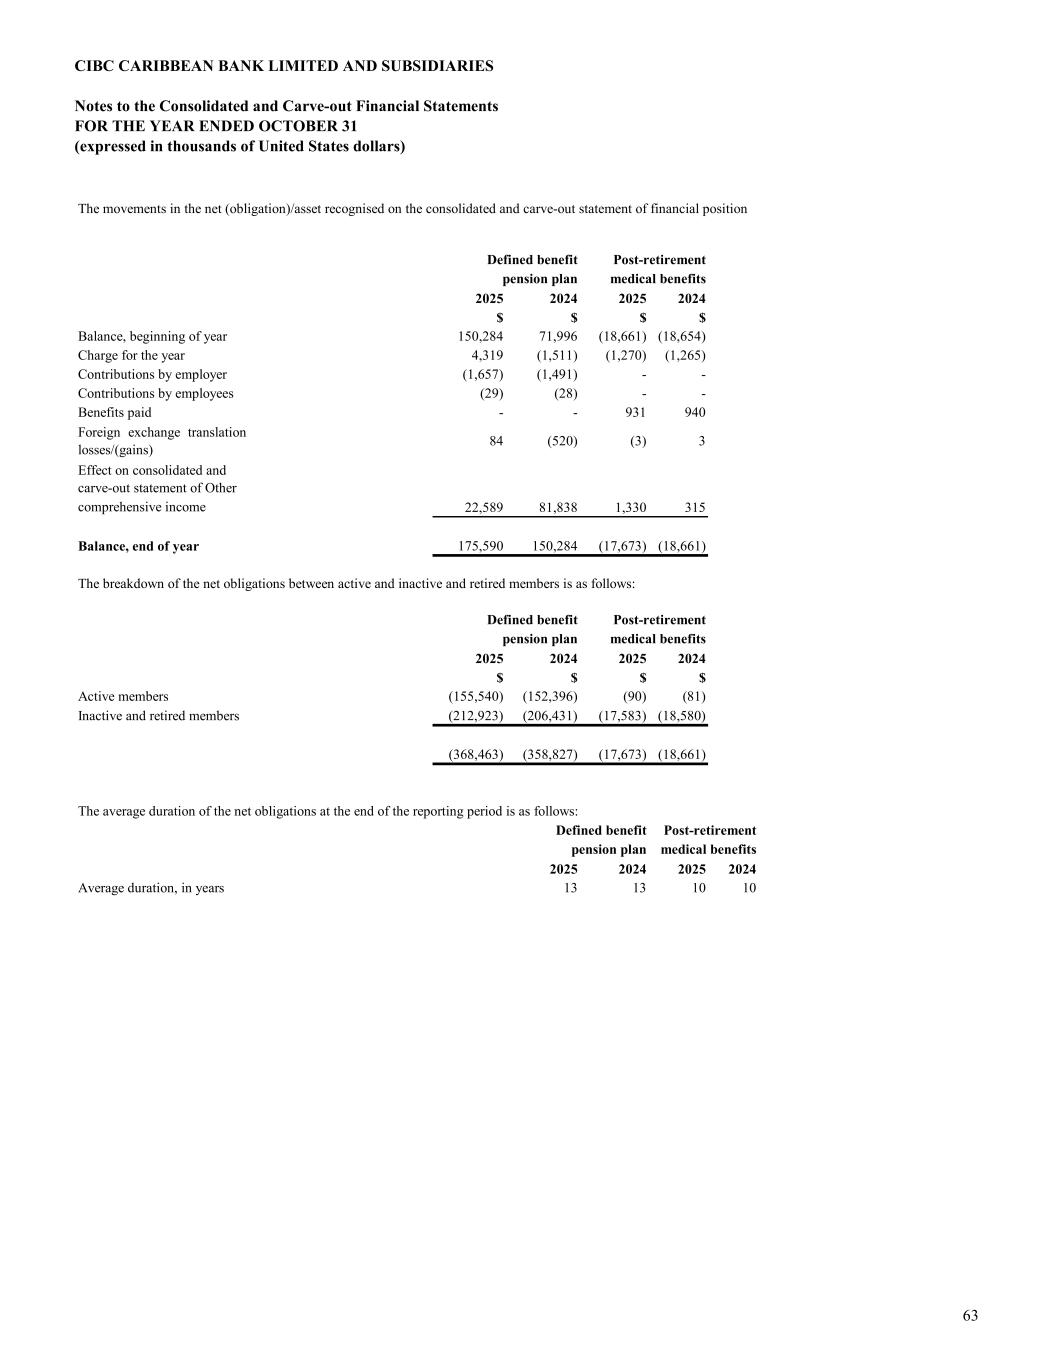
CIBC CARIBBEAN BANK LIMITED AND SUBSIDIARIES Notes to the Consolidated and Carve-out Financial Statements FOR THE YEAR ENDED OCTOBER 31 (expressed in thousands of United States dollars) 2025 2024 2025 2024 $ $ $ $ Balance, beginning of year 150,284 71,996 (18,661) (18,654) Charge for the year 4,319 (1,511) (1,270) (1,265) Contributions by employer (1,657) (1,491) - - Contributions by employees (29) (28) - - Benefits paid - - 931 940 Foreign exchange translation losses/(gains) 84 (520) (3) 3 Effect on consolidated and carve-out statement of Other 22,589 81,838 1,330 315 Balance, end of year 175,590 150,284 (17,673) (18,661) 2025 2024 2025 2024 $ $ $ $ Active members (155,540) (152,396) (90) (81) Inactive and retired members (212,923) (206,431) (17,583) (18,580) (368,463) (358,827) (17,673) (18,661) 2025 2024 2025 2024 Average duration, in years 13 13 10 10 Defined benefit pension plan medical benefits The movements in the net (obligation)/asset recognised on the consolidated and carve-out statement of financial position Defined benefit The breakdown of the net obligations between active and inactive and retired members is as follows: comprehensive income The average duration of the net obligations at the end of the reporting period is as follows: Defined benefit pension plan Post-retirement medical benefits Post-retirement pension plan Post-retirement medical benefits 63
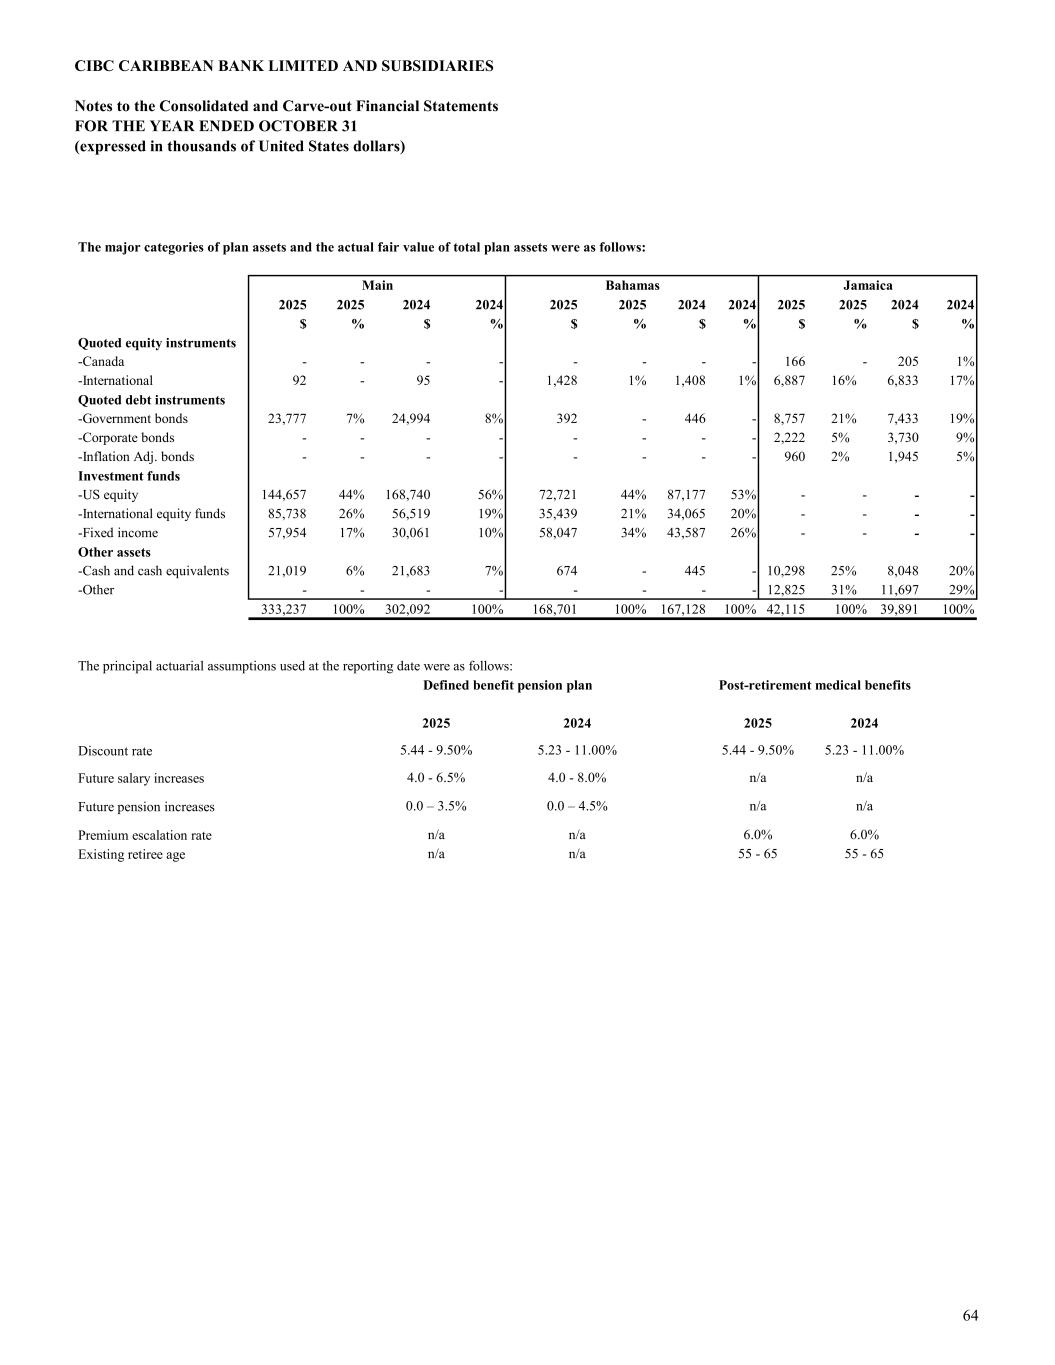
CIBC CARIBBEAN BANK LIMITED AND SUBSIDIARIES Notes to the Consolidated and Carve-out Financial Statements FOR THE YEAR ENDED OCTOBER 31 (expressed in thousands of United States dollars) 2025 2025 2024 2024 2025 2025 2024 2024 2025 2025 2024 2024 $ % $ % $ % $ % $ % $ % Quoted equity instruments -Canada - - - - - - - - 166 - 205 1% -International 92 - 95 - 1,428 1% 1,408 1% 6,887 16% 6,833 17% Quoted debt instruments -Government bonds 23,777 7% 24,994 8% 392 - 446 - 8,757 21% 7,433 19% -Corporate bonds - - - - - - - - 2,222 5% 3,730 9% -Inflation Adj. bonds - - - - - - - - 960 2% 1,945 5% Investment funds -US equity 144,657 44% 168,740 56% 72,721 44% 87,177 53% - - - - -International equity funds 85,738 26% 56,519 19% 35,439 21% 34,065 20% - - - - -Fixed income 57,954 17% 30,061 10% 58,047 34% 43,587 26% - - - - Other assets -Cash and cash equivalents 21,019 6% 21,683 7% 674 - 445 - 10,298 25% 8,048 20% -Other - - - - - - - - 12,825 31% 11,697 29% 333,237 100% 302,092 100% 168,701 100% 167,128 100% 42,115 100% 39,891 100% Discount rate Future salary increases Future pension increases Premium escalation rate Existing retiree age 5.23 - 11.00% n/a n/a 6.0% The principal actuarial assumptions used at the reporting date were as follows: BahamasMain The major categories of plan assets and the actual fair value of total plan assets were as follows: 4.0 - 6.5% 0.0 – 3.5% n/a Jamaica 55 - 65 5.44 - 9.50% n/a n/a 6.0% 55 - 65n/a Defined benefit pension plan 4.0 - 8.0% 0.0 – 4.5% n/a n/a 2025 5.44 - 9.50% 5.23 - 11.00% 2024 Post-retirement medical benefits 2025 2024 64
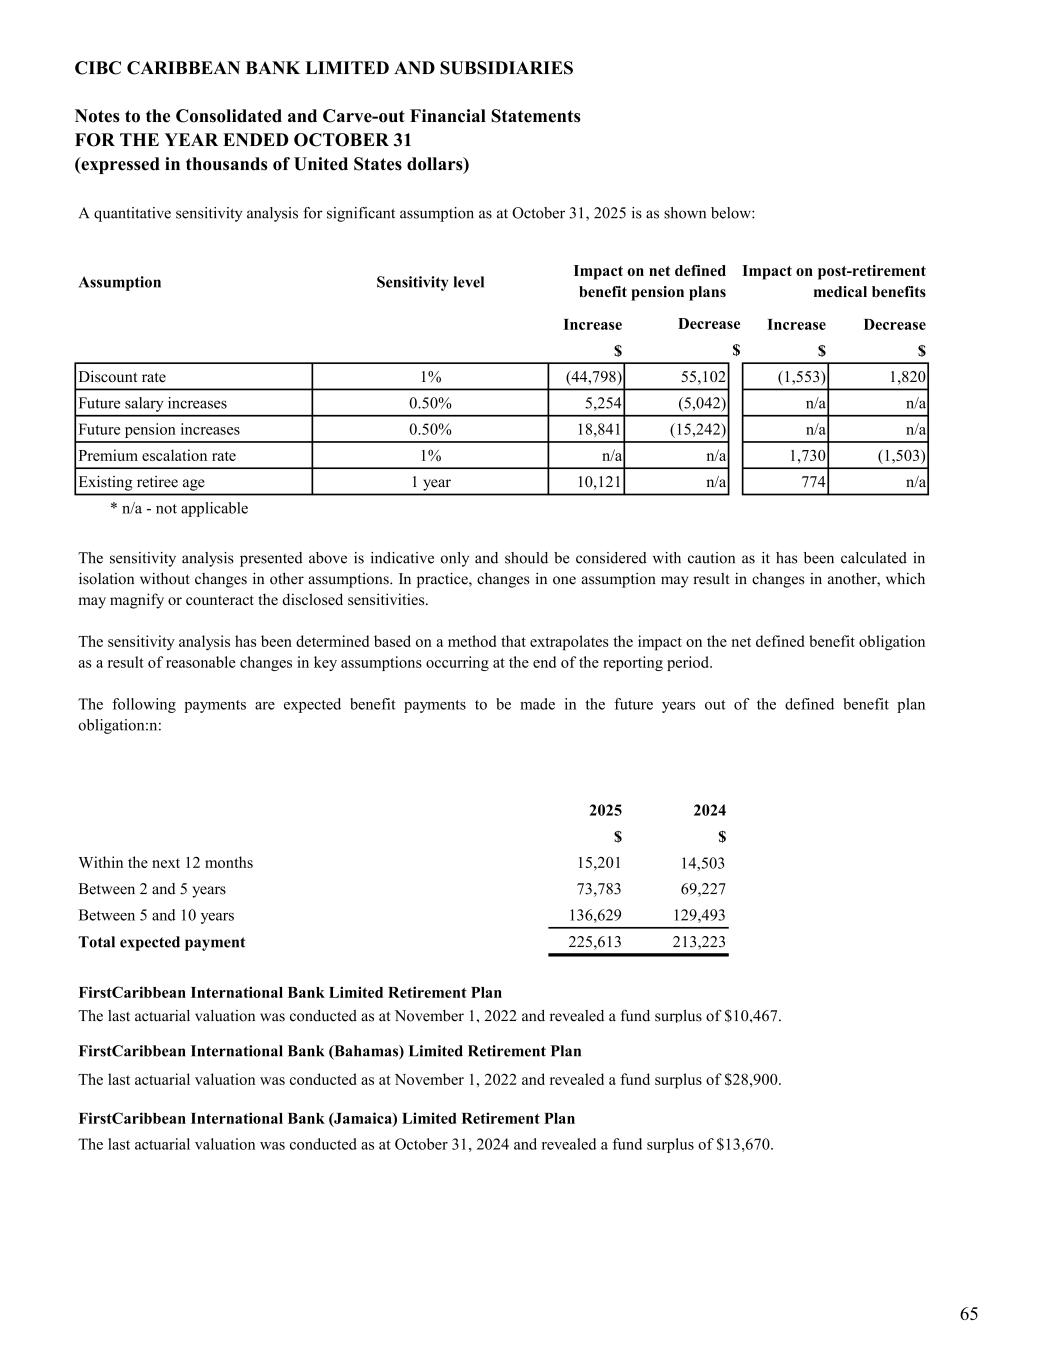
CIBC CARIBBEAN BANK LIMITED AND SUBSIDIARIES Notes to the Consolidated and Carve-out Financial Statements FOR THE YEAR ENDED OCTOBER 31 (expressed in thousands of United States dollars) A quantitative sensitivity analysis for significant assumption as at October 31, 2025 is as shown below: Assumption Sensitivity level Increase Increase Decrease $ $ $ Discount rate 1% (44,798) 55,102 (1,553) 1,820 Future salary increases 0.50% 5,254 (5,042) n/a n/a Future pension increases 0.50% 18,841 (15,242) n/a n/a Premium escalation rate 1% n/a n/a 1,730 (1,503) Existing retiree age 1 year 10,121 n/a 774 n/a * n/a - not applicable 2025 2024 $ $ Within the next 12 months 15,201 14,503 Between 2 and 5 years 73,783 69,227 Between 5 and 10 years 136,629 129,493 Total expected payment 225,613 213,223 The last actuarial valuation was conducted as at November 1, 2022 and revealed a fund surplus of $10,467. The last actuarial valuation was conducted as at November 1, 2022 and revealed a fund surplus of $28,900. The last actuarial valuation was conducted as at October 31, 2024 and revealed a fund surplus of $13,670. The sensitivity analysis presented above is indicative only and should be considered with caution as it has been calculated in isolation without changes in other assumptions. In practice, changes in one assumption may result in changes in another, which may magnify or counteract the disclosed sensitivities. The sensitivity analysis has been determined based on a method that extrapolates the impact on the net defined benefit obligation as a result of reasonable changes in key assumptions occurring at the end of the reporting period. The following payments are expected benefit payments to be made in the future years out of the defined benefit plan obligation:n: FirstCaribbean International Bank (Jamaica) Limited Retirement Plan Impact on net defined benefit pension plans Impact on post-retirement medical benefits $ FirstCaribbean International Bank (Bahamas) Limited Retirement Plan FirstCaribbean International Bank Limited Retirement Plan Decrease 65
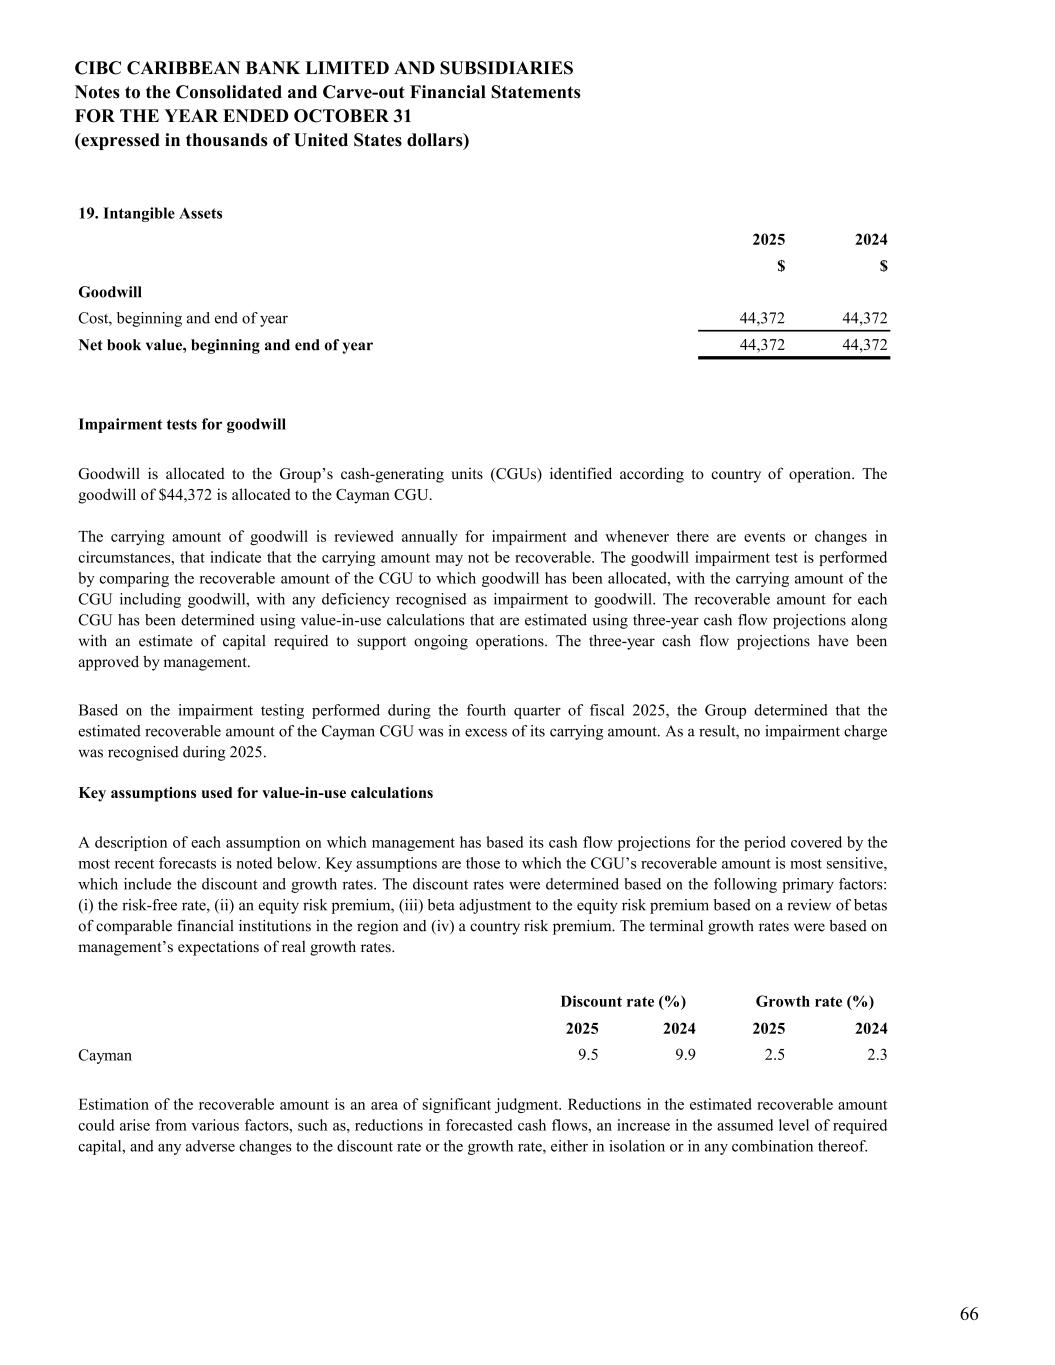
CIBC CARIBBEAN BANK LIMITED AND SUBSIDIARIES Notes to the Consolidated and Carve-out Financial Statements FOR THE YEAR ENDED OCTOBER 31 (expressed in thousands of United States dollars) 19. Intangible Assets 2025 2024 $ $ Goodwill Cost, beginning and end of year 44,372 44,372 Net book value, beginning and end of year 44,372 44,372 Impairment tests for goodwill Key assumptions used for value-in-use calculations 2025 2024 2025 2024 Cayman 9.5 9.9 2.5 2.3 Estimation of the recoverable amount is an area of significant judgment. Reductions in the estimated recoverable amount could arise from various factors, such as, reductions in forecasted cash flows, an increase in the assumed level of required capital, and any adverse changes to the discount rate or the growth rate, either in isolation or in any combination thereof. Goodwill is allocated to the Group’s cash-generating units (CGUs) identified according to country of operation. The goodwill of $44,372 is allocated to the Cayman CGU. The carrying amount of goodwill is reviewed annually for impairment and whenever there are events or changes in circumstances, that indicate that the carrying amount may not be recoverable. The goodwill impairment test is performed by comparing the recoverable amount of the CGU to which goodwill has been allocated, with the carrying amount of the CGU including goodwill, with any deficiency recognised as impairment to goodwill. The recoverable amount for each CGU has been determined using value-in-use calculations that are estimated using three-year cash flow projections along with an estimate of capital required to support ongoing operations. The three-year cash flow projections have been approved by management. Based on the impairment testing performed during the fourth quarter of fiscal 2025, the Group determined that the estimated recoverable amount of the Cayman CGU was in excess of its carrying amount. As a result, no impairment charge was recognised during 2025. A description of each assumption on which management has based its cash flow projections for the period covered by the most recent forecasts is noted below. Key assumptions are those to which the CGU’s recoverable amount is most sensitive, which include the discount and growth rates. The discount rates were determined based on the following primary factors: (i) the risk-free rate, (ii) an equity risk premium, (iii) beta adjustment to the equity risk premium based on a review of betas of comparable financial institutions in the region and (iv) a country risk premium. The terminal growth rates were based on management’s expectations of real growth rates. Discount rate (%) Growth rate (%) 66
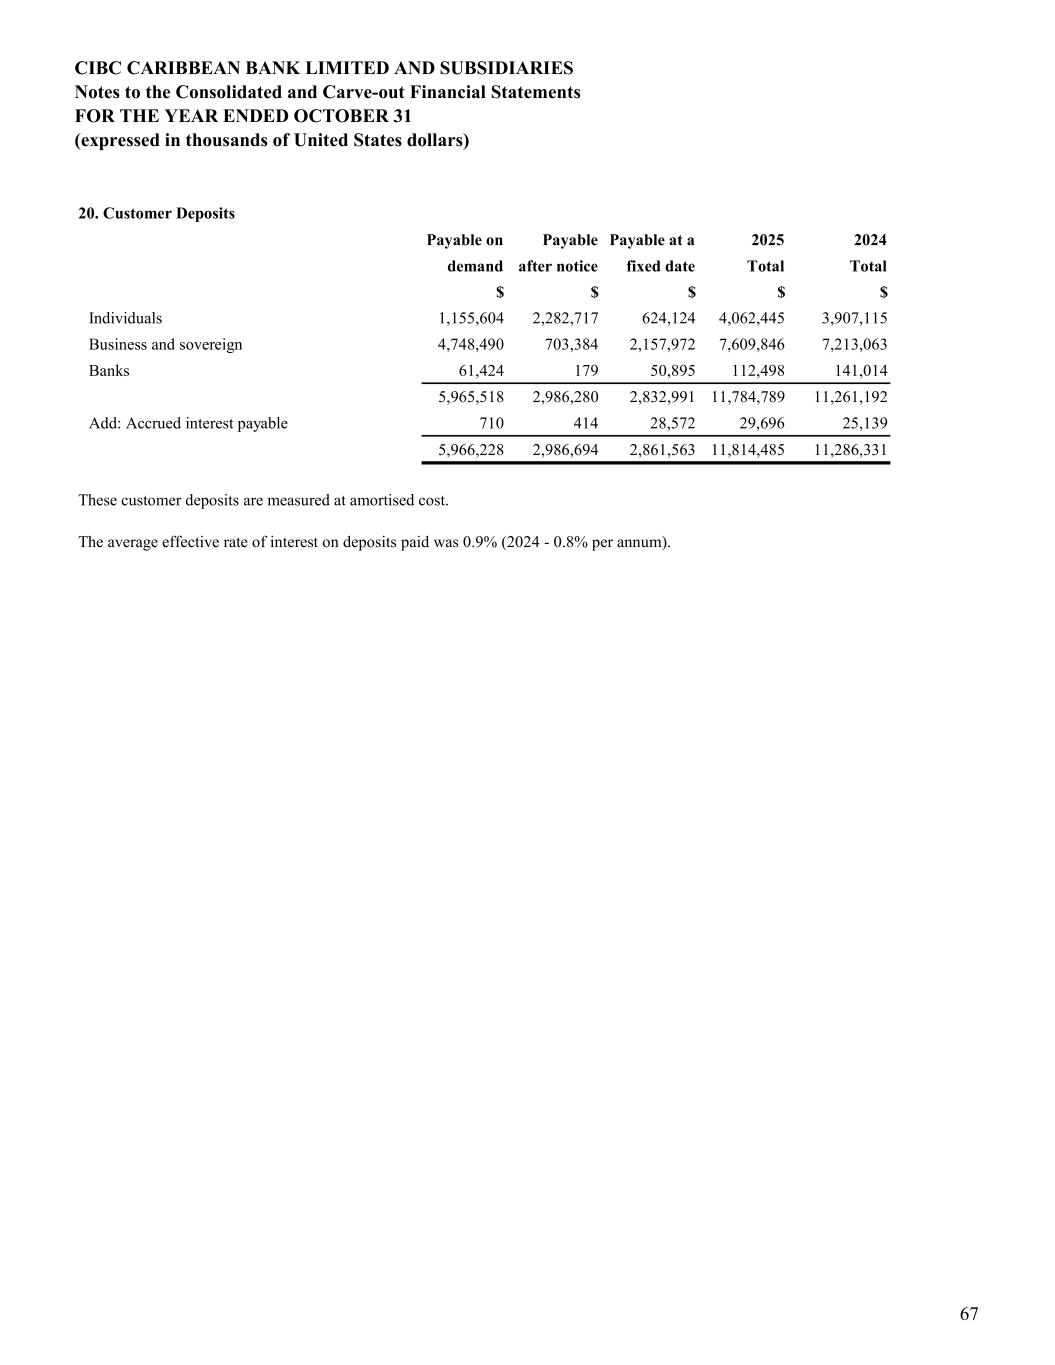
CIBC CARIBBEAN BANK LIMITED AND SUBSIDIARIES Notes to the Consolidated and Carve-out Financial Statements FOR THE YEAR ENDED OCTOBER 31 (expressed in thousands of United States dollars) 20. Customer Deposits Payable on Payable Payable at a 2025 2024 demand after notice fixed date Total Total $ $ $ $ $ Individuals 1,155,604 2,282,717 624,124 4,062,445 3,907,115 Business and sovereign 4,748,490 703,384 2,157,972 7,609,846 7,213,063 Banks 61,424 179 50,895 112,498 141,014 5,965,518 2,986,280 2,832,991 11,784,789 11,261,192 Add: Accrued interest payable 710 414 28,572 29,696 25,139 5,966,228 2,986,694 2,861,563 11,814,485 11,286,331 These customer deposits are measured at amortised cost. The average effective rate of interest on deposits paid was 0.9% (2024 - 0.8% per annum). 67
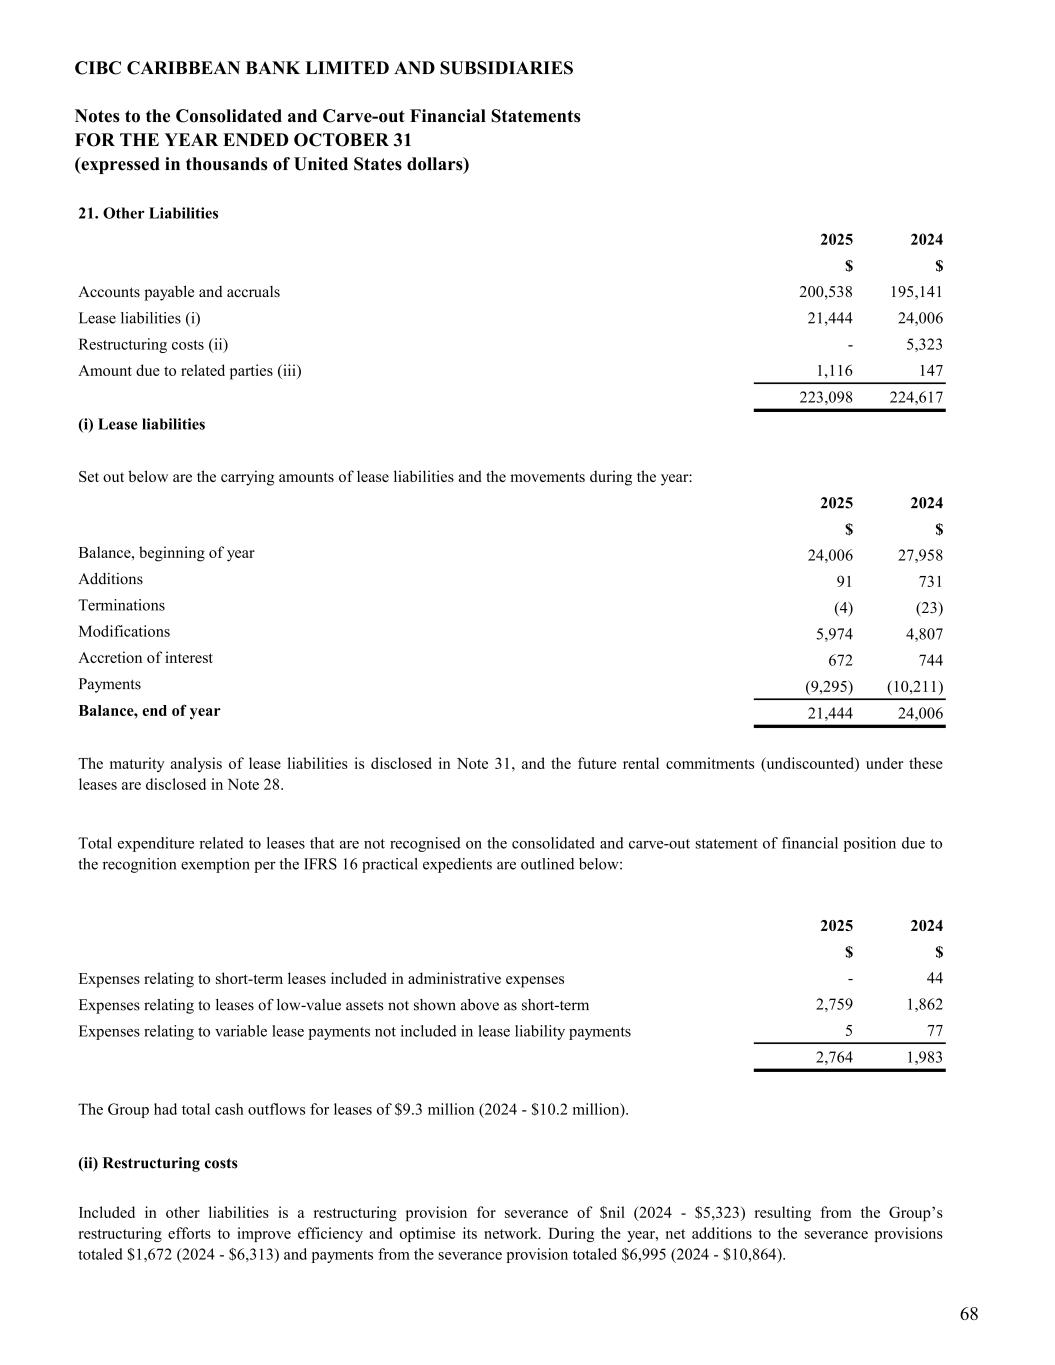
CIBC CARIBBEAN BANK LIMITED AND SUBSIDIARIES Notes to the Consolidated and Carve-out Financial Statements FOR THE YEAR ENDED OCTOBER 31 (expressed in thousands of United States dollars) 21. Other Liabilities 2025 2024 $ $ Accounts payable and accruals 200,538 195,141 Lease liabilities (i) 21,444 24,006 Restructuring costs (ii) - 5,323 Amount due to related parties (iii) 1,116 147 223,098 224,617 (i) Lease liabilities 2025 2024 $ $ Balance, beginning of year 24,006 27,958 Additions 91 731 Terminations (4) (23) Modifications 5,974 4,807 Accretion of interest 672 744 Payments (9,295) (10,211) Balance, end of year 21,444 24,006 2025 2024 $ $ Expenses relating to short-term leases included in administrative expenses - 44 Expenses relating to leases of low-value assets not shown above as short-term 2,759 1,862 Expenses relating to variable lease payments not included in lease liability payments 5 77 2,764 1,983 (ii) Restructuring costs Set out below are the carrying amounts of lease liabilities and the movements during the year: The maturity analysis of lease liabilities is disclosed in Note 31, and the future rental commitments (undiscounted) under these leases are disclosed in Note 28. Total expenditure related to leases that are not recognised on the consolidated and carve-out statement of financial position due to the recognition exemption per the IFRS 16 practical expedients are outlined below: The Group had total cash outflows for leases of $9.3 million (2024 - $10.2 million). Included in other liabilities is a restructuring provision for severance of $nil (2024 - $5,323) resulting from the Group’s restructuring efforts to improve efficiency and optimise its network. During the year, net additions to the severance provisions totaled $1,672 (2024 - $6,313) and payments from the severance provision totaled $6,995 (2024 - $10,864). 68
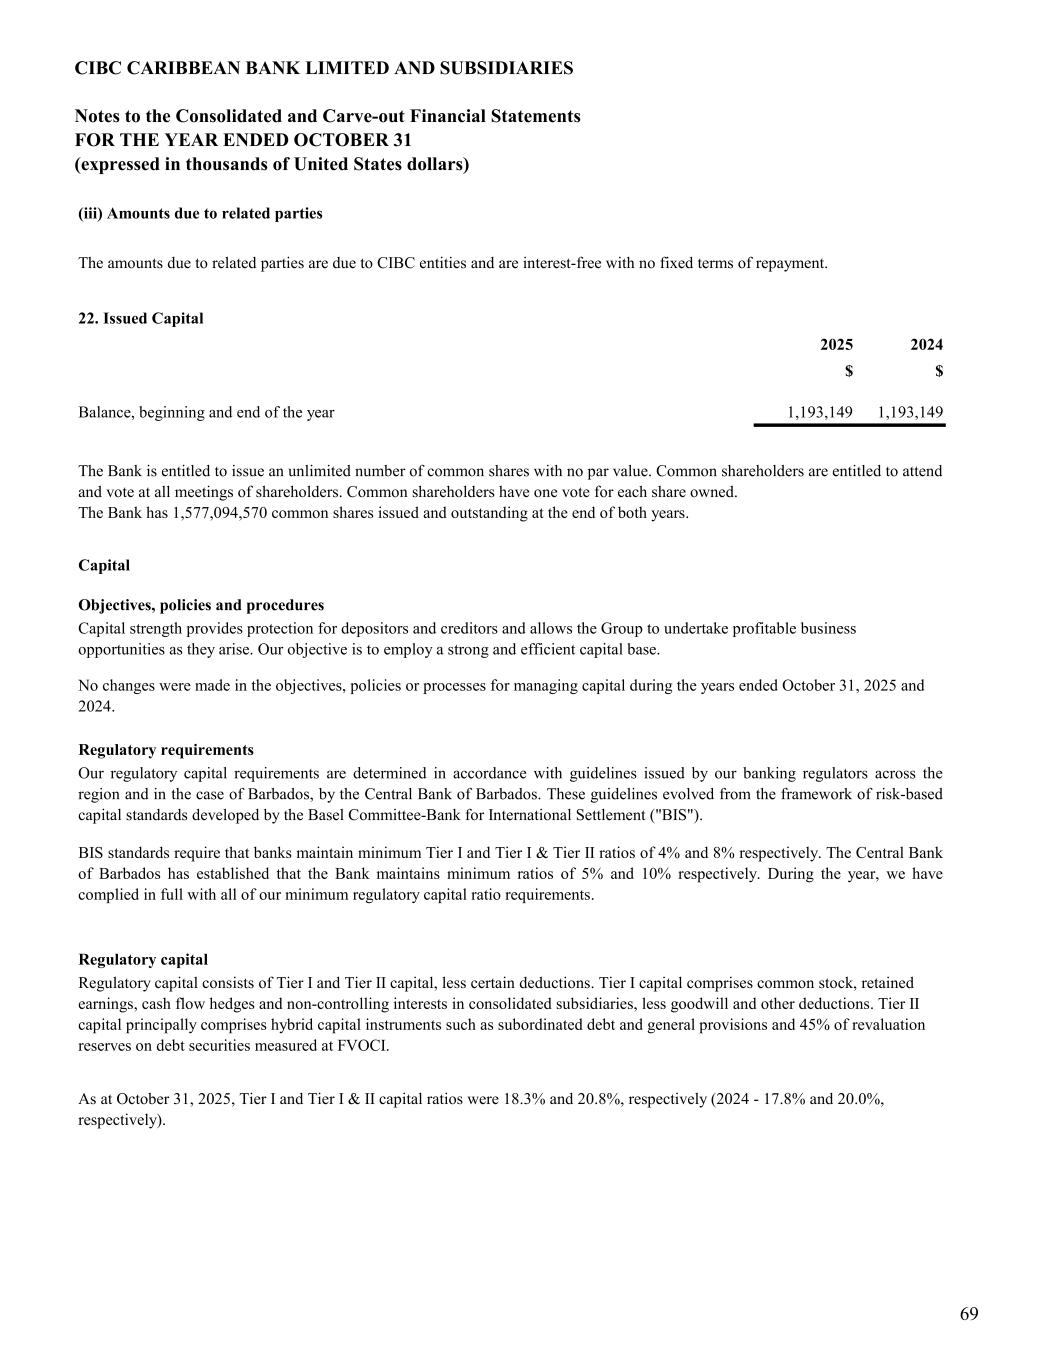
CIBC CARIBBEAN BANK LIMITED AND SUBSIDIARIES Notes to the Consolidated and Carve-out Financial Statements FOR THE YEAR ENDED OCTOBER 31 (expressed in thousands of United States dollars) (iii) Amounts due to related parties 22. Issued Capital 2025 2024 $ $ Balance, beginning and end of the year 1,193,149 1,193,149 Capital Objectives, policies and procedures Regulatory requirements Regulatory capital As at October 31, 2025, Tier I and Tier I & II capital ratios were 18.3% and 20.8%, respectively (2024 - 17.8% and 20.0%, respectively). The Bank is entitled to issue an unlimited number of common shares with no par value. Common shareholders are entitled to attend and vote at all meetings of shareholders. Common shareholders have one vote for each share owned. The Bank has 1,577,094,570 common shares issued and outstanding at the end of both years. Capital strength provides protection for depositors and creditors and allows the Group to undertake profitable business opportunities as they arise. Our objective is to employ a strong and efficient capital base. No changes were made in the objectives, policies or processes for managing capital during the years ended October 31, 2025 and 2024. Our regulatory capital requirements are determined in accordance with guidelines issued by our banking regulators across the region and in the case of Barbados, by the Central Bank of Barbados. These guidelines evolved from the framework of risk-based capital standards developed by the Basel Committee-Bank for International Settlement ("BIS"). BIS standards require that banks maintain minimum Tier I and Tier I & Tier II ratios of 4% and 8% respectively. The Central Bank of Barbados has established that the Bank maintains minimum ratios of 5% and 10% respectively. During the year, we have complied in full with all of our minimum regulatory capital ratio requirements. Regulatory capital consists of Tier I and Tier II capital, less certain deductions. Tier I capital comprises common stock, retained earnings, cash flow hedges and non-controlling interests in consolidated subsidiaries, less goodwill and other deductions. Tier II capital principally comprises hybrid capital instruments such as subordinated debt and general provisions and 45% of revaluation reserves on debt securities measured at FVOCI. The amounts due to related parties are due to CIBC entities and are interest-free with no fixed terms of repayment. 69
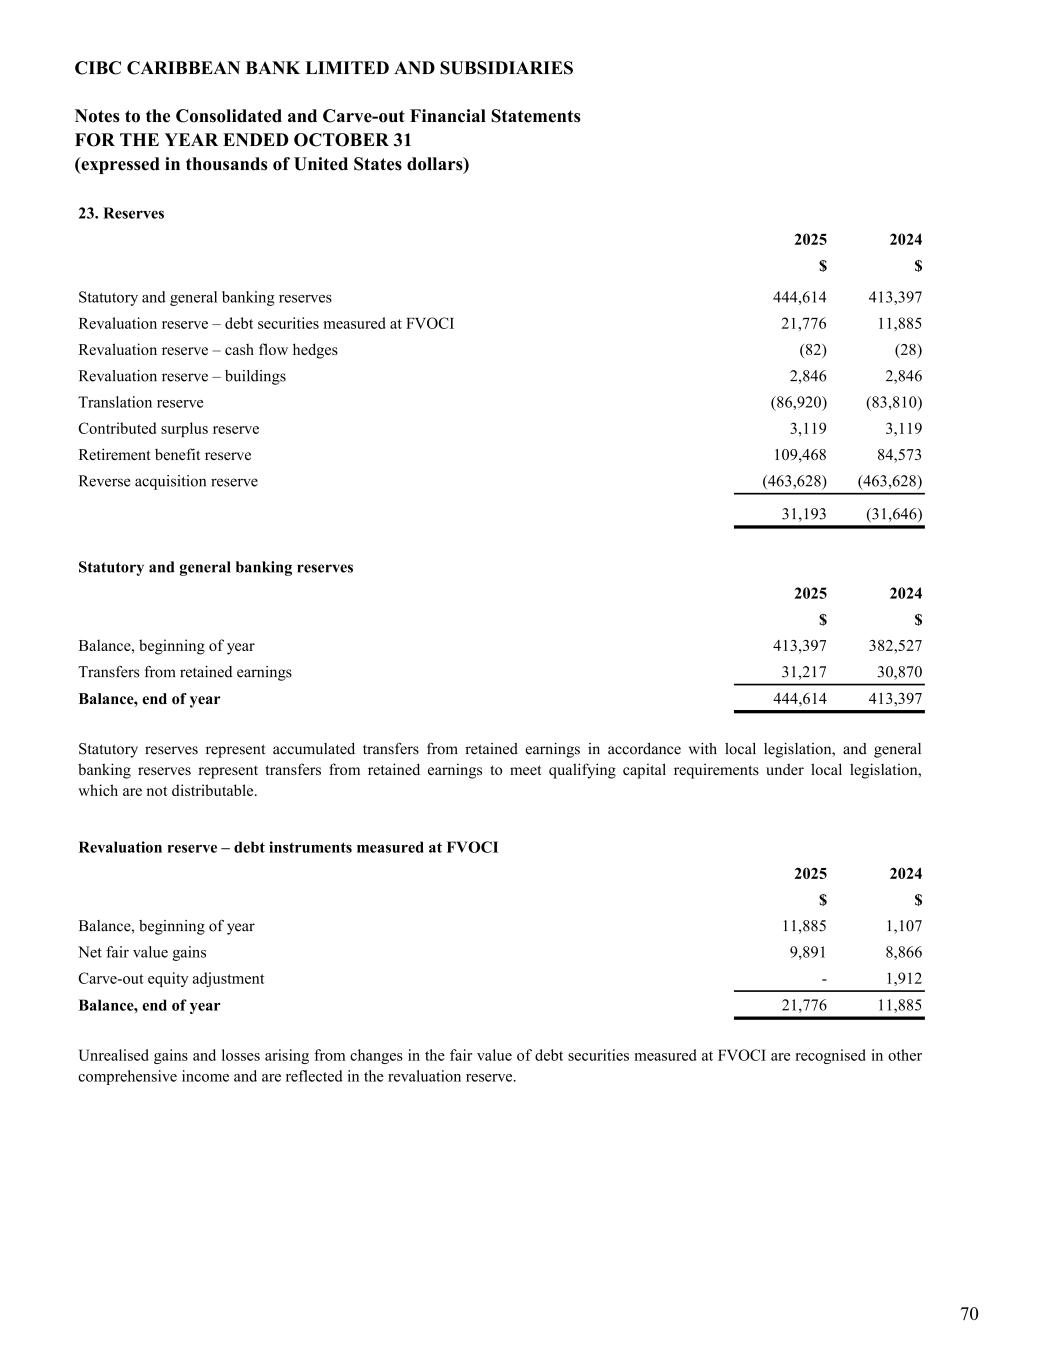
CIBC CARIBBEAN BANK LIMITED AND SUBSIDIARIES Notes to the Consolidated and Carve-out Financial Statements FOR THE YEAR ENDED OCTOBER 31 (expressed in thousands of United States dollars) 23. Reserves 2025 2024 $ $ Statutory and general banking reserves 444,614 413,397 Revaluation reserve – debt securities measured at FVOCI 21,776 11,885 Revaluation reserve – cash flow hedges (82) (28) Revaluation reserve – buildings 2,846 2,846 Translation reserve (86,920) (83,810) Contributed surplus reserve 3,119 3,119 Retirement benefit reserve 109,468 84,573 Reverse acquisition reserve (463,628) (463,628) 31,193 (31,646) Statutory and general banking reserves 2025 2024 $ $ Balance, beginning of year 413,397 382,527 Transfers from retained earnings 31,217 30,870 Balance, end of year 444,614 413,397 Revaluation reserve – debt instruments measured at FVOCI 2025 2024 $ $ Balance, beginning of year 11,885 1,107 Net fair value gains 9,891 8,866 Carve-out equity adjustment - 1,912 Balance, end of year 21,776 11,885 Statutory reserves represent accumulated transfers from retained earnings in accordance with local legislation, and general banking reserves represent transfers from retained earnings to meet qualifying capital requirements under local legislation, which are not distributable. Unrealised gains and losses arising from changes in the fair value of debt securities measured at FVOCI are recognised in other comprehensive income and are reflected in the revaluation reserve. 70
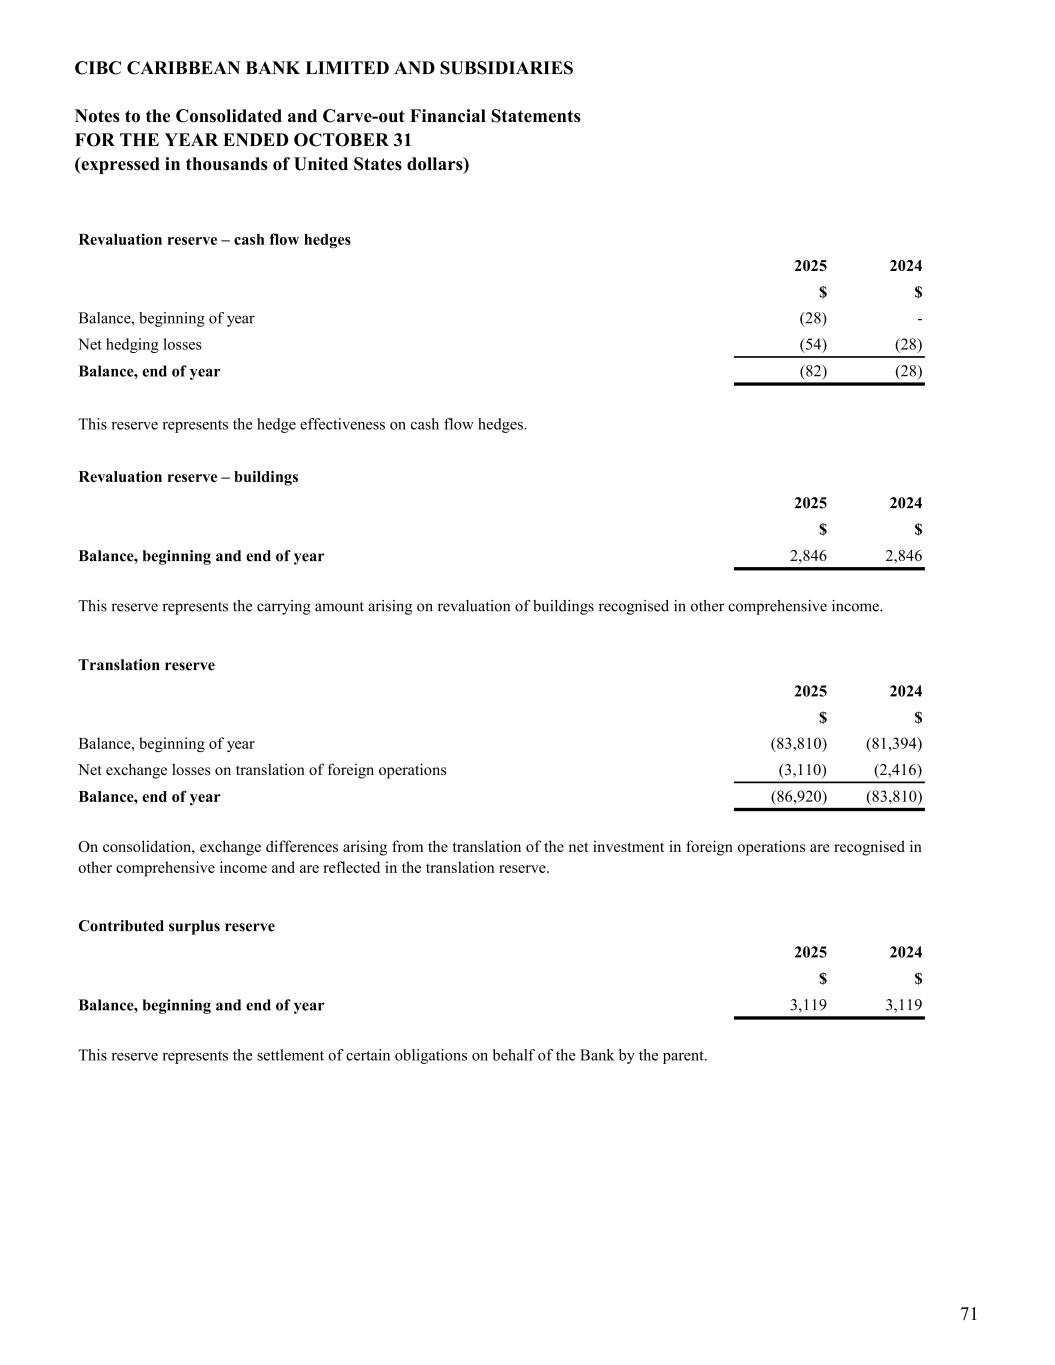
CIBC CARIBBEAN BANK LIMITED AND SUBSIDIARIES Notes to the Consolidated and Carve-out Financial Statements FOR THE YEAR ENDED OCTOBER 31 (expressed in thousands of United States dollars) Revaluation reserve – cash flow hedges 2025 2024 $ $ Balance, beginning of year (28) - Net hedging losses (54) (28) Balance, end of year (82) (28) Revaluation reserve – buildings 2025 2024 $ $ Balance, beginning and end of year 2,846 2,846 Translation reserve 2025 2024 $ $ Balance, beginning of year (83,810) (81,394) Net exchange losses on translation of foreign operations (3,110) (2,416) Balance, end of year (86,920) (83,810) Contributed surplus reserve 2025 2024 $ $ Balance, beginning and end of year 3,119 3,119 This reserve represents the hedge effectiveness on cash flow hedges. This reserve represents the carrying amount arising on revaluation of buildings recognised in other comprehensive income. On consolidation, exchange differences arising from the translation of the net investment in foreign operations are recognised in other comprehensive income and are reflected in the translation reserve. This reserve represents the settlement of certain obligations on behalf of the Bank by the parent. 71
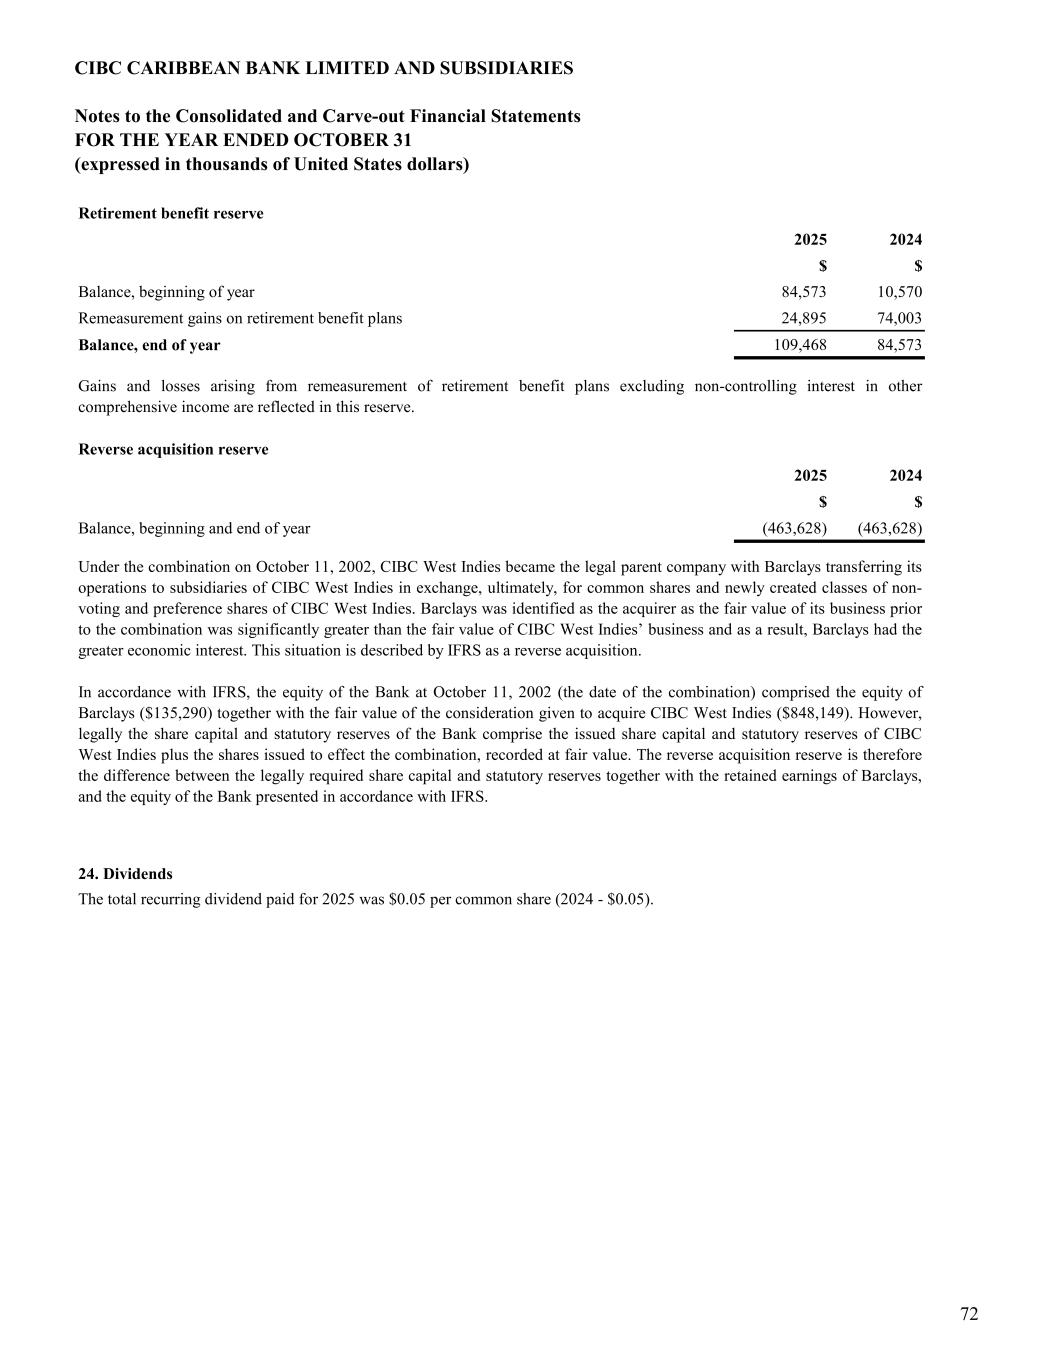
CIBC CARIBBEAN BANK LIMITED AND SUBSIDIARIES Notes to the Consolidated and Carve-out Financial Statements FOR THE YEAR ENDED OCTOBER 31 (expressed in thousands of United States dollars) Retirement benefit reserve 2025 2024 $ $ Balance, beginning of year 84,573 10,570 Remeasurement gains on retirement benefit plans 24,895 74,003 Balance, end of year 109,468 84,573 Reverse acquisition reserve 2025 2024 $ $ Balance, beginning and end of year (463,628) (463,628) 24. Dividends The total recurring dividend paid for 2025 was $0.05 per common share (2024 - $0.05). Gains and losses arising from remeasurement of retirement benefit plans excluding non-controlling interest in other comprehensive income are reflected in this reserve. Under the combination on October 11, 2002, CIBC West Indies became the legal parent company with Barclays transferring its operations to subsidiaries of CIBC West Indies in exchange, ultimately, for common shares and newly created classes of non- voting and preference shares of CIBC West Indies. Barclays was identified as the acquirer as the fair value of its business prior to the combination was significantly greater than the fair value of CIBC West Indies’ business and as a result, Barclays had the greater economic interest. This situation is described by IFRS as a reverse acquisition. In accordance with IFRS, the equity of the Bank at October 11, 2002 (the date of the combination) comprised the equity of Barclays ($135,290) together with the fair value of the consideration given to acquire CIBC West Indies ($848,149). However, legally the share capital and statutory reserves of the Bank comprise the issued share capital and statutory reserves of CIBC West Indies plus the shares issued to effect the combination, recorded at fair value. The reverse acquisition reserve is therefore the difference between the legally required share capital and statutory reserves together with the retained earnings of Barclays, and the equity of the Bank presented in accordance with IFRS. 72

CIBC CARIBBEAN BANK LIMITED AND SUBSIDIARIES Notes to the Consolidated and Carve-out Financial Statements FOR THE YEAR ENDED OCTOBER 31 (expressed in thousands of United States dollars) 25. Other Employee Benefits Long-term incentive plan Employee share purchase plan The Group operates a long-term incentive plan, whereby under the rules of the plan, cash-based awards are granted to employees on a discretionary basis and vest over varying periods. Effective from the 2019 award, which vested in 2022 and other subsequent awards, business performance criteria were applied over the vesting criteria, with the amount ultimately vested determined by the cumulative business performance over the three-year vesting period. Effective fiscal 2024 for awards granted in December 2023 and onwards, the Bank implemented an incentive compensation plan where awards granted were converted into PSUs based on the Group's parent (CIBC) share price at the award date. The performance criteria will continue to be applied over the three-year vesting period based on the average business performance factors. The PSUs attract notional dividends, which are reinvested in additional share units. These awards will continue to be cash settled. The awards granted in 2025 amounted to $2,850 (2024 - $3,379). The amounts expensed during the year related to awards under the long-term incentive plan were $2,376 (2024 - $3,944). As at October 31, 2025, the PSU liability recorded was $6,987 (2024 - $3,136). Under our employee share purchase plan, qualifying employees can choose each year to have up to 10% of their eligible earnings withheld to purchase common shares in the Group. The Group matches 50% of the employee’s contribution amount, up to a maximum contribution of 6% of eligible earnings, depending upon length of service and job level. The Group’s contributions vest after employees have two years of continuous participation in the plan, and all subsequent contributions vest immediately. All contributions are paid into a trust and used by the plan trustees to purchase common shares in the open market. The Group’s contributions are expensed as incurred and totaled $1,716 in 2025 (2024 - $1,732). 73
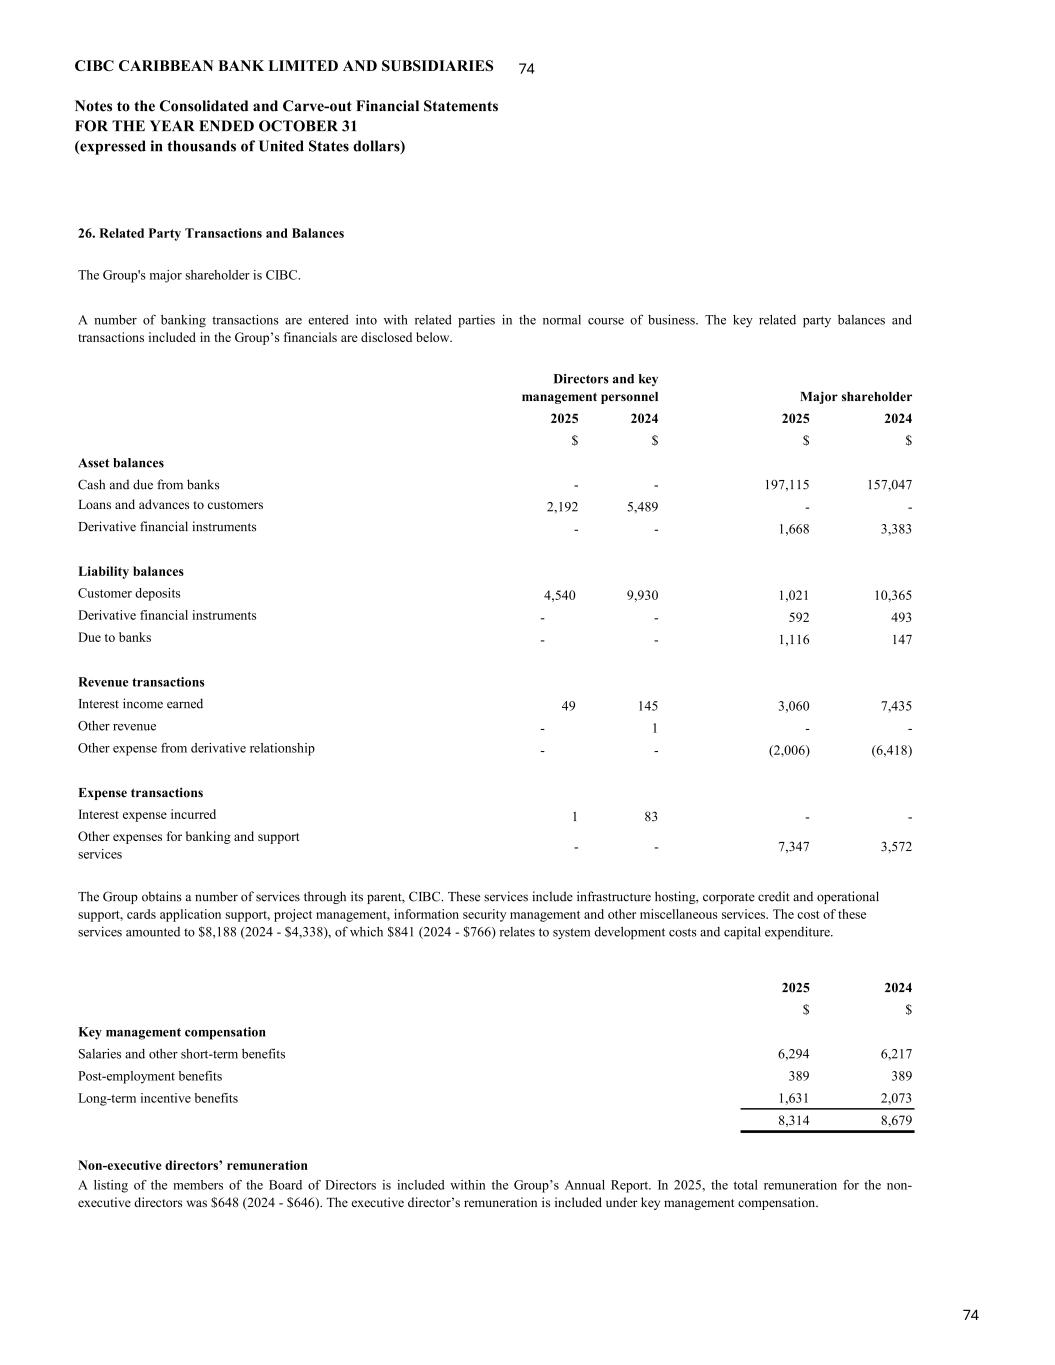
CIBC CARIBBEAN BANK LIMITED AND SUBSIDIARIES Notes to the Consolidated and Carve-out Financial Statements FOR THE YEAR ENDED OCTOBER 31 (expressed in thousands of United States dollars) 74 26. Related Party Transactions and Balances 2025 2024 2025 2024 $ $ $ $ Asset balances Cash and due from banks - - 197,115 157,047 Loans and advances to customers 2,192 5,489 - - Derivative financial instruments - - 1,668 3,383 Liability balances Customer deposits 4,540 9,930 1,021 10,365 Derivative financial instruments - - 592 493 Due to banks - - 1,116 147 Revenue transactions Interest income earned 49 145 3,060 7,435 Other revenue - 1 - - Other expense from derivative relationship - - (2,006) (6,418) Expense transactions Interest expense incurred 1 83 - - Other expenses for banking and support services - - 7,347 3,572 2025 2024 $ $ Key management compensation Salaries and other short-term benefits 6,294 6,217 Post-employment benefits 389 389 Long-term incentive benefits 1,631 2,073 8,314 8,679 Non-executive directors’ remuneration The Group obtains a number of services through its parent, CIBC. These services include infrastructure hosting, corporate credit and operational support, cards application support, project management, information security management and other miscellaneous services. The cost of these services amounted to $8,188 (2024 - $4,338), of which $841 (2024 - $766) relates to system development costs and capital expenditure. A listing of the members of the Board of Directors is included within the Group’s Annual Report. In 2025, the total remuneration for the non- executive directors was $648 (2024 - $646). The executive director’s remuneration is included under key management compensation. The Group's major shareholder is CIBC. A number of banking transactions are entered into with related parties in the normal course of business. The key related party balances and transactions included in the Group’s financials are disclosed below. Directors and key management personnel Major shareholder 74
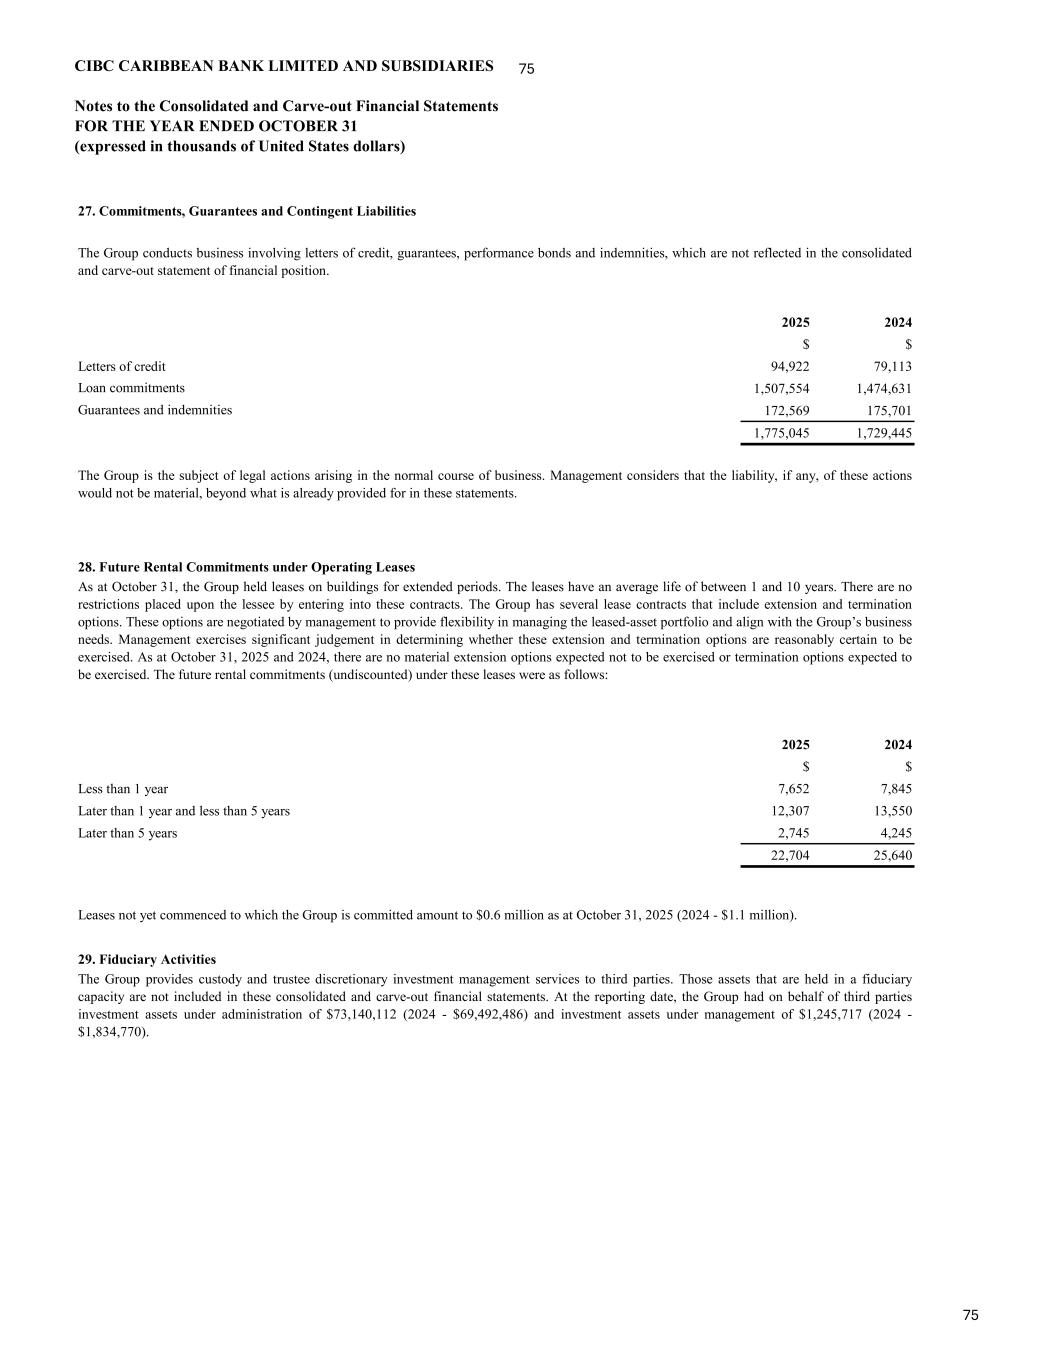
CIBC CARIBBEAN BANK LIMITED AND SUBSIDIARIES Notes to the Consolidated and Carve-out Financial Statements FOR THE YEAR ENDED OCTOBER 31 (expressed in thousands of United States dollars) 75 27. Commitments, Guarantees and Contingent Liabilities 2025 2024 $ $ Letters of credit 94,922 79,113 1,507,554 1,474,631 172,569 175,701 1,775,045 1,729,445 28. Future Rental Commitments under Operating Leases 2025 2024 $ $ Less than 1 year 7,652 7,845 Later than 1 year and less than 5 years 12,307 13,550 Later than 5 years 2,745 4,245 22,704 25,640 29. Fiduciary Activities As at October 31, the Group held leases on buildings for extended periods. The leases have an average life of between 1 and 10 years. There are no restrictions placed upon the lessee by entering into these contracts. The Group has several lease contracts that include extension and termination options. These options are negotiated by management to provide flexibility in managing the leased-asset portfolio and align with the Group’s business needs. Management exercises significant judgement in determining whether these extension and termination options are reasonably certain to be exercised. As at October 31, 2025 and 2024, there are no material extension options expected not to be exercised or termination options expected to be exercised. The future rental commitments (undiscounted) under these leases were as follows: Leases not yet commenced to which the Group is committed amount to $0.6 million as at October 31, 2025 (2024 - $1.1 million). The Group provides custody and trustee discretionary investment management services to third parties. Those assets that are held in a fiduciary capacity are not included in these consolidated and carve-out financial statements. At the reporting date, the Group had on behalf of third parties investment assets under administration of $73,140,112 (2024 - $69,492,486) and investment assets under management of $1,245,717 (2024 - $1,834,770). The Group conducts business involving letters of credit, guarantees, performance bonds and indemnities, which are not reflected in the consolidated and carve-out statement of financial position. Loan commitments Guarantees and indemnities The Group is the subject of legal actions arising in the normal course of business. Management considers that the liability, if any, of these actions would not be material, beyond what is already provided for in these statements. 75
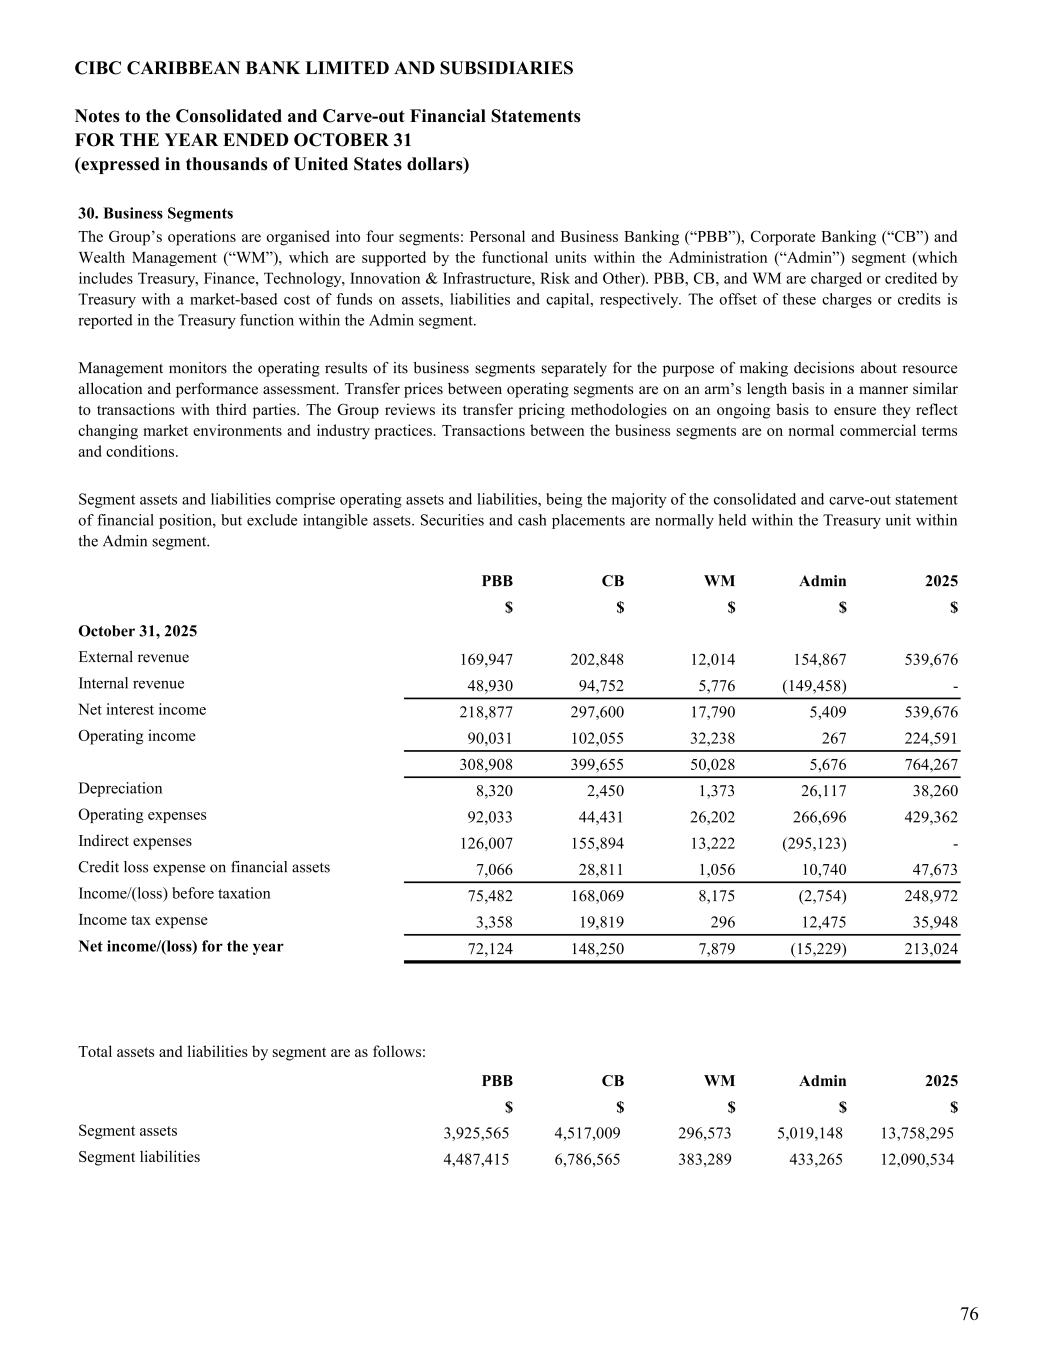
CIBC CARIBBEAN BANK LIMITED AND SUBSIDIARIES Notes to the Consolidated and Carve-out Financial Statements FOR THE YEAR ENDED OCTOBER 31 (expressed in thousands of United States dollars) 30. Business Segments PBB CB WM Admin 2025 $ $ $ $ $ October 31, 2025 External revenue 169,947 202,848 12,014 154,867 539,676 Internal revenue 48,930 94,752 5,776 (149,458) - Net interest income 218,877 297,600 17,790 5,409 539,676 Operating income 90,031 102,055 32,238 267 224,591 308,908 399,655 50,028 5,676 764,267 Depreciation 8,320 2,450 1,373 26,117 38,260 Operating expenses 92,033 44,431 26,202 266,696 429,362 Indirect expenses 126,007 155,894 13,222 (295,123) - Credit loss expense on financial assets 7,066 28,811 1,056 10,740 47,673 Income/(loss) before taxation 75,482 168,069 8,175 (2,754) 248,972 Income tax expense 3,358 19,819 296 12,475 35,948 Net income/(loss) for the year 72,124 148,250 7,879 (15,229) 213,024 PBB CB WM Admin 2025 $ $ $ $ $ Segment assets 3,925,565 4,517,009 296,573 5,019,148 13,758,295 Segment liabilities 4,487,415 6,786,565 383,289 433,265 12,090,534 The Group’s operations are organised into four segments: Personal and Business Banking (“PBB”), Corporate Banking (“CB”) and Wealth Management (“WM”), which are supported by the functional units within the Administration (“Admin”) segment (which includes Treasury, Finance, Technology, Innovation & Infrastructure, Risk and Other). PBB, CB, and WM are charged or credited by Treasury with a market-based cost of funds on assets, liabilities and capital, respectively. The offset of these charges or credits is reported in the Treasury function within the Admin segment. Management monitors the operating results of its business segments separately for the purpose of making decisions about resource allocation and performance assessment. Transfer prices between operating segments are on an arm’s length basis in a manner similar to transactions with third parties. The Group reviews its transfer pricing methodologies on an ongoing basis to ensure they reflect changing market environments and industry practices. Transactions between the business segments are on normal commercial terms and conditions. Segment assets and liabilities comprise operating assets and liabilities, being the majority of the consolidated and carve-out statement of financial position, but exclude intangible assets. Securities and cash placements are normally held within the Treasury unit within the Admin segment. Total assets and liabilities by segment are as follows: 76
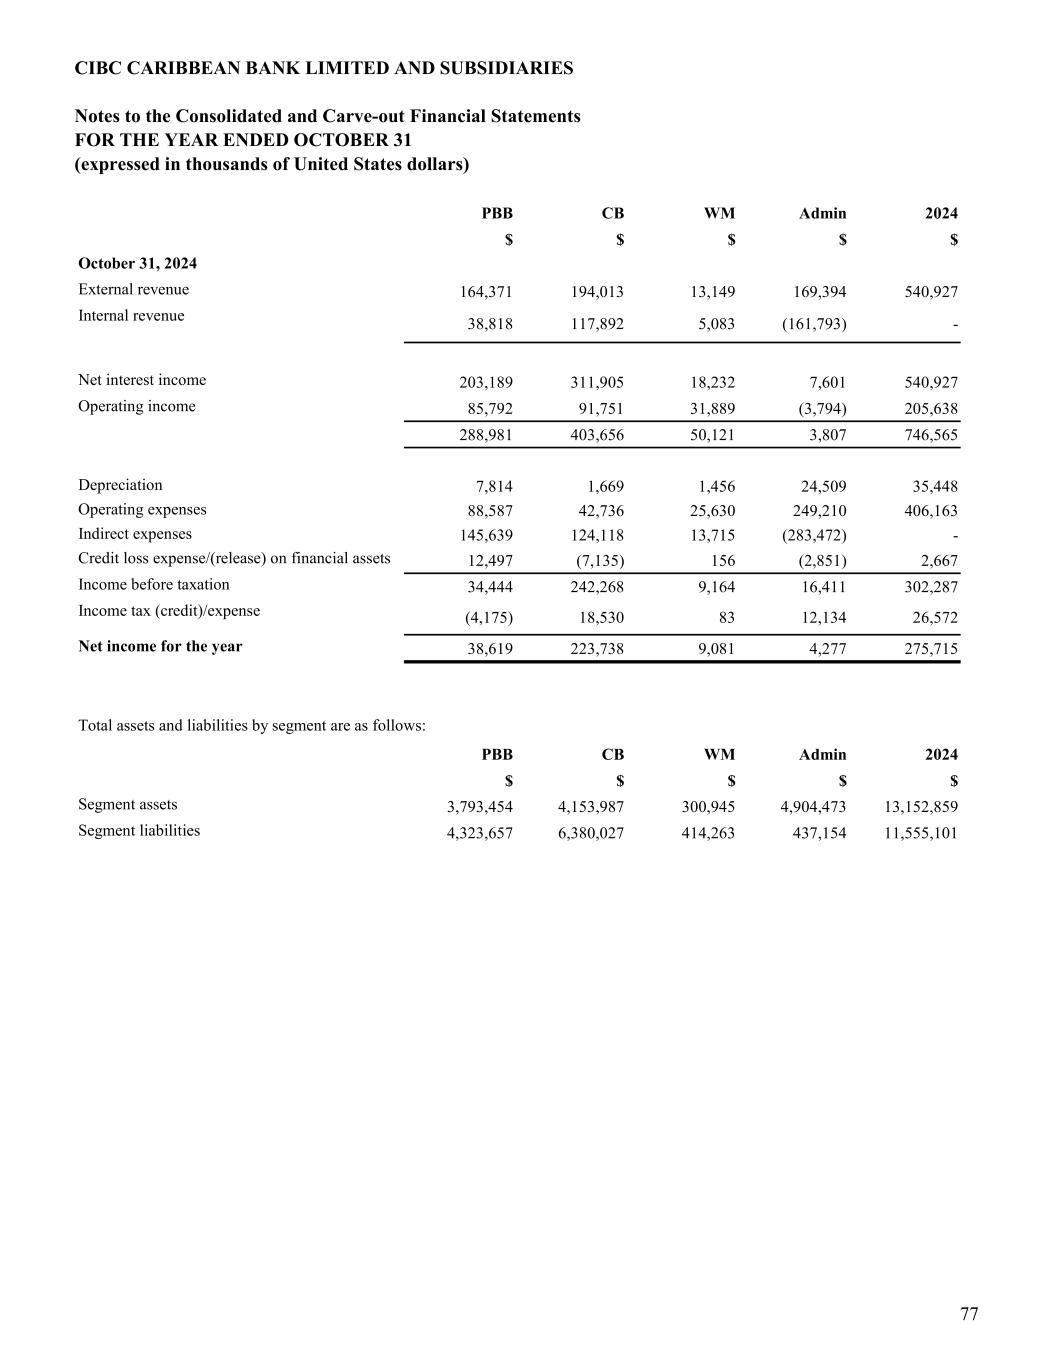
CIBC CARIBBEAN BANK LIMITED AND SUBSIDIARIES Notes to the Consolidated and Carve-out Financial Statements FOR THE YEAR ENDED OCTOBER 31 (expressed in thousands of United States dollars) PBB CB WM Admin 2024 $ $ $ $ $ October 31, 2024 External revenue 164,371 194,013 13,149 169,394 540,927 Internal revenue 38,818 117,892 5,083 (161,793) - Net interest income 203,189 311,905 18,232 7,601 540,927 Operating income 85,792 91,751 31,889 (3,794) 205,638 288,981 403,656 50,121 3,807 746,565 Depreciation 7,814 1,669 1,456 24,509 35,448 Operating expenses 88,587 42,736 25,630 249,210 406,163 Indirect expenses 145,639 124,118 13,715 (283,472) - Credit loss expense/(release) on financial assets 12,497 (7,135) 156 (2,851) 2,667 Income before taxation 34,444 242,268 9,164 16,411 302,287 Income tax (credit)/expense (4,175) 18,530 83 12,134 26,572 Net income for the year 38,619 223,738 9,081 4,277 275,715 PBB CB WM Admin 2024 $ $ $ $ $ Segment assets 3,793,454 4,153,987 300,945 4,904,473 13,152,859 Segment liabilities 4,323,657 6,380,027 414,263 437,154 11,555,101 Total assets and liabilities by segment are as follows: 77
CIBC CARIBBEAN BANK LIMITED AND SUBSIDIARIES Notes to the Consolidated and Carve-out Financial Statements FOR THE YEAR ENDED OCTOBER 31 (expressed in thousands of United States dollars) 31. Risk Management A. Introduction B. Credit risk Process and control Credit risk limits Credit valuation adjustment (CVA) The Risk Committee also has the responsibility for approving credit policies and key risk limits including portfolio limits, which are reviewed annually. Credit risk limits are established for all loans (mortgages, personal, business and sovereign) for the purposes of diversification and managing concentration. Limits are also established for individual borrowers, groups of related borrowers, industry sectors, individual countries and geographic regions and also for products and portfolios. Such risks are monitored on a revolving basis, and the limits are subject to an annual or more frequent review. The exposure to any one counterparty including banks and brokers is further restricted by sub-limits, which include exposures not recognised in the consolidated and carve-out statement of financial position, and daily delivery risk limits in relation to trading items such as forward foreign exchange contracts. Actual exposures against limits are monitored daily. Exposure to credit risk is managed through regular analysis of the ability of borrowers and potential borrowers to meet interest and capital repayment obligations and by changing these lending limits where appropriate. Exposure to credit risk is also managed in part by obtaining collateral including corporate and personal guarantees. A CVA is determined using the fair-value-based exposure we have on derivative contracts. We believe that we have made appropriate fair value adjustments to date. The establishment of fair value adjustments involves estimates that are based on accounting processes and judgements by management. We evaluate the adequacy of the fair value adjustments on an ongoing basis. Market and economic conditions relating to derivative counterparties may change in the future, which could result in significant future losses. The CVA is driven off market-observed credit spreads or proxy credit spreads and our assessment of the net counterparty credit risk exposure. In assessing this exposure, we also take into account credit mitigants such as collateral, master netting arrangements, and settlements through clearing houses. Risk is inherent in the Group’s activities but is managed through a process of ongoing identification, measurement and monitoring, subject to risk limits and other controls. This process of risk management is critical to the Group’s continuing profitability and each individual within the Group is accountable for the risk exposures relating to his or her responsibilities. The Group is exposed to credit risk, liquidity risk, market risk, and operating risk. By its nature, the Group’s activities are principally related to the use of financial instruments. The Group accepts deposits from customers at both fixed and floating rates and for various periods and seeks to earn above-average interest margins by investing these funds in high-quality assets. The Group seeks to increase these margins by consolidating short-term funds and lending for longer periods at higher rates whilst maintaining sufficient liquidity to meet all claims that might fall due. The Group also seeks to raise its interest margins by obtaining above-average margins, net of provisions, through lending to commercial and retail borrowers with a range of credit standings. The Group also enters into guarantees and other commitments such as letters of credit and performance and other bonds. Credit risk primarily arises from lending activities, as well as trading, investment and hedging activities. Credit risk is defined as the risk of financial loss due to a borrower or counterparty failing to meet its obligations in accordance with agreed terms. Financial loss can also occur directly and indirectly through assets used to secure credit facility limits becoming stranded assets. These stranded assets are assets (or collateral) that have suffered material impairment in value and/or write-downs due to environmental reasons, unsustainable practices and/ or otherwise climate-related events/impacts including physical or transition risk, such that the related credit facility is significantly impacted. The Group adopts sound banking principles and robust governance. The Risk Management Team is responsible for the provision of the Group’s adjudication, oversight and management of credit risk within its portfolios. The Credit Executive Committee (CrExCo) contributes to the monitoring of credit metrics and the proactive discussion of credit portfolio related matters. The Risk Management Team is guided by the Group’s Delegation of Authority policy, which is based on the levels of exposure and risk. Credits above the discretion delegated to certain front-line employees are approved by Risk Management, and where applicable, by the Credit Committee and the Risk Committee of the Board. 78

CIBC CARIBBEAN BANK LIMITED AND SUBSIDIARIES Notes to the Consolidated and Carve-out Financial Statements FOR THE YEAR ENDED OCTOBER 31 (expressed in thousands of United States dollars) Collateral Geographic distribution • Mortgages over residential properties; • Charges over business assets such as premises, inventory, accounts receivable and equipment; and • Charges over financial instruments such as debt securities and equities. The Group’s credit risk management policies include requirements relating to collateral valuation and management, including verification requirements and legal certainty. Valuations are updated periodically depending upon the nature of the collateral. Management monitors the market value of collateral and requests additional collateral in accordance with the underlying agreement during its periodic review of loan accounts in arrears. Policies are in place to monitor the existence of undesirable concentration in the collateral supporting the Group’s credit exposure. As at October 31, 2025, 88% of Stage 3 impaired loans were either fully or partially collateralised (2024 - 89%). The following table provides a geographic distribution of gross drawn and undrawn loans and advances to customers, which therefore excludes provisions for impairment, interest receivable and unearned fee income. The Group employs a range of policies and practices to mitigate credit risk. The most traditional of these is the taking of security for funds advanced, which is common practice. The Group implements guidelines on the acceptability of specific classes of collateral or credit risk mitigation. The principal collateral types for loans and advances to customers are: 79
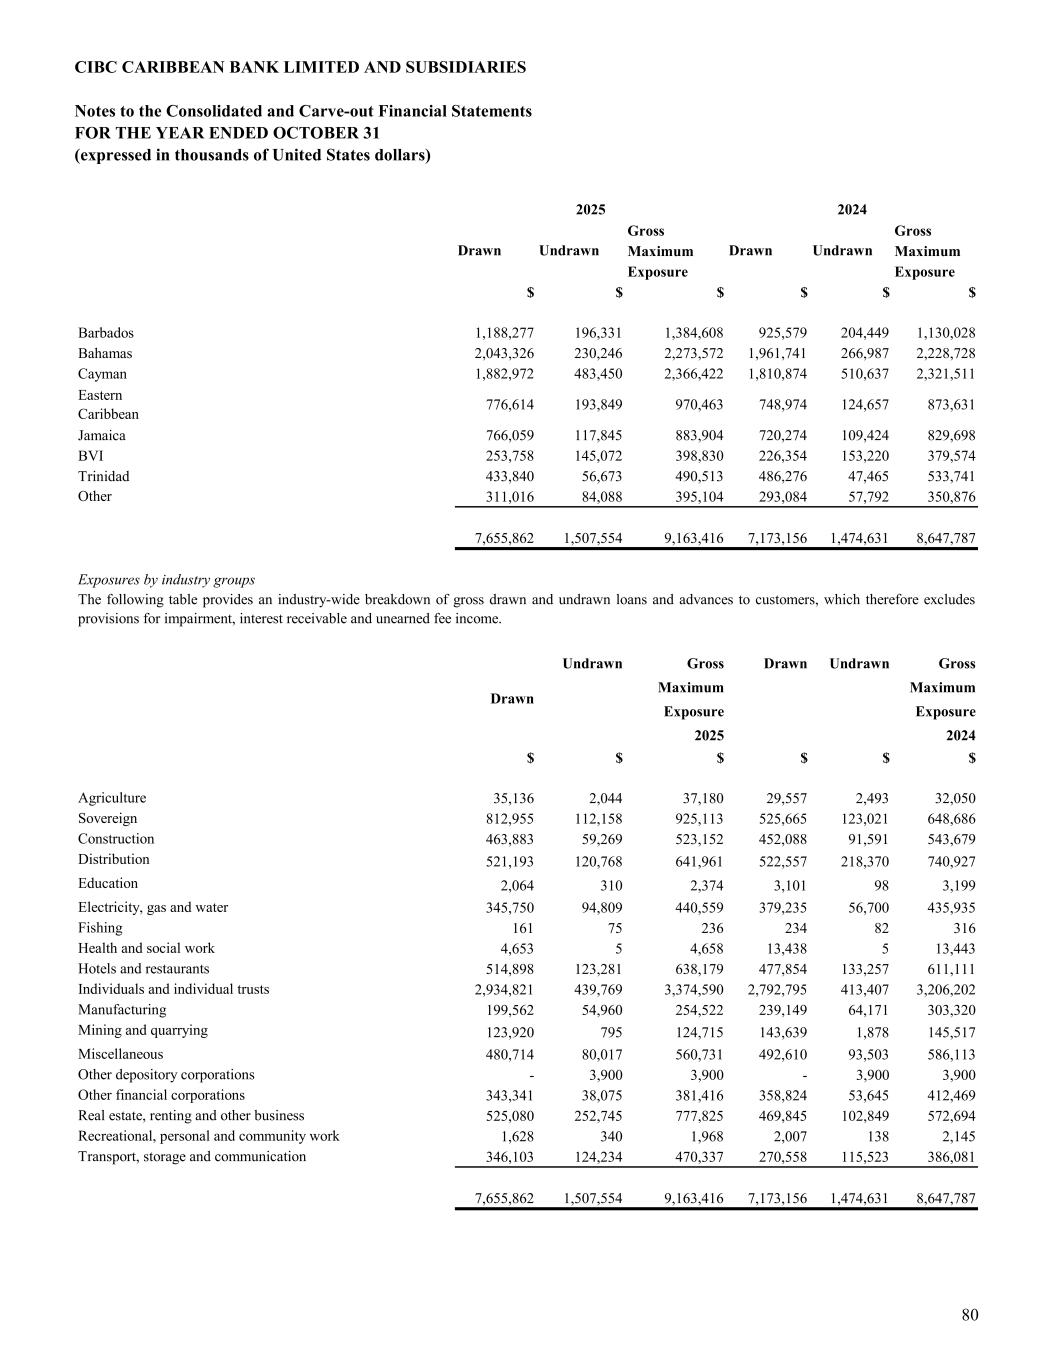
CIBC CARIBBEAN BANK LIMITED AND SUBSIDIARIES Notes to the Consolidated and Carve-out Financial Statements FOR THE YEAR ENDED OCTOBER 31 (expressed in thousands of United States dollars) Gross Gross Maximum Maximum Exposure Exposure $ $ $ $ $ $ Barbados 1,188,277 196,331 1,384,608 925,579 204,449 1,130,028 Bahamas 2,043,326 230,246 2,273,572 1,961,741 266,987 2,228,728 Cayman 1,882,972 483,450 2,366,422 1,810,874 510,637 2,321,511 Eastern Caribbean 776,614 193,849 970,463 748,974 124,657 873,631 Jamaica 766,059 117,845 883,904 720,274 109,424 829,698 BVI 253,758 145,072 398,830 226,354 153,220 379,574 Trinidad 433,840 56,673 490,513 486,276 47,465 533,741 311,016 84,088 395,104 293,084 57,792 350,876 7,655,862 1,507,554 9,163,416 7,173,156 1,474,631 8,647,787 Exposures by industry groups Undrawn Gross Drawn Undrawn Gross Maximum Maximum Exposure Exposure 2025 2024 $ $ $ $ $ $ 35,136 2,044 37,180 29,557 2,493 32,050 812,955 112,158 925,113 525,665 123,021 648,686 463,883 59,269 523,152 452,088 91,591 543,679 521,193 120,768 641,961 522,557 218,370 740,927 Education 2,064 310 2,374 3,101 98 3,199 345,750 94,809 440,559 379,235 56,700 435,935 161 75 236 234 82 316 4,653 5 4,658 13,438 5 13,443 514,898 123,281 638,179 477,854 133,257 611,111 2,934,821 439,769 3,374,590 2,792,795 413,407 3,206,202 199,562 54,960 254,522 239,149 64,171 303,320 123,920 795 124,715 143,639 1,878 145,517 480,714 80,017 560,731 492,610 93,503 586,113 - 3,900 3,900 - 3,900 3,900 Other financial corporations 343,341 38,075 381,416 358,824 53,645 412,469 525,080 252,745 777,825 469,845 102,849 572,694 1,628 340 1,968 2,007 138 2,145 346,103 124,234 470,337 270,558 115,523 386,081 7,655,862 1,507,554 9,163,416 7,173,156 1,474,631 8,647,787 Recreational, personal and community work Transport, storage and communication Individuals and individual trusts Manufacturing Mining and quarrying Miscellaneous Other depository corporations Real estate, renting and other business Construction Distribution Electricity, gas and water Fishing Health and social work Hotels and restaurants Other The following table provides an industry-wide breakdown of gross drawn and undrawn loans and advances to customers, which therefore excludes provisions for impairment, interest receivable and unearned fee income. Drawn Agriculture Sovereign 2025 2024 Drawn Undrawn Drawn Undrawn 80
CIBC CARIBBEAN BANK LIMITED AND SUBSIDIARIES Notes to the Consolidated and Carve-out Financial Statements FOR THE YEAR ENDED OCTOBER 31 (expressed in thousands of United States dollars) Derivatives Master netting arrangements Credit related instruments Maximum exposure to credit risk Commitments to extend credit represent the unused portions of authorisations to extend credit in the form of loans, guarantees or letters of credit. With respect to credit risk on commitments to extend credit, the Group is potentially exposed to loss in an amount equal to the total unused commitments. However, the likely amount of loss is less than the total unused commitments since most commitments to extend credit are contingent upon customers maintaining specific credit standards. The Group monitors the term of maturity of credit commitments because longer-term commitments generally have a greater degree of credit risk than shorter-term commitments. The following table shows the maximum exposure to credit risk for the components of the consolidated and carve-out statement of financial position. The maximum exposure is shown gross, before the effect of mitigation through the use of master netting and collateral arrangements. Where financial instruments are recorded at fair value, the amounts shown represent the current credit risk exposure but not the maximum risk exposure that could arise in the future as a result of changes in values. The Group maintains strict control limits on net open derivative positions, that is, the difference between purchase and sale contracts, by both amount and term. At any one time the amount subject to credit risk is limited to the current fair value of instruments that are favourable to the Group (i.e. assets), which in relation to derivatives is only a small fraction of the contract or notional values used to express the volume of instruments outstanding. This credit risk exposure is managed as part of the overall lending limits with customers, together with potential exposures from market movements. Collateral or other security is usually obtained for credit risk exposures on these instruments. The Group restricts its exposure to credit losses by entering into master-netting arrangements with counterparties with whom it undertakes a significant volume of transactions. Master-netting arrangements do not generally result in an offset of consolidated and carve-out statement of financial position assets and liabilities, as transactions are usually settled on a gross basis. However, the credit risk associated with favourable contracts is reduced by a master-netting arrangement to the extent that if an event of default occurs, all amounts with the counterparty are terminated and settled on a net basis. The Group’s overall exposure to credit risk on derivative instruments subject to master-netting arrangements can change substantially within a short period since it is affected by each transaction subject to the arrangement. The primary purpose of these instruments is to ensure that funds are available to a customer as required. Guarantees and standby letters of credit, which represent irrevocable assurances that the Group will make payments in the event that a customer cannot meet its obligations to third parties, carry the same credit risk as loans. Documentary and commercial letters of credit, which are written undertakings by the Group on behalf of a customer authorising a third party to draw drafts on the Group up to a stipulated amount under specific terms and conditions, are collateralised by the underlying shipments of goods or appropriate assets to which they relate and therefore carry less risk than a direct borrowing. 81
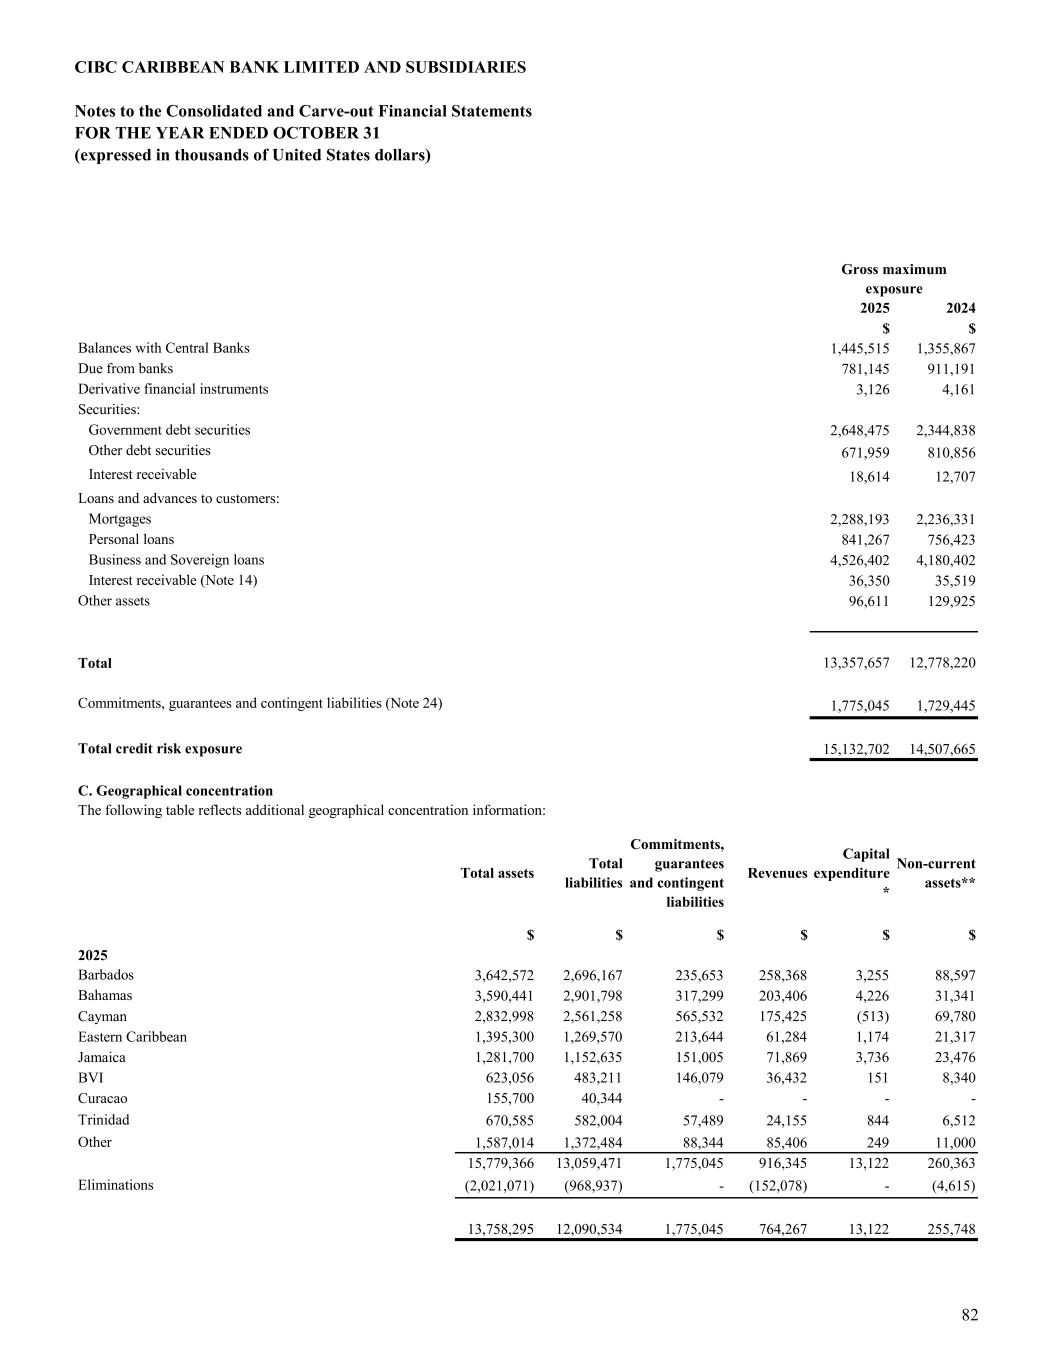
CIBC CARIBBEAN BANK LIMITED AND SUBSIDIARIES Notes to the Consolidated and Carve-out Financial Statements FOR THE YEAR ENDED OCTOBER 31 (expressed in thousands of United States dollars) 2025 2024 $ $ 1,445,515 1,355,867 781,145 911,191 3,126 4,161 2,648,475 2,344,838 671,959 810,856 18,614 12,707 2,288,193 2,236,331 841,267 756,423 4,526,402 4,180,402 36,350 35,519 96,611 129,925 Total 13,357,657 12,778,220 1,775,045 1,729,445 15,132,702 14,507,665 C. Geographical concentration Total assets Total liabilities Commitments, guarantees and contingent liabilities Revenues Capital expenditure * Non-current assets** $ $ $ $ $ $ 2025 3,642,572 2,696,167 235,653 258,368 3,255 88,597 3,590,441 2,901,798 317,299 203,406 4,226 31,341 Cayman 2,832,998 2,561,258 565,532 175,425 (513) 69,780 Eastern Caribbean 1,395,300 1,269,570 213,644 61,284 1,174 21,317 Jamaica 1,281,700 1,152,635 151,005 71,869 3,736 23,476 BVI 623,056 483,211 146,079 36,432 151 8,340 Curacao 155,700 40,344 - - - - 670,585 582,004 57,489 24,155 844 6,512 1,587,014 1,372,484 88,344 85,406 249 11,000 15,779,366 13,059,471 1,775,045 916,345 13,122 260,363 (2,021,071) (968,937) - (152,078) - (4,615) 13,758,295 12,090,534 1,775,045 764,267 13,122 255,748 The following table reflects additional geographical concentration information: Barbados Bahamas Trinidad Other Eliminations Personal loans Business and Sovereign loans Interest receivable (Note 14) Other assets Commitments, guarantees and contingent liabilities (Note 24) Total credit risk exposure Securities: Government debt securities Other debt securities Interest receivable Loans and advances to customers: Mortgages Gross maximum exposure Balances with Central Banks Due from banks Derivative financial instruments 82
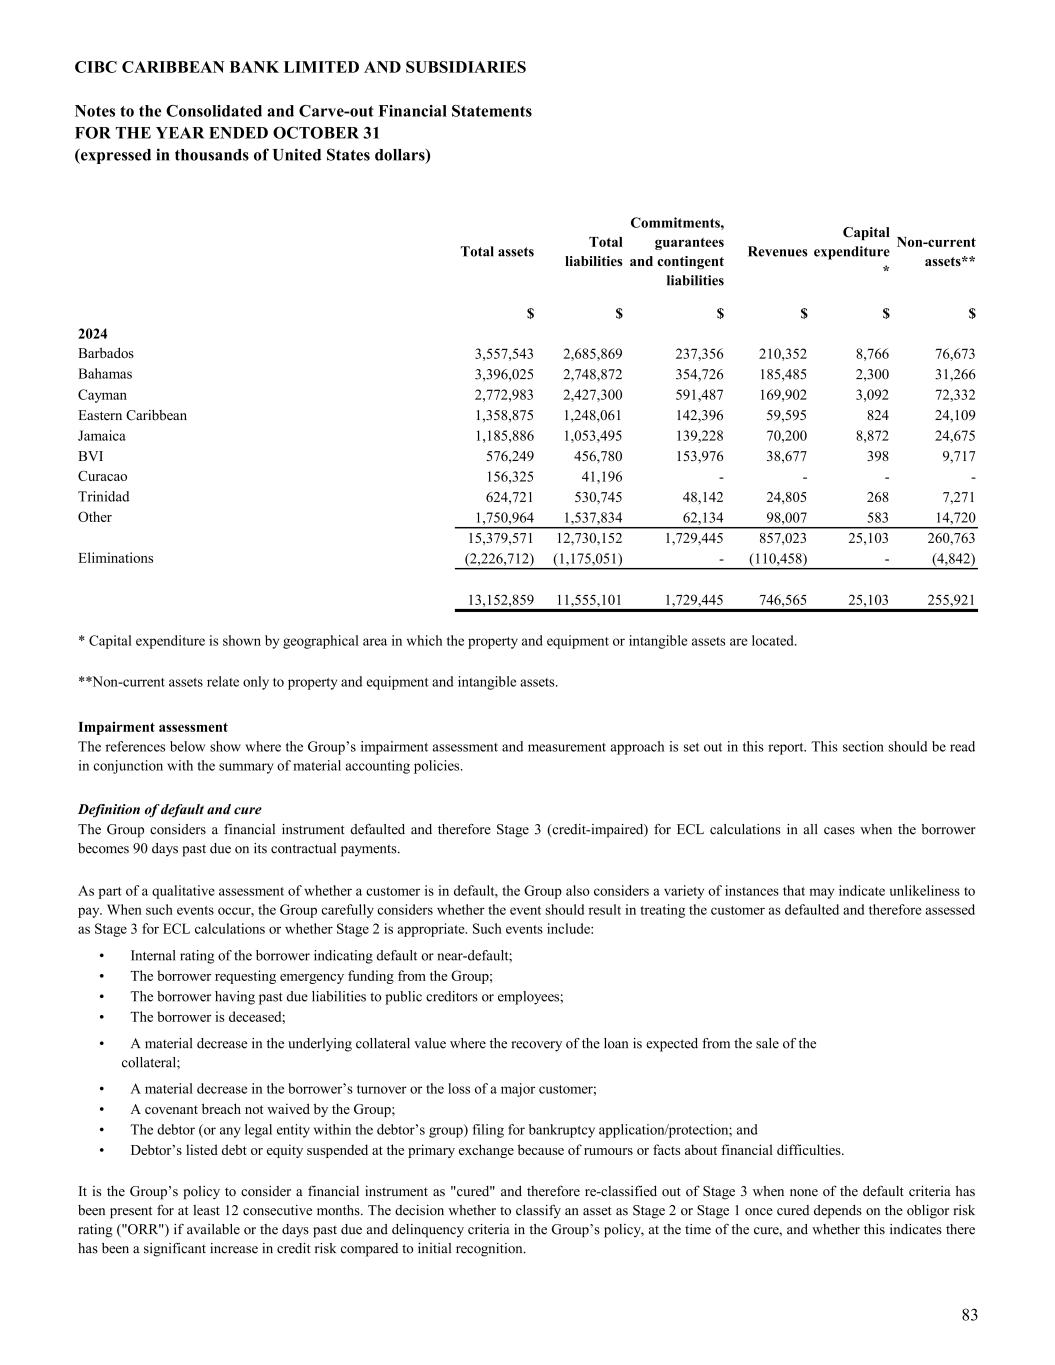
CIBC CARIBBEAN BANK LIMITED AND SUBSIDIARIES Notes to the Consolidated and Carve-out Financial Statements FOR THE YEAR ENDED OCTOBER 31 (expressed in thousands of United States dollars) Total assets Total liabilities Commitments, guarantees and contingent liabilities Revenues Capital expenditure * Non-current assets** $ $ $ $ $ $ 2024 3,557,543 2,685,869 237,356 210,352 8,766 76,673 3,396,025 2,748,872 354,726 185,485 2,300 31,266 Cayman 2,772,983 2,427,300 591,487 169,902 3,092 72,332 Eastern Caribbean 1,358,875 1,248,061 142,396 59,595 824 24,109 Jamaica 1,185,886 1,053,495 139,228 70,200 8,872 24,675 BVI 576,249 456,780 153,976 38,677 398 9,717 156,325 41,196 - - - - 624,721 530,745 48,142 24,805 268 7,271 1,750,964 1,537,834 62,134 98,007 583 14,720 15,379,571 12,730,152 1,729,445 857,023 25,103 260,763 (2,226,712) (1,175,051) - (110,458) - (4,842) 13,152,859 11,555,101 1,729,445 746,565 25,103 255,921 Impairment assessment Definition of default and cure • A material decrease in the borrower’s turnover or the loss of a major customer; • A covenant breach not waived by the Group; • The debtor (or any legal entity within the debtor’s group) filing for bankruptcy application/protection; and • Debtor’s listed debt or equity suspended at the primary exchange because of rumours or facts about financial difficulties. It is the Group’s policy to consider a financial instrument as "cured" and therefore re-classified out of Stage 3 when none of the default criteria has been present for at least 12 consecutive months. The decision whether to classify an asset as Stage 2 or Stage 1 once cured depends on the obligor risk rating ("ORR") if available or the days past due and delinquency criteria in the Group’s policy, at the time of the cure, and whether this indicates there has been a significant increase in credit risk compared to initial recognition. As part of a qualitative assessment of whether a customer is in default, the Group also considers a variety of instances that may indicate unlikeliness to pay. When such events occur, the Group carefully considers whether the event should result in treating the customer as defaulted and therefore assessed as Stage 3 for ECL calculations or whether Stage 2 is appropriate. Such events include: • Internal rating of the borrower indicating default or near-default; • The borrower requesting emergency funding from the Group; • The borrower having past due liabilities to public creditors or employees; • The borrower is deceased; • A material decrease in the underlying collateral value where the recovery of the loan is expected from the sale of the collateral; * Capital expenditure is shown by geographical area in which the property and equipment or intangible assets are located. **Non-current assets relate only to property and equipment and intangible assets. The references below show where the Group’s impairment assessment and measurement approach is set out in this report. This section should be read in conjunction with the summary of material accounting policies. The Group considers a financial instrument defaulted and therefore Stage 3 (credit-impaired) for ECL calculations in all cases when the borrower becomes 90 days past due on its contractual payments. Barbados Bahamas Curacao Trinidad Other Eliminations 83
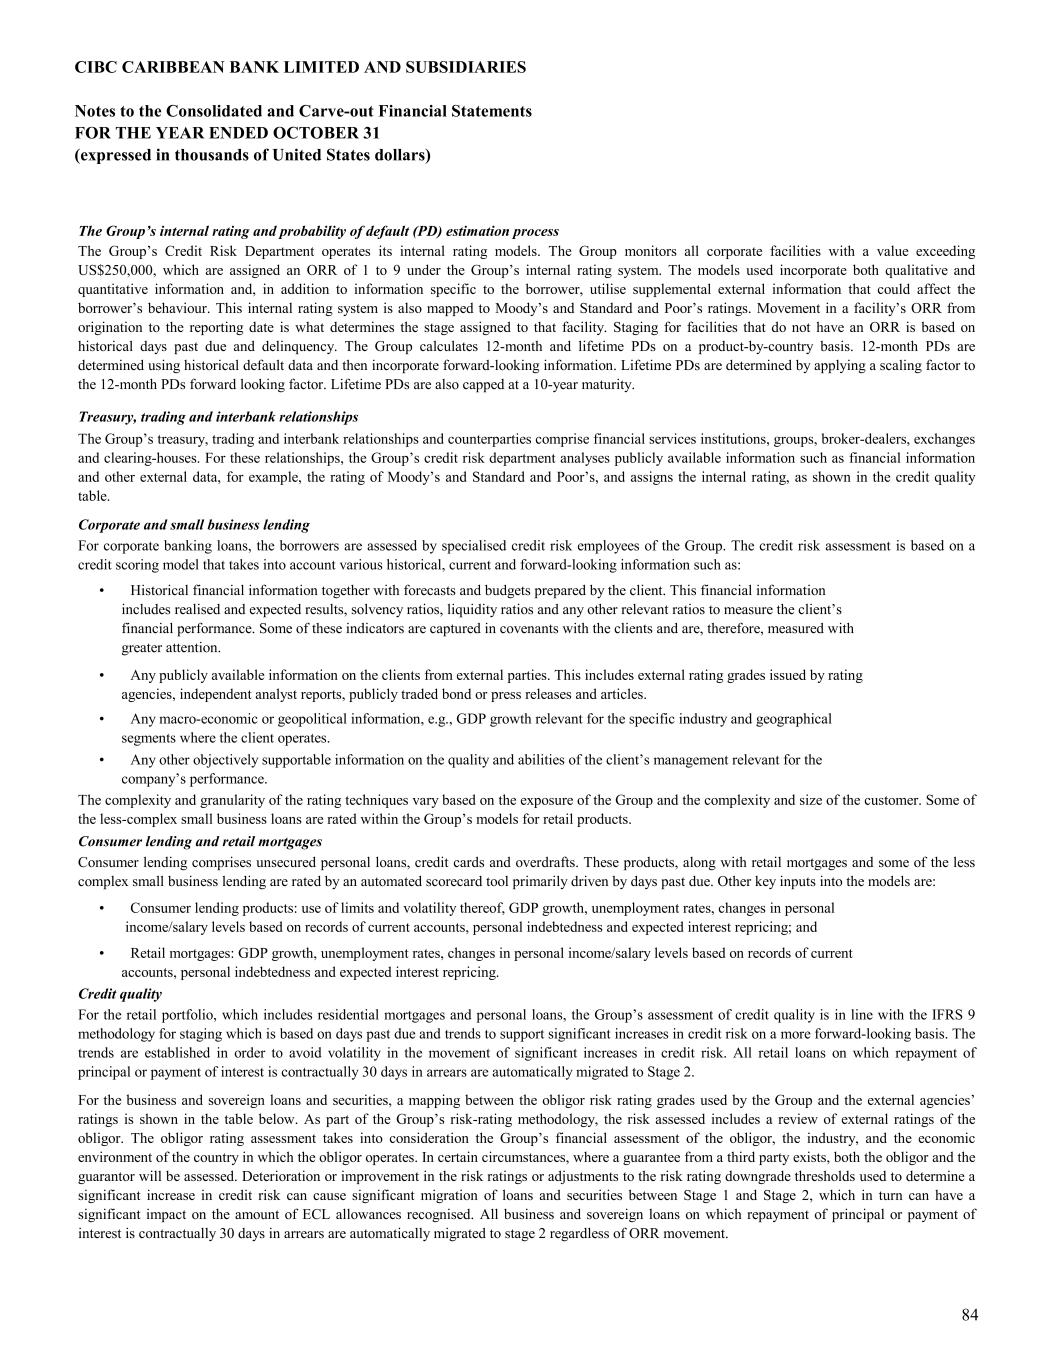
CIBC CARIBBEAN BANK LIMITED AND SUBSIDIARIES Notes to the Consolidated and Carve-out Financial Statements FOR THE YEAR ENDED OCTOBER 31 (expressed in thousands of United States dollars) The Group’s internal rating and probability of default (PD) estimation process • Retail mortgages: GDP growth, unemployment rates, changes in personal income/salary levels based on records of current accounts, personal indebtedness and expected interest repricing. Credit quality For the retail portfolio, which includes residential mortgages and personal loans, the Group’s assessment of credit quality is in line with the IFRS 9 methodology for staging which is based on days past due and trends to support significant increases in credit risk on a more forward-looking basis. The trends are established in order to avoid volatility in the movement of significant increases in credit risk. All retail loans on which repayment of principal or payment of interest is contractually 30 days in arrears are automatically migrated to Stage 2. For the business and sovereign loans and securities, a mapping between the obligor risk rating grades used by the Group and the external agencies’ ratings is shown in the table below. As part of the Group’s risk-rating methodology, the risk assessed includes a review of external ratings of the obligor. The obligor rating assessment takes into consideration the Group’s financial assessment of the obligor, the industry, and the economic environment of the country in which the obligor operates. In certain circumstances, where a guarantee from a third party exists, both the obligor and the guarantor will be assessed. Deterioration or improvement in the risk ratings or adjustments to the risk rating downgrade thresholds used to determine a significant increase in credit risk can cause significant migration of loans and securities between Stage 1 and Stage 2, which in turn can have a significant impact on the amount of ECL allowances recognised. All business and sovereign loans on which repayment of principal or payment of interest is contractually 30 days in arrears are automatically migrated to stage 2 regardless of ORR movement. • Any macro-economic or geopolitical information, e.g., GDP growth relevant for the specific industry and geographical segments where the client operates. • Any other objectively supportable information on the quality and abilities of the client’s management relevant for the company’s performance. The complexity and granularity of the rating techniques vary based on the exposure of the Group and the complexity and size of the customer. Some of the less-complex small business loans are rated within the Group’s models for retail products. Consumer lending and retail mortgages Consumer lending comprises unsecured personal loans, credit cards and overdrafts. These products, along with retail mortgages and some of the less complex small business lending are rated by an automated scorecard tool primarily driven by days past due. Other key inputs into the models are: • Consumer lending products: use of limits and volatility thereof, GDP growth, unemployment rates, changes in personal income/salary levels based on records of current accounts, personal indebtedness and expected interest repricing; and Treasury, trading and interbank relationships The Group’s treasury, trading and interbank relationships and counterparties comprise financial services institutions, groups, broker-dealers, exchanges and clearing-houses. For these relationships, the Group’s credit risk department analyses publicly available information such as financial information and other external data, for example, the rating of Moody’s and Standard and Poor’s, and assigns the internal rating, as shown in the credit quality table. Corporate and small business lending For corporate banking loans, the borrowers are assessed by specialised credit risk employees of the Group. The credit risk assessment is based on a credit scoring model that takes into account various historical, current and forward-looking information such as: • Historical financial information together with forecasts and budgets prepared by the client. This financial information includes realised and expected results, solvency ratios, liquidity ratios and any other relevant ratios to measure the client’s financial performance. Some of these indicators are captured in covenants with the clients and are, therefore, measured with greater attention. • Any publicly available information on the clients from external parties. This includes external rating grades issued by rating agencies, independent analyst reports, publicly traded bond or press releases and articles. The Group’s Credit Risk Department operates its internal rating models. The Group monitors all corporate facilities with a value exceeding US$250,000, which are assigned an ORR of 1 to 9 under the Group’s internal rating system. The models used incorporate both qualitative and quantitative information and, in addition to information specific to the borrower, utilise supplemental external information that could affect the borrower’s behaviour. This internal rating system is also mapped to Moody’s and Standard and Poor’s ratings. Movement in a facility’s ORR from origination to the reporting date is what determines the stage assigned to that facility. Staging for facilities that do not have an ORR is based on historical days past due and delinquency. The Group calculates 12-month and lifetime PDs on a product-by-country basis. 12-month PDs are determined using historical default data and then incorporate forward-looking information. Lifetime PDs are determined by applying a scaling factor to the 12-month PDs forward looking factor. Lifetime PDs are also capped at a 10-year maturity. 84
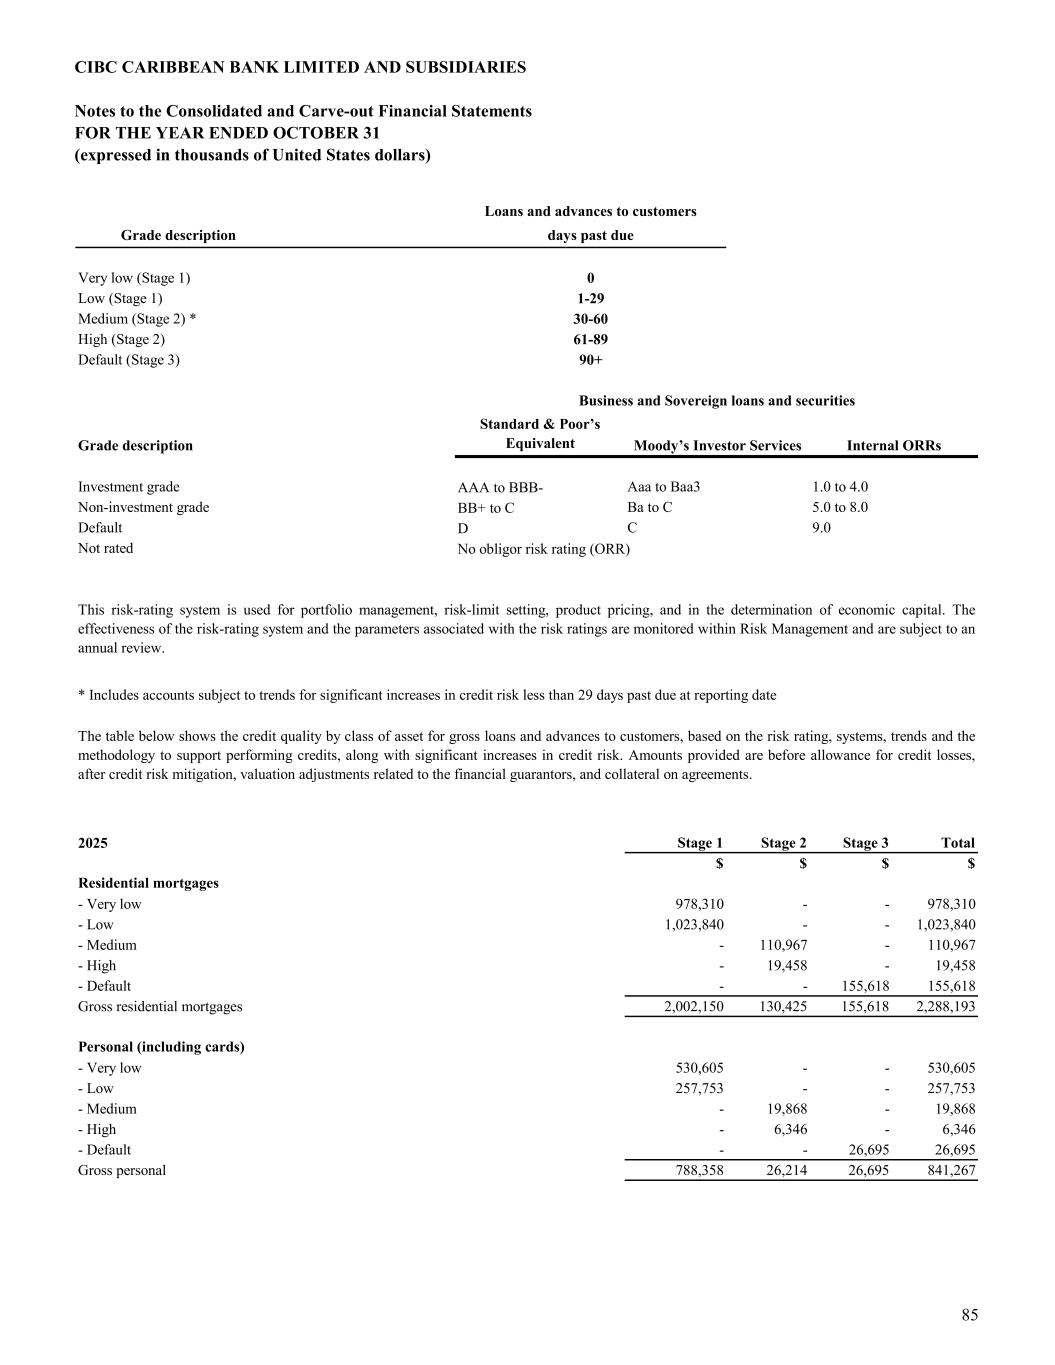
CIBC CARIBBEAN BANK LIMITED AND SUBSIDIARIES Notes to the Consolidated and Carve-out Financial Statements FOR THE YEAR ENDED OCTOBER 31 (expressed in thousands of United States dollars) AAA to BBB- BB+ to C D No obligor risk rating (ORR) 2025 Stage 1 Stage 2 Stage 3 Total $ $ $ $ - Very low 978,310 - - 978,310 - Low 1,023,840 - - 1,023,840 - Medium - 110,967 - 110,967 - High - 19,458 - 19,458 - Default - - 155,618 155,618 Gross residential mortgages 2,002,150 130,425 155,618 2,288,193 - Very low 530,605 - - 530,605 - Low 257,753 - - 257,753 - Medium - 19,868 - 19,868 - High - 6,346 - 6,346 - Default - - 26,695 26,695 Gross personal 788,358 26,214 26,695 841,267 The table below shows the credit quality by class of asset for gross loans and advances to customers, based on the risk rating, systems, trends and the methodology to support performing credits, along with significant increases in credit risk. Amounts provided are before allowance for credit losses, after credit risk mitigation, valuation adjustments related to the financial guarantors, and collateral on agreements. Residential mortgages Personal (including cards) Default C 9.0 Not rated This risk-rating system is used for portfolio management, risk-limit setting, product pricing, and in the determination of economic capital. The effectiveness of the risk-rating system and the parameters associated with the risk ratings are monitored within Risk Management and are subject to an annual review. * Includes accounts subject to trends for significant increases in credit risk less than 29 days past due at reporting date Investment grade Aaa to Baa3 1.0 to 4.0 Non-investment grade Ba to C 5.0 to 8.0 High (Stage 2) 61-89 Default (Stage 3) 90+ Business and Sovereign loans and securities Standard & Poor’s EquivalentGrade description Moody’s Investor Services Internal ORRs Very low (Stage 1) 0 Low (Stage 1) 1-29 Medium (Stage 2) * 30-60 Loans and advances to customers Grade description days past due 85
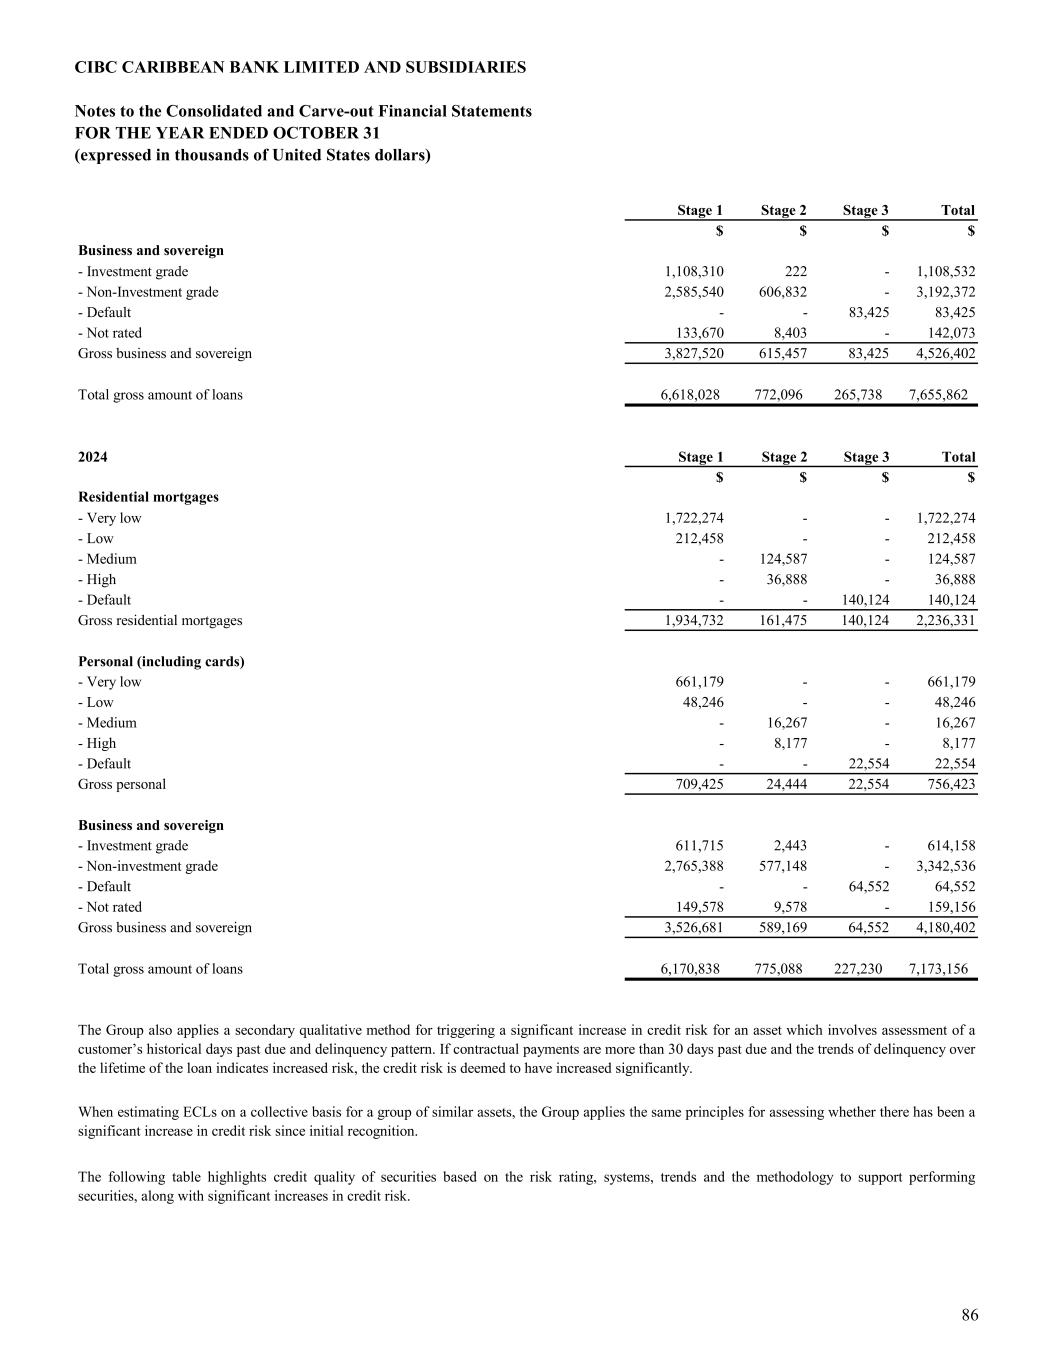
CIBC CARIBBEAN BANK LIMITED AND SUBSIDIARIES Notes to the Consolidated and Carve-out Financial Statements FOR THE YEAR ENDED OCTOBER 31 (expressed in thousands of United States dollars) Stage 1 Stage 2 Stage 3 Total $ $ $ $ - Investment grade 1,108,310 222 - 1,108,532 - Non-Investment grade 2,585,540 606,832 - 3,192,372 - Default - - 83,425 83,425 - Not rated 133,670 8,403 - 142,073 Gross business and sovereign 3,827,520 615,457 83,425 4,526,402 Total gross amount of loans 6,618,028 772,096 265,738 7,655,862 2024 Stage 1 Stage 2 Stage 3 Total $ $ $ $ - Very low 1,722,274 - - 1,722,274 - Low 212,458 - - 212,458 - Medium - 124,587 - 124,587 - High - 36,888 - 36,888 - Default - - 140,124 140,124 Gross residential mortgages 1,934,732 161,475 140,124 2,236,331 Personal (including cards) - Very low 661,179 - - 661,179 - Low 48,246 - - 48,246 - Medium - 16,267 - 16,267 - High - 8,177 - 8,177 - Default - - 22,554 22,554 Gross personal 709,425 24,444 22,554 756,423 Business and sovereign - Investment grade 611,715 2,443 - 614,158 - Non-investment grade 2,765,388 577,148 - 3,342,536 - Default - - 64,552 64,552 - Not rated 149,578 9,578 - 159,156 Gross business and sovereign 3,526,681 589,169 64,552 4,180,402 Total gross amount of loans 6,170,838 775,088 227,230 7,173,156 The Group also applies a secondary qualitative method for triggering a significant increase in credit risk for an asset which involves assessment of a customer’s historical days past due and delinquency pattern. If contractual payments are more than 30 days past due and the trends of delinquency over the lifetime of the loan indicates increased risk, the credit risk is deemed to have increased significantly. When estimating ECLs on a collective basis for a group of similar assets, the Group applies the same principles for assessing whether there has been a significant increase in credit risk since initial recognition. The following table highlights credit quality of securities based on the risk rating, systems, trends and the methodology to support performing securities, along with significant increases in credit risk. Residential mortgages Business and sovereign 86
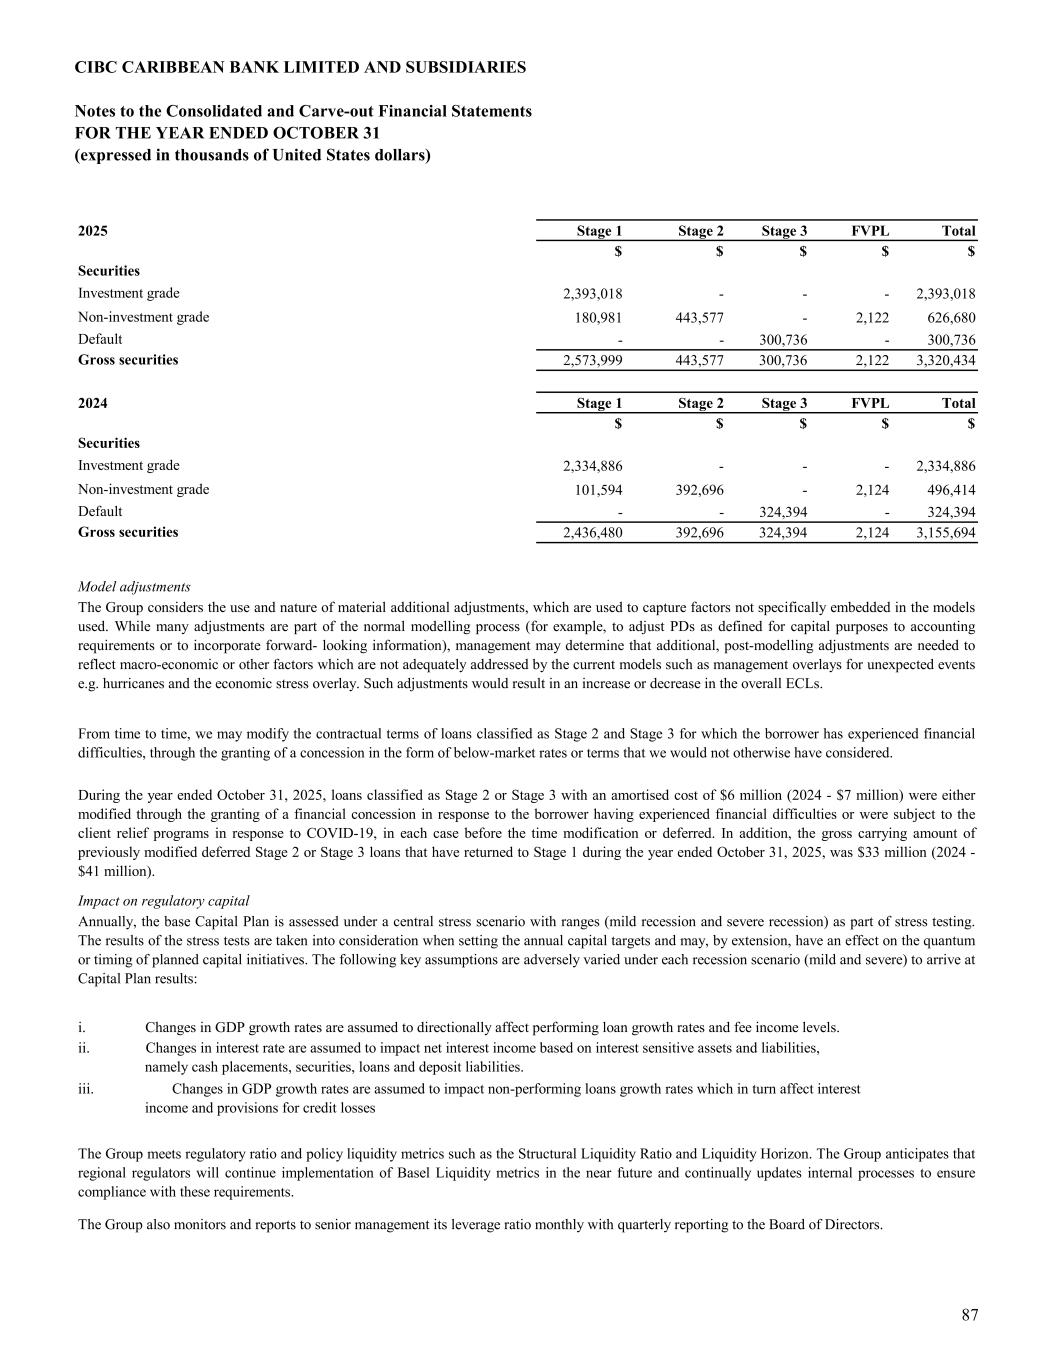
CIBC CARIBBEAN BANK LIMITED AND SUBSIDIARIES Notes to the Consolidated and Carve-out Financial Statements FOR THE YEAR ENDED OCTOBER 31 (expressed in thousands of United States dollars) 2025 Stage 1 Stage 2 Stage 3 FVPL Total $ $ $ $ $ 2,393,018 - - - 2,393,018 180,981 443,577 - 2,122 626,680 - - 300,736 - 300,736 2,573,999 443,577 300,736 2,122 3,320,434 2024 Stage 1 Stage 2 Stage 3 FVPL Total $ $ $ $ $ 2,334,886 - - - 2,334,886 101,594 392,696 - 2,124 496,414 - - 324,394 - 324,394 2,436,480 392,696 324,394 2,124 3,155,694 The Group meets regulatory ratio and policy liquidity metrics such as the Structural Liquidity Ratio and Liquidity Horizon. The Group anticipates that regional regulators will continue implementation of Basel Liquidity metrics in the near future and continually updates internal processes to ensure compliance with these requirements. The Group also monitors and reports to senior management its leverage ratio monthly with quarterly reporting to the Board of Directors. During the year ended October 31, 2025, loans classified as Stage 2 or Stage 3 with an amortised cost of $6 million (2024 - $7 million) were either modified through the granting of a financial concession in response to the borrower having experienced financial difficulties or were subject to the client relief programs in response to COVID-19, in each case before the time modification or deferred. In addition, the gross carrying amount of previously modified deferred Stage 2 or Stage 3 loans that have returned to Stage 1 during the year ended October 31, 2025, was $33 million (2024 - $41 million). Impact on regulatory capital Annually, the base Capital Plan is assessed under a central stress scenario with ranges (mild recession and severe recession) as part of stress testing. The results of the stress tests are taken into consideration when setting the annual capital targets and may, by extension, have an effect on the quantum or timing of planned capital initiatives. The following key assumptions are adversely varied under each recession scenario (mild and severe) to arrive at Capital Plan results: i. Changes in GDP growth rates are assumed to directionally affect performing loan growth rates and fee income levels. ii. Changes in interest rate are assumed to impact net interest income based on interest sensitive assets and liabilities, namely cash placements, securities, loans and deposit liabilities. iii. Changes in GDP growth rates are assumed to impact non-performing loans growth rates which in turn affect interest income and provisions for credit losses Non-investment grade Default Gross securities Model adjustments The Group considers the use and nature of material additional adjustments, which are used to capture factors not specifically embedded in the models used. While many adjustments are part of the normal modelling process (for example, to adjust PDs as defined for capital purposes to accounting requirements or to incorporate forward- looking information), management may determine that additional, post-modelling adjustments are needed to reflect macro-economic or other factors which are not adequately addressed by the current models such as management overlays for unexpected events e.g. hurricanes and the economic stress overlay. Such adjustments would result in an increase or decrease in the overall ECLs. From time to time, we may modify the contractual terms of loans classified as Stage 2 and Stage 3 for which the borrower has experienced financial difficulties, through the granting of a concession in the form of below-market rates or terms that we would not otherwise have considered. Investment grade Non-investment grade Default Gross securities Securities Investment grade Securities 87
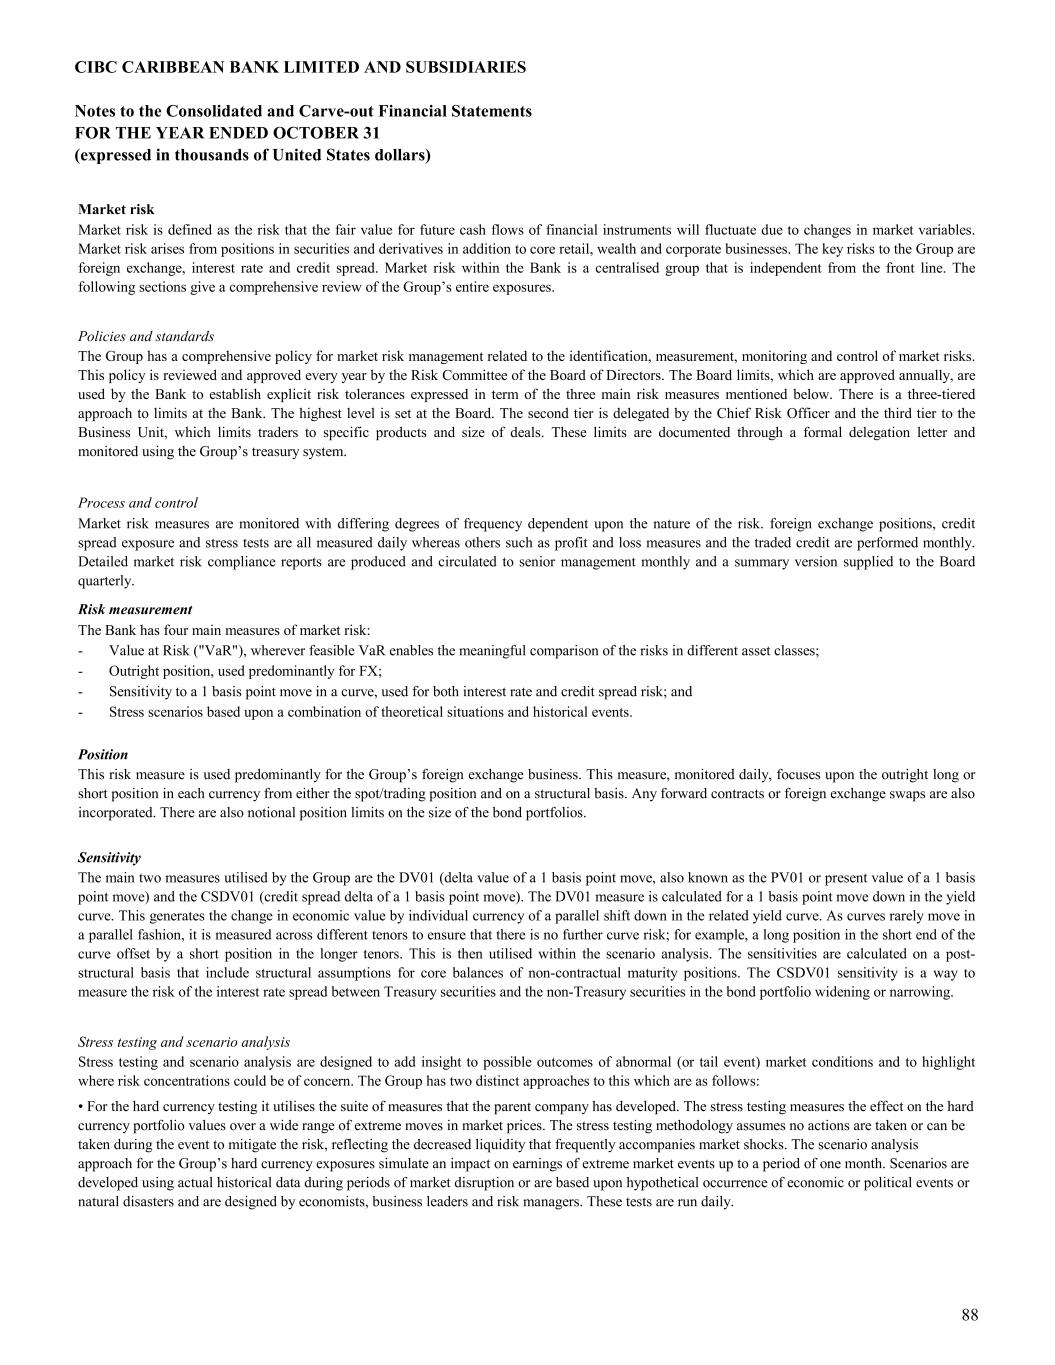
CIBC CARIBBEAN BANK LIMITED AND SUBSIDIARIES Notes to the Consolidated and Carve-out Financial Statements FOR THE YEAR ENDED OCTOBER 31 (expressed in thousands of United States dollars) Policies and standards Position Sensitivity Stress testing and scenario analysis • For the hard currency testing it utilises the suite of measures that the parent company has developed. The stress testing measures the effect on the hard currency portfolio values over a wide range of extreme moves in market prices. The stress testing methodology assumes no actions are taken or can be taken during the event to mitigate the risk, reflecting the decreased liquidity that frequently accompanies market shocks. The scenario analysis approach for the Group’s hard currency exposures simulate an impact on earnings of extreme market events up to a period of one month. Scenarios are developed using actual historical data during periods of market disruption or are based upon hypothetical occurrence of economic or political events or natural disasters and are designed by economists, business leaders and risk managers. These tests are run daily. - Outright position, used predominantly for FX; - Sensitivity to a 1 basis point move in a curve, used for both interest rate and credit spread risk; and - Stress scenarios based upon a combination of theoretical situations and historical events. This risk measure is used predominantly for the Group’s foreign exchange business. This measure, monitored daily, focuses upon the outright long or short position in each currency from either the spot/trading position and on a structural basis. Any forward contracts or foreign exchange swaps are also incorporated. There are also notional position limits on the size of the bond portfolios. The main two measures utilised by the Group are the DV01 (delta value of a 1 basis point move, also known as the PV01 or present value of a 1 basis point move) and the CSDV01 (credit spread delta of a 1 basis point move). The DV01 measure is calculated for a 1 basis point move down in the yield curve. This generates the change in economic value by individual currency of a parallel shift down in the related yield curve. As curves rarely move in a parallel fashion, it is measured across different tenors to ensure that there is no further curve risk; for example, a long position in the short end of the curve offset by a short position in the longer tenors. This is then utilised within the scenario analysis. The sensitivities are calculated on a post- structural basis that include structural assumptions for core balances of non-contractual maturity positions. The CSDV01 sensitivity is a way to measure the risk of the interest rate spread between Treasury securities and the non-Treasury securities in the bond portfolio widening or narrowing. Stress testing and scenario analysis are designed to add insight to possible outcomes of abnormal (or tail event) market conditions and to highlight where risk concentrations could be of concern. The Group has two distinct approaches to this which are as follows: The Group has a comprehensive policy for market risk management related to the identification, measurement, monitoring and control of market risks. This policy is reviewed and approved every year by the Risk Committee of the Board of Directors. The Board limits, which are approved annually, are used by the Bank to establish explicit risk tolerances expressed in term of the three main risk measures mentioned below. There is a three-tiered approach to limits at the Bank. The highest level is set at the Board. The second tier is delegated by the Chief Risk Officer and the third tier to the Business Unit, which limits traders to specific products and size of deals. These limits are documented through a formal delegation letter and monitored using the Group’s treasury system. Process and control Market risk measures are monitored with differing degrees of frequency dependent upon the nature of the risk. foreign exchange positions, credit spread exposure and stress tests are all measured daily whereas others such as profit and loss measures and the traded credit are performed monthly. Detailed market risk compliance reports are produced and circulated to senior management monthly and a summary version supplied to the Board quarterly. Risk measurement The Bank has four main measures of market risk: - Value at Risk ("VaR"), wherever feasible VaR enables the meaningful comparison of the risks in different asset classes; Market risk Market risk is defined as the risk that the fair value for future cash flows of financial instruments will fluctuate due to changes in market variables. Market risk arises from positions in securities and derivatives in addition to core retail, wealth and corporate businesses. The key risks to the Group are foreign exchange, interest rate and credit spread. Market risk within the Bank is a centralised group that is independent from the front line. The following sections give a comprehensive review of the Group’s entire exposures. 88
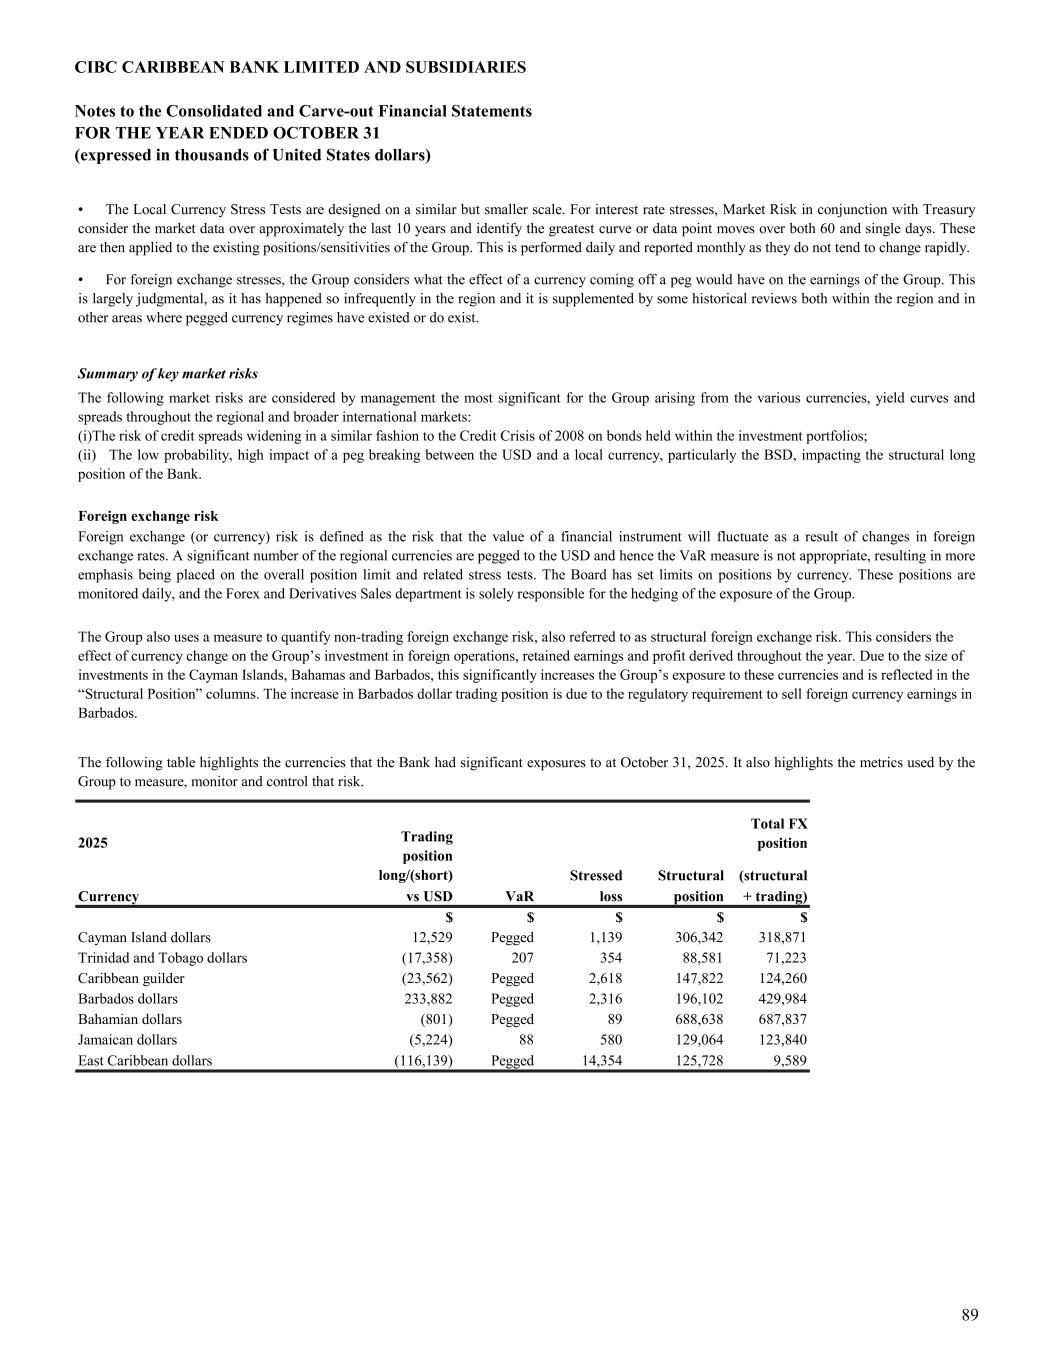
CIBC CARIBBEAN BANK LIMITED AND SUBSIDIARIES Notes to the Consolidated and Carve-out Financial Statements FOR THE YEAR ENDED OCTOBER 31 (expressed in thousands of United States dollars) Summary of key market risks Total FX position Stressed Structural (structural Currency vs USD VaR loss position + trading) $ $ $ $ $ Cayman Island dollars 12,529 Pegged 1,139 306,342 318,871 Trinidad and Tobago dollars (17,358) 207 354 88,581 71,223 Caribbean guilder (23,562) Pegged 2,618 147,822 124,260 Barbados dollars 233,882 Pegged 2,316 196,102 429,984 Bahamian dollars (801) Pegged 89 688,638 687,837 Jamaican dollars (5,224) 88 580 129,064 123,840 East Caribbean dollars (116,139) Pegged 14,354 125,728 9,589 The Group also uses a measure to quantify non-trading foreign exchange risk, also referred to as structural foreign exchange risk. This considers the effect of currency change on the Group’s investment in foreign operations, retained earnings and profit derived throughout the year. Due to the size of investments in the Cayman Islands, Bahamas and Barbados, this significantly increases the Group’s exposure to these currencies and is reflected in the “Structural Position” columns. The increase in Barbados dollar trading position is due to the regulatory requirement to sell foreign currency earnings in Barbados. The following table highlights the currencies that the Bank had significant exposures to at October 31, 2025. It also highlights the metrics used by the Group to measure, monitor and control that risk. 2025 Trading position long/(short) • The Local Currency Stress Tests are designed on a similar but smaller scale. For interest rate stresses, Market Risk in conjunction with Treasury consider the market data over approximately the last 10 years and identify the greatest curve or data point moves over both 60 and single days. These are then applied to the existing positions/sensitivities of the Group. This is performed daily and reported monthly as they do not tend to change rapidly. • For foreign exchange stresses, the Group considers what the effect of a currency coming off a peg would have on the earnings of the Group. This is largely judgmental, as it has happened so infrequently in the region and it is supplemented by some historical reviews both within the region and in other areas where pegged currency regimes have existed or do exist. The following market risks are considered by management the most significant for the Group arising from the various currencies, yield curves and spreads throughout the regional and broader international markets: (i)The risk of credit spreads widening in a similar fashion to the Credit Crisis of 2008 on bonds held within the investment portfolios; (ii) The low probability, high impact of a peg breaking between the USD and a local currency, particularly the BSD, impacting the structural long position of the Bank. Foreign exchange risk Foreign exchange (or currency) risk is defined as the risk that the value of a financial instrument will fluctuate as a result of changes in foreign exchange rates. A significant number of the regional currencies are pegged to the USD and hence the VaR measure is not appropriate, resulting in more emphasis being placed on the overall position limit and related stress tests. The Board has set limits on positions by currency. These positions are monitored daily, and the Forex and Derivatives Sales department is solely responsible for the hedging of the exposure of the Group. 89
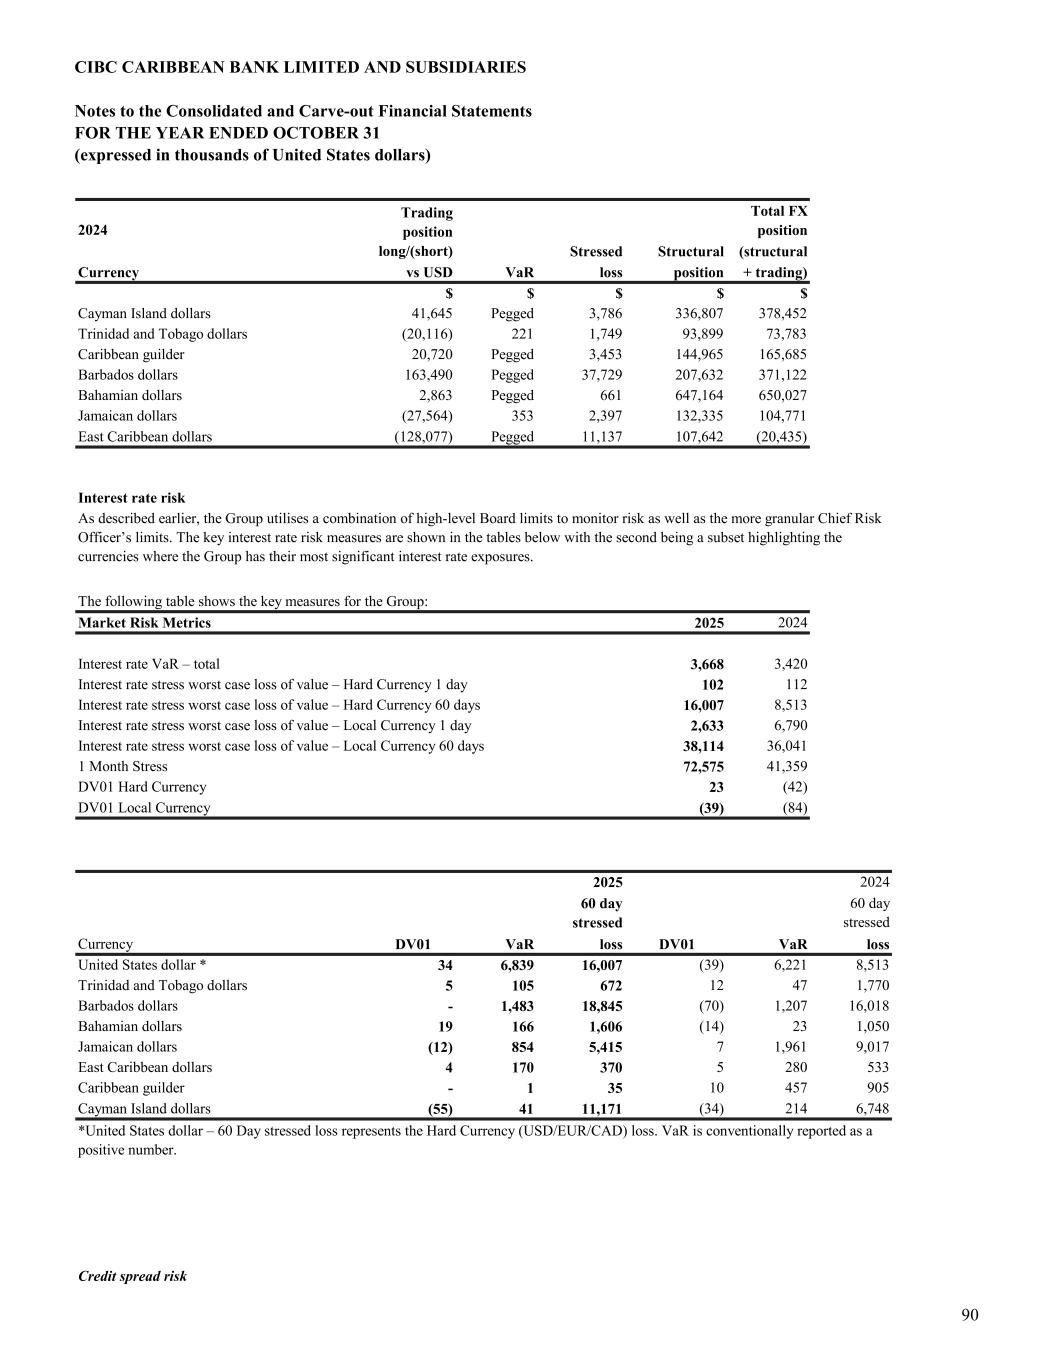
CIBC CARIBBEAN BANK LIMITED AND SUBSIDIARIES Notes to the Consolidated and Carve-out Financial Statements FOR THE YEAR ENDED OCTOBER 31 (expressed in thousands of United States dollars) Total FX position Stressed Structural (structural Currency vs USD VaR loss position + trading) $ $ $ $ $ Cayman Island dollars 41,645 Pegged 3,786 336,807 378,452 Trinidad and Tobago dollars (20,116) 221 1,749 93,899 73,783 Caribbean guilder 20,720 Pegged 3,453 144,965 165,685 Barbados dollars 163,490 Pegged 37,729 207,632 371,122 Bahamian dollars 2,863 Pegged 661 647,164 650,027 Jamaican dollars (27,564) 353 2,397 132,335 104,771 East Caribbean dollars (128,077) Pegged 11,137 107,642 (20,435) The following table shows the key measures for the Group: Market Risk Metrics 2025 2024 Interest rate VaR – total 3,668 3,420 Interest rate stress worst case loss of value – Hard Currency 1 day 102 112 Interest rate stress worst case loss of value – Hard Currency 60 days 16,007 8,513 Interest rate stress worst case loss of value – Local Currency 1 day 2,633 6,790 Interest rate stress worst case loss of value – Local Currency 60 days 38,114 36,041 1 Month Stress 72,575 41,359 DV01 Hard Currency 23 (42) DV01 Local Currency (39) (84) 2025 2024 60 day stressed 60 day stressed Currency DV01 VaR loss DV01 VaR loss United States dollar * 34 6,839 16,007 (39) 6,221 8,513 Trinidad and Tobago dollars 5 105 672 12 47 1,770 Barbados dollars - 1,483 18,845 (70) 1,207 16,018 Bahamian dollars 19 166 1,606 (14) 23 1,050 Jamaican dollars (12) 854 5,415 7 1,961 9,017 East Caribbean dollars 4 170 370 5 280 533 Caribbean guilder - 1 35 10 457 905 Cayman Island dollars (55) 41 11,171 (34) 214 6,748 Credit spread risk As described earlier, the Group utilises a combination of high-level Board limits to monitor risk as well as the more granular Chief Risk Officer’s limits. The key interest rate risk measures are shown in the tables below with the second being a subset highlighting the currencies where the Group has their most significant interest rate exposures. *United States dollar – 60 Day stressed loss represents the Hard Currency (USD/EUR/CAD) loss. VaR is conventionally reported as a positive number. 2024 Trading position long/(short) Interest rate risk 90
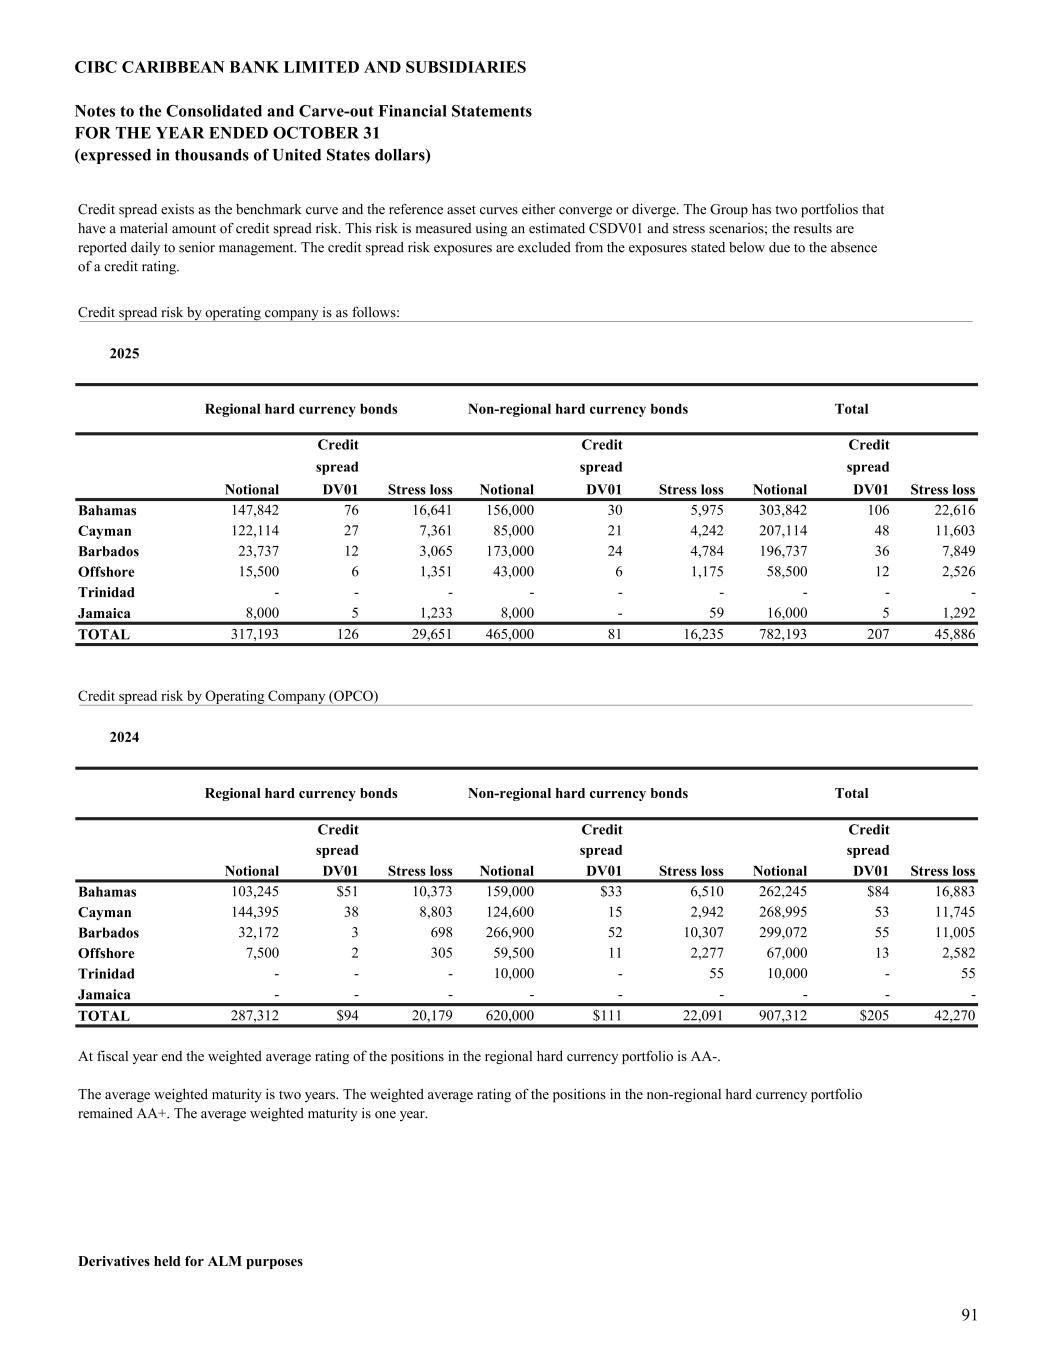
CIBC CARIBBEAN BANK LIMITED AND SUBSIDIARIES Notes to the Consolidated and Carve-out Financial Statements FOR THE YEAR ENDED OCTOBER 31 (expressed in thousands of United States dollars) Credit spread risk by operating company is as follows: 2025 Credit Credit Credit spread spread spread Notional DV01 Stress loss Notional DV01 Stress loss Notional DV01 Stress loss Bahamas 147,842 76 16,641 156,000 30 5,975 303,842 106 22,616 Cayman 122,114 27 7,361 85,000 21 4,242 207,114 48 11,603 Barbados 23,737 12 3,065 173,000 24 4,784 196,737 36 7,849 Offshore 15,500 6 1,351 43,000 6 1,175 58,500 12 2,526 Trinidad - - - - - - - - - Jamaica 8,000 5 1,233 8,000 - 59 16,000 5 1,292 TOTAL 317,193 126 29,651 465,000 81 16,235 782,193 207 45,886 Credit spread risk by Operating Company (OPCO) 2024 Credit Credit Credit spread spread spread Notional DV01 Stress loss Notional DV01 Stress loss Notional DV01 Stress loss Bahamas 103,245 $51 10,373 159,000 $33 6,510 262,245 $84 16,883 Cayman 144,395 38 8,803 124,600 15 2,942 268,995 53 11,745 Barbados 32,172 3 698 266,900 52 10,307 299,072 55 11,005 Offshore 7,500 2 305 59,500 11 2,277 67,000 13 2,582 Trinidad - - - 10,000 - 55 10,000 - 55 Jamaica - - - - - - - - - TOTAL 287,312 $94 20,179 620,000 $111 22,091 907,312 $205 42,270 Regional hard currency bonds Non-regional hard currency bonds Total At fiscal year end the weighted average rating of the positions in the regional hard currency portfolio is AA-. The average weighted maturity is two years. The weighted average rating of the positions in the non-regional hard currency portfolio remained AA+. The average weighted maturity is one year. Derivatives held for ALM purposes Credit spread exists as the benchmark curve and the reference asset curves either converge or diverge. The Group has two portfolios that have a material amount of credit spread risk. This risk is measured using an estimated CSDV01 and stress scenarios; the results are reported daily to senior management. The credit spread risk exposures are excluded from the exposures stated below due to the absence of a credit rating. Regional hard currency bonds Non-regional hard currency bonds Total 91
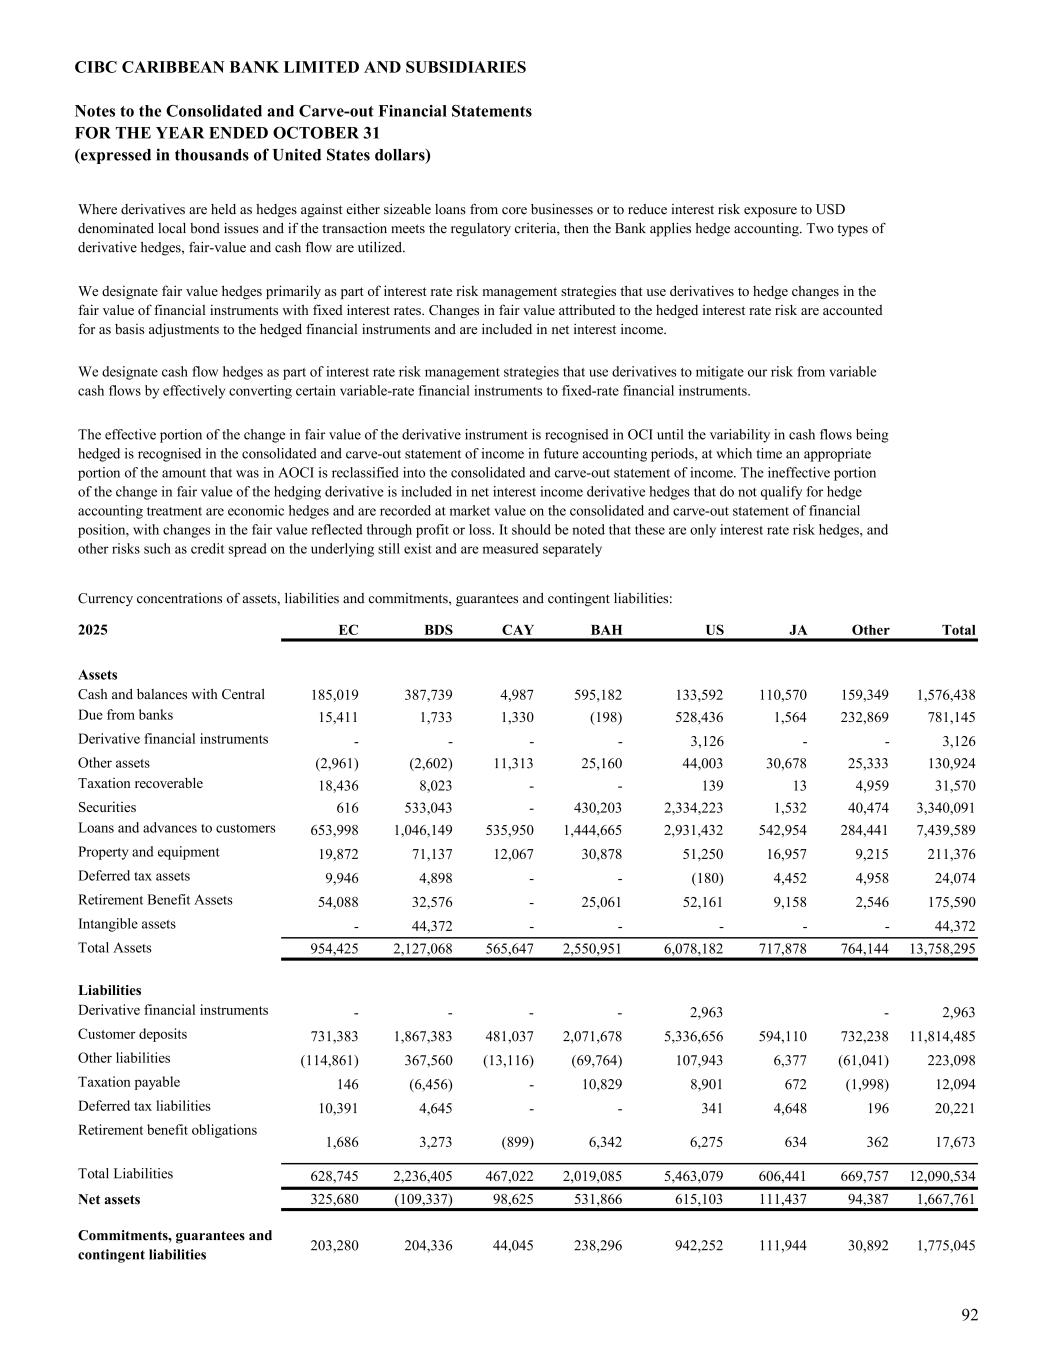
CIBC CARIBBEAN BANK LIMITED AND SUBSIDIARIES Notes to the Consolidated and Carve-out Financial Statements FOR THE YEAR ENDED OCTOBER 31 (expressed in thousands of United States dollars) 2025 EC BDS CAY BAH US JA Other Total Assets 185,019 387,739 4,987 595,182 133,592 110,570 159,349 1,576,438 Due from banks 15,411 1,733 1,330 (198) 528,436 1,564 232,869 781,145 Derivative financial instruments - - - - 3,126 - - 3,126 Other assets (2,961) (2,602) 11,313 25,160 44,003 30,678 25,333 130,924 Taxation recoverable 18,436 8,023 - - 139 13 4,959 31,570 Securities 616 533,043 - 430,203 2,334,223 1,532 40,474 3,340,091 Loans and advances to customers 653,998 1,046,149 535,950 1,444,665 2,931,432 542,954 284,441 7,439,589 Property and equipment 19,872 71,137 12,067 30,878 51,250 16,957 9,215 211,376 Deferred tax assets 9,946 4,898 - - (180) 4,452 4,958 24,074 Retirement Benefit Assets 54,088 32,576 - 25,061 52,161 9,158 2,546 175,590 Intangible assets - 44,372 - - - - - 44,372 Total Assets 954,425 2,127,068 565,647 2,550,951 6,078,182 717,878 764,144 13,758,295 Liabilities Derivative financial instruments - - - - 2,963 - 2,963 Customer deposits 731,383 1,867,383 481,037 2,071,678 5,336,656 594,110 732,238 11,814,485 Other liabilities (114,861) 367,560 (13,116) (69,764) 107,943 6,377 (61,041) 223,098 Taxation payable 146 (6,456) - 10,829 8,901 672 (1,998) 12,094 Deferred tax liabilities 10,391 4,645 - - 341 4,648 196 20,221 Retirement benefit obligations 1,686 3,273 (899) 6,342 6,275 634 362 17,673 Total Liabilities 628,745 2,236,405 467,022 2,019,085 5,463,079 606,441 669,757 12,090,534 Net assets 325,680 (109,337) 98,625 531,866 615,103 111,437 94,387 1,667,761 203,280 204,336 44,045 238,296 942,252 111,944 30,892 1,775,045 We designate fair value hedges primarily as part of interest rate risk management strategies that use derivatives to hedge changes in the fair value of financial instruments with fixed interest rates. Changes in fair value attributed to the hedged interest rate risk are accounted for as basis adjustments to the hedged financial instruments and are included in net interest income. We designate cash flow hedges as part of interest rate risk management strategies that use derivatives to mitigate our risk from variable cash flows by effectively converting certain variable-rate financial instruments to fixed-rate financial instruments. The effective portion of the change in fair value of the derivative instrument is recognised in OCI until the variability in cash flows being hedged is recognised in the consolidated and carve-out statement of income in future accounting periods, at which time an appropriate portion of the amount that was in AOCI is reclassified into the consolidated and carve-out statement of income. The ineffective portion of the change in fair value of the hedging derivative is included in net interest income derivative hedges that do not qualify for hedge accounting treatment are economic hedges and are recorded at market value on the consolidated and carve-out statement of financial position, with changes in the fair value reflected through profit or loss. It should be noted that these are only interest rate risk hedges, and other risks such as credit spread on the underlying still exist and are measured separately Currency concentrations of assets, liabilities and commitments, guarantees and contingent liabilities: Cash and balances with Central Commitments, guarantees and contingent liabilities Where derivatives are held as hedges against either sizeable loans from core businesses or to reduce interest risk exposure to USD denominated local bond issues and if the transaction meets the regulatory criteria, then the Bank applies hedge accounting. Two types of derivative hedges, fair-value and cash flow are utilized. 92
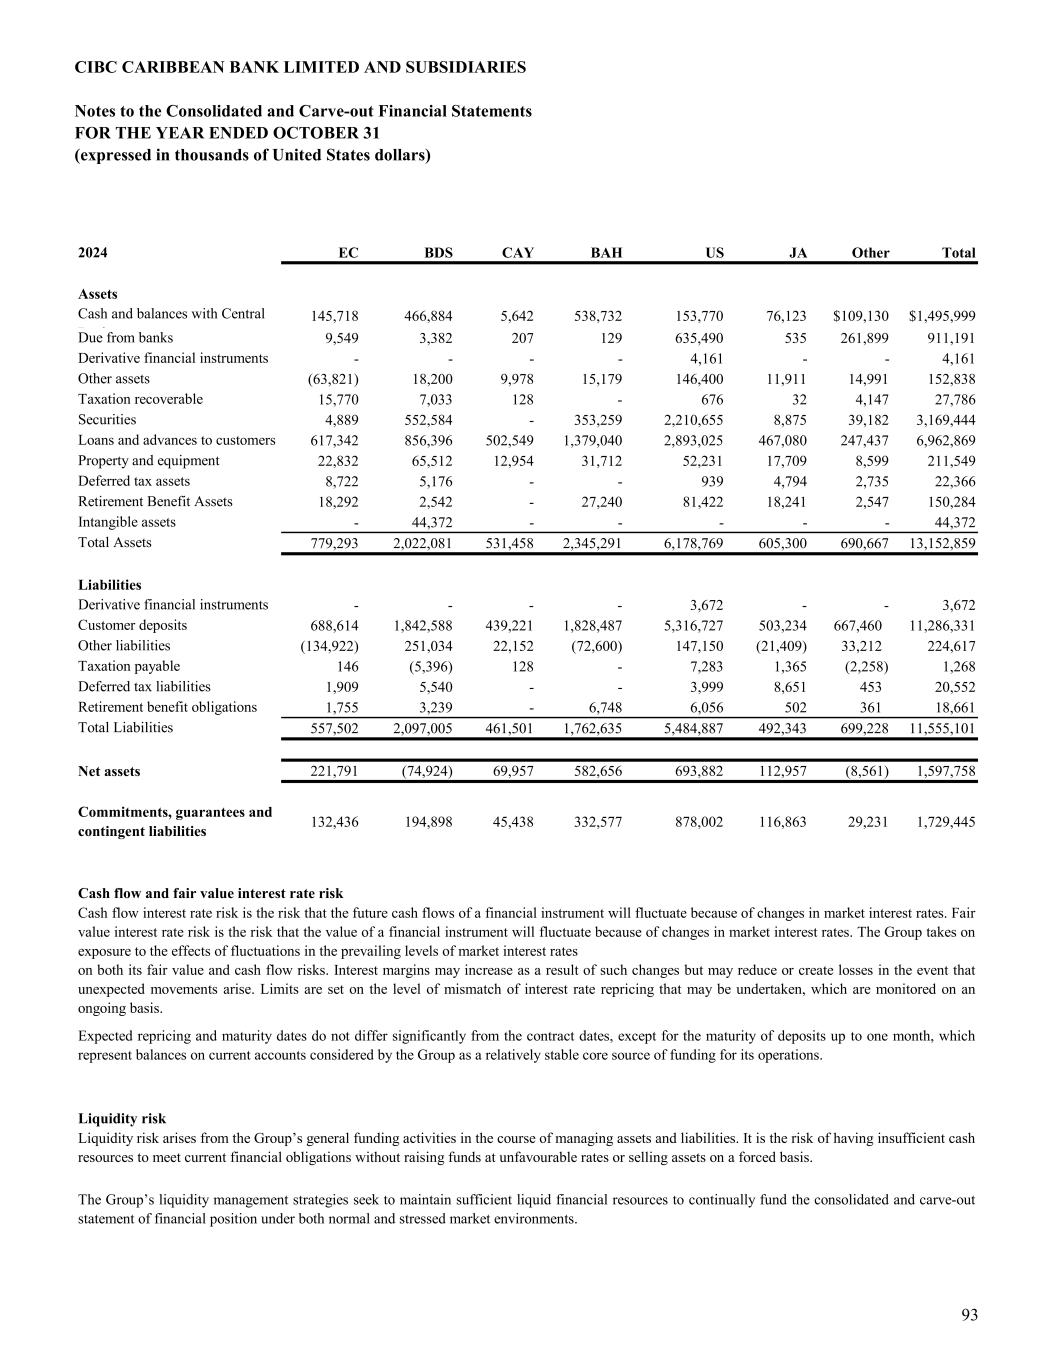
CIBC CARIBBEAN BANK LIMITED AND SUBSIDIARIES Notes to the Consolidated and Carve-out Financial Statements FOR THE YEAR ENDED OCTOBER 31 (expressed in thousands of United States dollars) 2024 EC BDS CAY BAH US JA Other Total Assets 145,718 466,884 5,642 538,732 153,770 76,123 $109,130 $1,495,999 Due from banks 9,549 3,382 207 129 635,490 535 261,899 911,191 Derivative financial instruments - - - - 4,161 - - 4,161 Other assets (63,821) 18,200 9,978 15,179 146,400 11,911 14,991 152,838 Taxation recoverable 15,770 7,033 128 - 676 32 4,147 27,786 Securities 4,889 552,584 - 353,259 2,210,655 8,875 39,182 3,169,444 Loans and advances to customers 617,342 856,396 502,549 1,379,040 2,893,025 467,080 247,437 6,962,869 Property and equipment 22,832 65,512 12,954 31,712 52,231 17,709 8,599 211,549 Deferred tax assets 8,722 5,176 - - 939 4,794 2,735 22,366 Retirement Benefit Assets 18,292 2,542 - 27,240 81,422 18,241 2,547 150,284 Intangible assets - 44,372 - - - - - 44,372 Total Assets 779,293 2,022,081 531,458 2,345,291 6,178,769 605,300 690,667 13,152,859 Liabilities Derivative financial instruments - - - - 3,672 - - 3,672 Customer deposits 688,614 1,842,588 439,221 1,828,487 5,316,727 503,234 667,460 11,286,331 Other liabilities (134,922) 251,034 22,152 (72,600) 147,150 (21,409) 33,212 224,617 Taxation payable 146 (5,396) 128 - 7,283 1,365 (2,258) 1,268 Deferred tax liabilities 1,909 5,540 - - 3,999 8,651 453 20,552 Retirement benefit obligations 1,755 3,239 - 6,748 6,056 502 361 18,661 Total Liabilities 557,502 2,097,005 461,501 1,762,635 5,484,887 492,343 699,228 11,555,101 Net assets 221,791 (74,924) 69,957 582,656 693,882 112,957 (8,561) 1,597,758 132,436 194,898 45,438 332,577 878,002 116,863 29,231 1,729,445 Cash flow and fair value interest rate risk Liquidity risk Cash and balances with Central Banks Commitments, guarantees and contingent liabilities Cash flow interest rate risk is the risk that the future cash flows of a financial instrument will fluctuate because of changes in market interest rates. Fair value interest rate risk is the risk that the value of a financial instrument will fluctuate because of changes in market interest rates. The Group takes on exposure to the effects of fluctuations in the prevailing levels of market interest rates on both its fair value and cash flow risks. Interest margins may increase as a result of such changes but may reduce or create losses in the event that unexpected movements arise. Limits are set on the level of mismatch of interest rate repricing that may be undertaken, which are monitored on an ongoing basis. Expected repricing and maturity dates do not differ significantly from the contract dates, except for the maturity of deposits up to one month, which represent balances on current accounts considered by the Group as a relatively stable core source of funding for its operations. Liquidity risk arises from the Group’s general funding activities in the course of managing assets and liabilities. It is the risk of having insufficient cash resources to meet current financial obligations without raising funds at unfavourable rates or selling assets on a forced basis. The Group’s liquidity management strategies seek to maintain sufficient liquid financial resources to continually fund the consolidated and carve-out statement of financial position under both normal and stressed market environments. 93
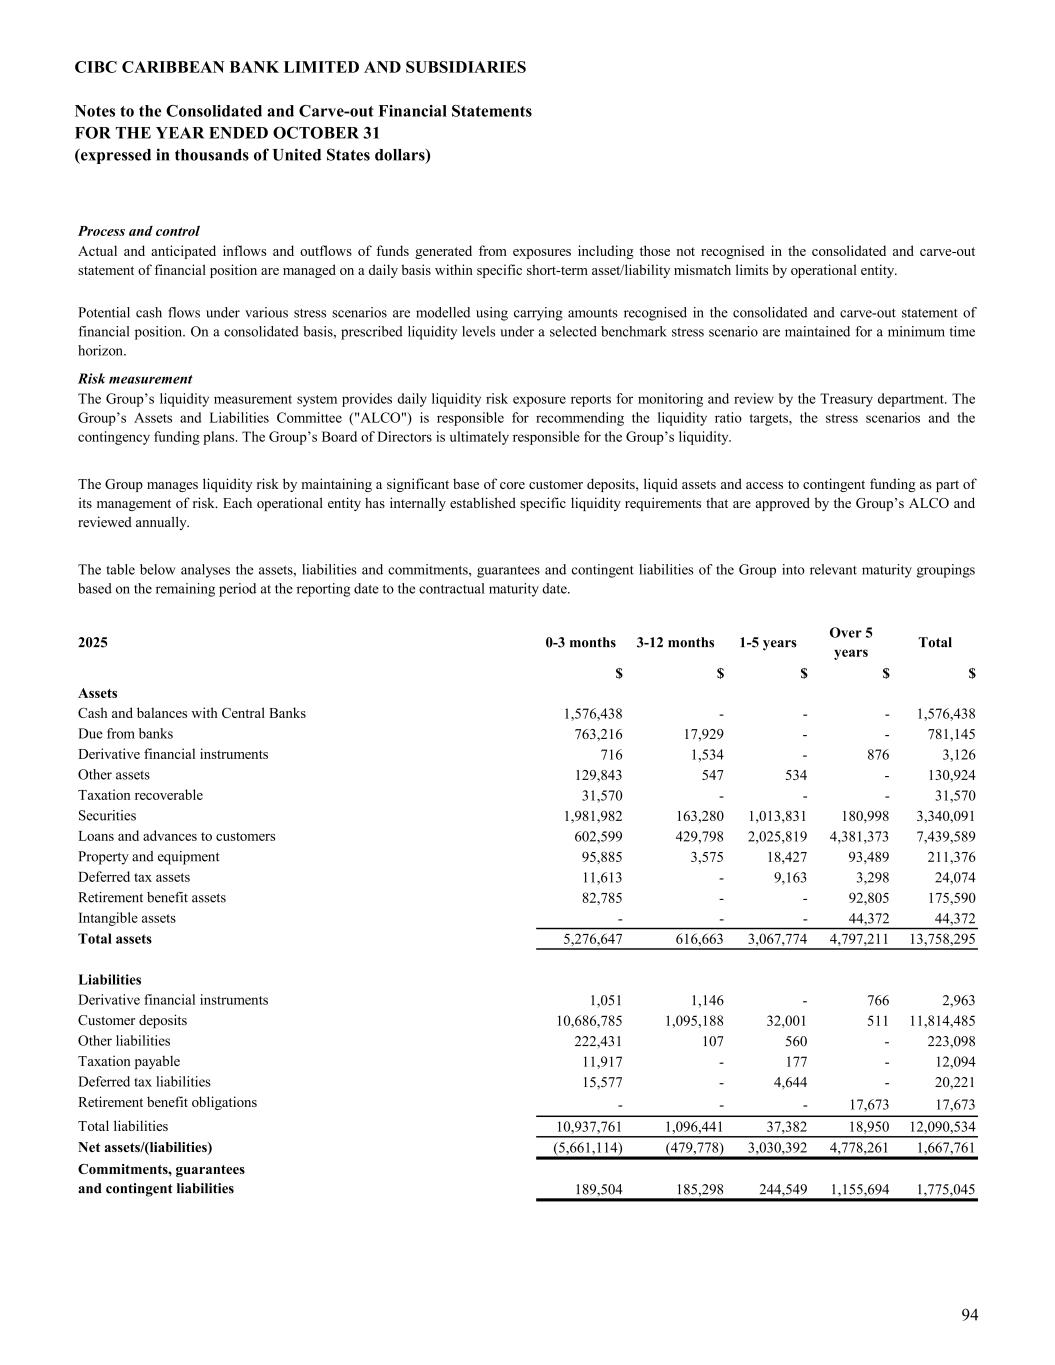
CIBC CARIBBEAN BANK LIMITED AND SUBSIDIARIES Notes to the Consolidated and Carve-out Financial Statements FOR THE YEAR ENDED OCTOBER 31 (expressed in thousands of United States dollars) Process and control Risk measurement 2025 0-3 months 3-12 months 1-5 years Over 5 years Total $ $ $ $ $ Assets 1,576,438 - - - 1,576,438 763,216 17,929 - - 781,145 716 1,534 - 876 3,126 129,843 547 534 - 130,924 31,570 - - - 31,570 1,981,982 163,280 1,013,831 180,998 3,340,091 602,599 429,798 2,025,819 4,381,373 7,439,589 95,885 3,575 18,427 93,489 211,376 11,613 - 9,163 3,298 24,074 82,785 - - 92,805 175,590 - - - 44,372 44,372 5,276,647 616,663 3,067,774 4,797,211 13,758,295 Liabilities 1,051 1,146 - 766 2,963 10,686,785 1,095,188 32,001 511 11,814,485 222,431 107 560 - 223,098 11,917 - 177 - 12,094 15,577 - 4,644 - 20,221 - - - 17,673 17,673 10,937,761 1,096,441 37,382 18,950 12,090,534 (5,661,114) (479,778) 3,030,392 4,778,261 1,667,761 189,504 185,298 244,549 1,155,694 1,775,045 Total liabilities Net assets/(liabilities) Commitments, guarantees and contingent liabilities Derivative financial instruments Customer deposits Other liabilities Taxation payable Deferred tax liabilities Retirement benefit obligations Property and equipment Deferred tax assets Retirement benefit assets Intangible assets Total assets Due from banks Derivative financial instruments Other assets Taxation recoverable Securities Loans and advances to customers Actual and anticipated inflows and outflows of funds generated from exposures including those not recognised in the consolidated and carve-out statement of financial position are managed on a daily basis within specific short-term asset/liability mismatch limits by operational entity. Potential cash flows under various stress scenarios are modelled using carrying amounts recognised in the consolidated and carve-out statement of financial position. On a consolidated basis, prescribed liquidity levels under a selected benchmark stress scenario are maintained for a minimum time horizon. The Group’s liquidity measurement system provides daily liquidity risk exposure reports for monitoring and review by the Treasury department. The Group’s Assets and Liabilities Committee ("ALCO") is responsible for recommending the liquidity ratio targets, the stress scenarios and the contingency funding plans. The Group’s Board of Directors is ultimately responsible for the Group’s liquidity. The Group manages liquidity risk by maintaining a significant base of core customer deposits, liquid assets and access to contingent funding as part of its management of risk. Each operational entity has internally established specific liquidity requirements that are approved by the Group’s ALCO and reviewed annually. The table below analyses the assets, liabilities and commitments, guarantees and contingent liabilities of the Group into relevant maturity groupings based on the remaining period at the reporting date to the contractual maturity date. Cash and balances with Central Banks 94
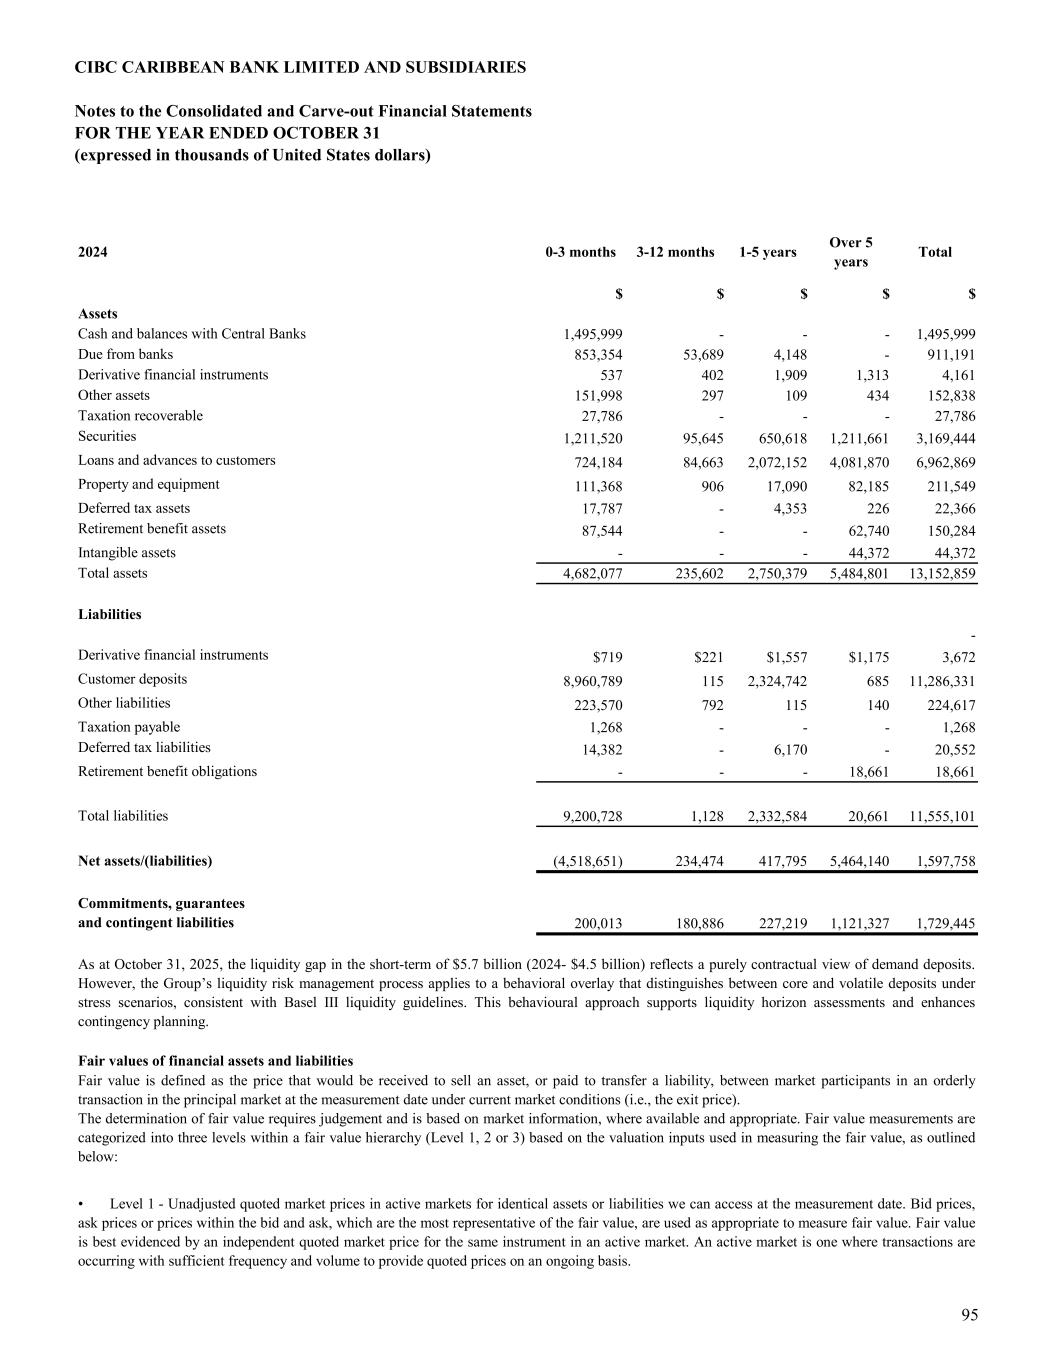
CIBC CARIBBEAN BANK LIMITED AND SUBSIDIARIES Notes to the Consolidated and Carve-out Financial Statements FOR THE YEAR ENDED OCTOBER 31 (expressed in thousands of United States dollars) 2024 0-3 months 3-12 months 1-5 years Over 5 years Total $ $ $ $ $ Assets 1,495,999 - - - 1,495,999 853,354 53,689 4,148 - 911,191 537 402 1,909 1,313 4,161 151,998 297 109 434 152,838 27,786 - - - 27,786 1,211,520 95,645 650,618 1,211,661 3,169,444 724,184 84,663 2,072,152 4,081,870 6,962,869 111,368 906 17,090 82,185 211,549 17,787 - 4,353 226 22,366 87,544 - - 62,740 150,284 - - - 44,372 44,372 4,682,077 235,602 2,750,379 5,484,801 13,152,859 Liabilities - $719 $221 $1,557 $1,175 3,672 8,960,789 115 2,324,742 685 11,286,331 223,570 792 115 140 224,617 1,268 - - - 1,268 14,382 - 6,170 - 20,552 - - - 18,661 18,661 9,200,728 1,128 2,332,584 20,661 11,555,101 (4,518,651) 234,474 417,795 5,464,140 1,597,758 200,013 180,886 227,219 1,121,327 1,729,445 Fair values of financial assets and liabilities Net assets/(liabilities) Commitments, guarantees and contingent liabilities As at October 31, 2025, the liquidity gap in the short-term of $5.7 billion (2024- $4.5 billion) reflects a purely contractual view of demand deposits. However, the Group’s liquidity risk management process applies to a behavioral overlay that distinguishes between core and volatile deposits under stress scenarios, consistent with Basel III liquidity guidelines. This behavioural approach supports liquidity horizon assessments and enhances contingency planning. Fair value is defined as the price that would be received to sell an asset, or paid to transfer a liability, between market participants in an orderly transaction in the principal market at the measurement date under current market conditions (i.e., the exit price). The determination of fair value requires judgement and is based on market information, where available and appropriate. Fair value measurements are categorized into three levels within a fair value hierarchy (Level 1, 2 or 3) based on the valuation inputs used in measuring the fair value, as outlined below: • Level 1 - Unadjusted quoted market prices in active markets for identical assets or liabilities we can access at the measurement date. Bid prices, ask prices or prices within the bid and ask, which are the most representative of the fair value, are used as appropriate to measure fair value. Fair value is best evidenced by an independent quoted market price for the same instrument in an active market. An active market is one where transactions are occurring with sufficient frequency and volume to provide quoted prices on an ongoing basis. Customer deposits Other liabilities Taxation payable Deferred tax liabilities Retirement benefit obligations Total liabilities Retirement benefit assets Intangible assets Total assets Derivative financial instruments Other assets Taxation recoverable Securities Loans and advances to customers Property and equipment Deferred tax assets Cash and balances with Central Banks Due from banks Derivative financial instruments 95
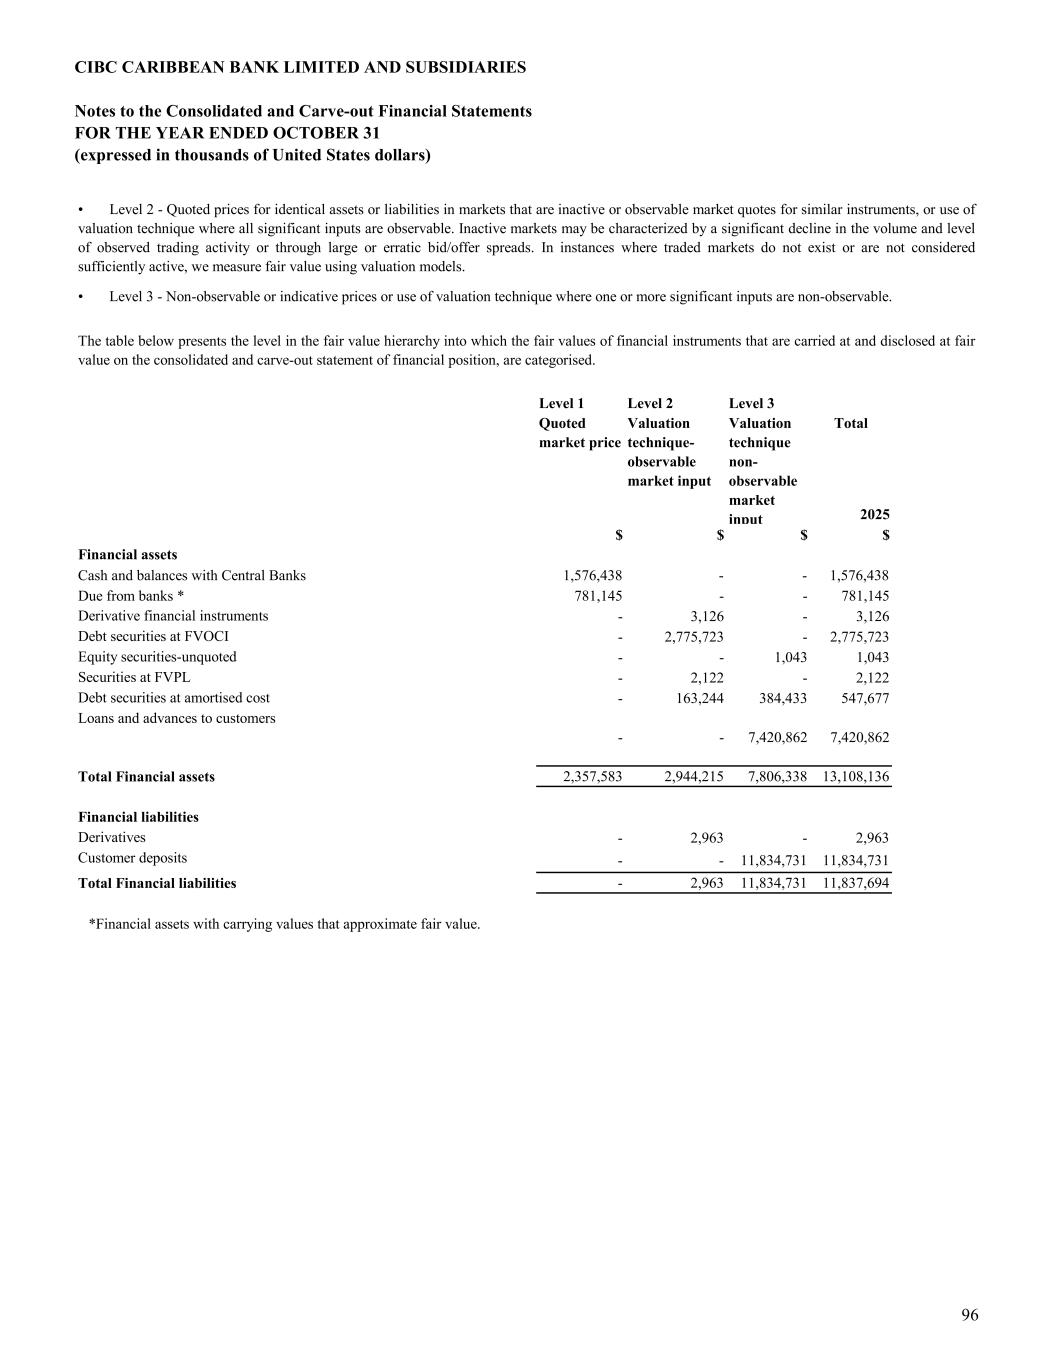
CIBC CARIBBEAN BANK LIMITED AND SUBSIDIARIES Notes to the Consolidated and Carve-out Financial Statements FOR THE YEAR ENDED OCTOBER 31 (expressed in thousands of United States dollars) Level 1 Level 2 Level 3 Total 2025 $ $ $ $ Cash and balances with Central Banks 1,576,438 - - 1,576,438 Due from banks * 781,145 - - 781,145 - 3,126 - 3,126 - 2,775,723 - 2,775,723 - - 1,043 1,043 - 2,122 - 2,122 - 163,244 384,433 547,677 - - 7,420,862 7,420,862 Total Financial assets 2,357,583 2,944,215 7,806,338 13,108,136 - 2,963 - 2,963 - - 11,834,731 11,834,731 Total Financial liabilities - 2,963 11,834,731 11,837,694 *Financial assets with carrying values that approximate fair value. Loans and advances to customers Financial liabilities Derivatives Customer deposits Financial assets Derivative financial instruments Debt securities at FVOCI Equity securities-unquoted Securities at FVPL Debt securities at amortised cost • Level 3 - Non-observable or indicative prices or use of valuation technique where one or more significant inputs are non-observable. The table below presents the level in the fair value hierarchy into which the fair values of financial instruments that are carried at and disclosed at fair value on the consolidated and carve-out statement of financial position, are categorised. Quoted market price Valuation technique- observable market input Valuation technique non- observable market input • Level 2 - Quoted prices for identical assets or liabilities in markets that are inactive or observable market quotes for similar instruments, or use of valuation technique where all significant inputs are observable. Inactive markets may be characterized by a significant decline in the volume and level of observed trading activity or through large or erratic bid/offer spreads. In instances where traded markets do not exist or are not considered sufficiently active, we measure fair value using valuation models. 96
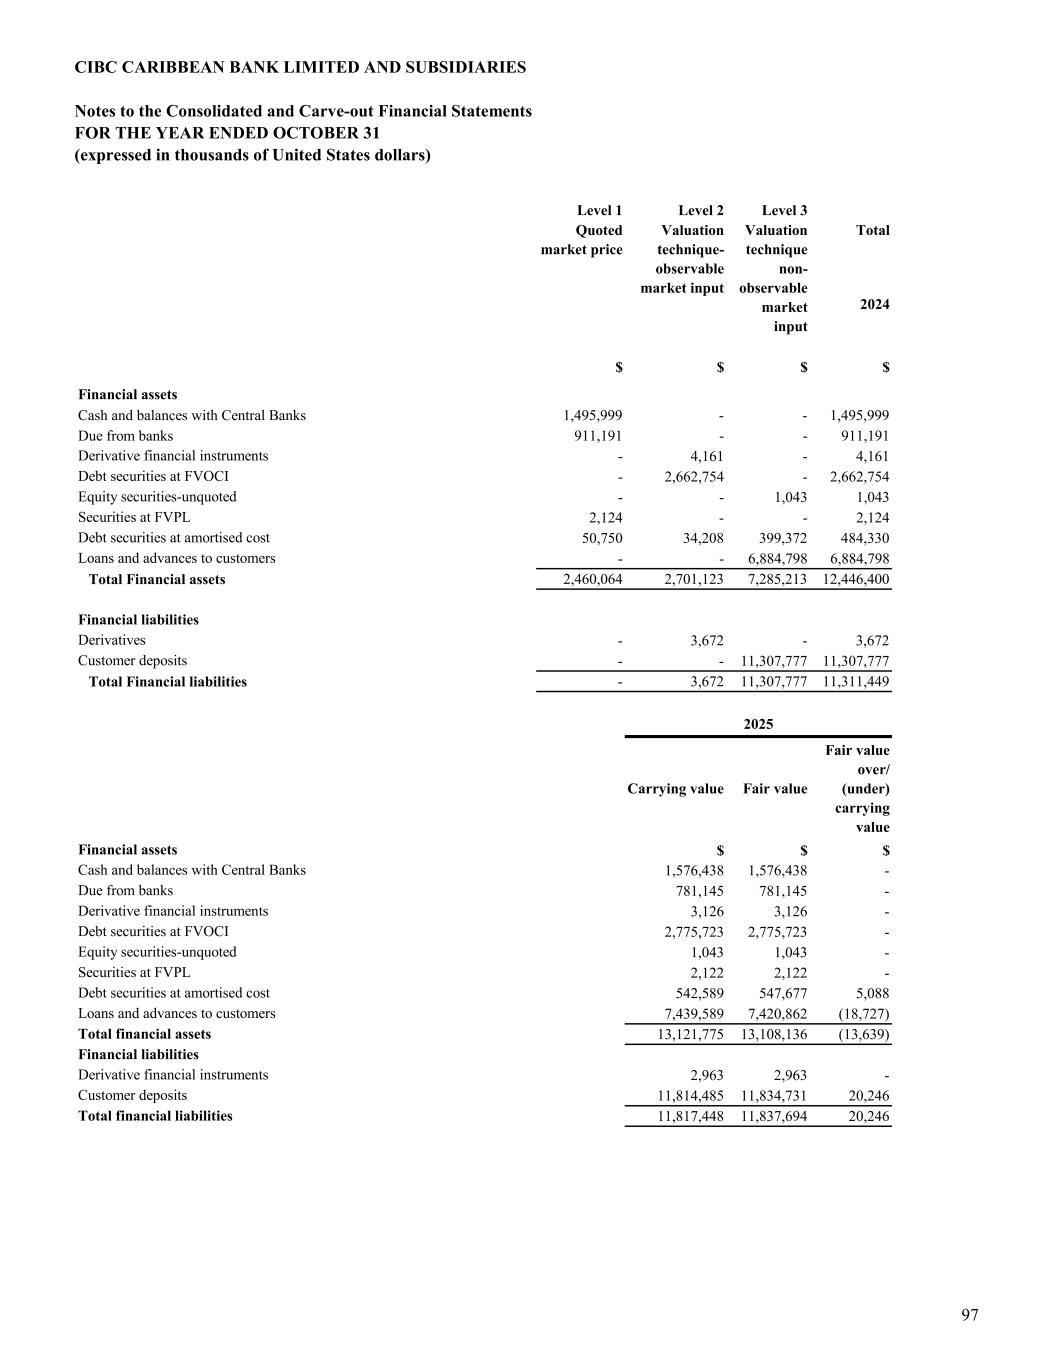
CIBC CARIBBEAN BANK LIMITED AND SUBSIDIARIES Notes to the Consolidated and Carve-out Financial Statements FOR THE YEAR ENDED OCTOBER 31 (expressed in thousands of United States dollars) Level 1 Level 2 Level 3 Total 2024 $ $ $ $ Cash and balances with Central Banks 1,495,999 - - 1,495,999 Due from banks 911,191 - - 911,191 - 4,161 - 4,161 - 2,662,754 - 2,662,754 - - 1,043 1,043 2,124 - - 2,124 50,750 34,208 399,372 484,330 - - 6,884,798 6,884,798 Total Financial assets 2,460,064 2,701,123 7,285,213 12,446,400 - 3,672 - 3,672 - - 11,307,777 11,307,777 Total Financial liabilities - 3,672 11,307,777 11,311,449 Carrying value Fair value Fair value over/ (under) carrying value $ $ $ 1,576,438 1,576,438 - 781,145 781,145 - 3,126 3,126 - 2,775,723 2,775,723 - 1,043 1,043 - 2,122 2,122 - 542,589 547,677 5,088 7,439,589 7,420,862 (18,727) 13,121,775 13,108,136 (13,639) 2,963 2,963 - 11,814,485 11,834,731 20,246 11,817,448 11,837,694 20,246 Loans and advances to customers Total financial assets Financial liabilities Derivative financial instruments Customer deposits Total financial liabilities Due from banks Derivative financial instruments Debt securities at FVOCI Equity securities-unquoted Securities at FVPL Debt securities at amortised cost Customer deposits 2025 Financial assets Cash and balances with Central Banks Equity securities-unquoted Securities at FVPL Debt securities at amortised cost Loans and advances to customers Financial liabilities Derivatives Quoted market price Valuation technique- observable market input Valuation technique non- observable market input Financial assets Derivative financial instruments Debt securities at FVOCI 97
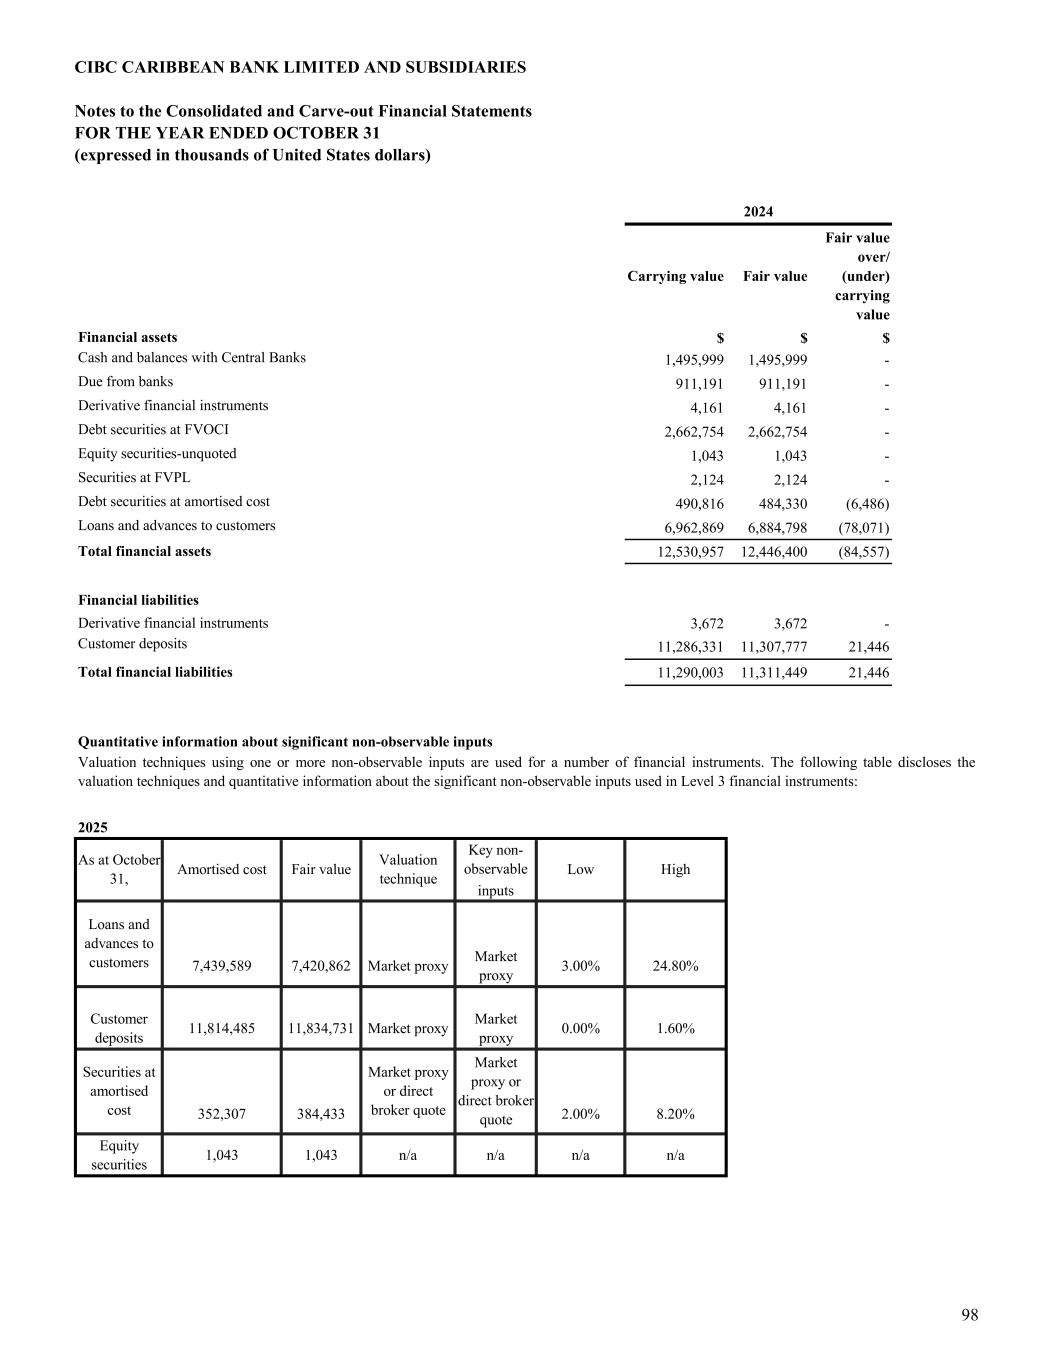
CIBC CARIBBEAN BANK LIMITED AND SUBSIDIARIES Notes to the Consolidated and Carve-out Financial Statements FOR THE YEAR ENDED OCTOBER 31 (expressed in thousands of United States dollars) Carrying value Fair value Fair value over/ (under) carrying value $ $ $ 1,495,999 1,495,999 - 911,191 911,191 - 4,161 4,161 - 2,662,754 2,662,754 - 1,043 1,043 - 2,124 2,124 - 490,816 484,330 (6,486) 6,962,869 6,884,798 (78,071) 12,530,957 12,446,400 (84,557) 3,672 3,672 - 11,286,331 11,307,777 21,446 11,290,003 11,311,449 21,446 2025 Key non- observable inputs 7,439,589 7,420,862 Market proxy Market proxy 3.00% 24.80% Customer deposits 11,814,485 11,834,731 Market proxy Market proxy 0.00% 1.60% 352,307 384,433 2.00% 8.20% Equity securities 1,043 1,043 n/a n/a n/a n/a Loans and advances to customers Securities at amortised cost Market proxy or direct broker quote Market proxy or direct broker quote Valuation techniques using one or more non-observable inputs are used for a number of financial instruments. The following table discloses the valuation techniques and quantitative information about the significant non-observable inputs used in Level 3 financial instruments: As at October 31, Amortised cost Fair value Valuation technique Low High Total financial assets Financial liabilities Derivative financial instruments Customer deposits Total financial liabilities Quantitative information about significant non-observable inputs Derivative financial instruments Debt securities at FVOCI Equity securities-unquoted Securities at FVPL Debt securities at amortised cost Loans and advances to customers 2024 Financial assets Cash and balances with Central Banks Due from banks 98
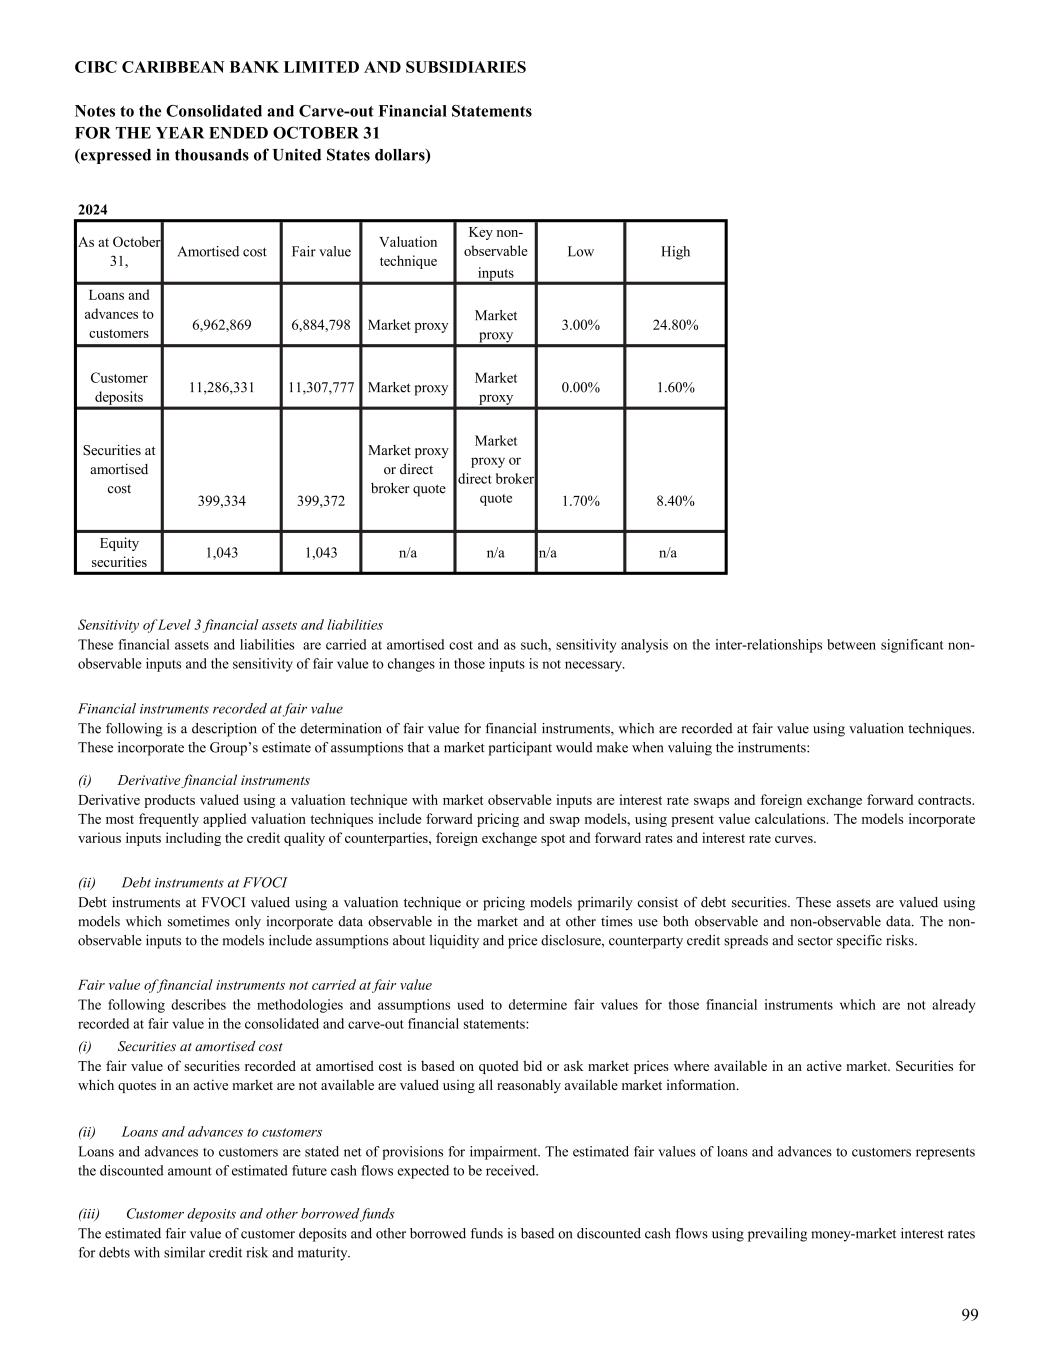
CIBC CARIBBEAN BANK LIMITED AND SUBSIDIARIES Notes to the Consolidated and Carve-out Financial Statements FOR THE YEAR ENDED OCTOBER 31 (expressed in thousands of United States dollars) 2024 Key non- observable inputs 6,962,869 6,884,798 Market proxy Market proxy 3.00% 24.80% Customer deposits 11,286,331 11,307,777 Market proxy Market proxy 0.00% 1.60% 399,334 399,372 1.70% 8.40% Equity securities 1,043 1,043 n/a n/a n/a n/a Sensitivity of Level 3 financial assets and liabilities Financial instruments recorded at fair value (i) Derivative financial instruments (ii) Debt instruments at FVOCI Fair value of financial instruments not carried at fair value (i) Securities at amortised cost (ii) Loans and advances to customers (iii) Customer deposits and other borrowed funds Loans and advances to customers are stated net of provisions for impairment. The estimated fair values of loans and advances to customers represents the discounted amount of estimated future cash flows expected to be received. The estimated fair value of customer deposits and other borrowed funds is based on discounted cash flows using prevailing money-market interest rates for debts with similar credit risk and maturity. These financial assets and liabilities are carried at amortised cost and as such, sensitivity analysis on the inter-relationships between significant non- observable inputs and the sensitivity of fair value to changes in those inputs is not necessary. The following is a description of the determination of fair value for financial instruments, which are recorded at fair value using valuation techniques. These incorporate the Group’s estimate of assumptions that a market participant would make when valuing the instruments: Derivative products valued using a valuation technique with market observable inputs are interest rate swaps and foreign exchange forward contracts. The most frequently applied valuation techniques include forward pricing and swap models, using present value calculations. The models incorporate various inputs including the credit quality of counterparties, foreign exchange spot and forward rates and interest rate curves. Debt instruments at FVOCI valued using a valuation technique or pricing models primarily consist of debt securities. These assets are valued using models which sometimes only incorporate data observable in the market and at other times use both observable and non-observable data. The non- observable inputs to the models include assumptions about liquidity and price disclosure, counterparty credit spreads and sector specific risks. The following describes the methodologies and assumptions used to determine fair values for those financial instruments which are not already recorded at fair value in the consolidated and carve-out financial statements: The fair value of securities recorded at amortised cost is based on quoted bid or ask market prices where available in an active market. Securities for which quotes in an active market are not available are valued using all reasonably available market information. Low High Loans and advances to customers Securities at amortised cost Market proxy or direct broker quote Market proxy or direct broker quote As at October 31, Amortised cost Fair value Valuation technique 99
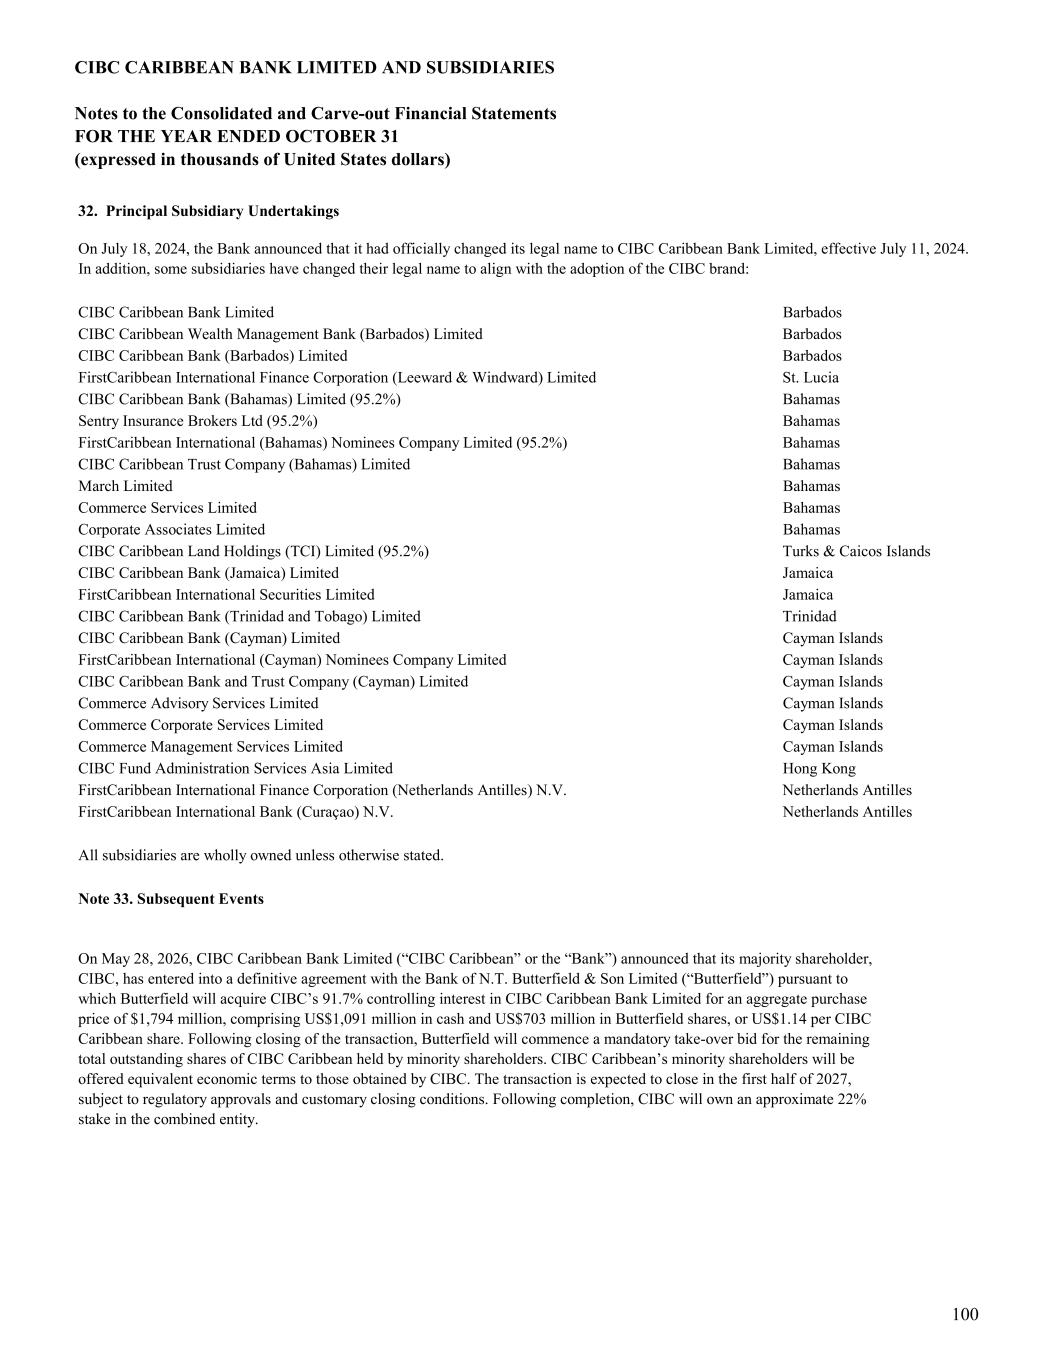
CIBC CARIBBEAN BANK LIMITED AND SUBSIDIARIES Notes to the Consolidated and Carve-out Financial Statements FOR THE YEAR ENDED OCTOBER 31 (expressed in thousands of United States dollars) 32. Principal Subsidiary Undertakings CIBC Caribbean Bank Limited Barbados CIBC Caribbean Wealth Management Bank (Barbados) Limited Barbados CIBC Caribbean Bank (Barbados) Limited Barbados FirstCaribbean International Finance Corporation (Leeward & Windward) Limited St. Lucia CIBC Caribbean Bank (Bahamas) Limited (95.2%) Bahamas Sentry Insurance Brokers Ltd (95.2%) Bahamas FirstCaribbean International (Bahamas) Nominees Company Limited (95.2%) Bahamas CIBC Caribbean Trust Company (Bahamas) Limited Bahamas March Limited Bahamas Commerce Services Limited Bahamas Corporate Associates Limited Bahamas CIBC Caribbean Land Holdings (TCI) Limited (95.2%) Turks & Caicos Islands CIBC Caribbean Bank (Jamaica) Limited Jamaica FirstCaribbean International Securities Limited Jamaica CIBC Caribbean Bank (Trinidad and Tobago) Limited Trinidad CIBC Caribbean Bank (Cayman) Limited Cayman Islands FirstCaribbean International (Cayman) Nominees Company Limited Cayman Islands CIBC Caribbean Bank and Trust Company (Cayman) Limited Cayman Islands Commerce Advisory Services Limited Cayman Islands Commerce Corporate Services Limited Cayman Islands Commerce Management Services Limited Cayman Islands CIBC Fund Administration Services Asia Limited Hong Kong FirstCaribbean International Finance Corporation (Netherlands Antilles) N.V. Netherlands Antilles FirstCaribbean International Bank (Curaçao) N.V. Netherlands Antilles All subsidiaries are wholly owned unless otherwise stated. Note 33. Subsequent Events On May 28, 2026, CIBC Caribbean Bank Limited (“CIBC Caribbean” or the “Bank”) announced that its majority shareholder, CIBC, has entered into a definitive agreement with the Bank of N.T. Butterfield & Son Limited (“Butterfield”) pursuant to which Butterfield will acquire CIBC’s 91.7% controlling interest in CIBC Caribbean Bank Limited for an aggregate purchase price of $1,794 million, comprising US$1,091 million in cash and US$703 million in Butterfield shares, or US$1.14 per CIBC Caribbean share. Following closing of the transaction, Butterfield will commence a mandatory take-over bid for the remaining total outstanding shares of CIBC Caribbean held by minority shareholders. CIBC Caribbean’s minority shareholders will be offered equivalent economic terms to those obtained by CIBC. The transaction is expected to close in the first half of 2027, subject to regulatory approvals and customary closing conditions. Following completion, CIBC will own an approximate 22% stake in the combined entity. On July 18, 2024, the Bank announced that it had officially changed its legal name to CIBC Caribbean Bank Limited, effective July 11, 2024. In addition, some subsidiaries have changed their legal name to align with the adoption of the CIBC brand: 100