
1 2Q 2026 Earnings A permanent home for great businesses when owners retire NASDAQ:TMS
2 Forward Looking Statements This Presentation contains certain forward-looking statements within the meaning of Section 27A of the U.S. Securities Act of 1933, as amended (the “Securities Act”), and Section 21E of the Exchange Act that are based on beliefs and assumptions and on information currently available to the Company. Forward-looking statements generally relate to future events or the Company’s future financial or operating performance. For example, statements regarding anticipated growth in the industry in which the Company operates and anticipated growth in demand for the Company’s products and services are forward-looking statements. In some cases, you can identify forward-looking statements by terminology such as “pro forma”, “may”, “should”, “could”, “might”, “plan”, “possible”, “project”, “strive”, “budget”, “forecast”, “expect”, “intend”, “will”, “estimate”, “anticipate”, “believe”, “predict”, “potential” or “continue”, or the negatives of these terms or variations of them or similar terminology. Such forward-looking statements are subject to risks, uncertainties, and other factors which could cause actual results to differ materially from those expressed or implied by such forward looking statements. These forward-looking statements are based upon estimates and assumptions that, while considered reasonable by the Company and its management, as the case may be, are inherently uncertain. Factors that may cause actual results to differ materially from current expectations include, but are not limited to: competition, the ability of the Company to grow and manage growth, maintain relationships with customers and retain its management and key employees; changes in applicable laws or regulations; the possibility that the Company may be adversely affected by other economic, business or competitive factors; the Company’s estimates of expenses and profitability; the evolution of the markets in which the Company competes; the ability of the Company to implement its strategic initiatives and continue to innovate its existing products and services. Nothing in this Presentation should be regarded as a representation by any person that the forward-looking statements set forth herein will be achieved or that any of the contemplated results of such forward-looking statements will be achieved. You should not place undue reliance on forward-looking statements, which speak only as of the date they are made. The Company undertakes no duty to update these forward-looking statements. Financial Information; Non-GAAP Financial Measures The financial information and data contained in this Presentation is unaudited and does not conform to Regulation S-X. Such information and data may not be included in, may be adjusted in or may be presented differently in the registration statement to be filed relating to the Proposed Business Combination and the proxy statement/prospectus contained therein. Some of the financial information and data contained in this Presentation, such as EBITDA, Adjusted EBITDA, Pro Forma Adj. EBITDA, Free Cash Flow, has not been prepared in accordance with United States generally accepted accounting principles (“GAAP”).The Company believe that the use of these non-GAAP financial measures provides an additional tool for investors to use in comparing the Company’s financial condition and results of operations with other similar companies, many of which present similar non-GAAP financial measures to investors, and to assess certain financial and business trends relating to the Company’s financial condition and results of operations. Among other things, the Company’s management uses these non-GAAP measures for trend analyses and for budgeting and planning purposes. Management does not consider these non-GAAP measures in isolation or as an alternative to financial measures determined in accordance with GAAP. The principal limitation of these non-GAAP financial measures is that they exclude significant expenses and income that are required by GAAP to be recorded in the Company’s financial statements. In addition, they are subject to inherent limitations as they reflect the exercise of judgments by management about which expenses and income are excluded and included in determining these non-GAAP financial measures. In order to compensate for these limitations, management presents non-GAAP financial measures in connection with GAAP results. Please see the Appendix of this Presentation for reconciliation of non-GAAP measures to their closest GAAP metric. Use of Projections This Presentation contains projected financial information with respect to the Company. The projected financial information constitutes forward-looking information, is for illustrative purposes only and should not be relied upon as necessarily being indicative of future results. The assumptions and estimates underlying such financial forecast information are inherently uncertain and are subject to a wide variety of significant business, economic, competitive and other risks and uncertainties. See “Forward-Looking Statements” above. Actual results may differ materially from the results contemplated by the financial forecast information contained in this Presentation, and the inclusion of such information in this Presentation should not be regarded as a representation by any person that the results reflected in such forecasts will be achieved. Disclaimer

3 Teamshares is a tech-enabled acquiror of SMEs, and a permanent home for great businesses Part holdco. Part fintech. We programmatically acquire companies with $0.5 to 5 million of EBITDA from retiring owners, integrate them with the Teamshares platform, and help employees earn company stock
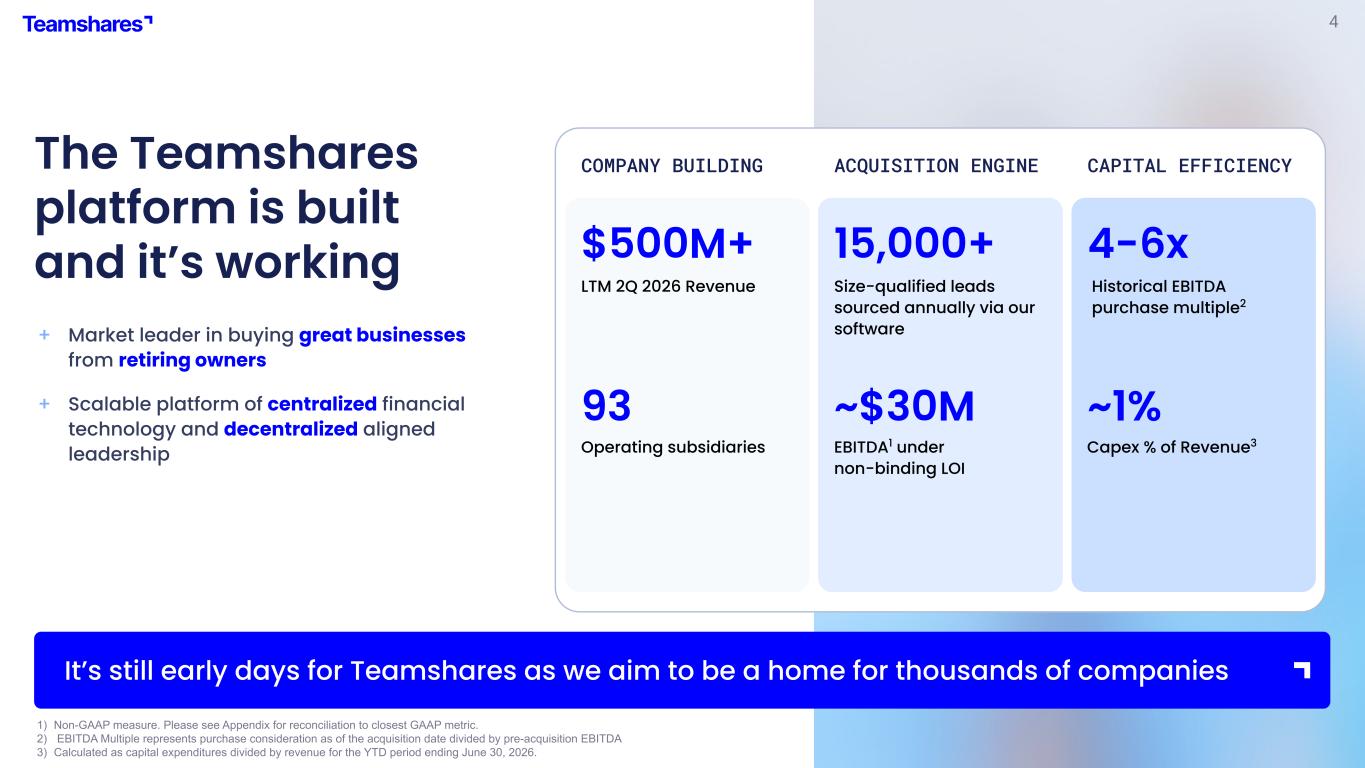
4 1) Non-GAAP measure. Please see Appendix for reconciliation to closest GAAP metric. 2) EBITDA Multiple represents purchase consideration as of the acquisition date divided by pre-acquisition EBITDA 3) Calculated as capital expenditures divided by revenue for the YTD period ending June 30, 2026. The Teamshares platform is built and it’s working + Market leader in buying great businesses from retiring owners + Scalable platform of centralized financial technology and decentralized aligned leadership ACQUISITION ENGINE $500M+ 93 15,000+ ~$30M COMPANY BUILDING CAPITAL EFFICIENCY 4-6x ~1% Size-qualified leads sourced annually via our software It’s still early days for Teamshares as we aim to be a home for thousands of companies Operating subsidiaries EBITDA1 under non-binding LOI Historical EBITDA purchase multiple2 LTM 2Q 2026 Revenue MB Capex % of Revenue3
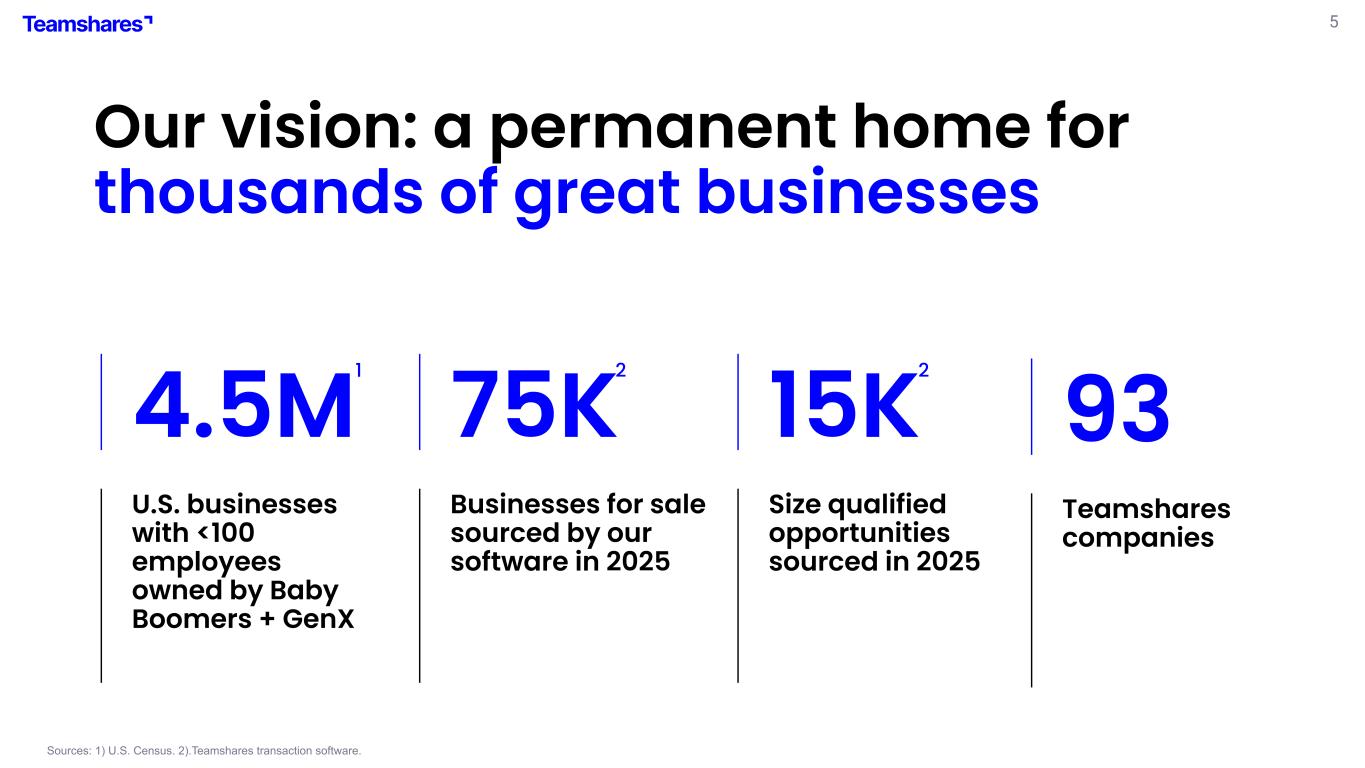
5 Sources: 1) U.S. Census. 2).Teamshares transaction software. 75K Businesses for sale sourced by our software in 2025 15K Size qualified opportunities sourced in 2025 1 2 2 Our vision: a permanent home for thousands of great businesses 93 Teamshares companies 4.5M U.S. businesses with <100 employees owned by Baby Boomers + GenX
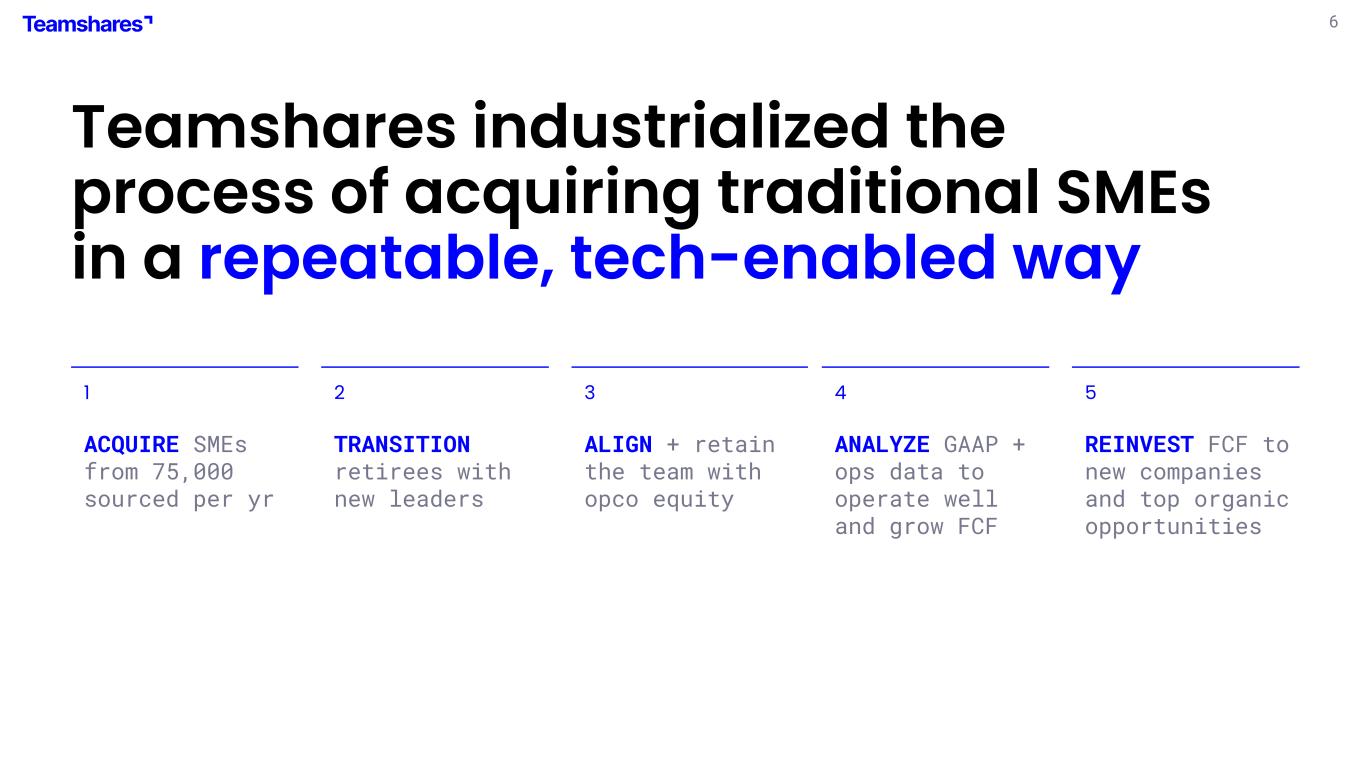
6 Teamshares industrialized the process of acquiring traditional SMEs in a repeatable, tech-enabled way 1 ACQUIRE SMEs from 75,000 sourced per yr 2 TRANSITION retirees with new leaders 3 ALIGN + retain the team with opco equity 4 ANALYZE GAAP + ops data to operate well and grow FCF 5 REINVEST FCF to new companies and top organic opportunities
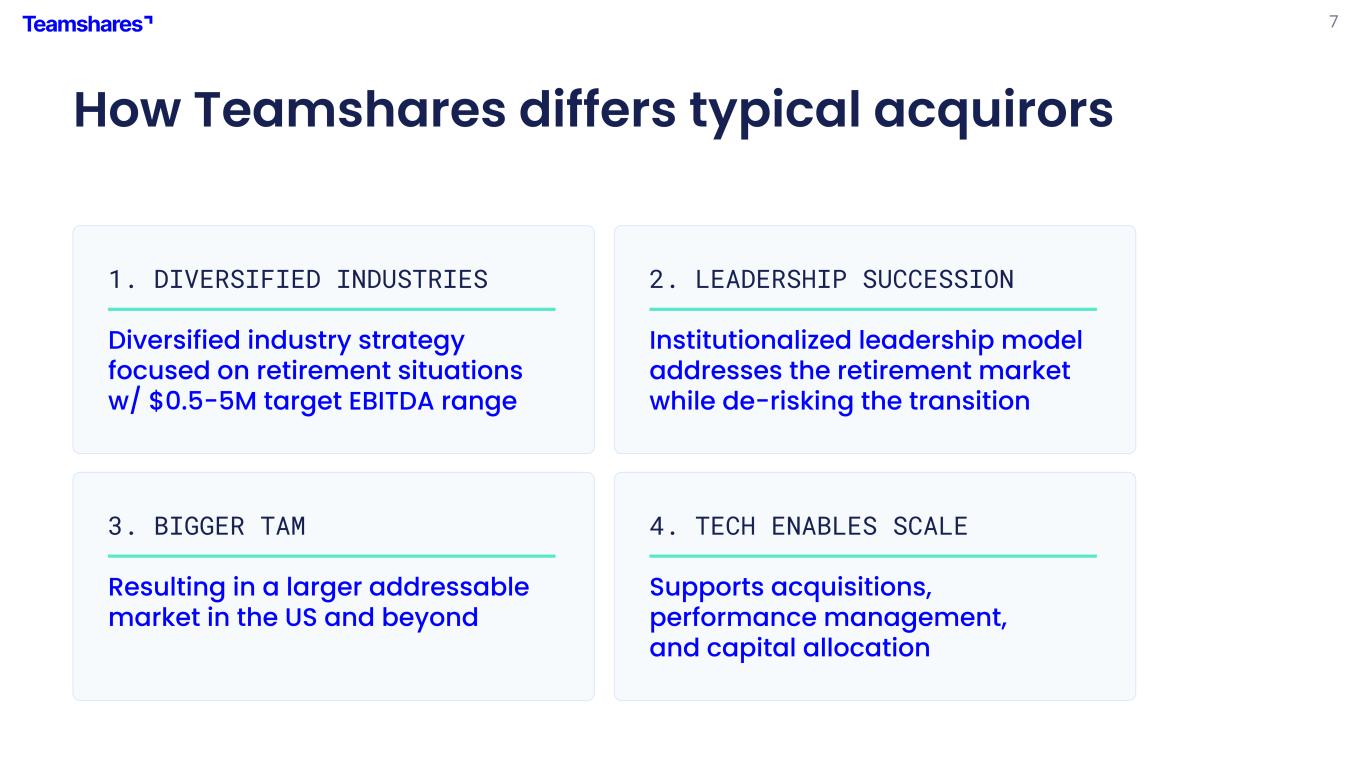
7 How Teamshares differs typical acquirors 1. DIVERSIFIED INDUSTRIES Diversified industry strategy focused on retirement situations w/ $0.5-5M target EBITDA range 2. LEADERSHIP SUCCESSION Institutionalized leadership model addresses the retirement market while de-risking the transition 3. BIGGER TAM Resulting in a larger addressable market in the US and beyond 4. TECH ENABLES SCALE Supports acquisitions, performance management, and capital allocation
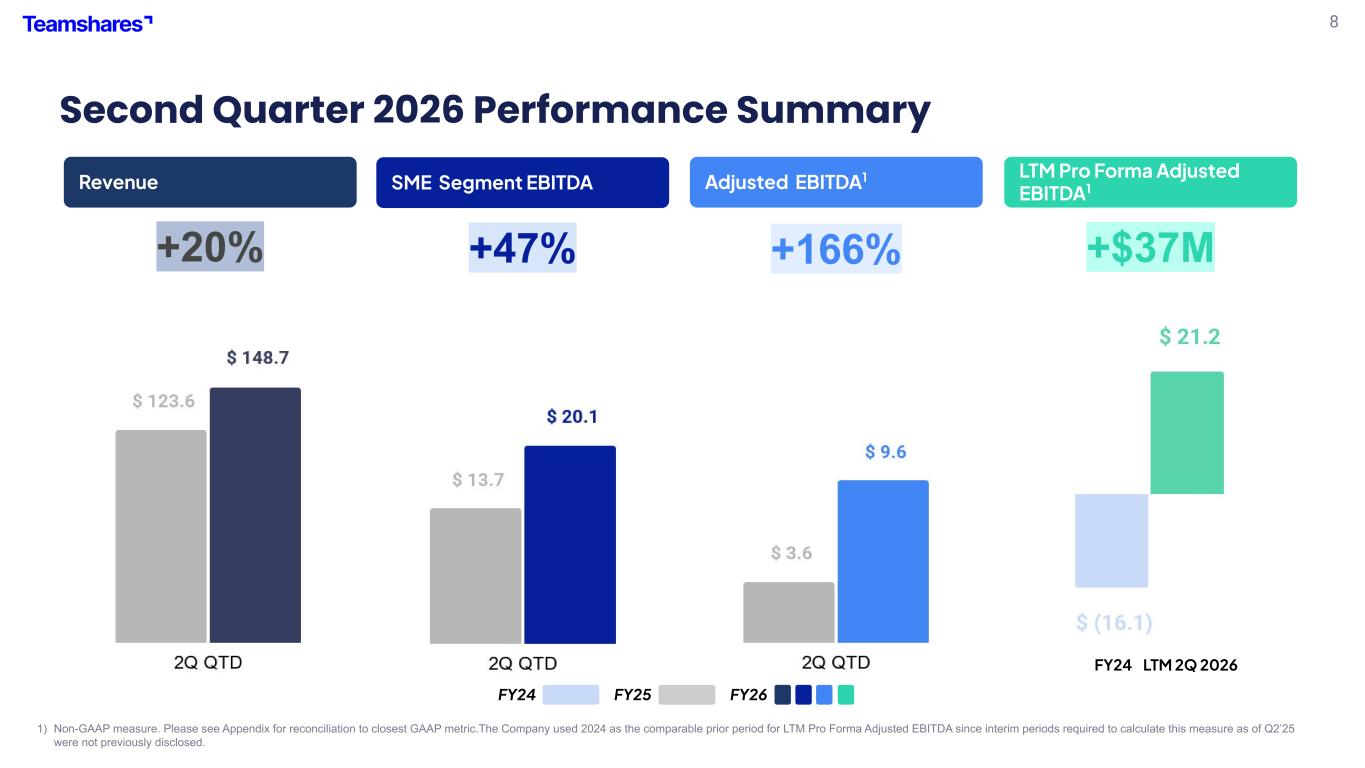
8 Second Quarter 2026 Performance Summary 1) Non-GAAP measure. Please see Appendix for reconciliation to closest GAAP metric.The Company used 2024 as the comparable prior period for LTM Pro Forma Adjusted EBITDA since interim periods required to calculate this measure as of Q2’25 were not previously disclosed. Revenue Adjusted EBITDA1 LTM Pro Forma Adjusted EBITDA1 FY25 FY26 SME Segment EBITDA +20% +47% +166% +$37M FY24 LTM 2Q 2026 FY24 Brian
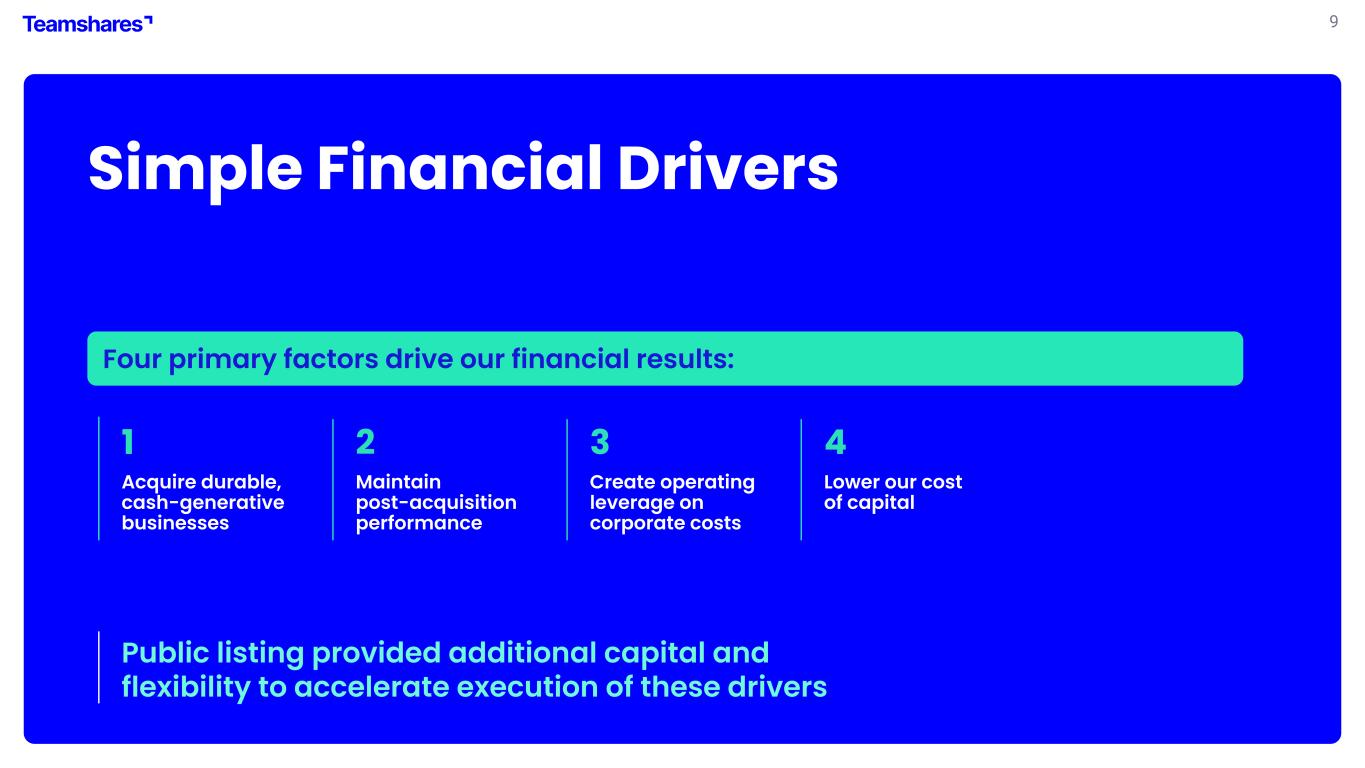
9 Simple Financial Drivers 1 Acquire durable, cash-generative businesses 2 Maintain post-acquisition performance 3 4 Lower our cost of capital Public listing provided additional capital and flexibility to accelerate execution of these drivers Four primary factors drive our financial results: Alex Create operating leverage on corporate costs
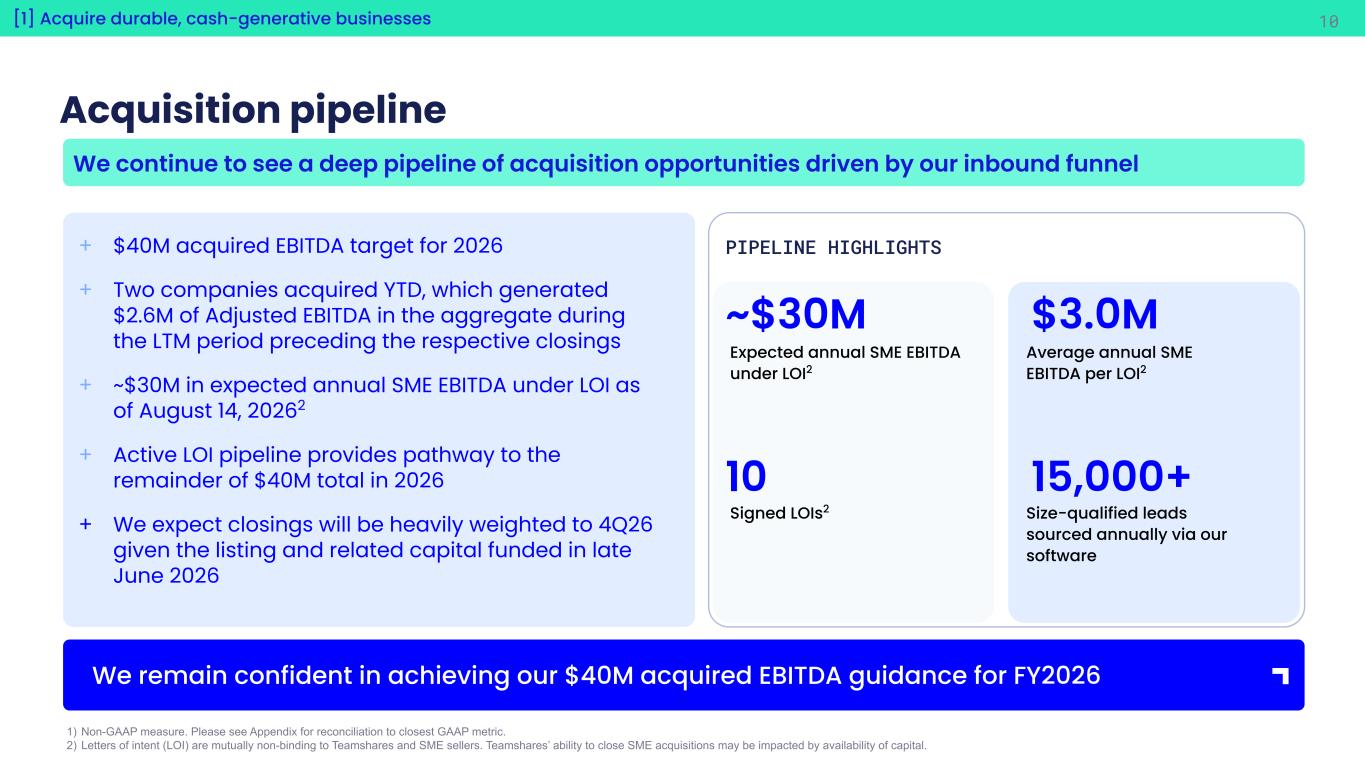
10[1] Acquire durable, cash-generative businesses Acquisition pipeline 1) Non-GAAP measure. Please see Appendix for reconciliation to closest GAAP metric. 2) Letters of intent (LOI) are mutually non-binding to Teamshares and SME sellers. Teamshares’ ability to close SME acquisitions may be impacted by availability of capital. We remain confident in achieving our $40M acquired EBITDA guidance for FY2026 Alex We continue to see a deep pipeline of acquisition opportunities driven by our inbound funnel + $40M acquired EBITDA target for 2026 + Two companies acquired YTD, which generated $2.6M of Adjusted EBITDA in the aggregate during the LTM period preceding the respective closings + ~$30M in expected annual SME EBITDA under LOI as of August 14, 20262 + Active LOI pipeline provides pathway to the remainder of $40M total in 2026 + We expect closings will be heavily weighted to 4Q26 given the listing and related capital funded in late June 2026 ~$30M 10 $3.0M 15,000+ PIPELINE HIGHLIGHTS Average annual SME EBITDA per LOI2 Signed LOIs2 Size-qualified leads sourced annually via our software Expected annual SME EBITDA under LOI2
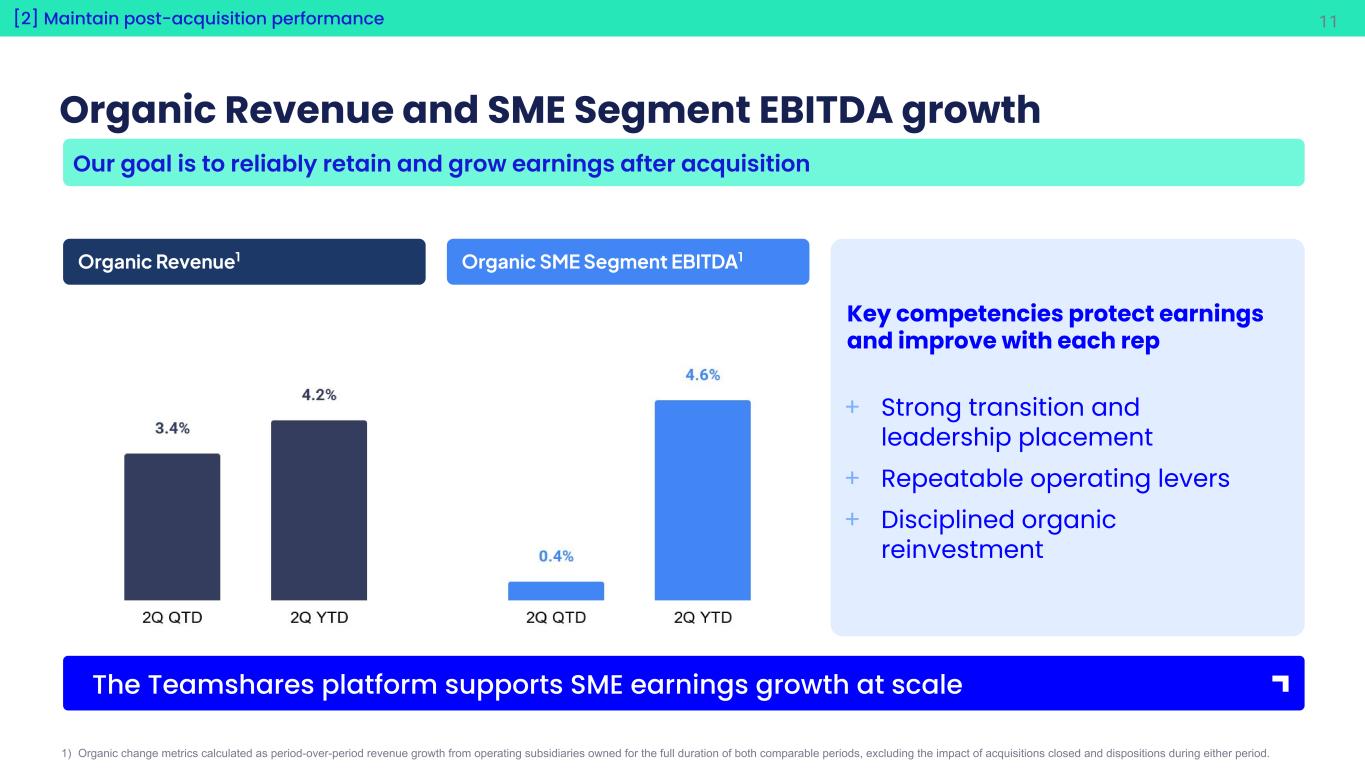
11 Organic Revenue and SME Segment EBITDA growth 1) Organic change metrics calculated as period-over-period revenue growth from operating subsidiaries owned for the full duration of both comparable periods, excluding the impact of acquisitions closed and dispositions during either period. The Teamshares platform supports SME earnings growth at scale [2] Maintain post-acquisition performance Alex Organic Revenue1 Organic SME Segment EBITDA1 Key competencies protect earnings and improve with each rep + Strong transition and leadership placement + Repeatable operating levers + Disciplined organic reinvestment Our goal is to reliably retain and grow earnings after acquisition
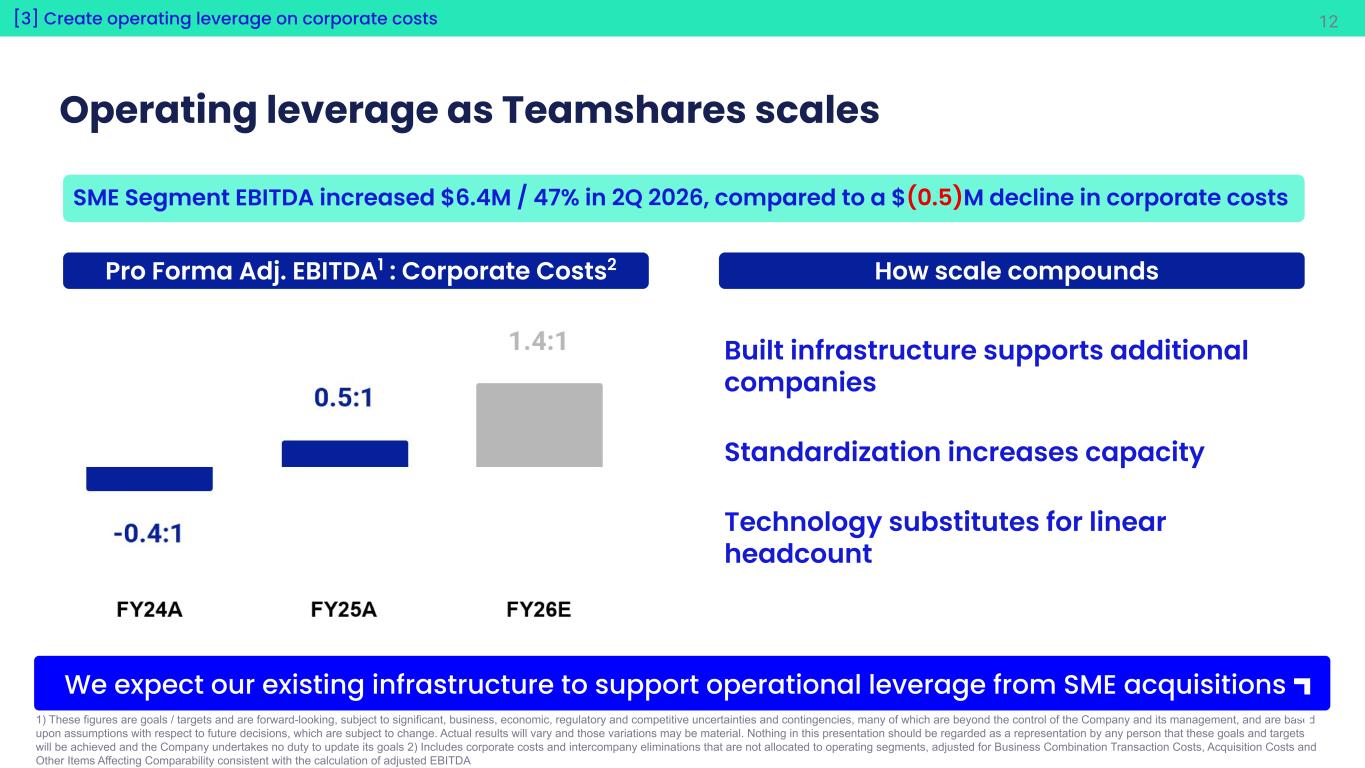
12 Operating leverage as Teamshares scales SME Segment EBITDA increased $6.4M / 47% in 2Q 2026, compared to a $(0.5)M decline in corporate costs 1) These figures are goals / targets and are forward-looking, subject to significant, business, economic, regulatory and competitive uncertainties and contingencies, many of which are beyond the control of the Company and its management, and are based upon assumptions with respect to future decisions, which are subject to change. Actual results will vary and those variations may be material. Nothing in this presentation should be regarded as a representation by any person that these goals and targets will be achieved and the Company undertakes no duty to update its goals 2) Includes corporate costs and intercompany eliminations that are not allocated to operating segments, adjusted for Business Combination Transaction Costs, Acquisition Costs and Other Items Affecting Comparability consistent with the calculation of adjusted EBITDA We expect our existing infrastructure to support operational leverage from SME acquisitions [3] Create operating leverage on corporate costs Pro Forma Adj. EBITDA1 : Corporate Costs2 Alex How scale compounds Built infrastructure supports additional companies Standardization increases capacity Technology substitutes for linear headcount
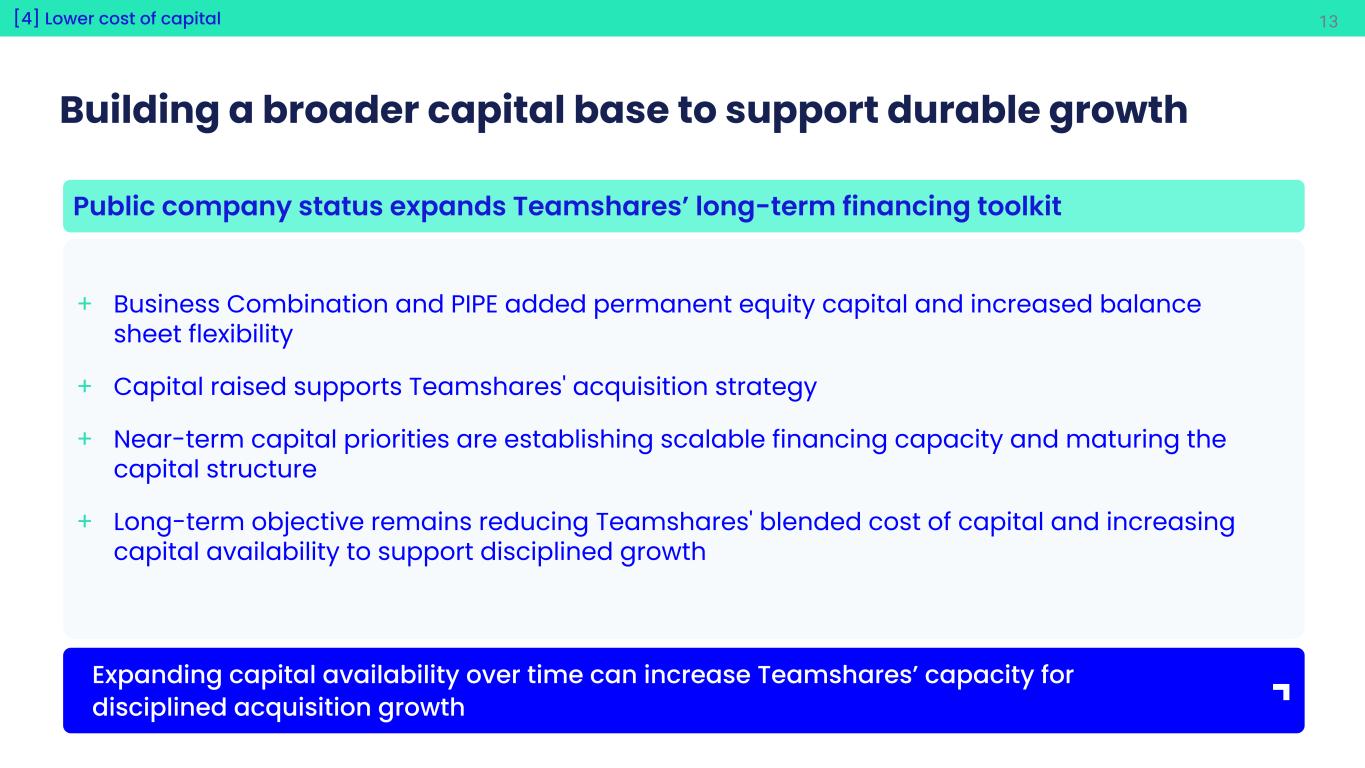
13 Building a broader capital base to support durable growth + Business Combination and PIPE added permanent equity capital and increased balance sheet flexibility + Capital raised supports Teamshares' acquisition strategy + Near-term capital priorities are establishing scalable financing capacity and maturing the capital structure + Long-term objective remains reducing Teamshares' blended cost of capital and increasing capital availability to support disciplined growth Public company status expands Teamshares’ long-term financing toolkit Expanding capital availability over time can increase Teamshares’ capacity for disciplined acquisition growth [4] Lower cost of capital Brian
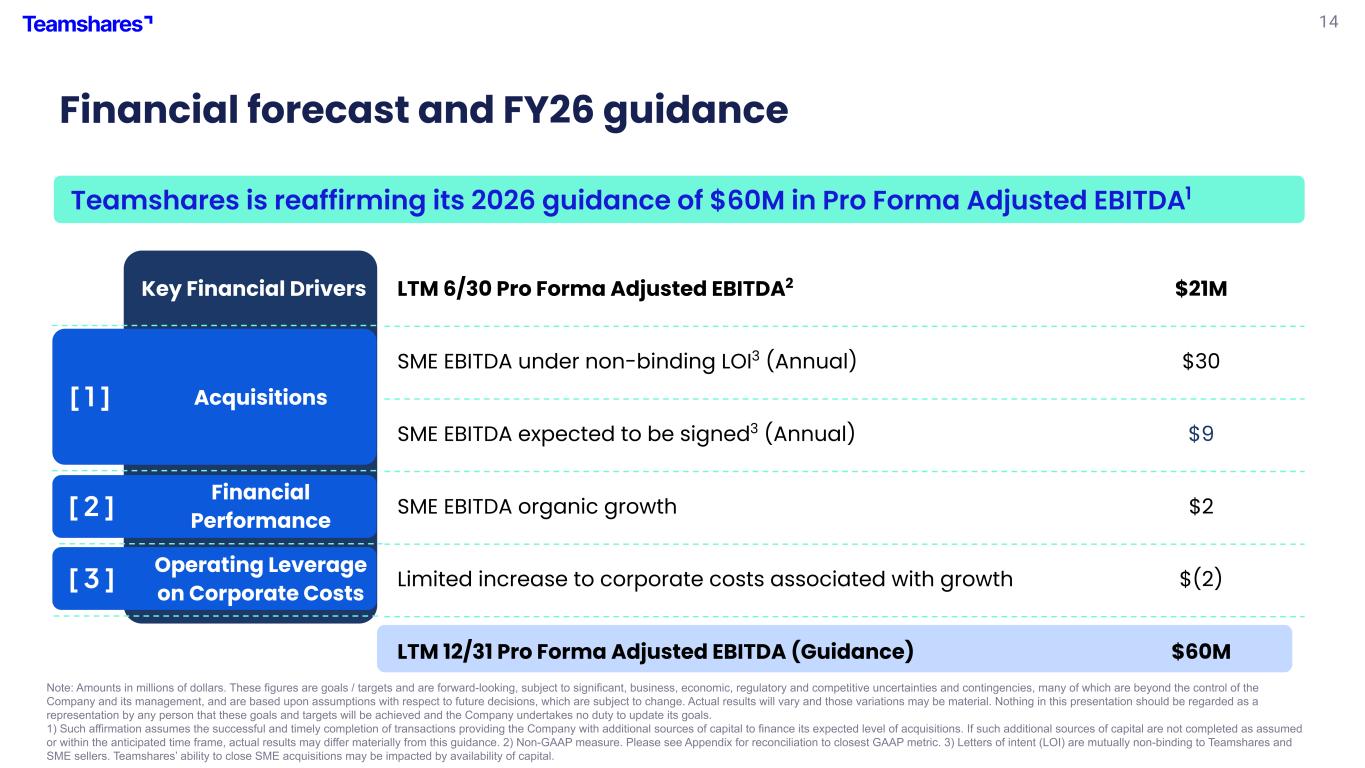
14 [ 1 ] [ 2 ] [ 3 ] Financial forecast and FY26 guidance Teamshares is reaffirming its 2026 guidance of $60M in Pro Forma Adjusted EBITDA1 Note: Amounts in millions of dollars. These figures are goals / targets and are forward-looking, subject to significant, business, economic, regulatory and competitive uncertainties and contingencies, many of which are beyond the control of the Company and its management, and are based upon assumptions with respect to future decisions, which are subject to change. Actual results will vary and those variations may be material. Nothing in this presentation should be regarded as a representation by any person that these goals and targets will be achieved and the Company undertakes no duty to update its goals. 1) Such affirmation assumes the successful and timely completion of transactions providing the Company with additional sources of capital to finance its expected level of acquisitions. If such additional sources of capital are not completed as assumed or within the anticipated time frame, actual results may differ materially from this guidance. 2) Non-GAAP measure. Please see Appendix for reconciliation to closest GAAP metric. 3) Letters of intent (LOI) are mutually non-binding to Teamshares and SME sellers. Teamshares’ ability to close SME acquisitions may be impacted by availability of capital. Key Financial Drivers LTM 6/30 Pro Forma Adjusted EBITDA2 $21M Acquisitions SME EBITDA under non-binding LOI3 (Annual) $30 SME EBITDA expected to be signed3 (Annual) $9 Financial Performance SME EBITDA organic growth $2 Operating Leverage on Corporate Costs Limited increase to corporate costs associated with growth $(2) LTM 12/31 Pro Forma Adjusted EBITDA (Guidance) $60M Brian
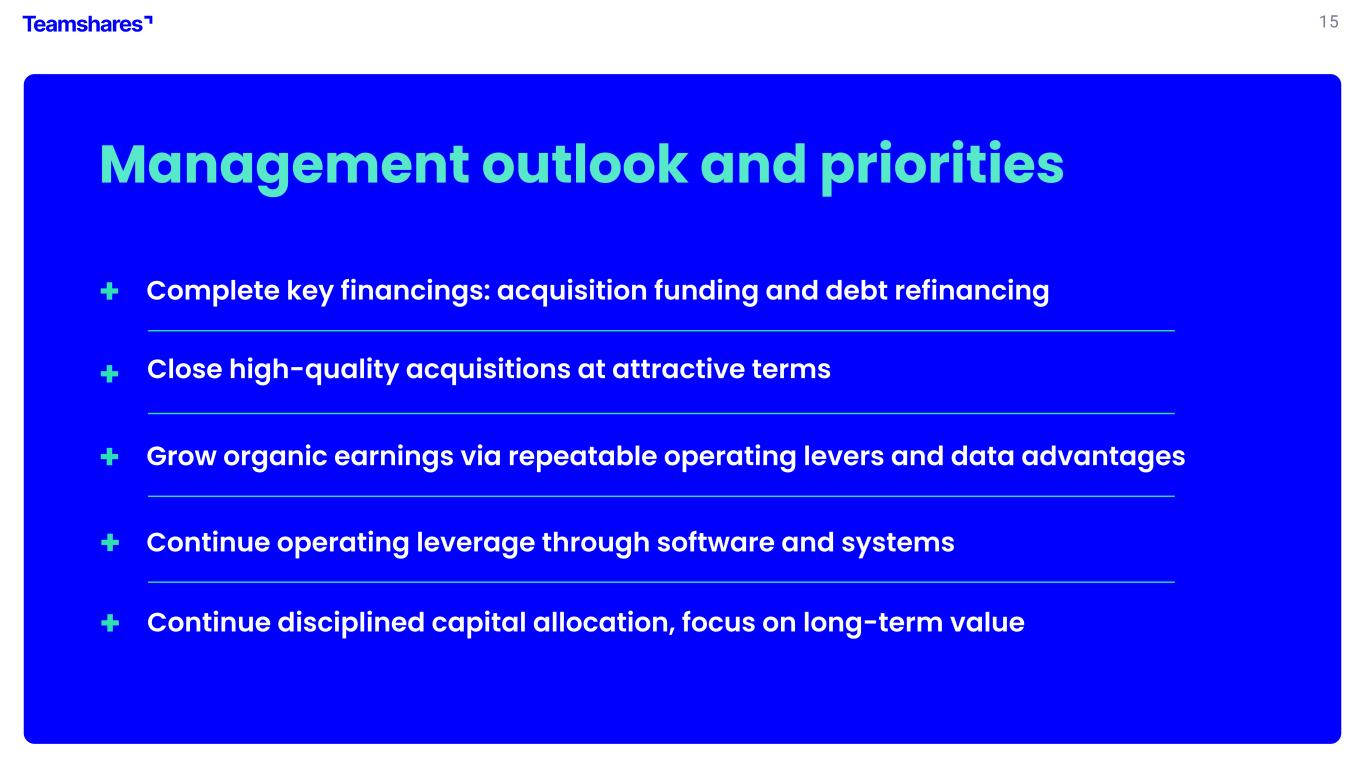
15 Management outlook and priorities + + Continue operating leverage through software and systems + Grow organic earnings via repeatable operating levers and data advantages + Close high-quality acquisitions at attractive terms + Continue disciplined capital allocation, focus on long-term value Complete key financings: acquisition funding and debt refinancing Michael

16 Appendix
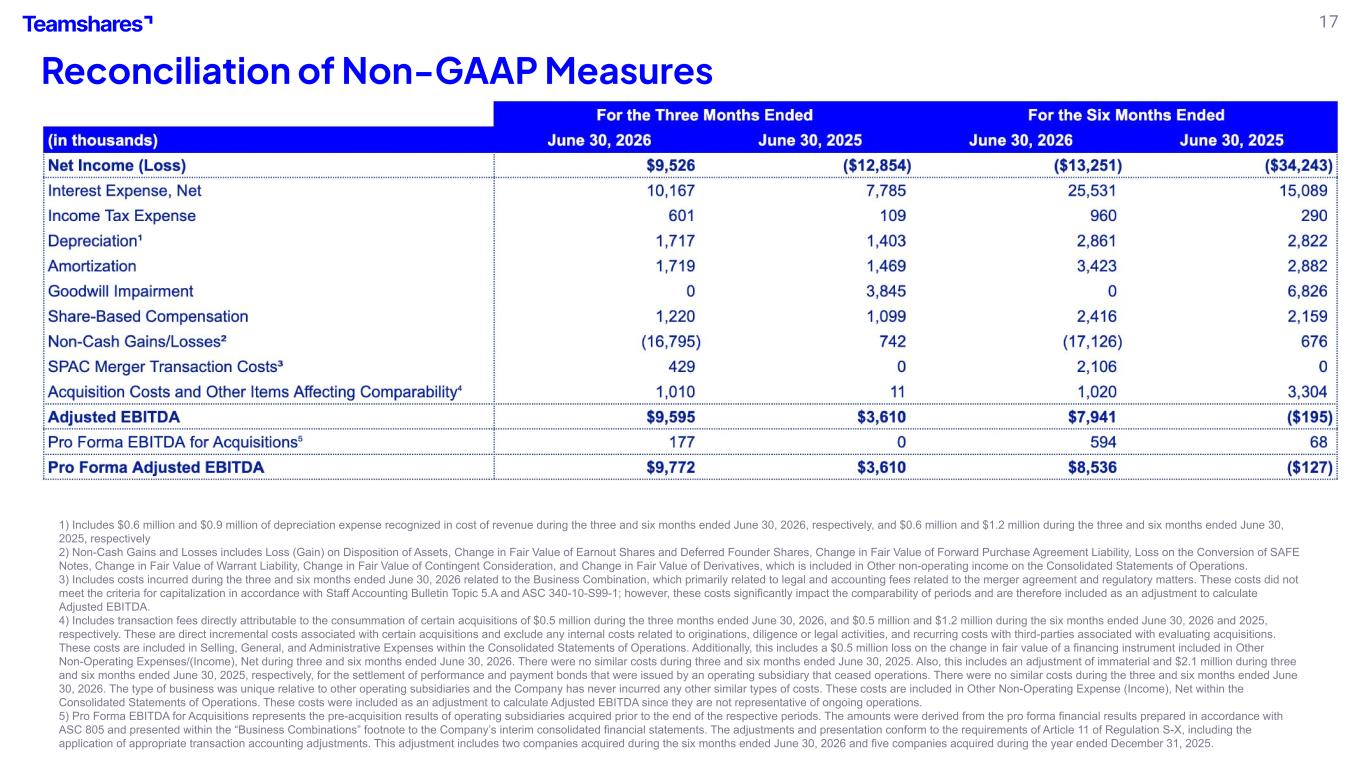
17 Reconciliation of Non-GAAP Measures 1) Includes $0.6 million and $0.9 million of depreciation expense recognized in cost of revenue during the three and six months ended June 30, 2026, respectively, and $0.6 million and $1.2 million during the three and six months ended June 30, 2025, respectively 2) Non-Cash Gains and Losses includes Loss (Gain) on Disposition of Assets, Change in Fair Value of Earnout Shares and Deferred Founder Shares, Change in Fair Value of Forward Purchase Agreement Liability, Loss on the Conversion of SAFE Notes, Change in Fair Value of Warrant Liability, Change in Fair Value of Contingent Consideration, and Change in Fair Value of Derivatives, which is included in Other non-operating income on the Consolidated Statements of Operations. 3) Includes costs incurred during the three and six months ended June 30, 2026 related to the Business Combination, which primarily related to legal and accounting fees related to the merger agreement and regulatory matters. These costs did not meet the criteria for capitalization in accordance with Staff Accounting Bulletin Topic 5.A and ASC 340-10-S99-1; however, these costs significantly impact the comparability of periods and are therefore included as an adjustment to calculate Adjusted EBITDA. 4) Includes transaction fees directly attributable to the consummation of certain acquisitions of $0.5 million during the three months ended June 30, 2026, and $0.5 million and $1.2 million during the six months ended June 30, 2026 and 2025, respectively. These are direct incremental costs associated with certain acquisitions and exclude any internal costs related to originations, diligence or legal activities, and recurring costs with third-parties associated with evaluating acquisitions. These costs are included in Selling, General, and Administrative Expenses within the Consolidated Statements of Operations. Additionally, this includes a $0.5 million loss on the change in fair value of a financing instrument included in Other Non-Operating Expenses/(Income), Net during three and six months ended June 30, 2026. There were no similar costs during three and six months ended June 30, 2025. Also, this includes an adjustment of immaterial and $2.1 million during three and six months ended June 30, 2025, respectively, for the settlement of performance and payment bonds that were issued by an operating subsidiary that ceased operations. There were no similar costs during the three and six months ended June 30, 2026. The type of business was unique relative to other operating subsidiaries and the Company has never incurred any other similar types of costs. These costs are included in Other Non-Operating Expense (Income), Net within the Consolidated Statements of Operations. These costs were included as an adjustment to calculate Adjusted EBITDA since they are not representative of ongoing operations. 5) Pro Forma EBITDA for Acquisitions represents the pre-acquisition results of operating subsidiaries acquired prior to the end of the respective periods. The amounts were derived from the pro forma financial results prepared in accordance with ASC 805 and presented within the “Business Combinations” footnote to the Company’s interim consolidated financial statements. The adjustments and presentation conform to the requirements of Article 11 of Regulation S-X, including the application of appropriate transaction accounting adjustments. This adjustment includes two companies acquired during the six months ended June 30, 2026 and five companies acquired during the year ended December 31, 2025.
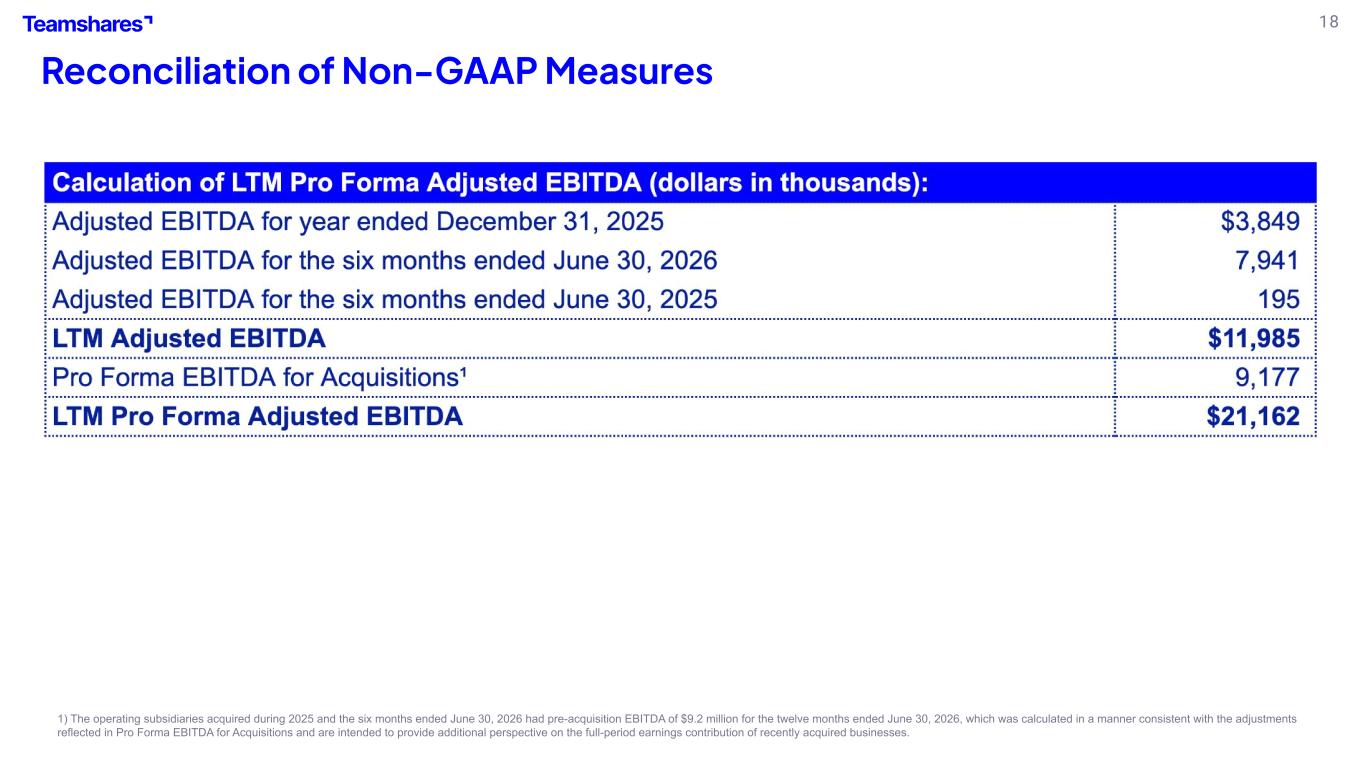
18 Reconciliation of Non-GAAP Measures 1) The operating subsidiaries acquired during 2025 and the six months ended June 30, 2026 had pre-acquisition EBITDA of $9.2 million for the twelve months ended June 30, 2026, which was calculated in a manner consistent with the adjustments reflected in Pro Forma EBITDA for Acquisitions and are intended to provide additional perspective on the full-period earnings contribution of recently acquired businesses.
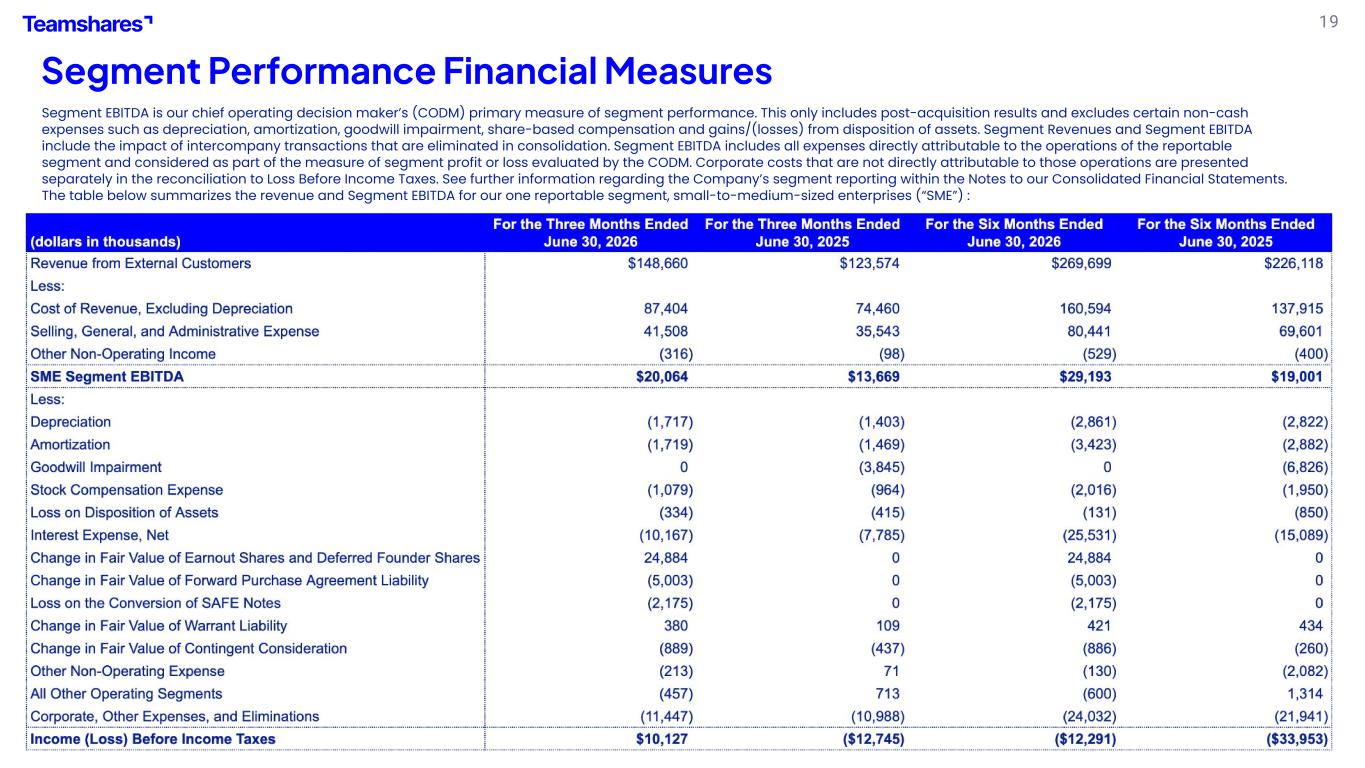
19 Segment Performance Financial Measures Segment EBITDA is our chief operating decision maker’s (CODM) primary measure of segment performance. This only includes post-acquisition results and excludes certain non-cash expenses such as depreciation, amortization, goodwill impairment, share-based compensation and gains/(losses) from disposition of assets. Segment Revenues and Segment EBITDA include the impact of intercompany transactions that are eliminated in consolidation. Segment EBITDA includes all expenses directly attributable to the operations of the reportable segment and considered as part of the measure of segment profit or loss evaluated by the CODM. Corporate costs that are not directly attributable to those operations are presented separately in the reconciliation to Loss Before Income Taxes. See further information regarding the Company’s segment reporting within the Notes to our Consolidated Financial Statements. The table below summarizes the revenue and Segment EBITDA for our one reportable segment, small-to-medium-sized enterprises (“SME”) :

20 It’s still Day One at