Second Quarter 2026 EARNINGS RELEASE NASDAQ: ONDS | August 13, 2026 Copyright 2026. All rights reserved.
This presentation may contain "forward-looking statements" as that term is defined under the Private Securities Litigation Reform Act of 1995 (PSLRA), which statements may be identified by words such as "expects," "projects," "will," "may," "anticipates," "believes," "should," "intends," "estimates," and other words of similar meaning. Ondas Inc. (“Ondas” or the “Company”) cautions readers that forward-looking statements are predictions based on its current expectations about future events. These forward-looking statements are not guarantees of future performance and are subject to risks, uncertainties and assumptions that are difficult to predict. The Company’s actual results, performance, or achievements could differ materially from those expressed or implied by the forward-looking statements as a result of a number of factors, including, the risks discussed under the heading “Risk Factors” in the Company’s most recent Annual Report on Form 10-K filed with the U.S. Securities and Exchange Commission (“SEC”), in the Company’s Quarterly Reports on Form 10-Q filed with the SEC, and in the Company’s other filings with the SEC. The Company undertakes no obligation to publicly update or revise any forward- looking statements, whether as a result of new information, future events or otherwise that occur after that date, except as required by law. This presentation also contains estimates and other information concerning our industry that are based on industry publications, surveys and forecasts. This information involves a number of assumptions and limitations, and we have not independently verified the accuracy or completeness of the information. This presentation includes Non-GAAP financial measures. Please see the "Non-GAAP Financial Measures" section. Information in this presentation is not an offer to sell securities or the solicitation of an offer to buy securities, nor shall there be any sale of securities in any jurisdiction in which such offer, solicitation or sale would be unlawful prior to registration or qualification under the securities laws of such jurisdiction. Disclaimers
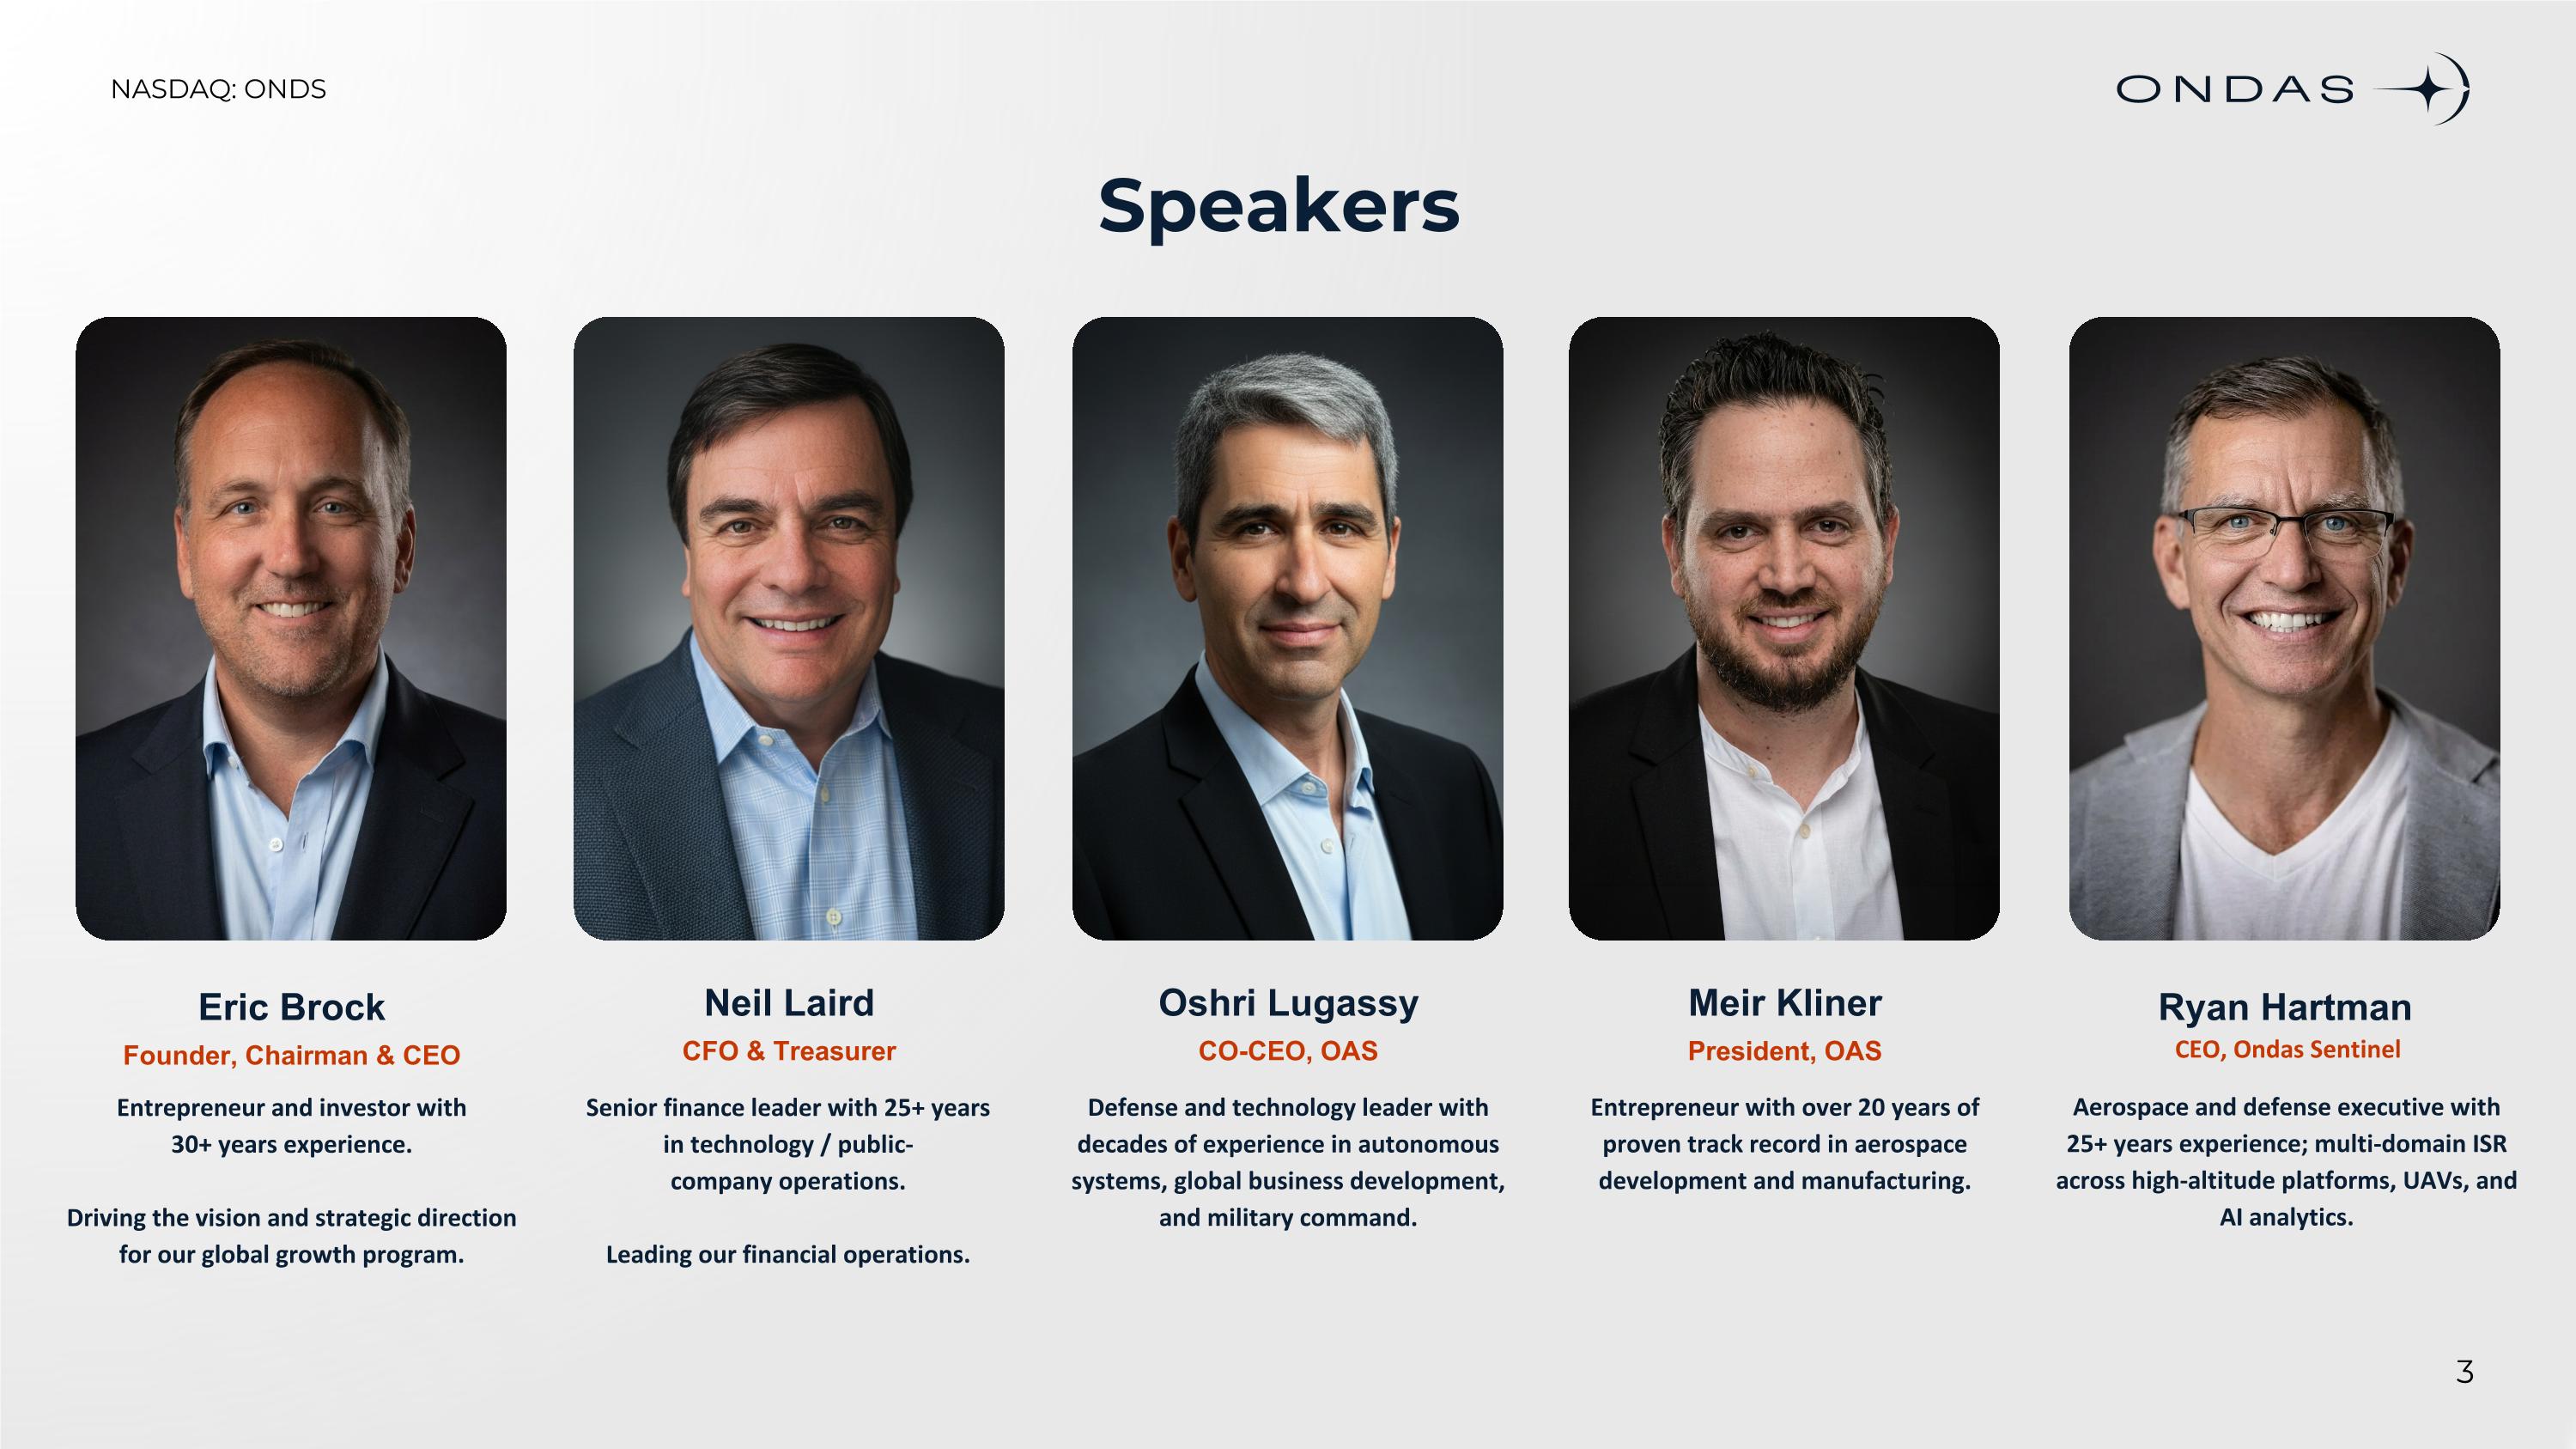
Speakers Eric Brock Founder, Chairman & CEO Entrepreneur and investor with 30+ years experience. Driving the vision and strategic direction for our global growth program. Neil Laird CFO & Treasurer Senior finance leader with 25+ years in technology / public- company operations. Leading our financial operations. Meir Kliner President, OAS Entrepreneur with over 20 years of proven track record in aerospace development and manufacturing. Oshri Lugassy CO-CEO, OAS Defense and technology leader with decades of experience in autonomous systems, global business development, and military command. Ryan Hartman CEO, Ondas Sentinel Aerospace and defense executive with 25+ years experience; multi-domain ISR across high-altitude platforms, UAVs, and AI analytics.
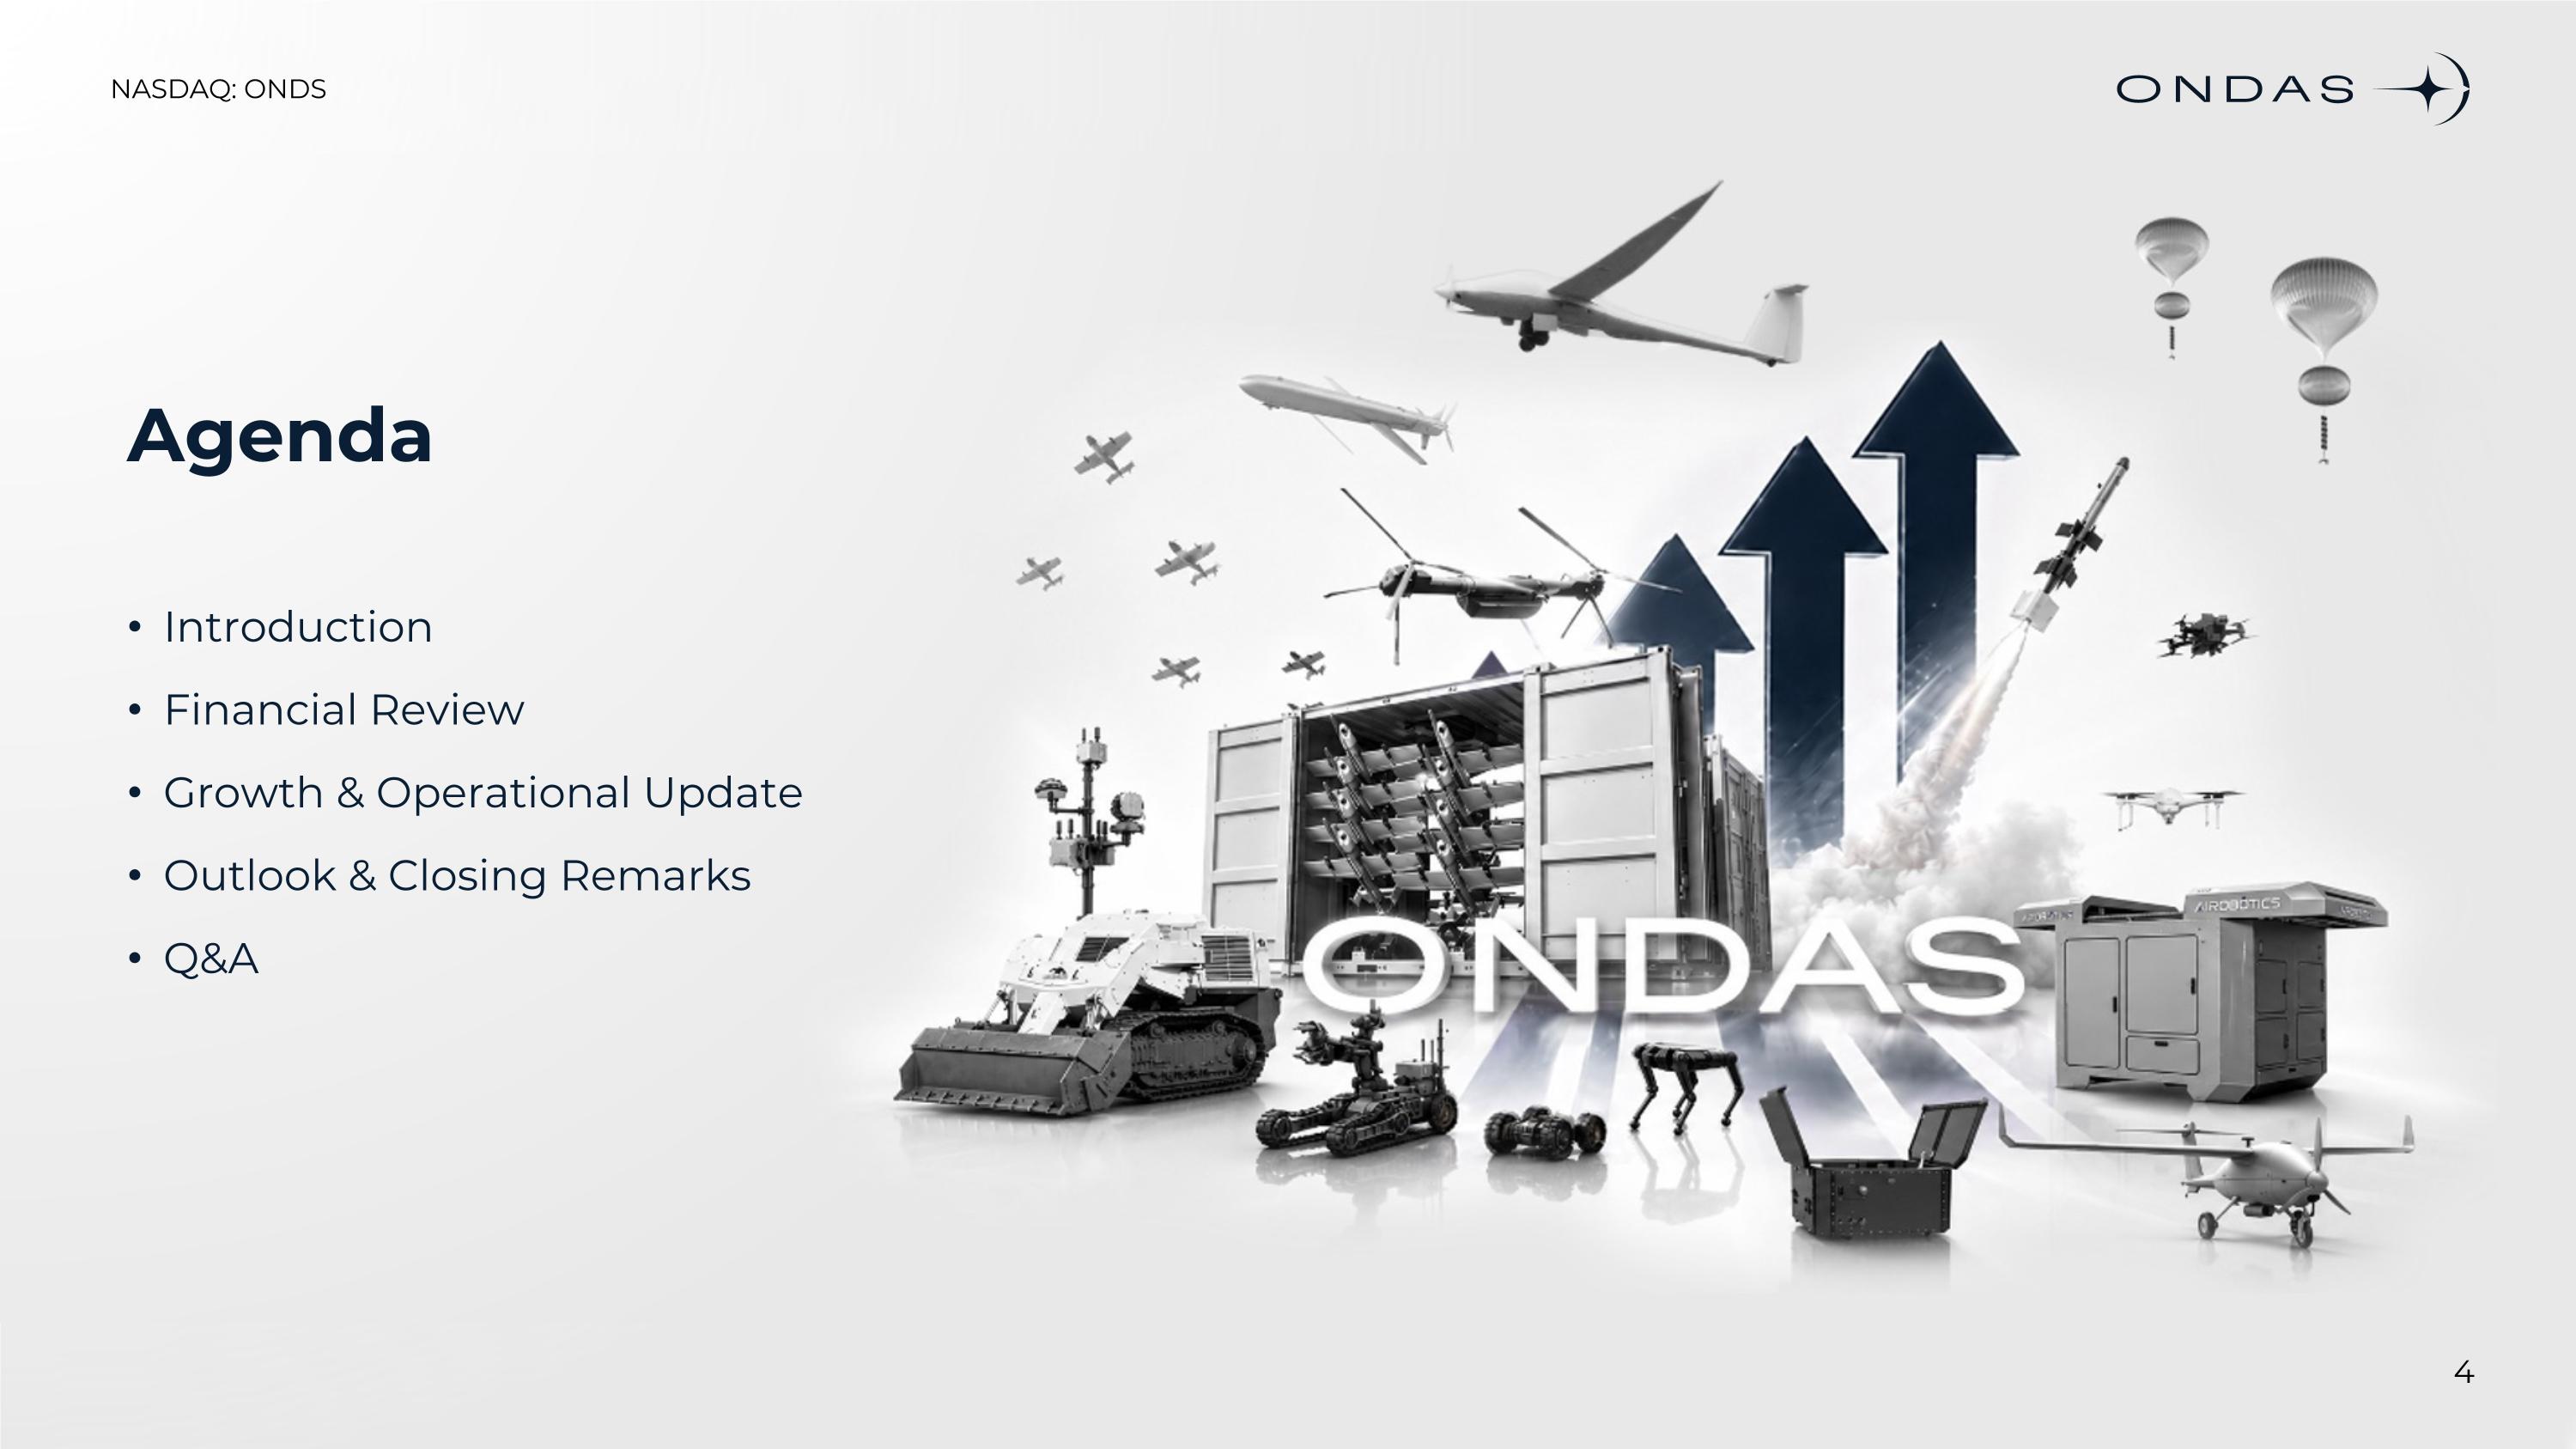
Agenda Introduction Financial Review Growth & Operational Update Outlook & Closing Remarks Q&A
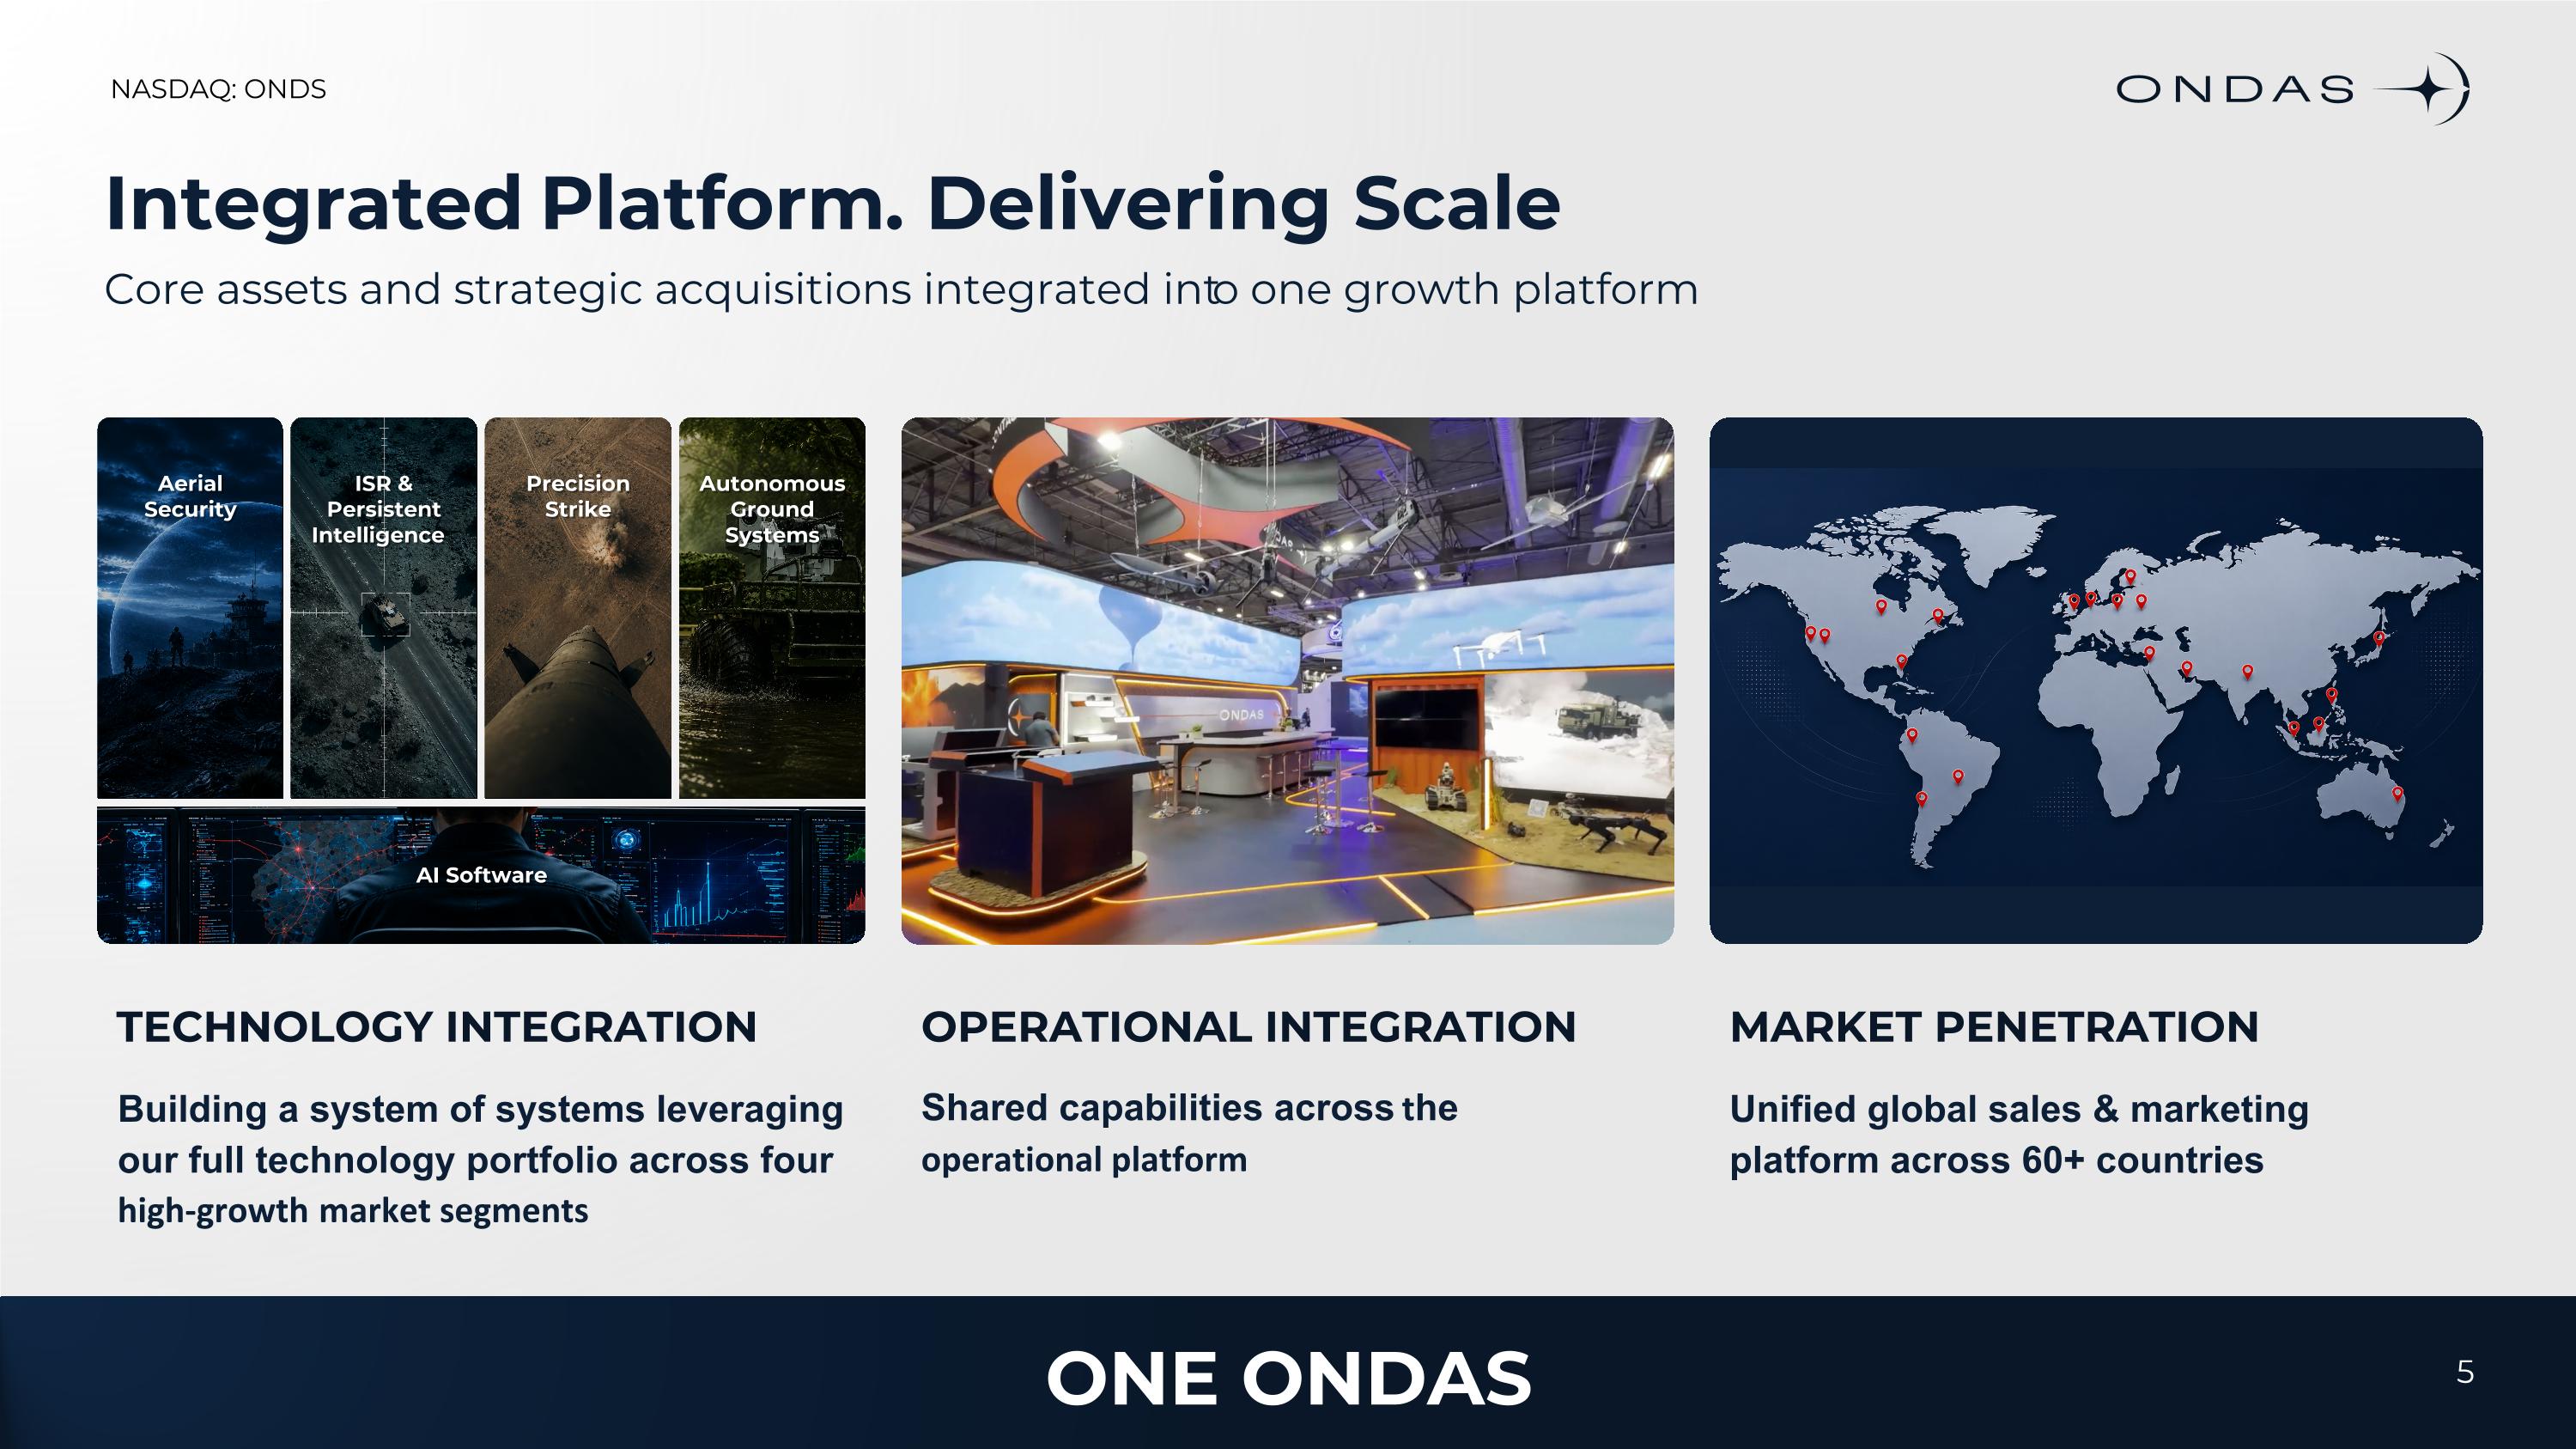
Integrated Platform. Delivering Scale Building a system of systems leveraging our full technology portfolio across four high-growth market segments TECHNOLOGY INTEGRATION Unified global sales & marketing platform across 60+ countries MARKET PENETRATION Core assets and strategic acquisitions integrated into one growth platform OPERATIONAL INTEGRATION Shared capabilities across the operational platform ISR & Persistent Intelligence Precision Strike Aerial Security Autonomous Ground Systems AI Software ONE ONDAS 5
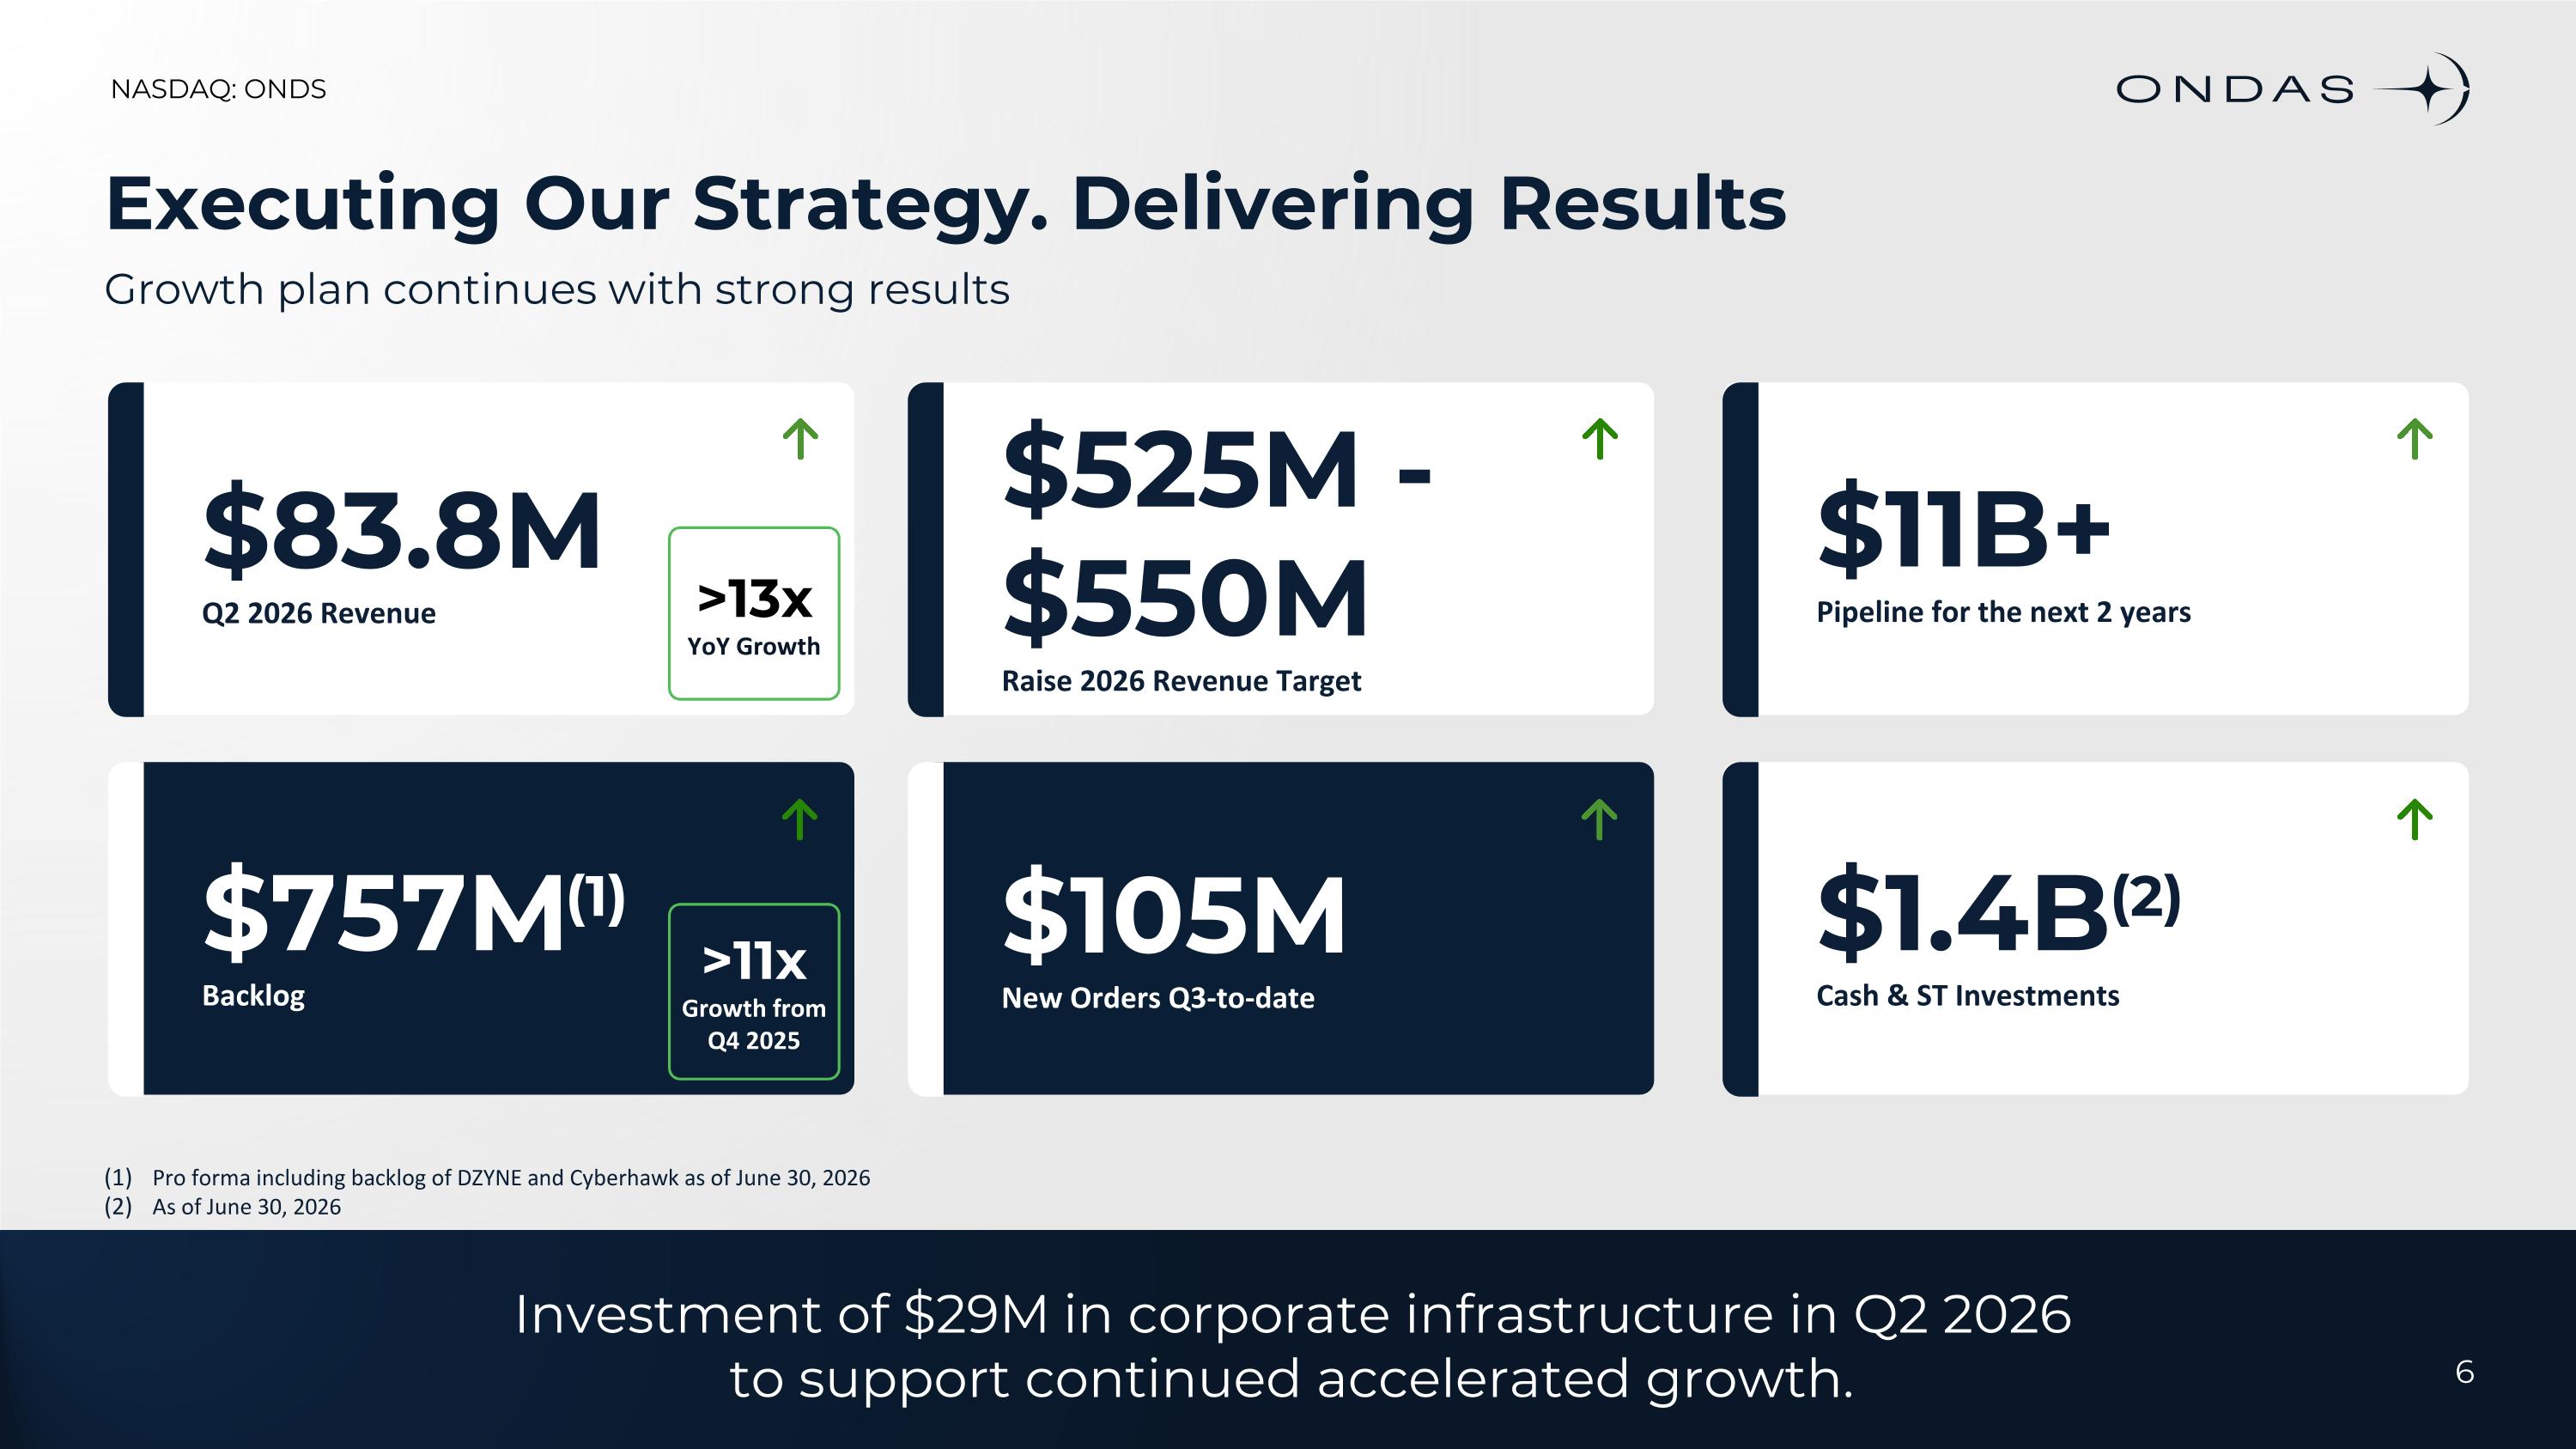
Executing Our Strategy. Delivering Results Growth plan continues with strong results Pro forma including backlog of DZYNE and Cyberhawk as of June 30, 2026 As of June 30, 2026 Investment of $29M in corporate infrastructure in Q2 2026 to support continued accelerated growth. $83.8M Q2 2026 Revenue $757M(1) Backlog $525M - $550M Raise 2026 Revenue Target $1.4B(2) Cash & ST Investments $11B+ Pipeline for the next 2 years >13x YoY Growth $105M New Orders Q3-to-date >11x Growth from Q4 2025 6
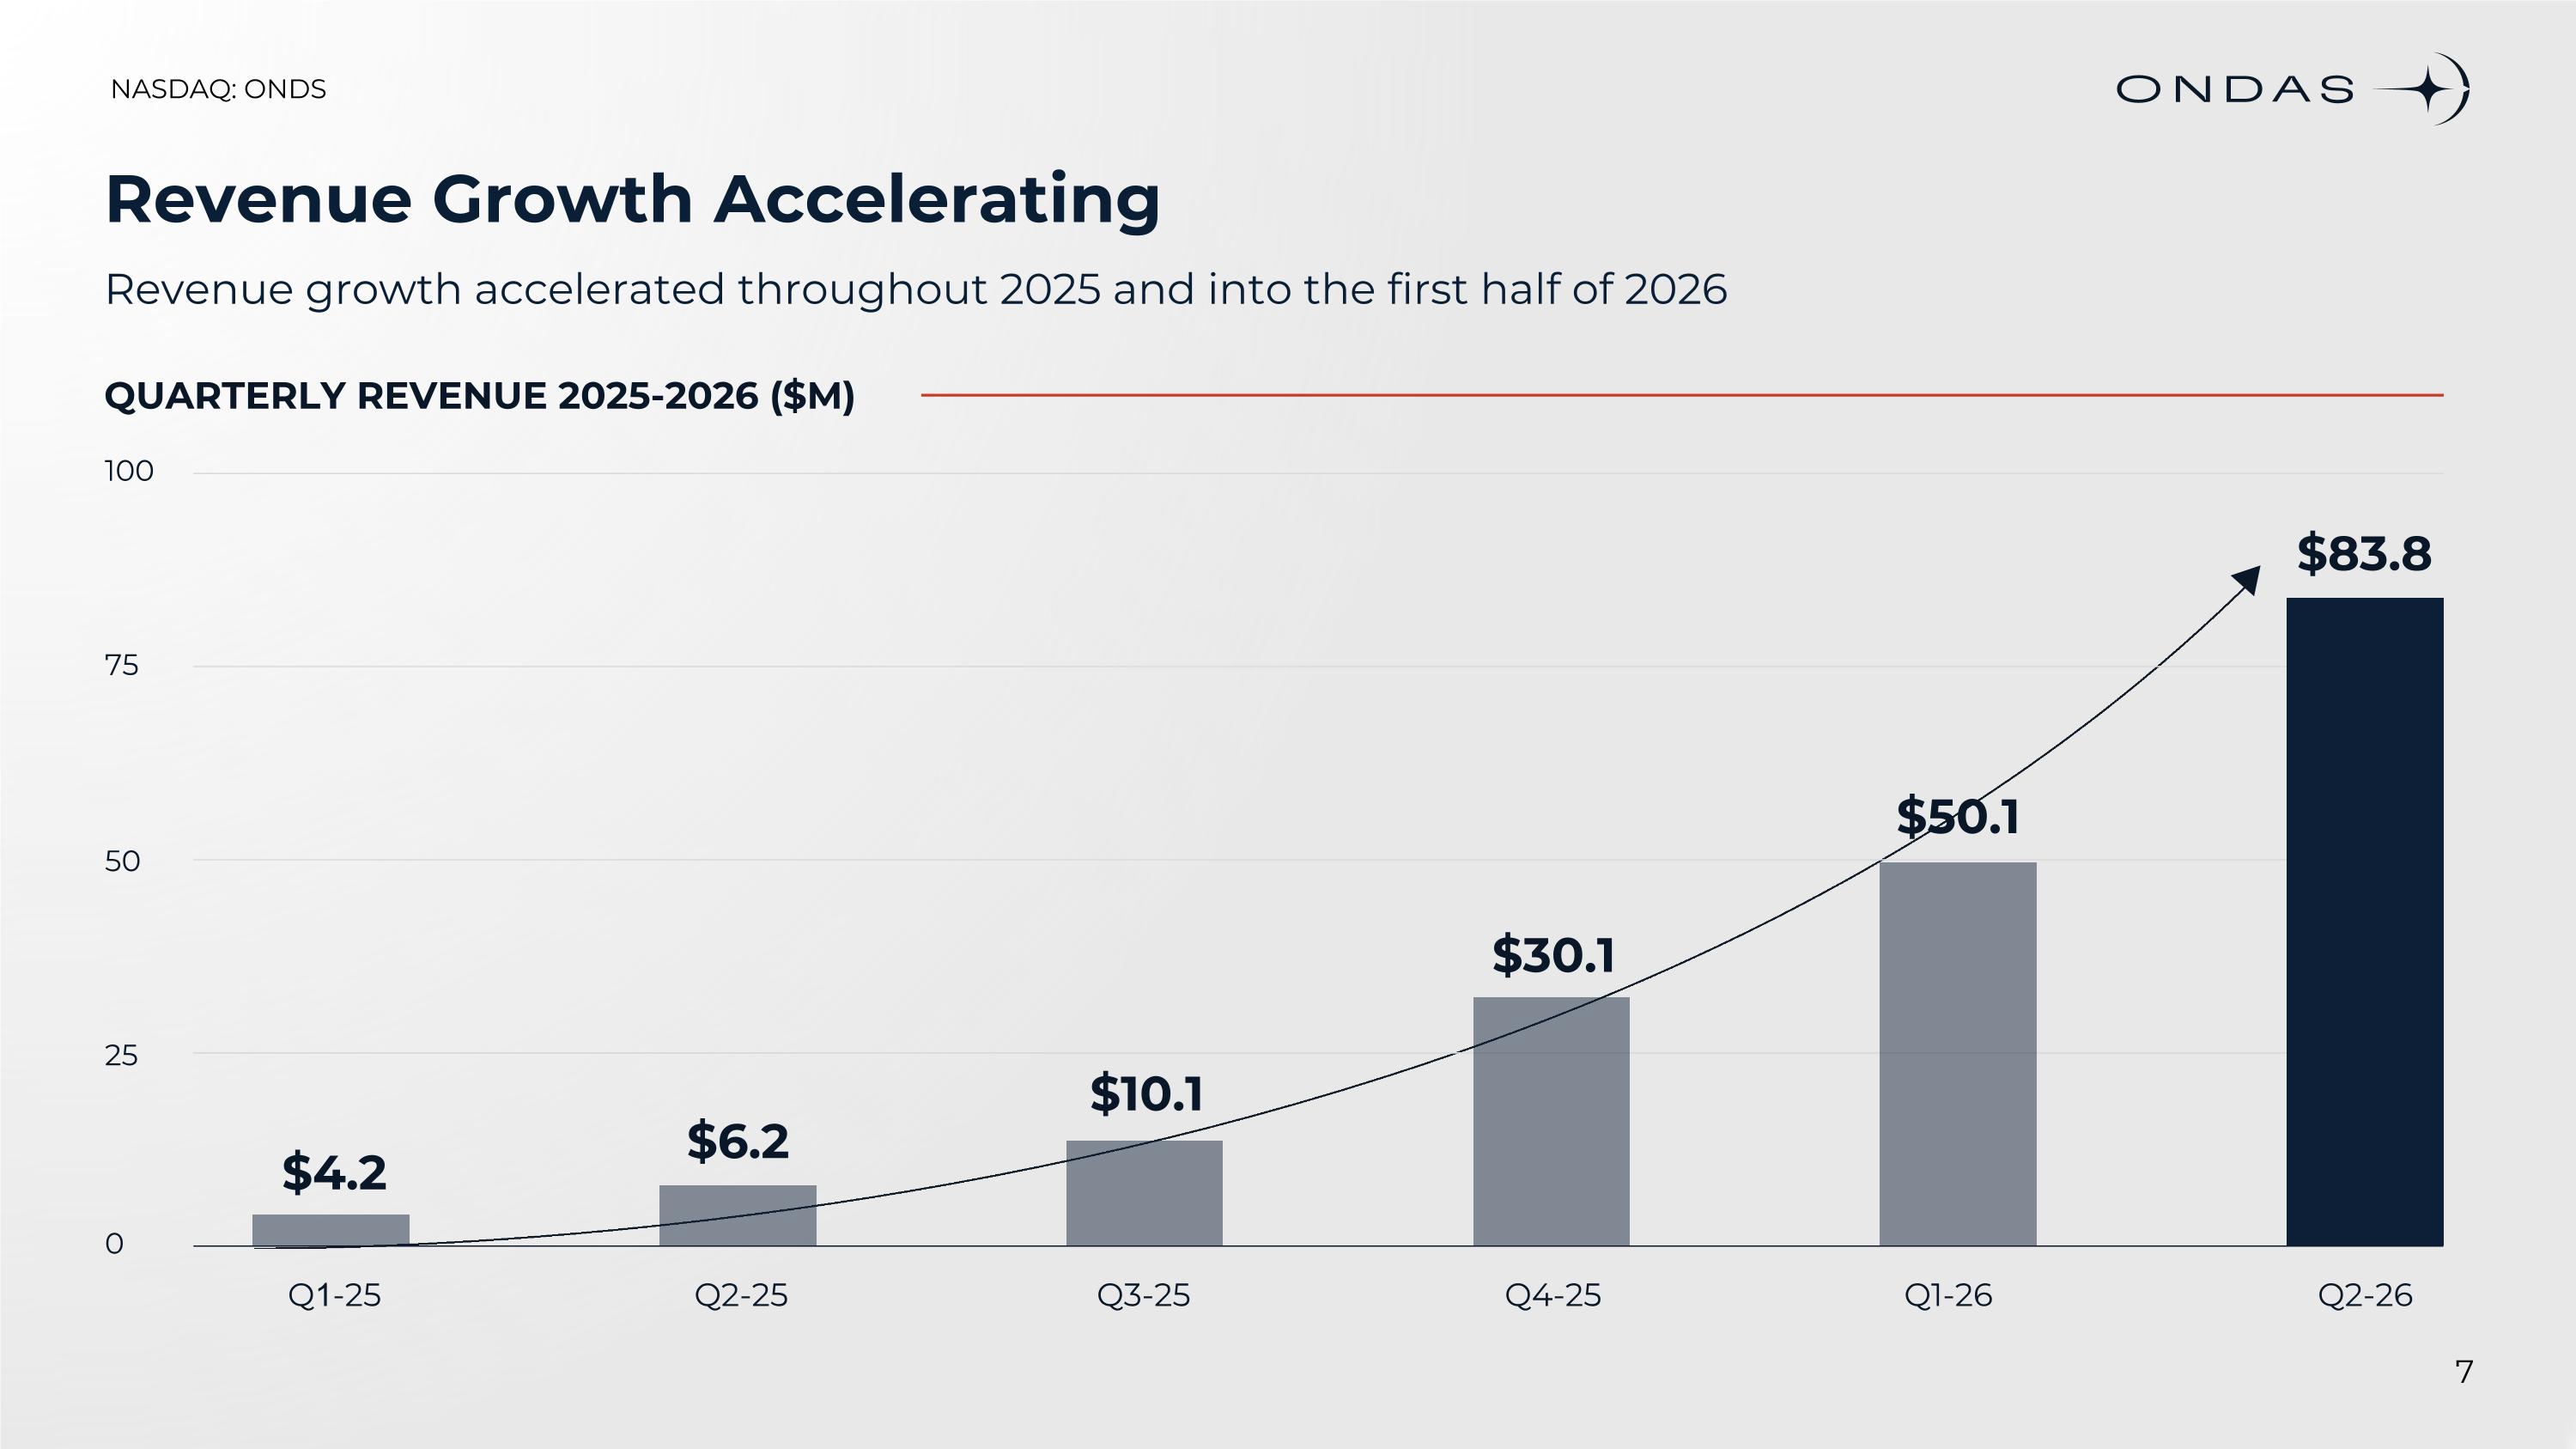
Revenue Growth Accelerating Revenue growth accelerated throughout 2025 and into the first half of 2026 Q1-25 Q2-25 Q3-25 Q4-25 Q1-26 Q2-26 QUARTERLY REVENUE 2025-2026 ($M) 0 25 50 75 100 $83.8 $50.1 $30.1 $10.1 $6.2 $4.2
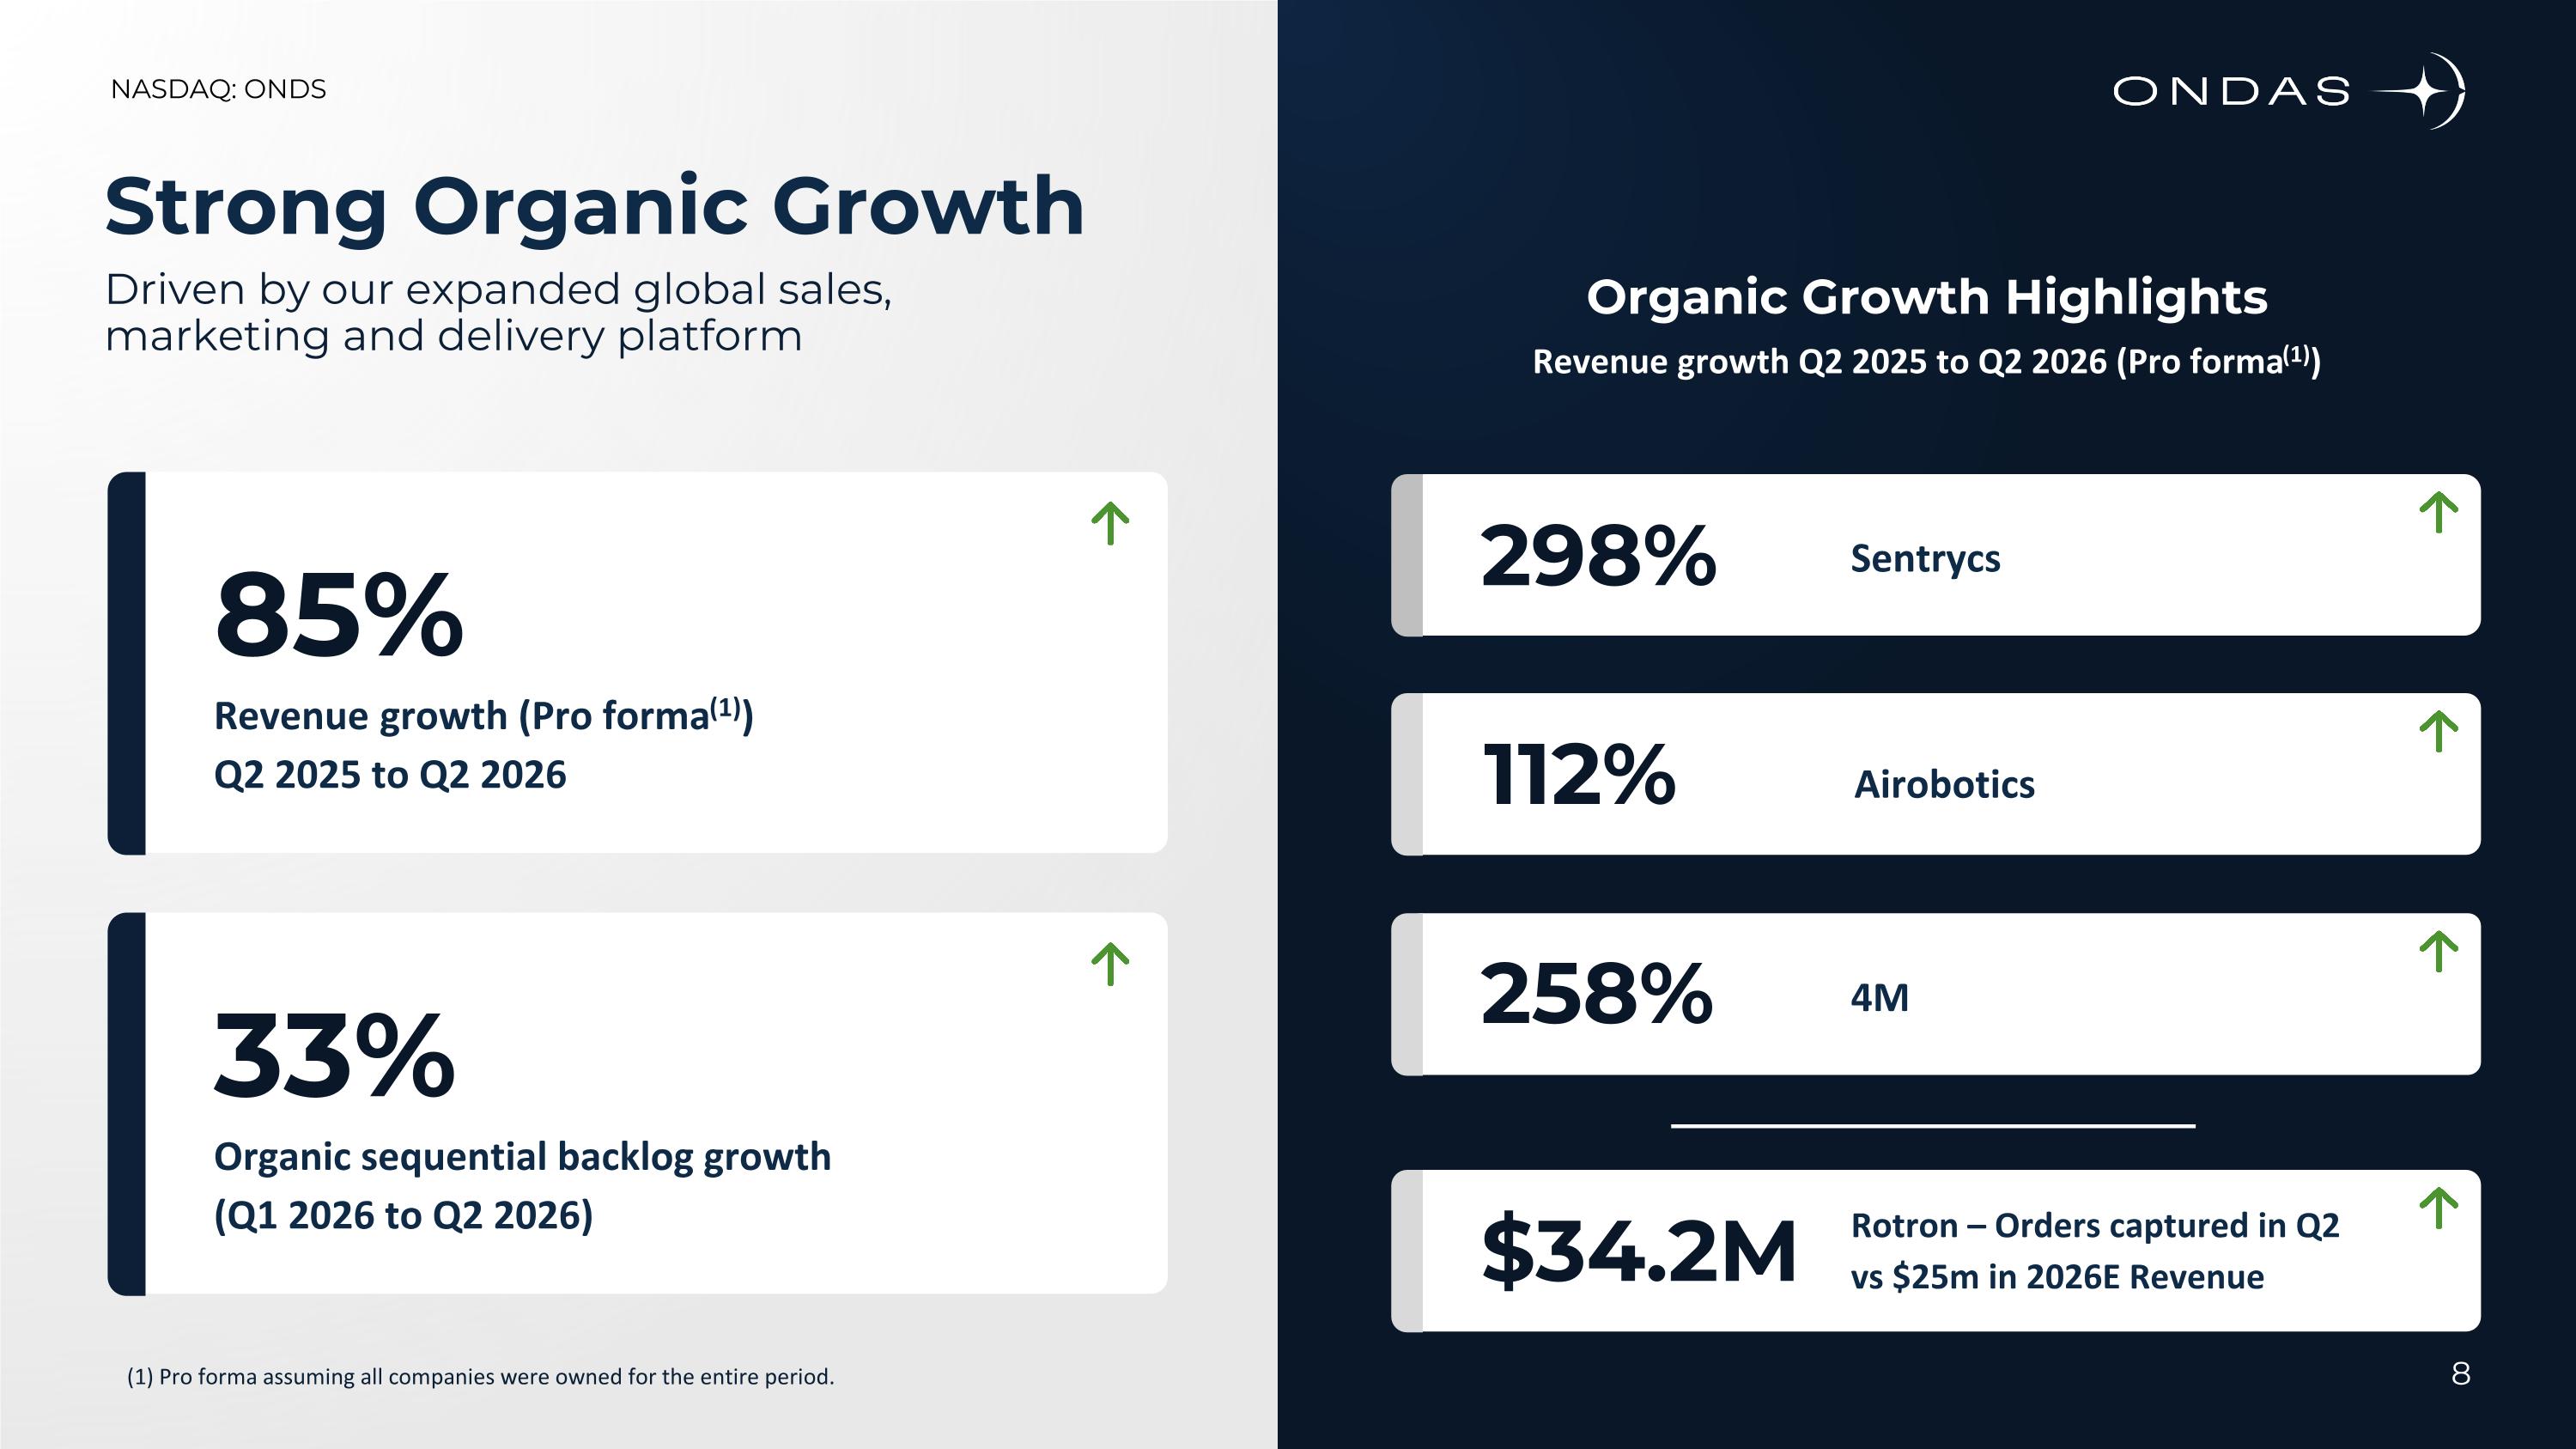
Strong Organic Growth Driven by our expanded global sales, marketing and delivery platform (1) Pro forma assuming all companies were owned for the entire period. 85% Revenue growth (Pro forma(1)) Q2 2025 to Q2 2026 33% Organic sequential backlog growth (Q1 2026 to Q2 2026) Organic Growth Highlights Revenue growth Q2 2025 to Q2 2026 (Pro forma(1)) 8 298% Sentrycs 112% Airobotics 258% 4M $34.2M Rotron – Orders captured in Q2 vs $25m in 2026E Revenue
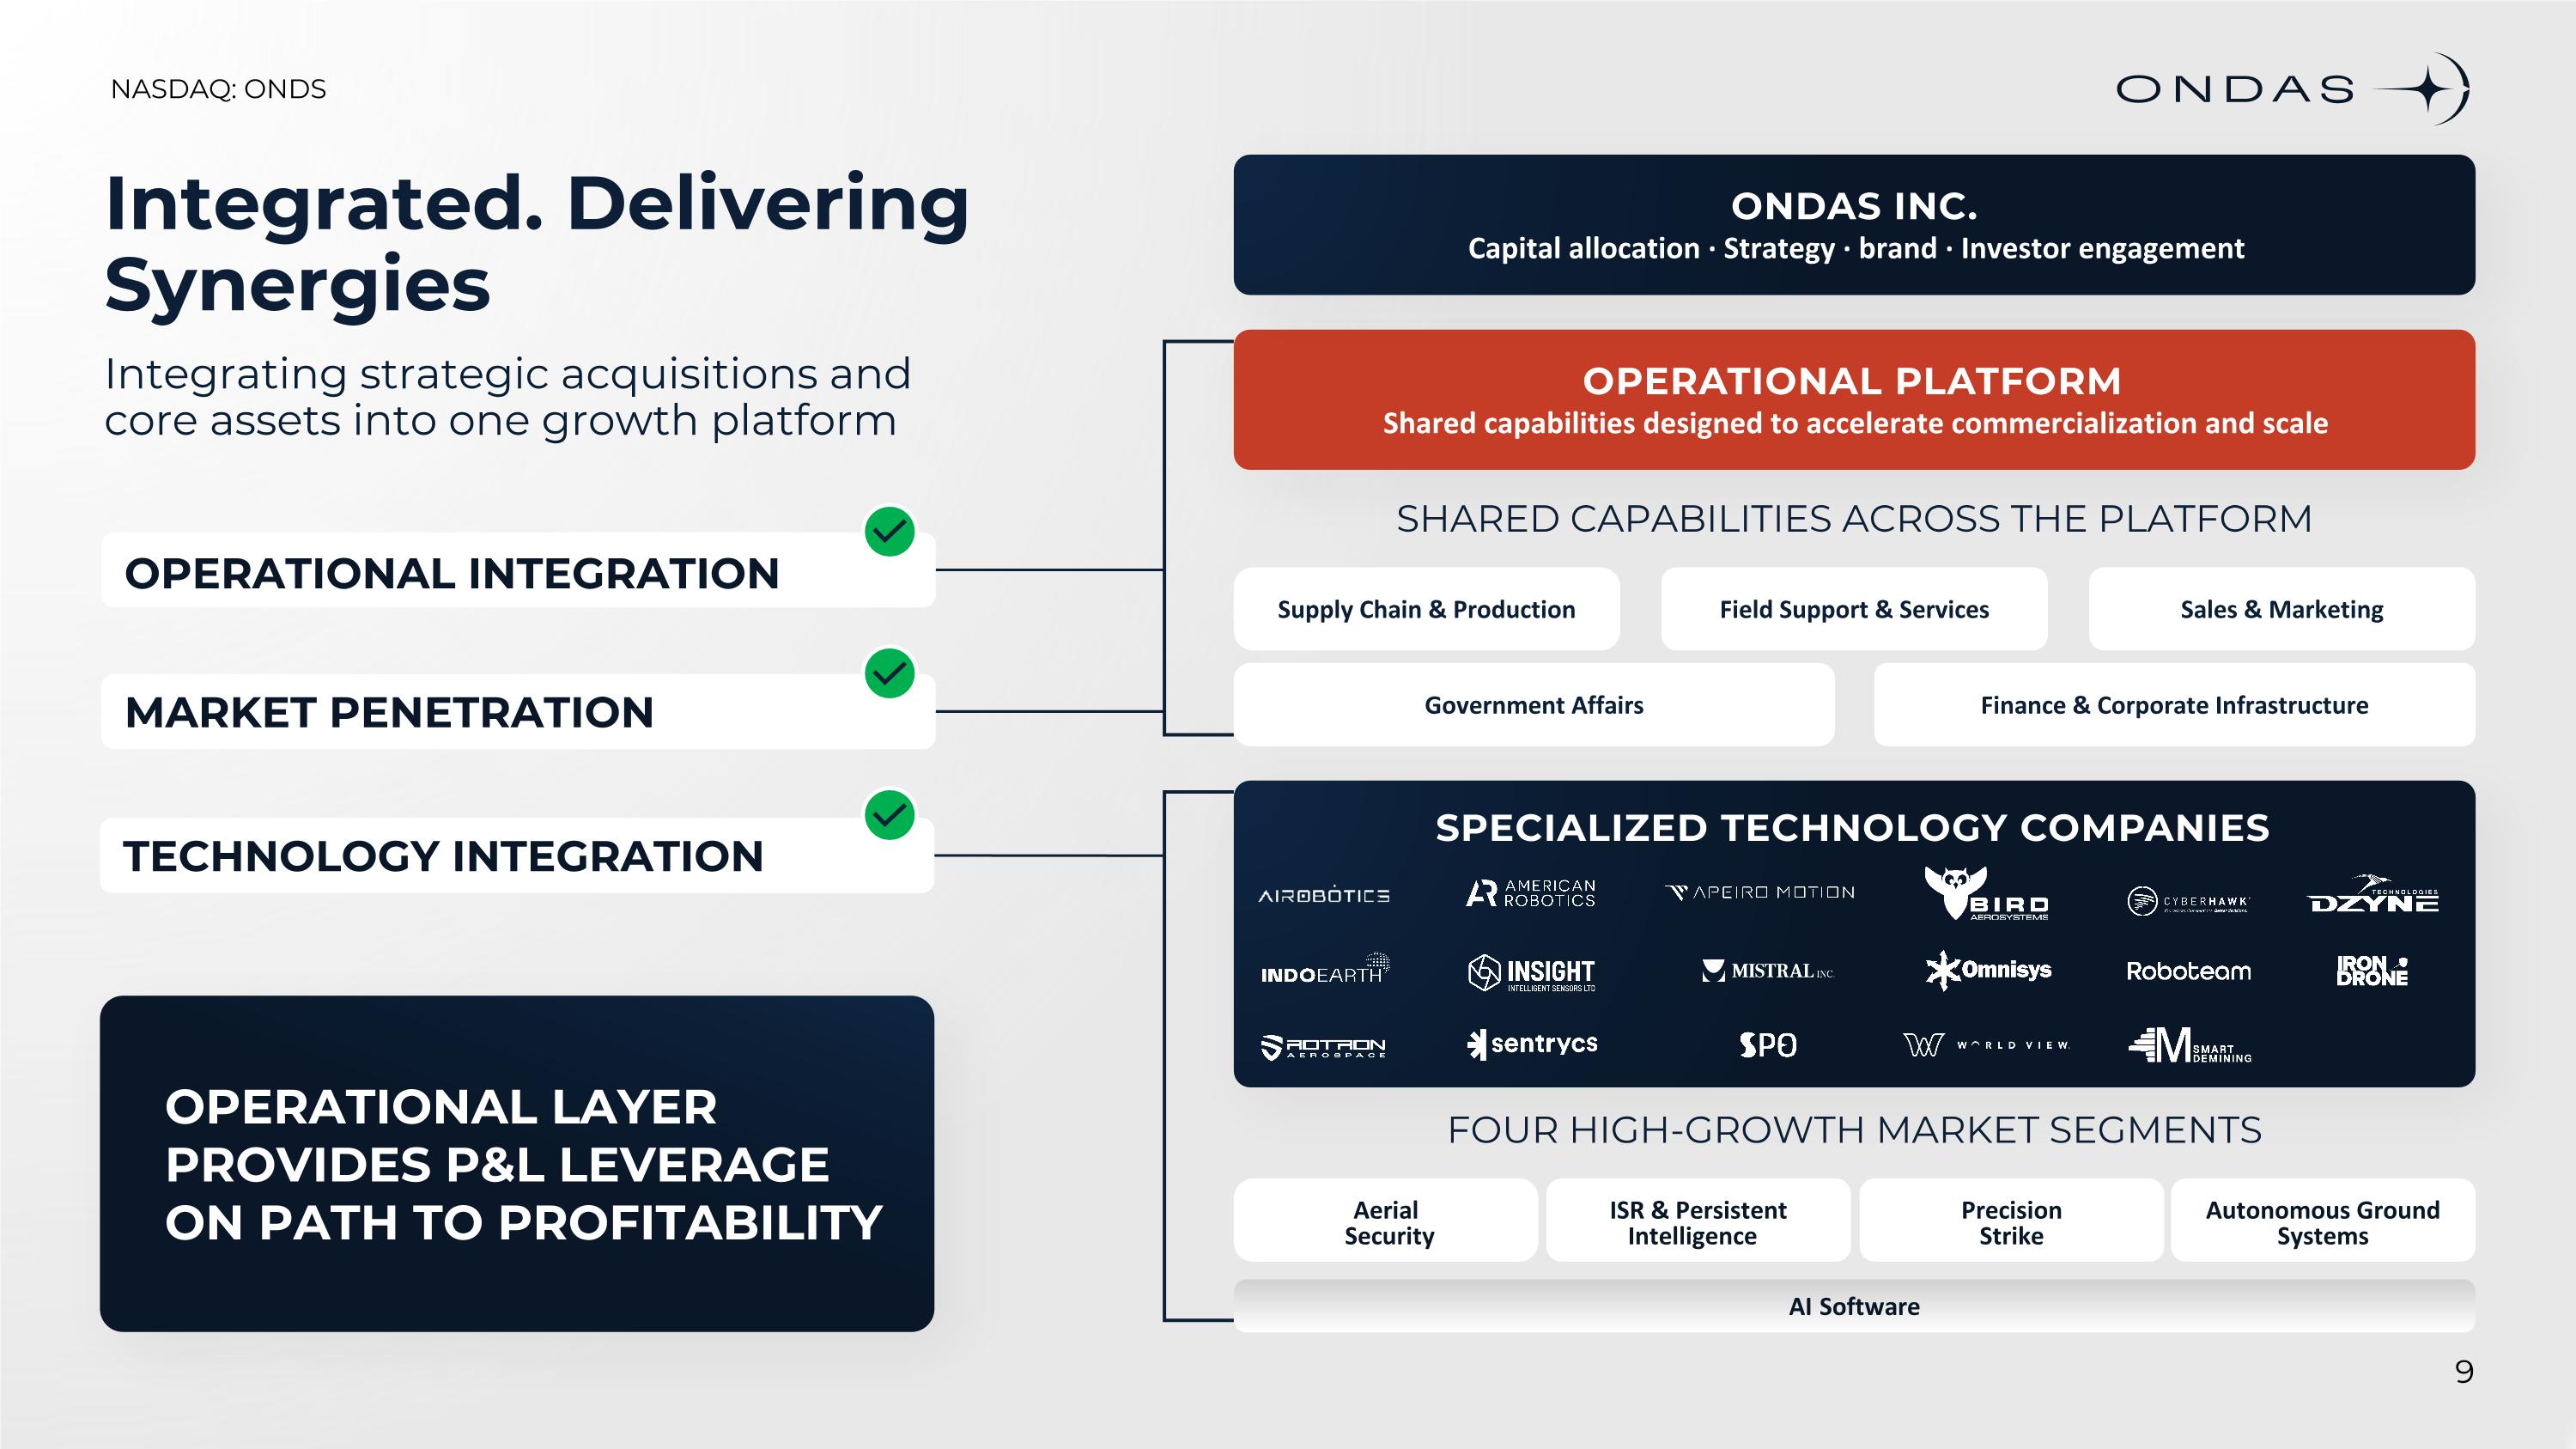
OPERATIONAL LAYER PROVIDES P&L LEVERAGE ON PATH TO PROFITABILITY Integrated. Delivering Synergies Integrating strategic acquisitions and core assets into one growth platform Supply Chain & Production Field Support & Services Sales & Marketing Government Affairs Finance & Corporate Infrastructure OPERATIONAL PLATFORM Shared capabilities designed to accelerate commercialization and scale ONDAS INC. Capital allocation · Strategy · brand · Investor engagement SPECIALIZED TECHNOLOGY COMPANIES SHARED CAPABILITIES ACROSS THE PLATFORM FOUR HIGH-GROWTH MARKET SEGMENTS Aerial Security ISR & Persistent Intelligence Precision Strike Autonomous Ground Systems AI Software MARKET PENETRATION TECHNOLOGY INTEGRATION OPERATIONAL INTEGRATION
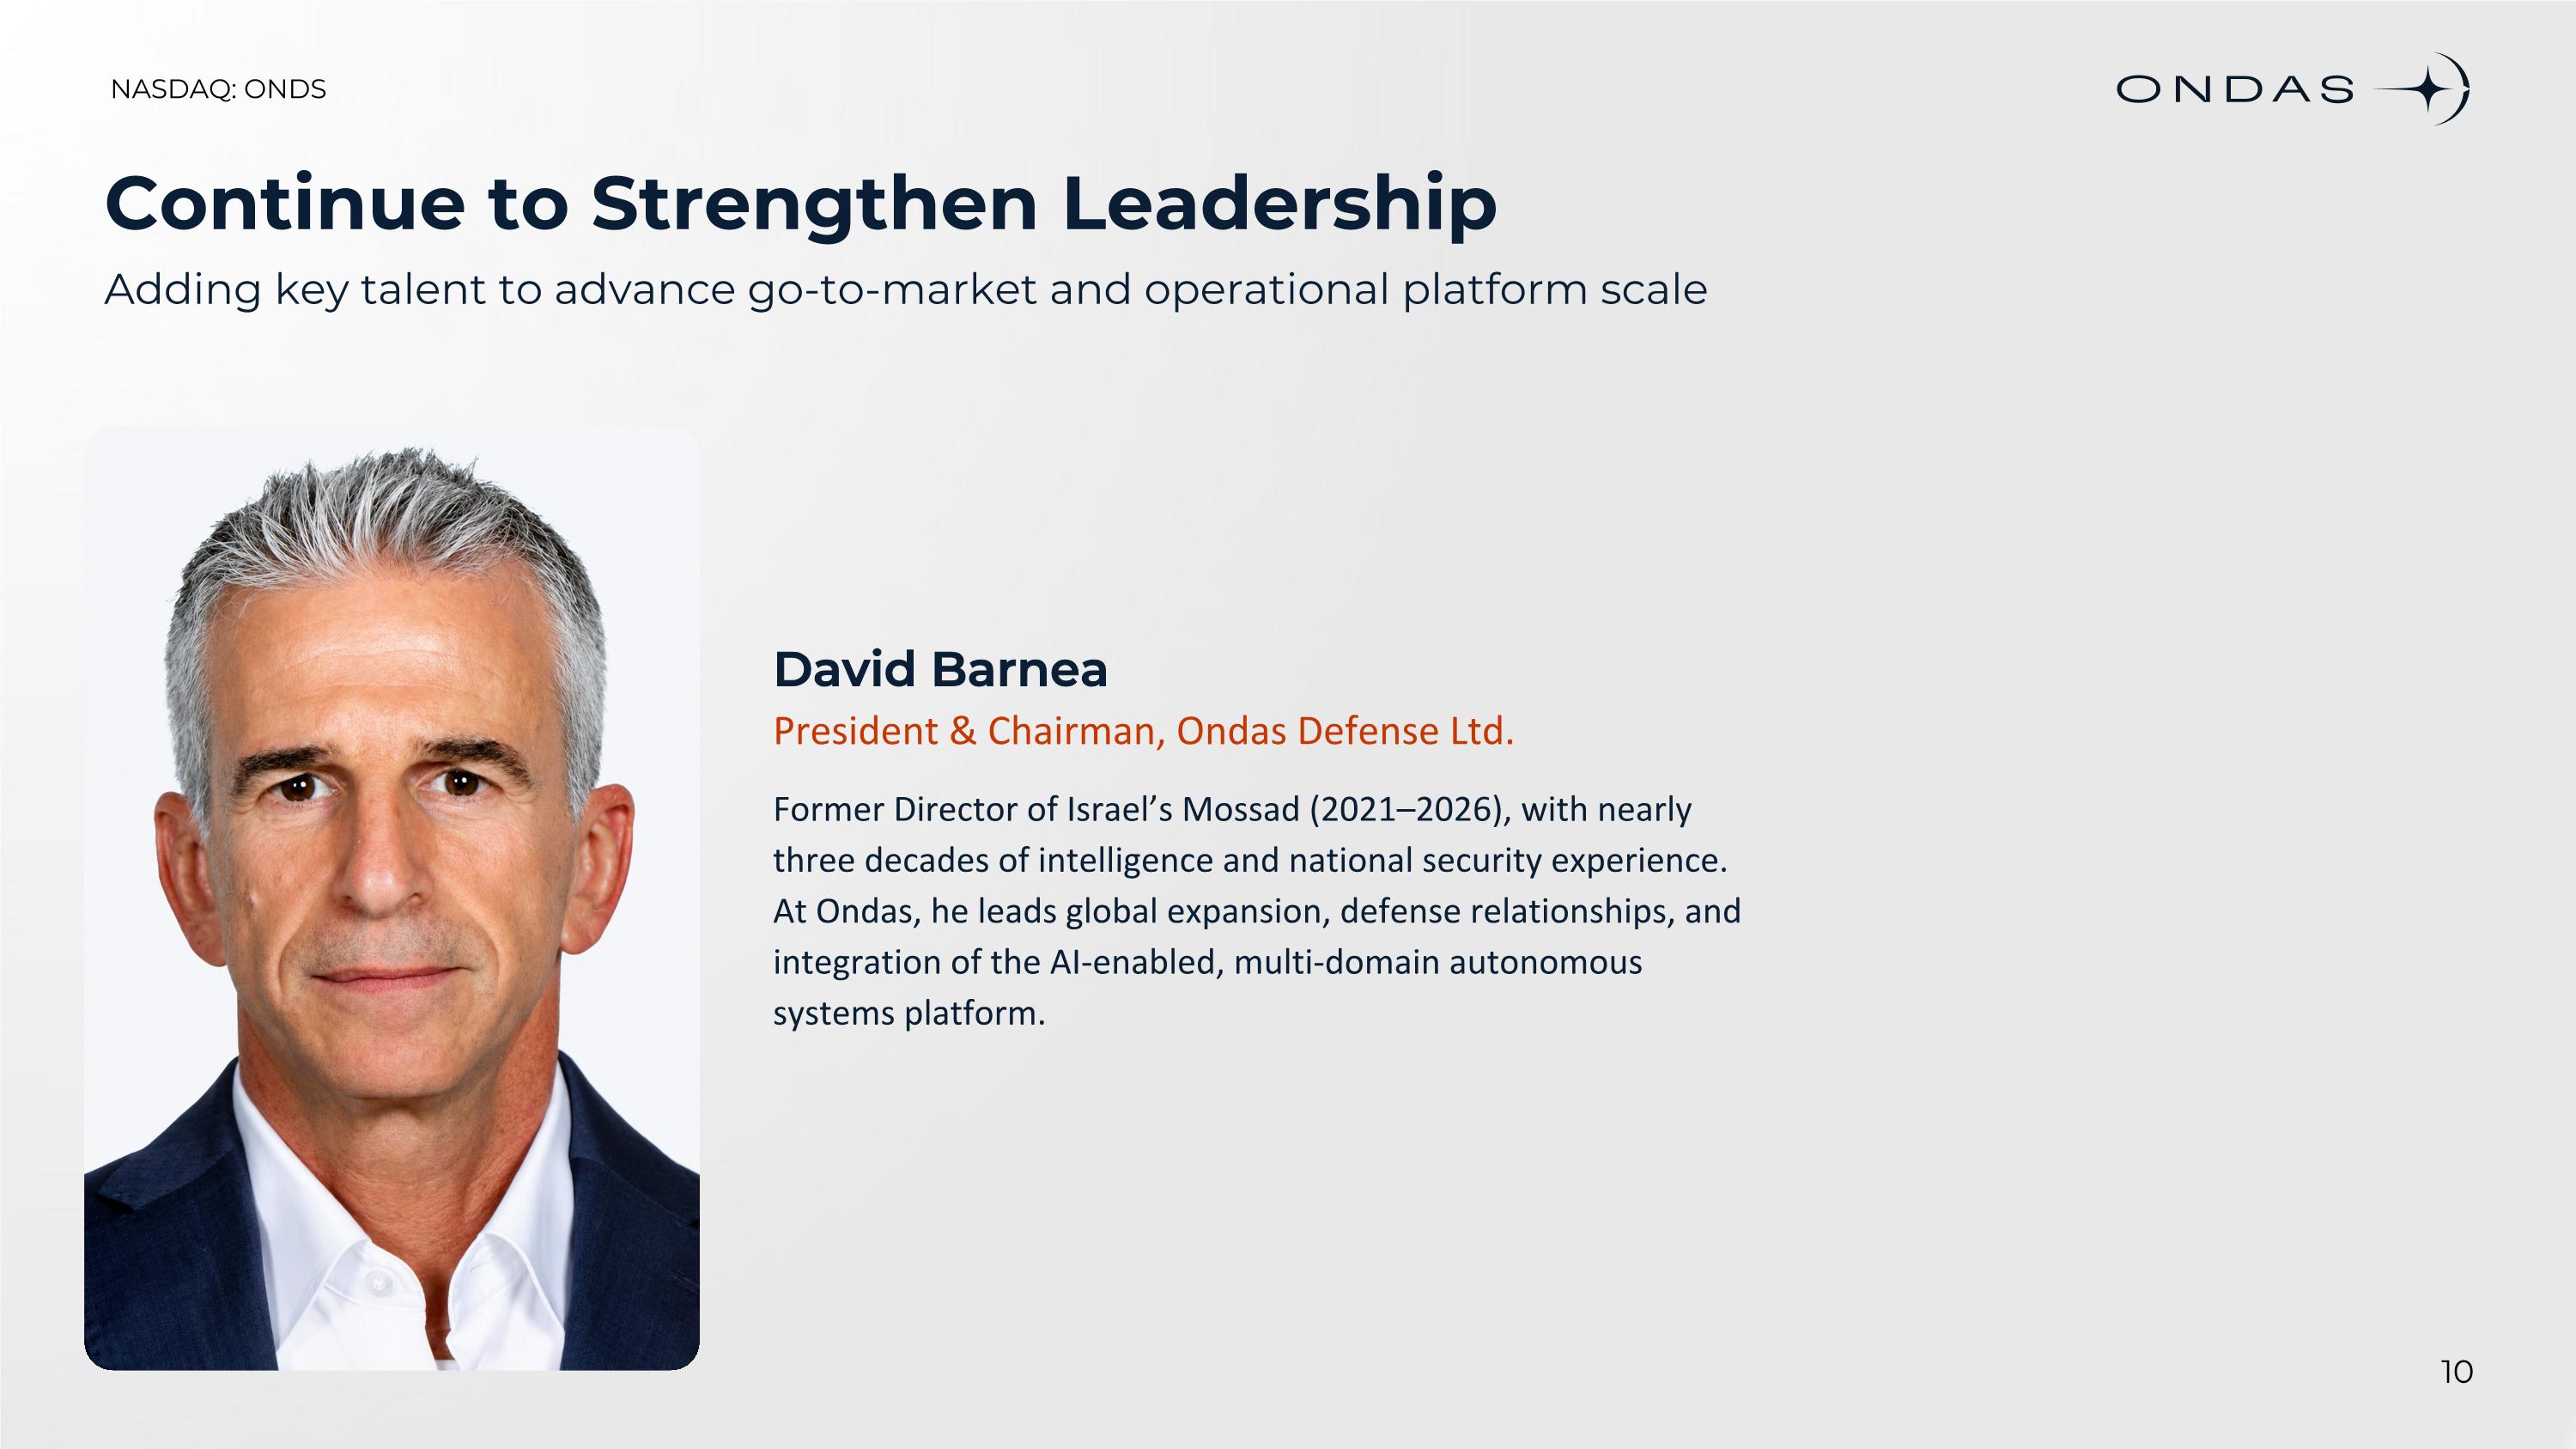
Continue to Strengthen Leadership Adding key talent to advance go-to-market and operational platform scale David Barnea President & Chairman, Ondas Defense Ltd. Former Director of Israel’s Mossad (2021–2026), with nearly three decades of intelligence and national security experience. At Ondas, he leads global expansion, defense relationships, and integration of the AI-enabled, multi-domain autonomous systems platform.
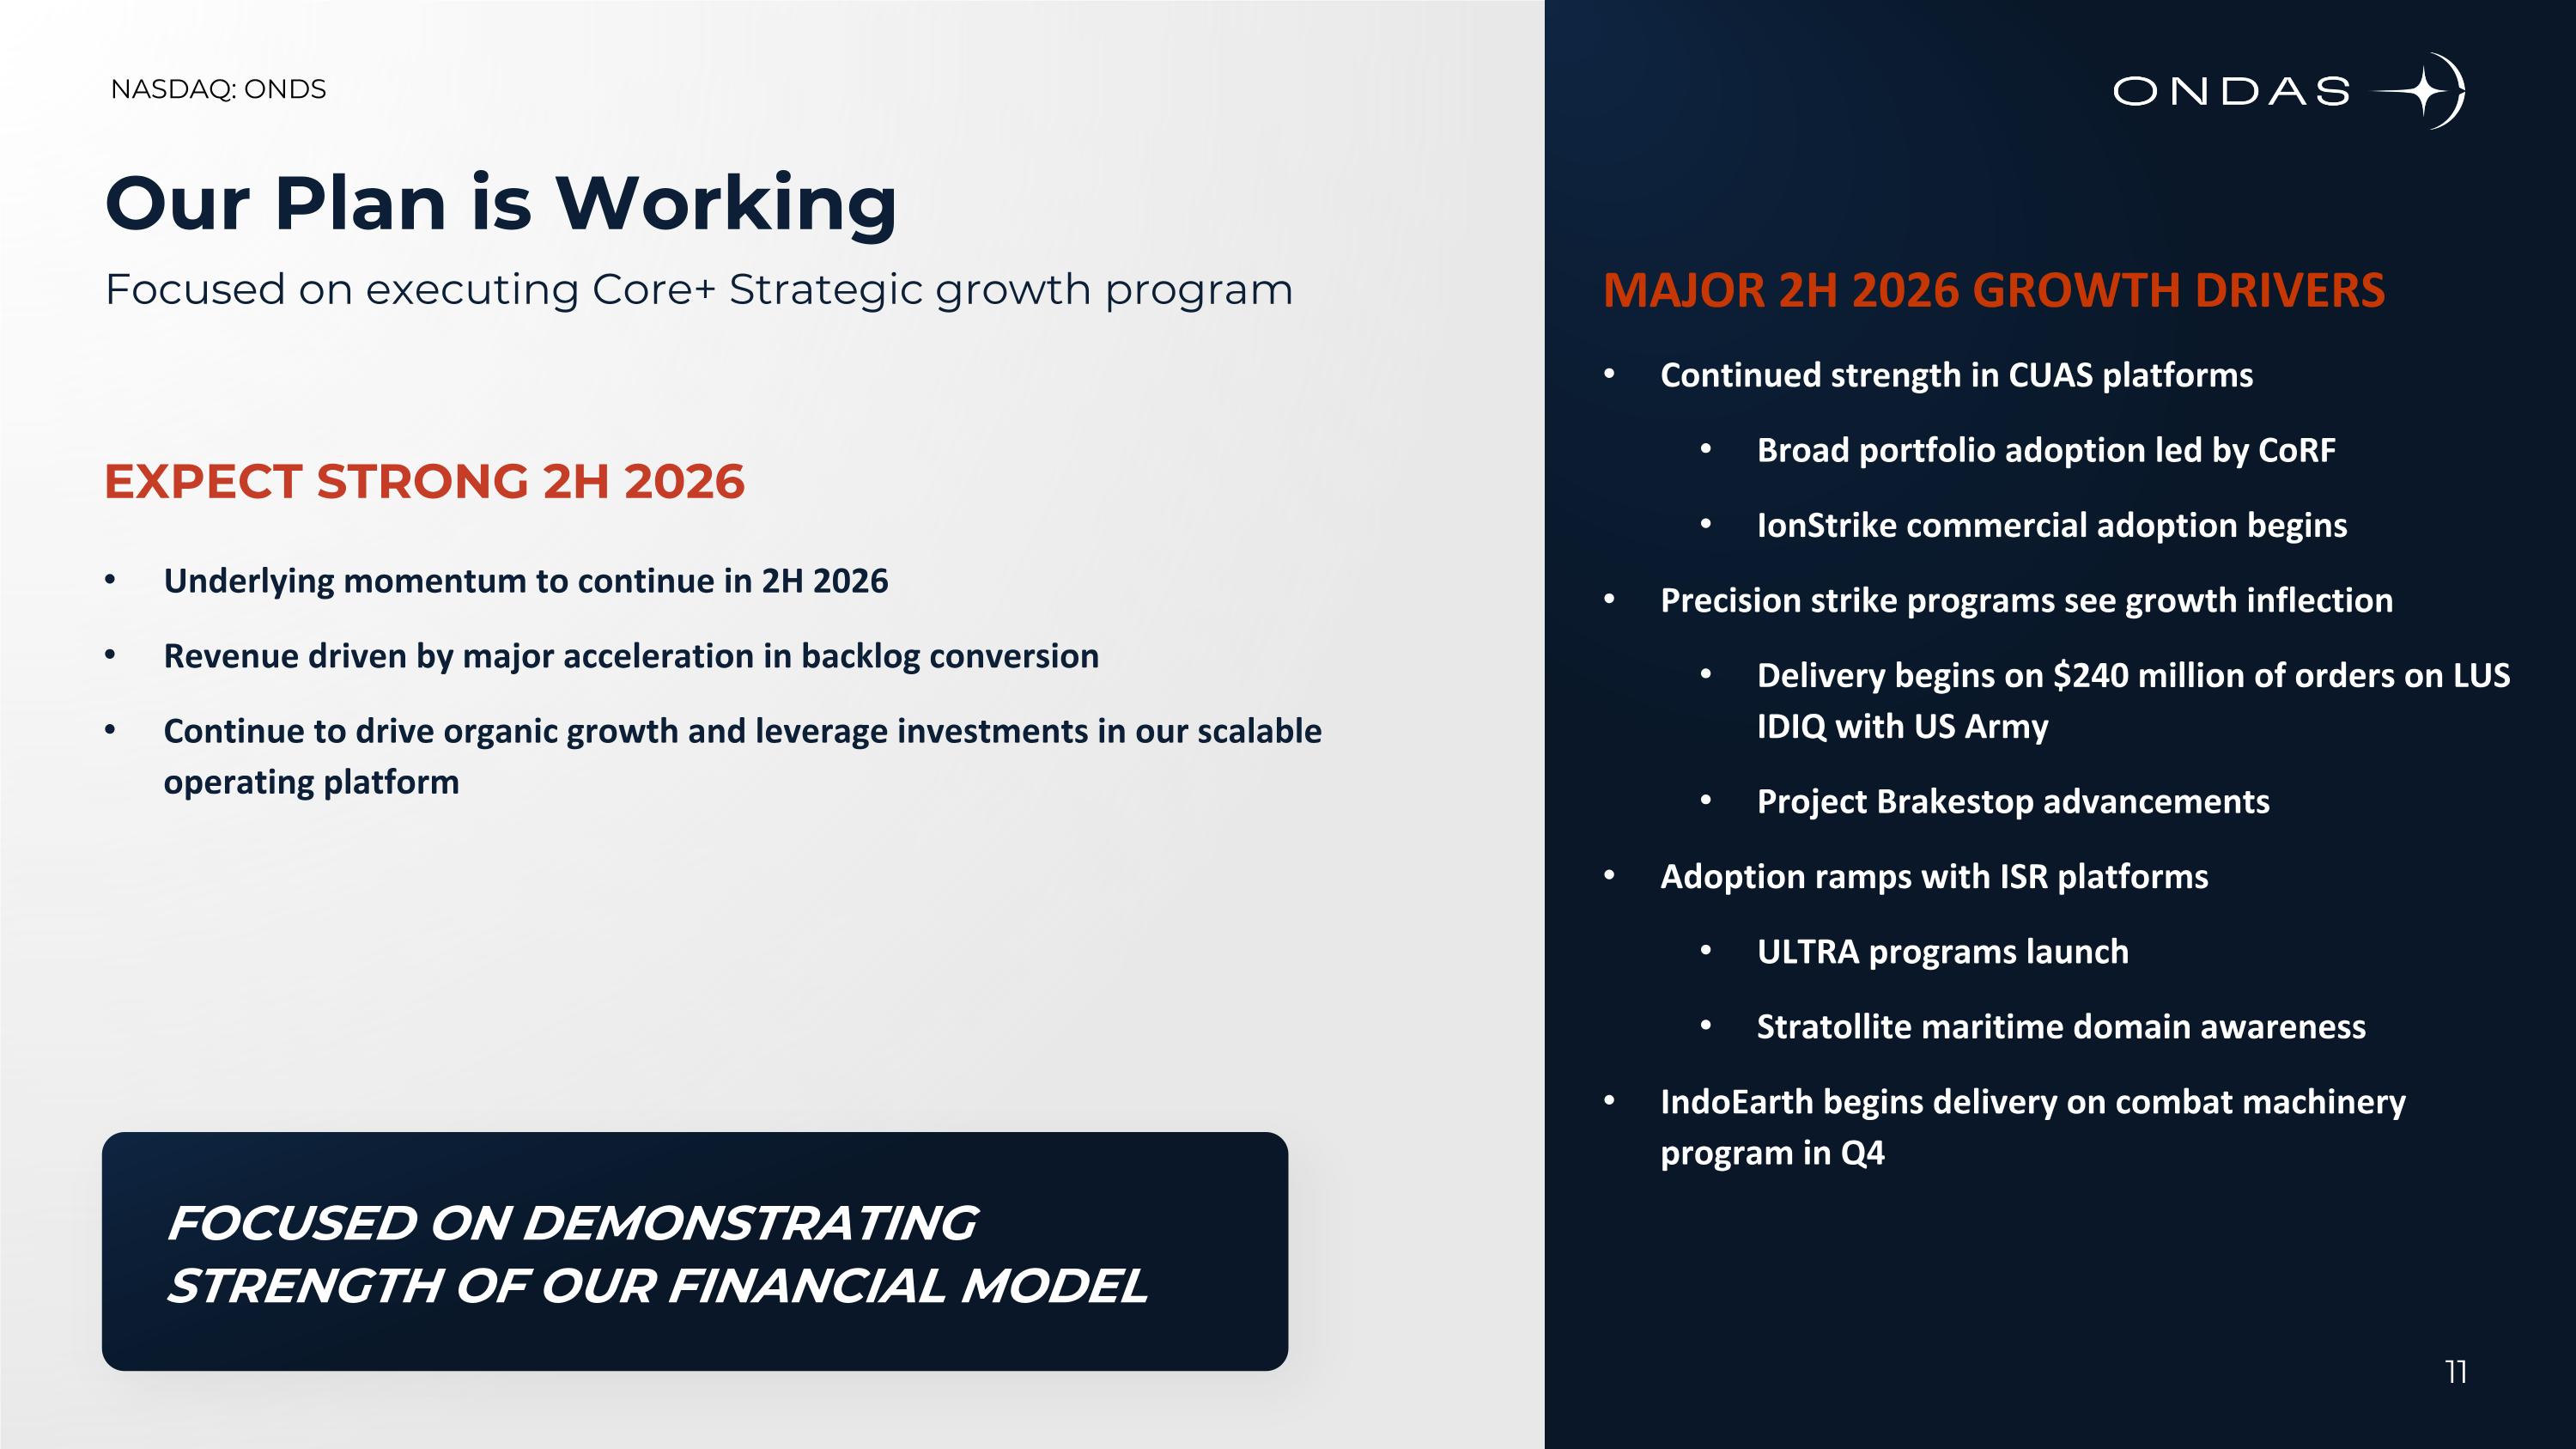
Our Plan is Working Focused on executing Core+ Strategic growth program Underlying momentum to continue in 2H 2026 Revenue driven by major acceleration in backlog conversion Continue to drive organic growth and leverage investments in our scalable operating platform EXPECT STRONG 2H 2026 MAJOR 2H 2026 GROWTH DRIVERS Continued strength in CUAS platforms Broad portfolio adoption led by CoRF IonStrike commercial adoption begins Precision strike programs see growth inflection Delivery begins on $240 million of orders on LUS IDIQ with US Army Project Brakestop advancements Adoption ramps with ISR platforms ULTRA programs launch Stratollite maritime domain awareness IndoEarth begins delivery on combat machinery program in Q4 11 FOCUSED ON DEMONSTRATING STRENGTH OF OUR FINANCIAL MODEL
NASDAQ: ONDS | August 13, 2026 FINANCIAL REVIEW Second Quarter 2026 Earnings Release
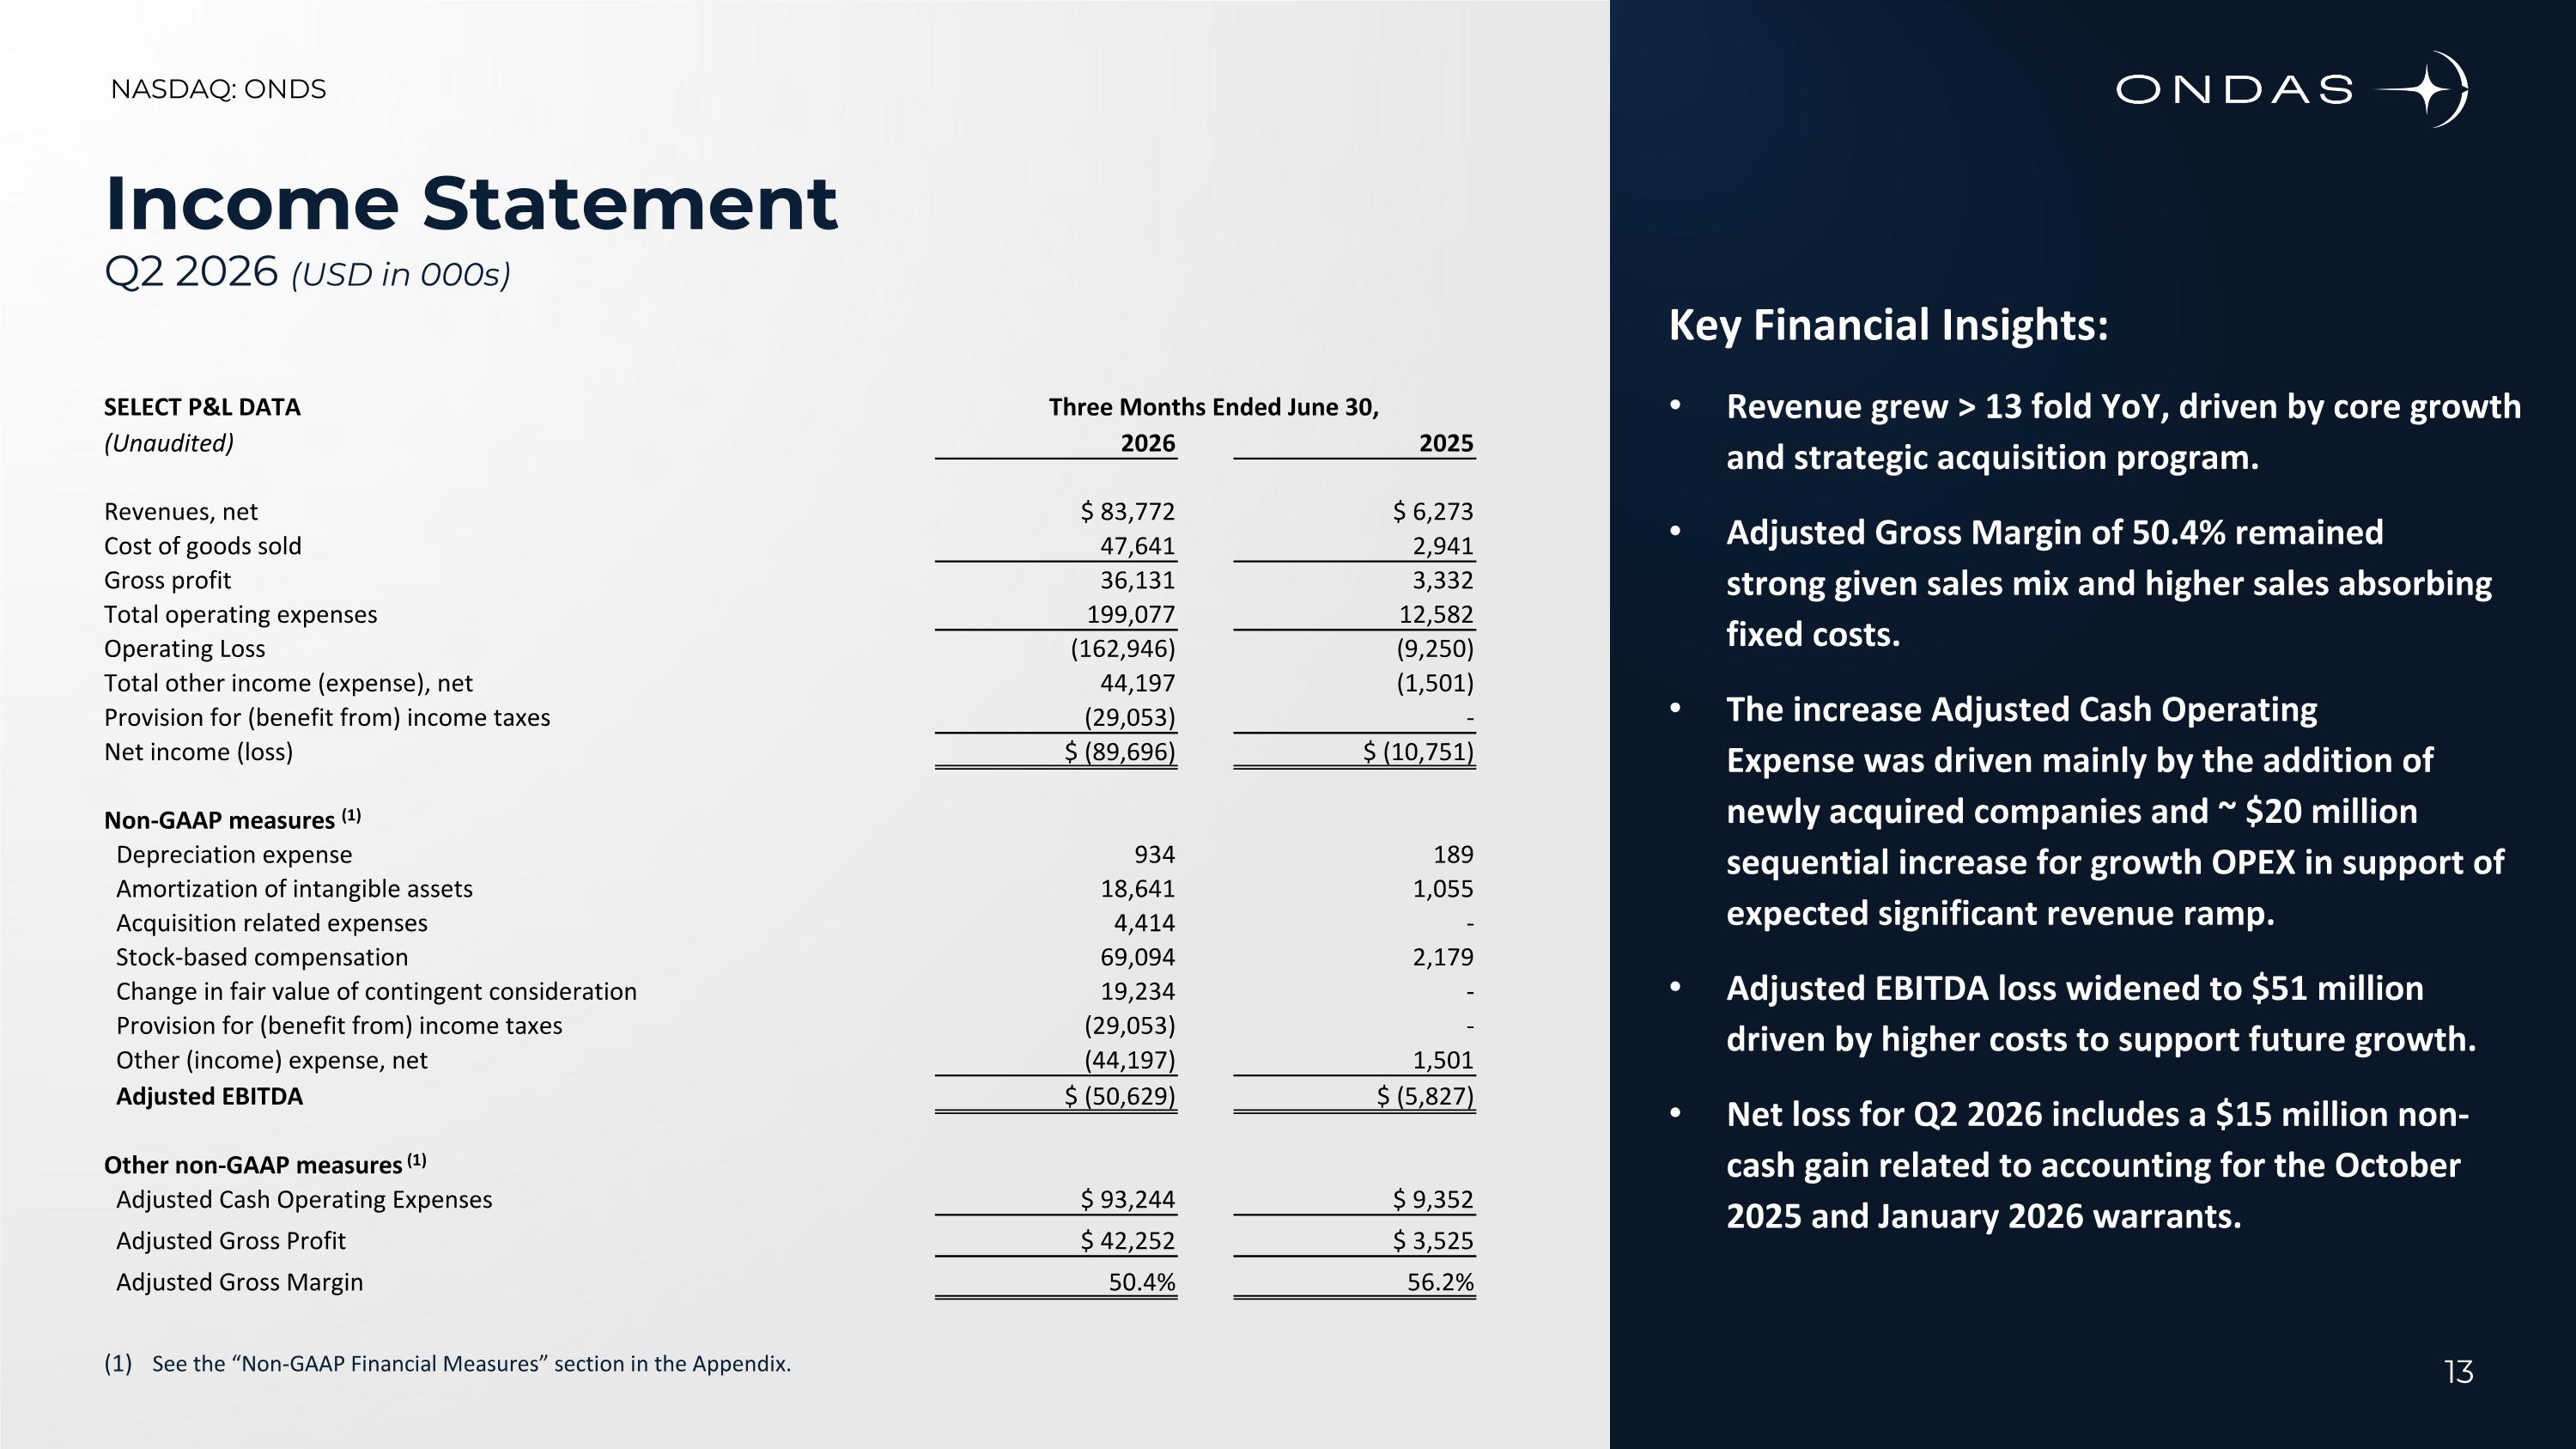
See the “Non-GAAP Financial Measures” section in the Appendix. Income Statement Q2 2026 (USD in 000s) SELECT P&L DATA Three Months Ended June 30, (Unaudited) 2026 2025 Revenues, net $ 83,772 $ 6,273 Cost of goods sold 47,641 2,941 Gross profit 36,131 3,332 Total operating expenses 199,077 12,582 Operating Loss (162,946) (9,250) Total other income (expense), net 44,197 (1,501) Provision for (benefit from) income taxes (29,053) - Net income (loss) $ (89,696) $ (10,751) Non-GAAP measures (1) Depreciation expense 934 189 Amortization of intangible assets 18,641 1,055 Acquisition related expenses 4,414 - Stock-based compensation 69,094 2,179 Change in fair value of contingent consideration 19,234 - Provision for (benefit from) income taxes (29,053) - Other (income) expense, net (44,197) 1,501 Adjusted EBITDA $ (50,629) $ (5,827) Other non-GAAP measures (1) Adjusted Cash Operating Expenses $ 93,244 $ 9,352 Adjusted Gross Profit $ 42,252 $ 3,525 Adjusted Gross Margin 50.4% 56.2% Key Financial Insights: Revenue grew > 13 fold YoY, driven by core growth and strategic acquisition program. Adjusted Gross Margin of 50.4% remained strong given sales mix and higher sales absorbing fixed costs. The increase Adjusted Cash Operating Expense was driven mainly by the addition of newly acquired companies and ~ $20 million sequential increase for growth OPEX in support of expected significant revenue ramp. Adjusted EBITDA loss widened to $51 million driven by higher costs to support future growth. Net loss for Q2 2026 includes a $15 million non-cash gain related to accounting for the October 2025 and January 2026 warrants. 13
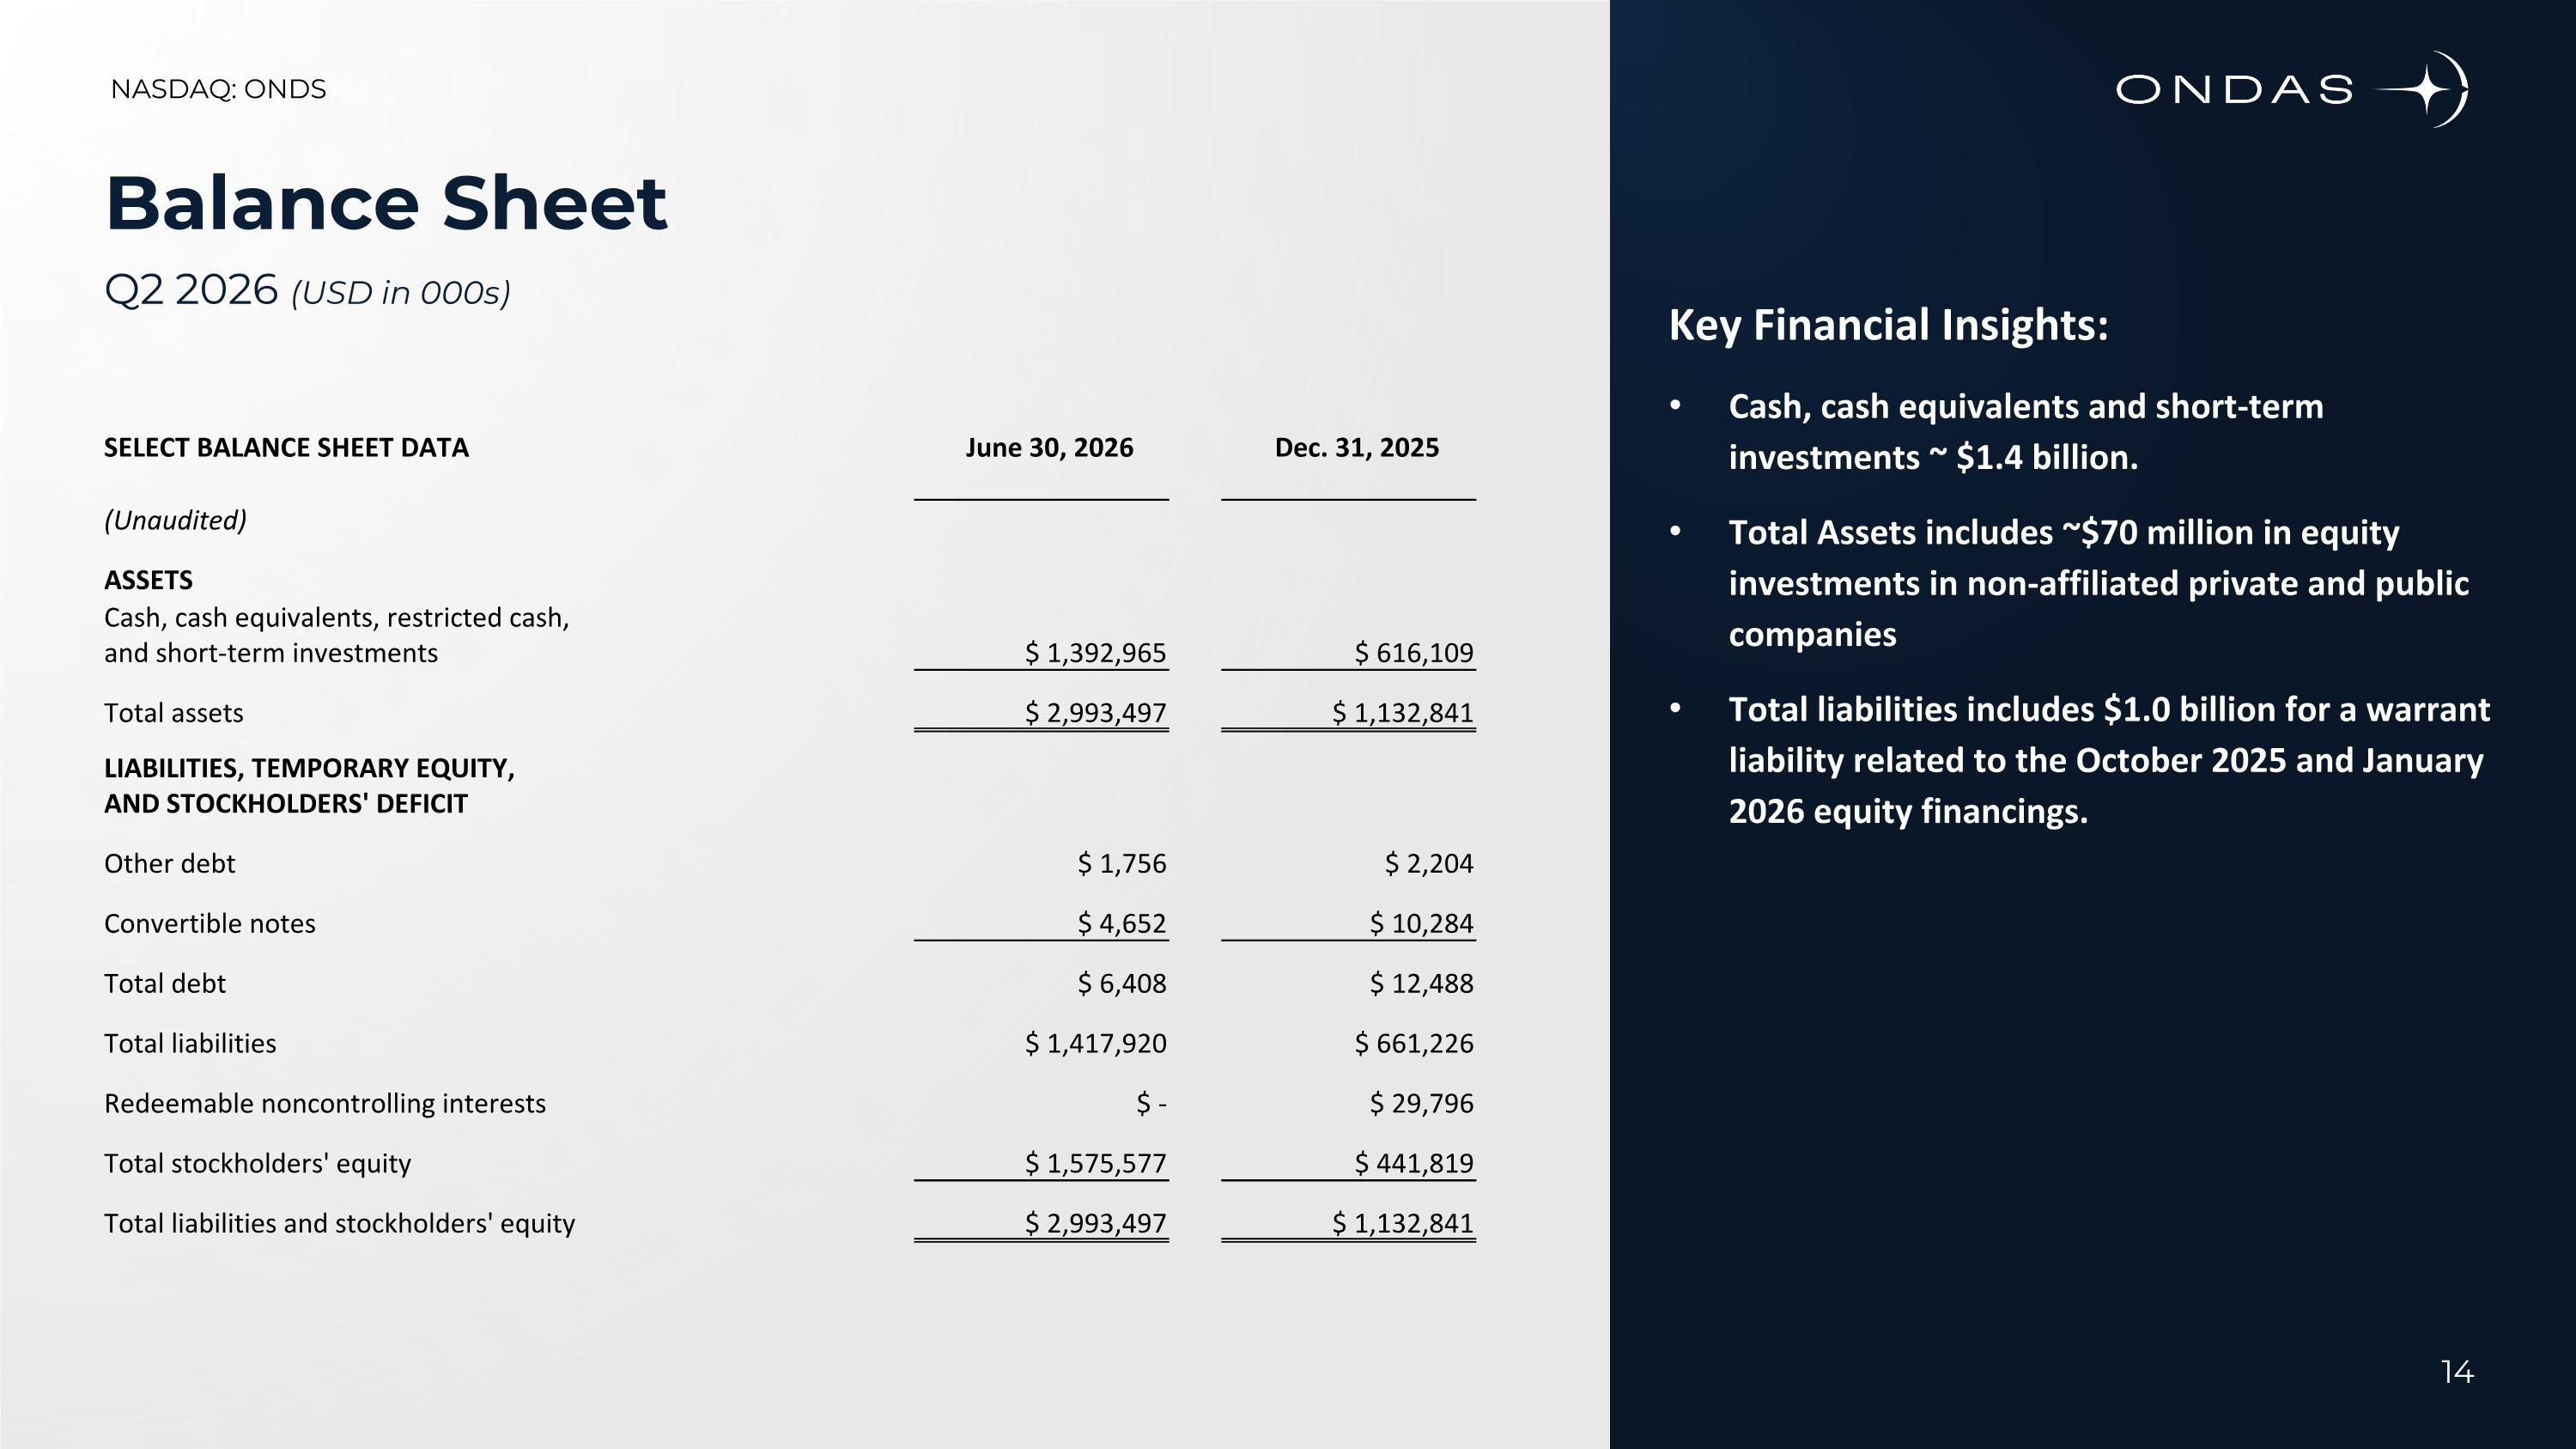
Balance Sheet Q2 2026 (USD in 000s) SELECT BALANCE SHEET DATA June 30, 2026 Dec. 31, 2025 (Unaudited) ASSETS Cash, cash equivalents, restricted cash, and short-term investments $ 1,392,965 $ 616,109 Total assets $ 2,993,497 $ 1,132,841 LIABILITIES, TEMPORARY EQUITY, AND STOCKHOLDERS' DEFICIT Other debt $ 1,756 $ 2,204 Convertible notes $ 4,652 $ 10,284 Total debt $ 6,408 $ 12,488 Total liabilities $ 1,417,920 $ 661,226 Redeemable noncontrolling interests $ - $ 29,796 Total stockholders' equity $ 1,575,577 $ 441,819 Total liabilities and stockholders' equity $ 2,993,497 $ 1,132,841 Key Financial Insights: Cash, cash equivalents and short-term investments ~ $1.4 billion. Total Assets includes ~$70 million in equity investments in non-affiliated private and public companies Total liabilities includes $1.0 billion for a warrant liability related to the October 2025 and January 2026 equity financings. 14
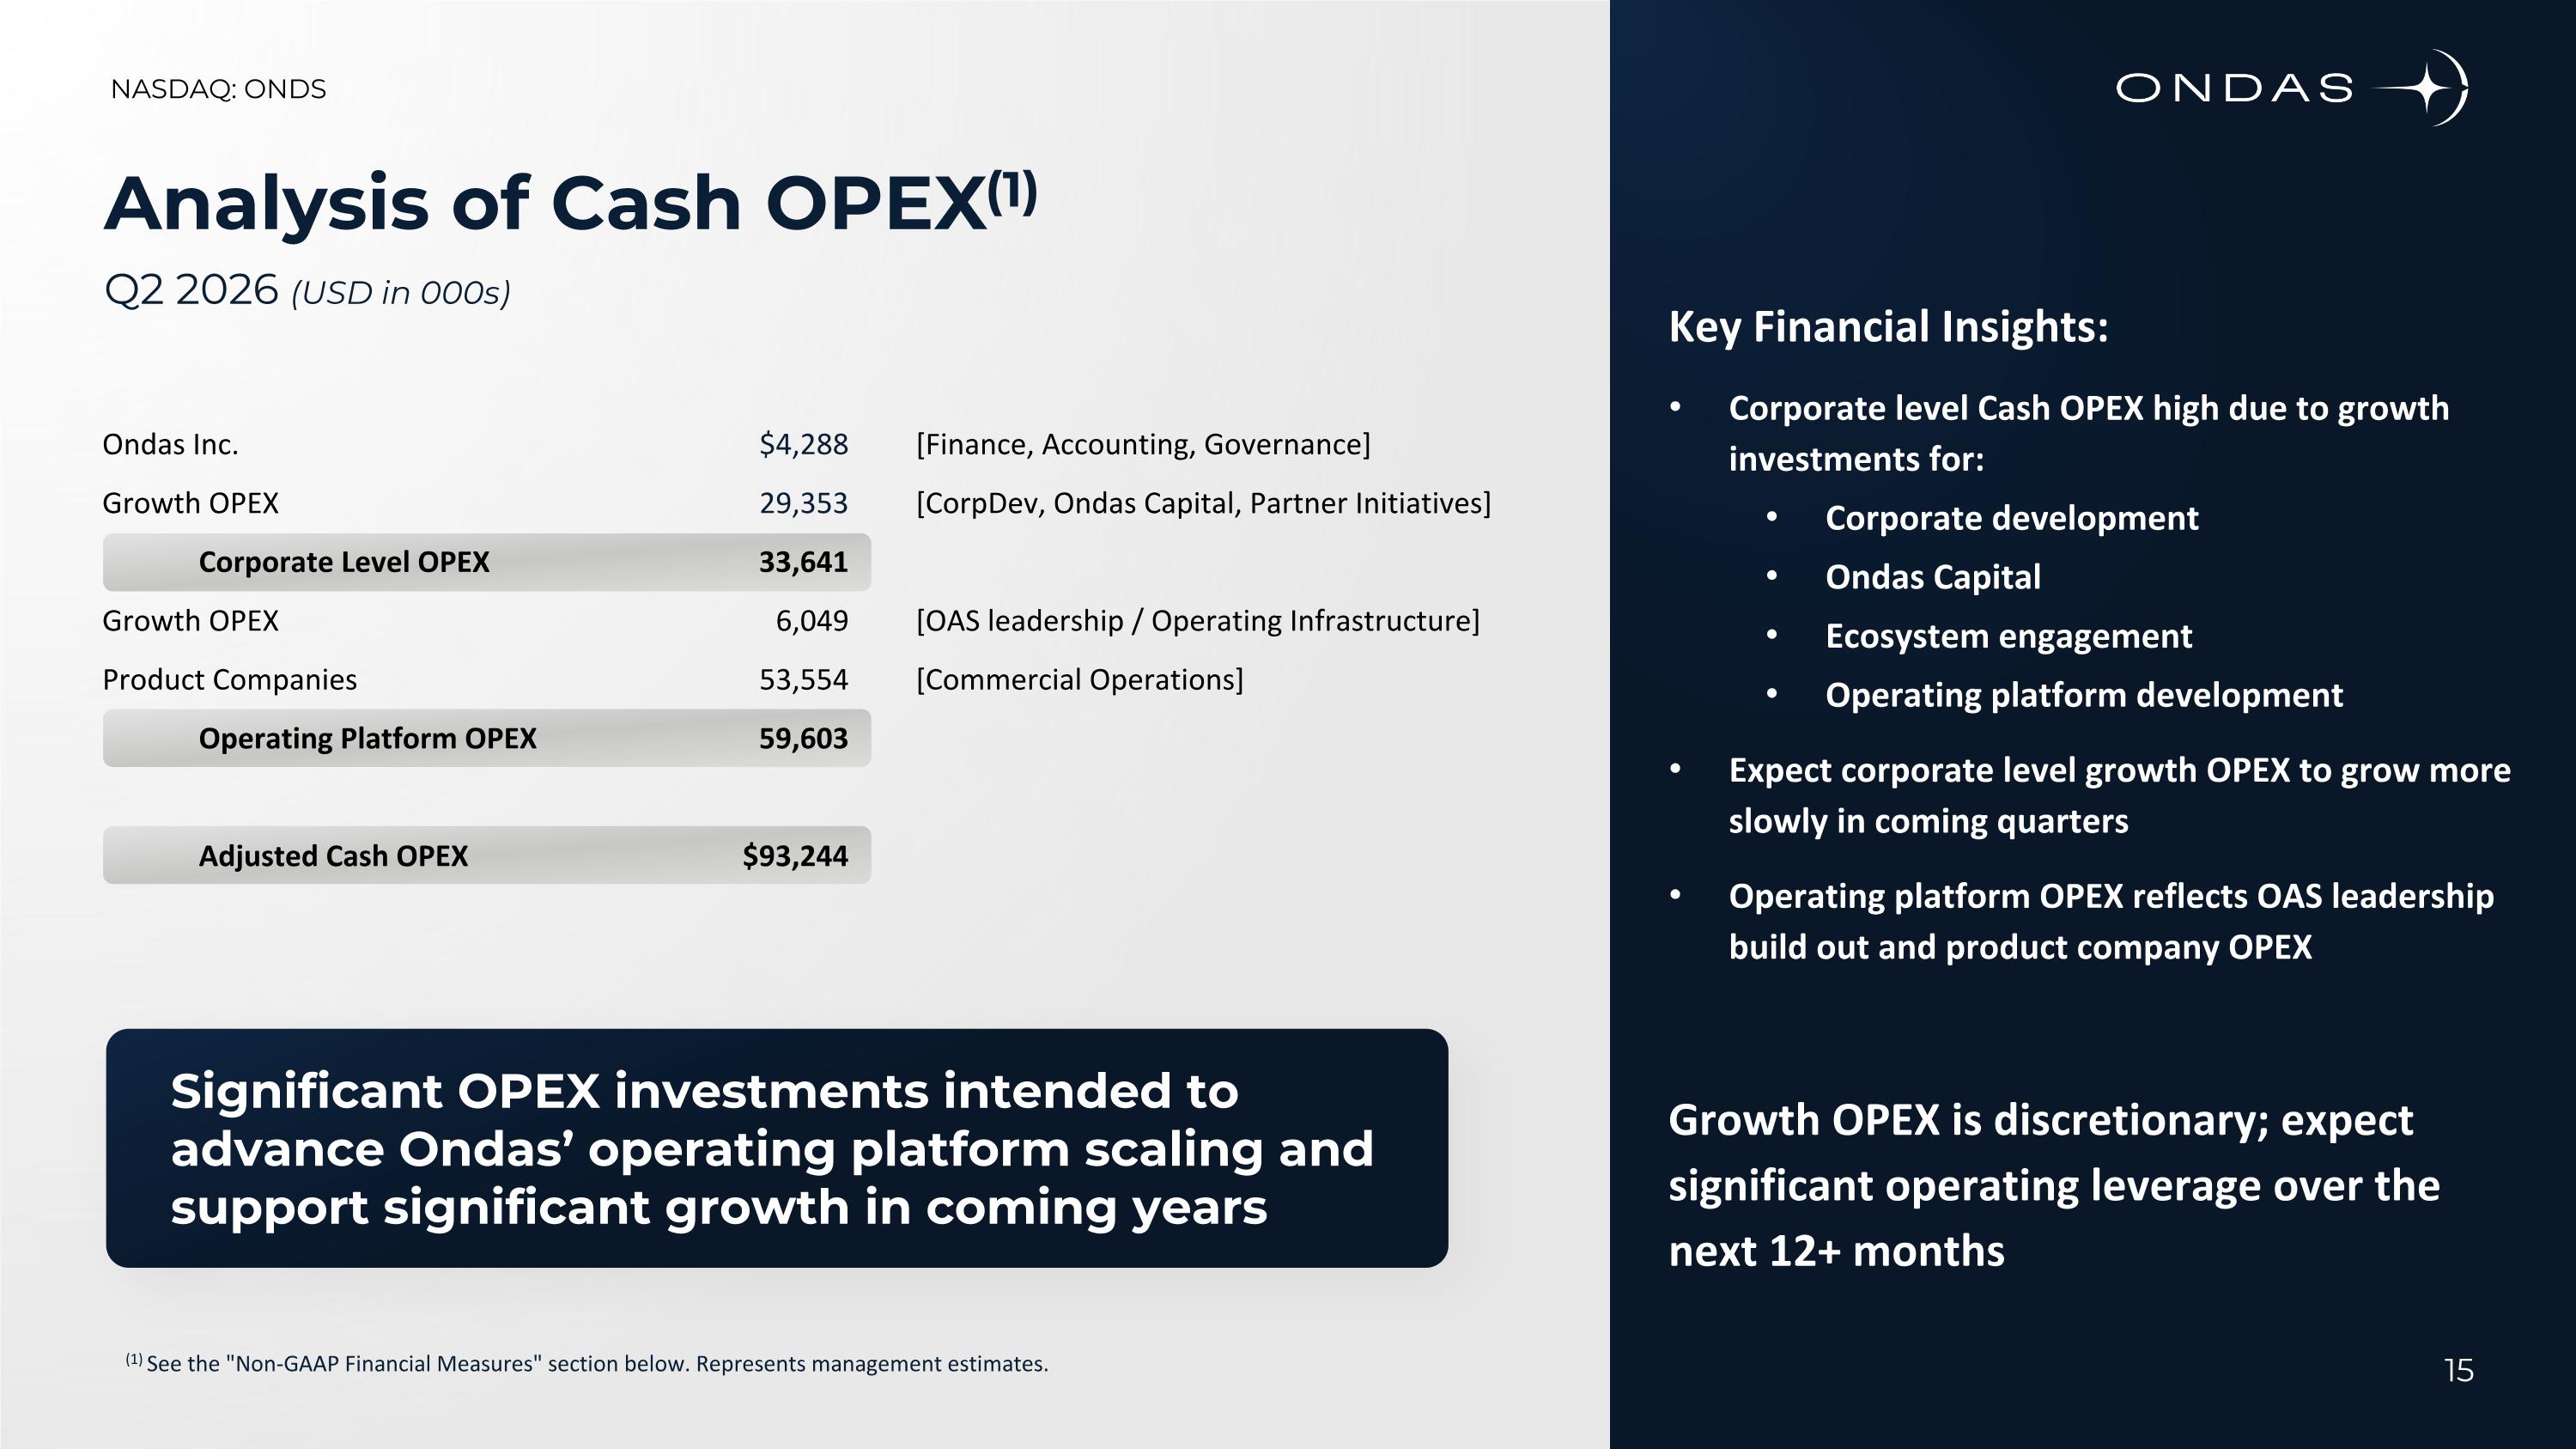
Analysis of Cash OPEX(1) Q2 2026 (USD in 000s) (1) See the "Non-GAAP Financial Measures" section below. Represents management estimates. Ondas Inc. $4,288 [Finance, Accounting, Governance] Growth OPEX 29,353 [CorpDev, Ondas Capital, Partner Initiatives] Corporate Level OPEX 33,641 Growth OPEX 6,049 [OAS leadership / Operating Infrastructure] Product Companies 53,554 [Commercial Operations] Operating Platform OPEX 59,603 Adjusted Cash OPEX $93,244 Key Financial Insights: Corporate level Cash OPEX high due to growth investments for: Corporate development Ondas Capital Ecosystem engagement Operating platform development Expect corporate level growth OPEX to grow more slowly in coming quarters Operating platform OPEX reflects OAS leadership build out and product company OPEX Growth OPEX is discretionary; expect significant operating leverage over the next 12+ months 15 Significant OPEX investments intended to advance Ondas’ operating platform scaling and support significant growth in coming years
Second Quarter 2026 Earnings Release GROWTH & OPERATIONAL UPDATE NASDAQ: ONDS | August 13, 2026
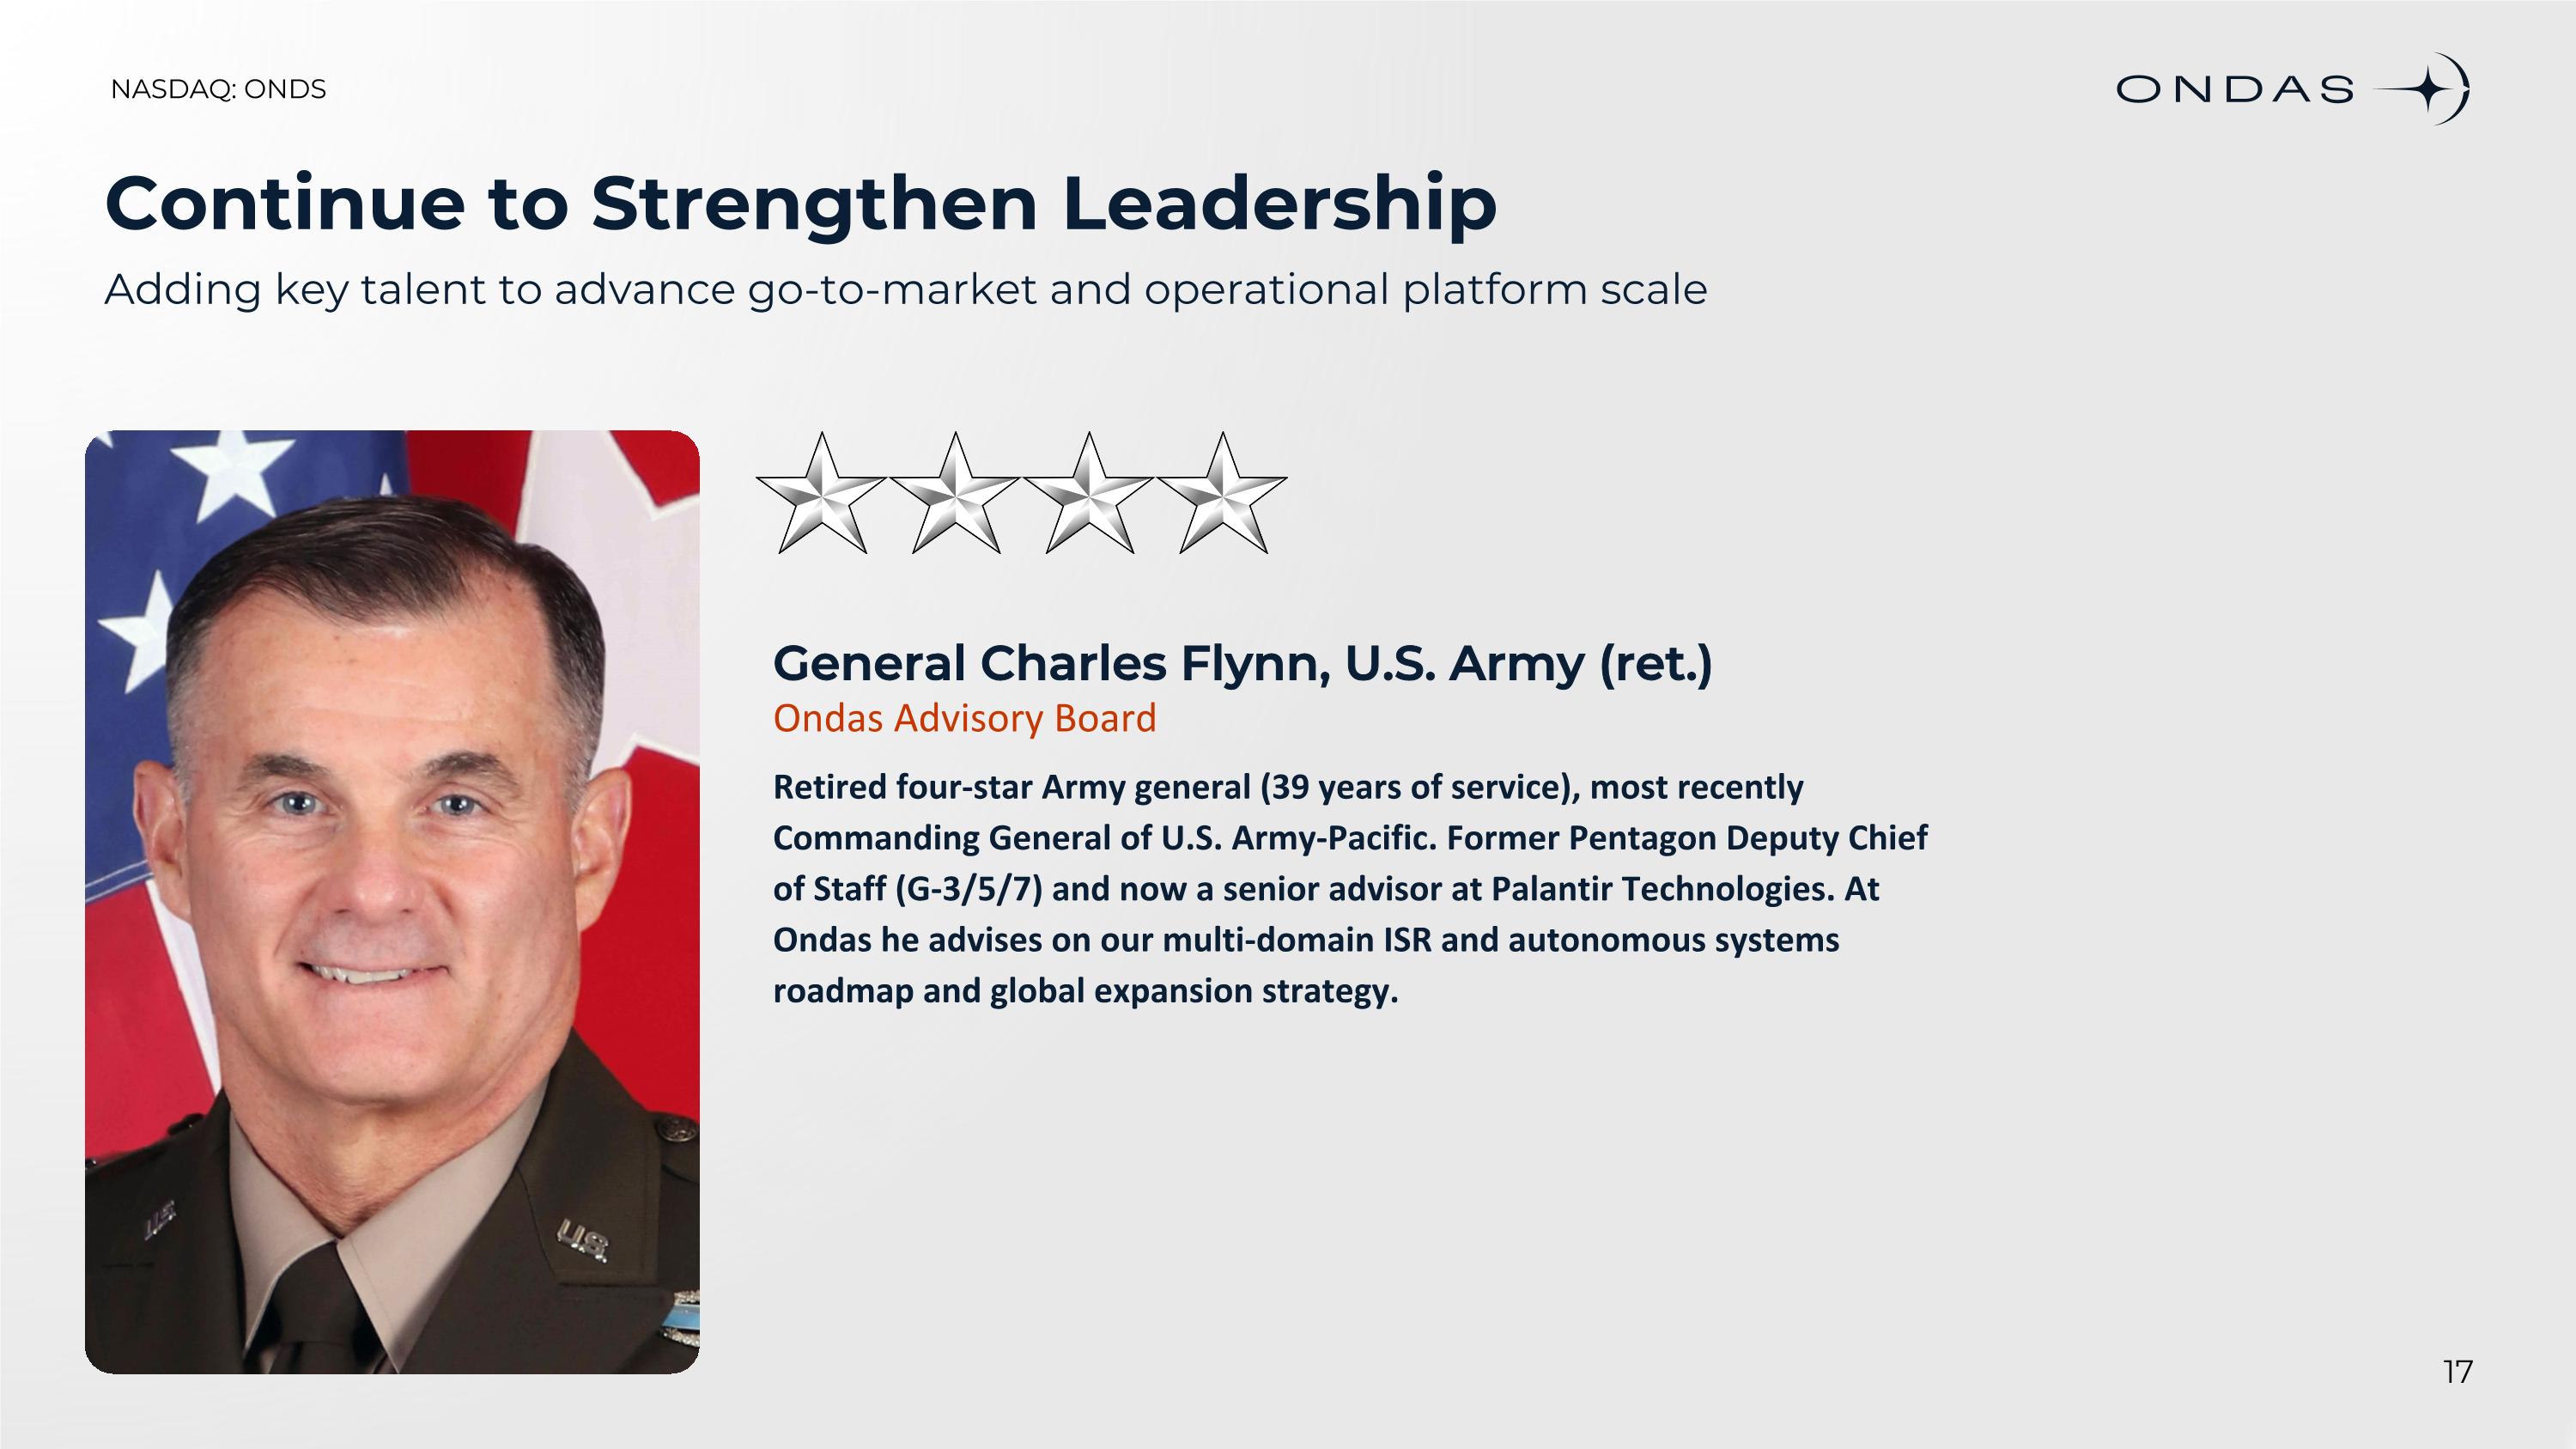
Continue to Strengthen Leadership Adding key talent to advance go-to-market and operational platform scale General Charles Flynn, U.S. Army (ret.) Ondas Advisory Board Retired four-star Army general (39 years of service), most recently Commanding General of U.S. Army-Pacific. Former Pentagon Deputy Chief of Staff (G-3/5/7) and now a senior advisor at Palantir Technologies. At Ondas he advises on our multi-domain ISR and autonomous systems roadmap and global expansion strategy.
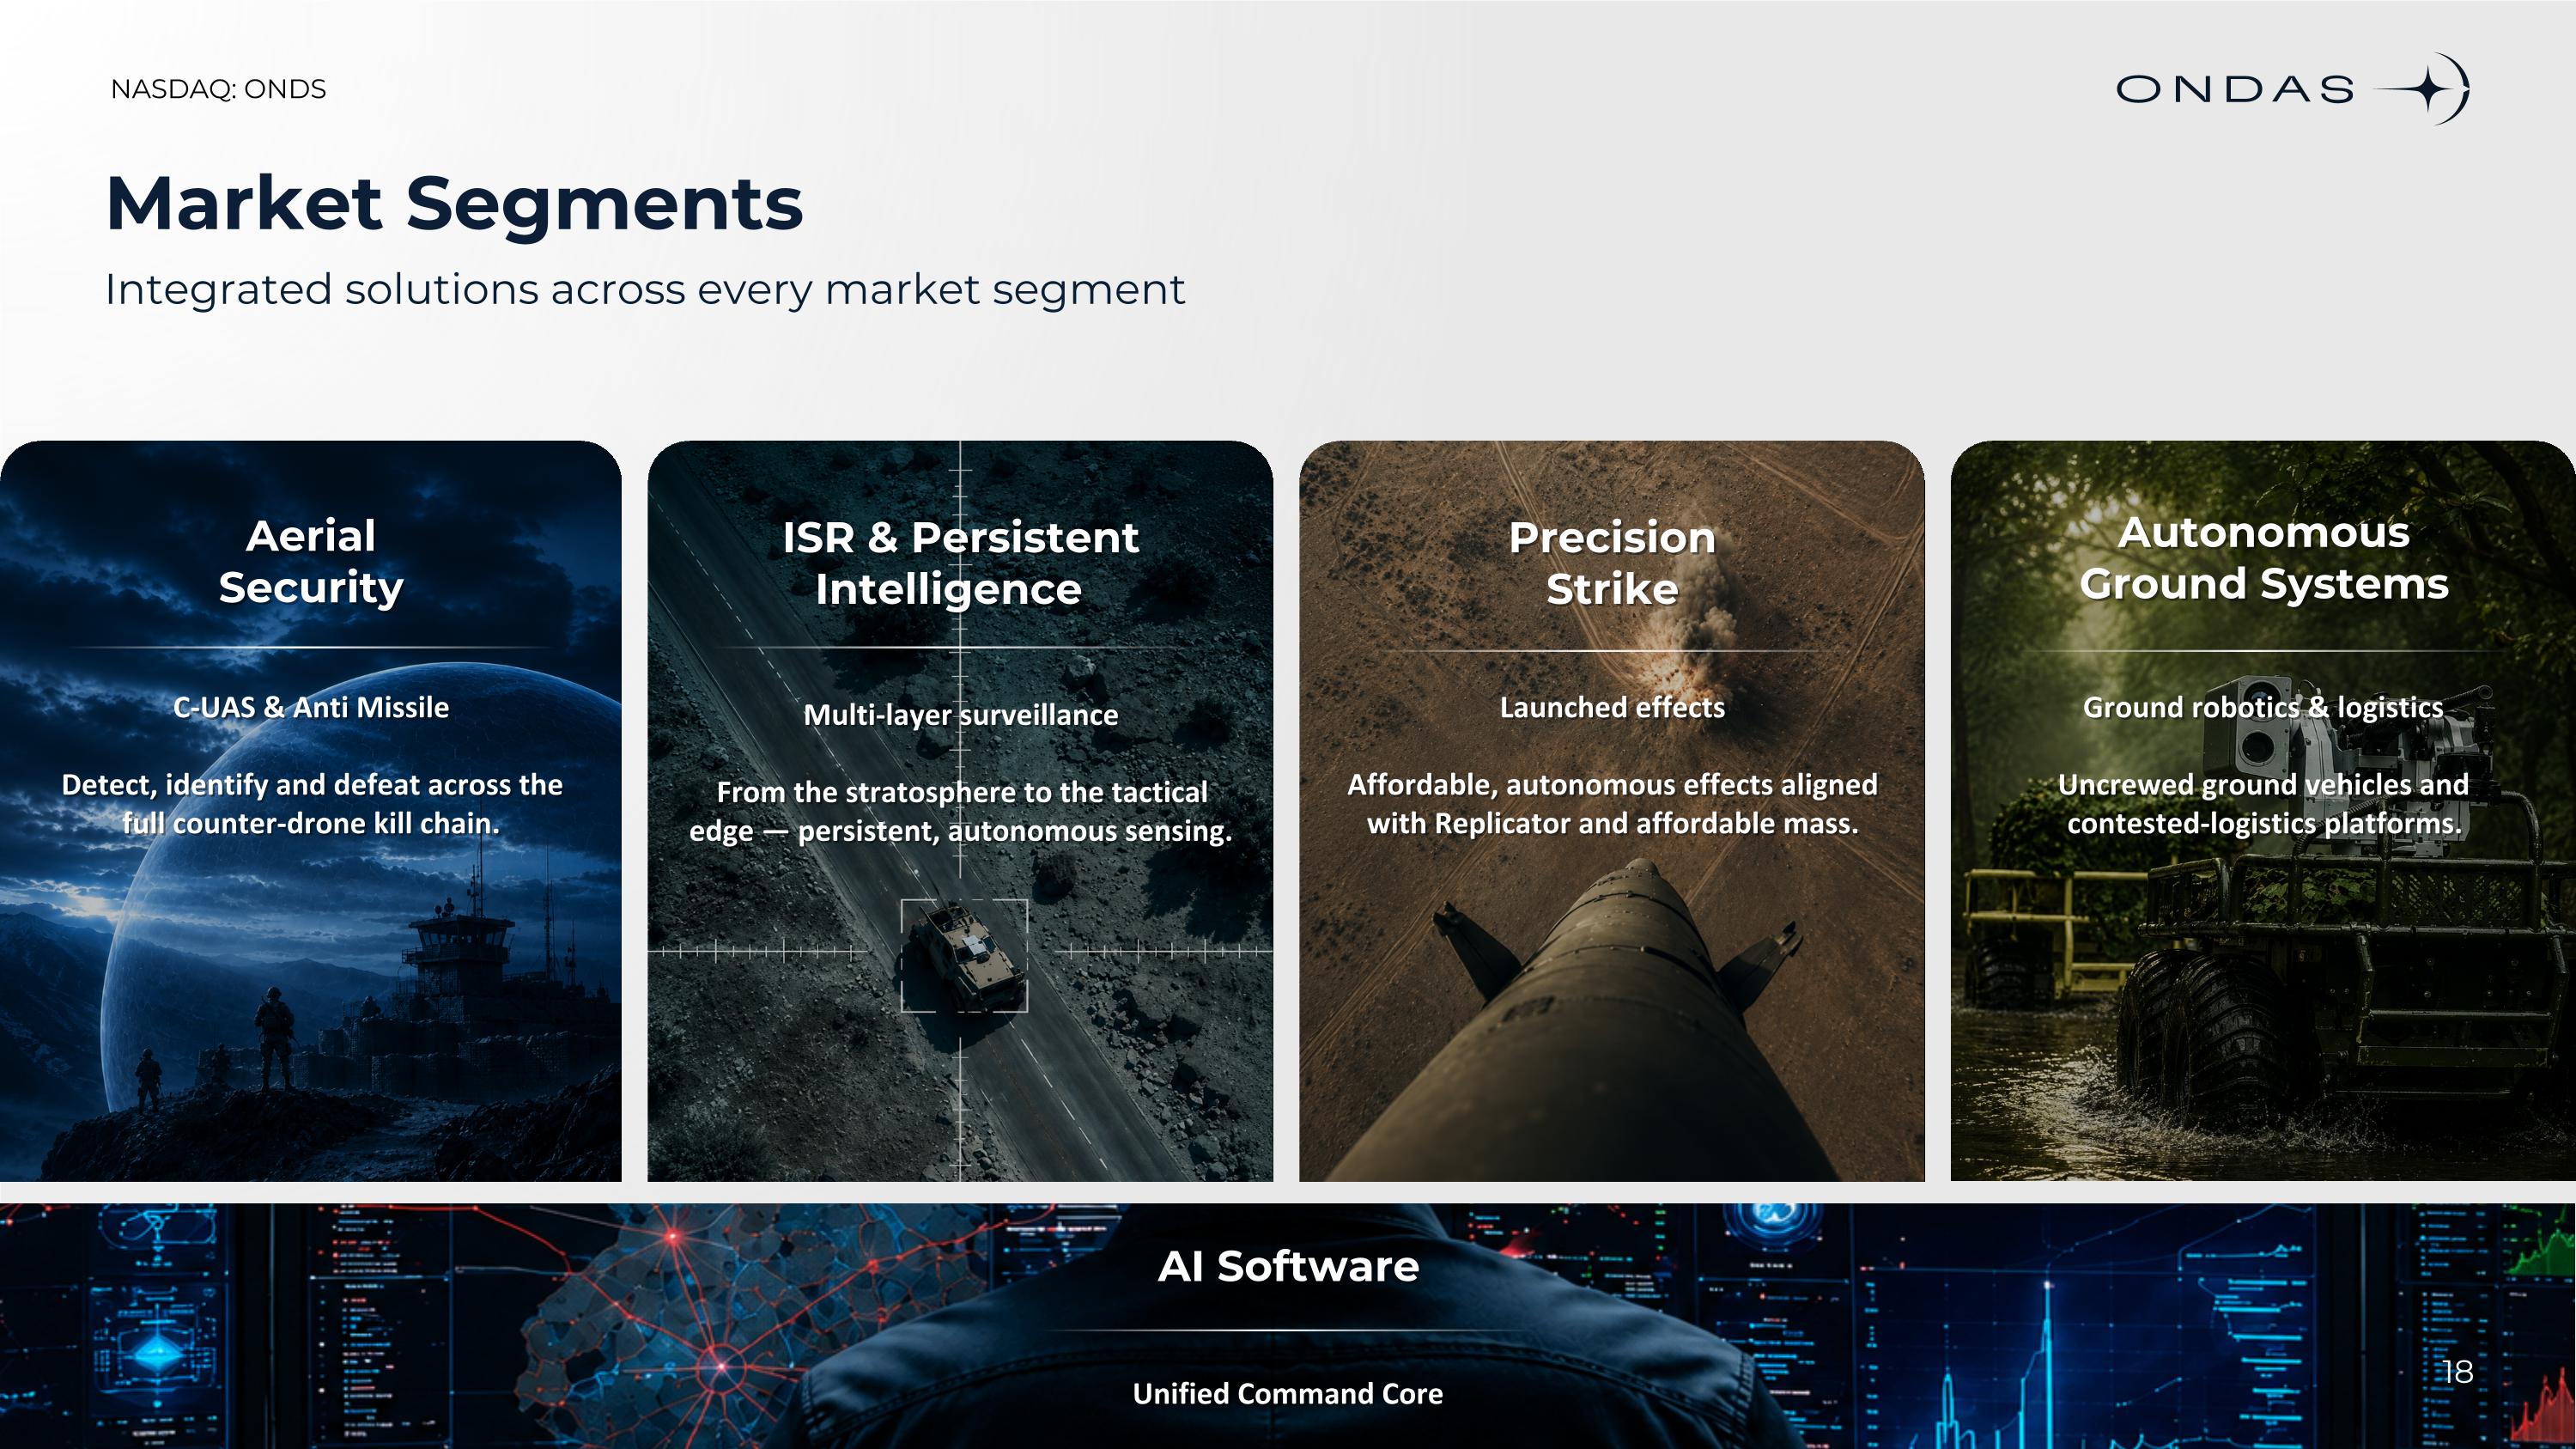
Market Segments Integrated solutions across every market segment ISR & Persistent Intelligence Multi-layer surveillance From the stratosphere to the tactical edge — persistent, autonomous sensing. Precision Strike Launched effects Affordable, autonomous effects aligned with Replicator and affordable mass. Aerial Security C-UAS & Anti Missile Detect, identify and defeat across the full counter-drone kill chain. Autonomous Ground Systems Ground robotics & logistics Uncrewed ground vehicles and contested-logistics platforms. AI Software Unified Command Core 18
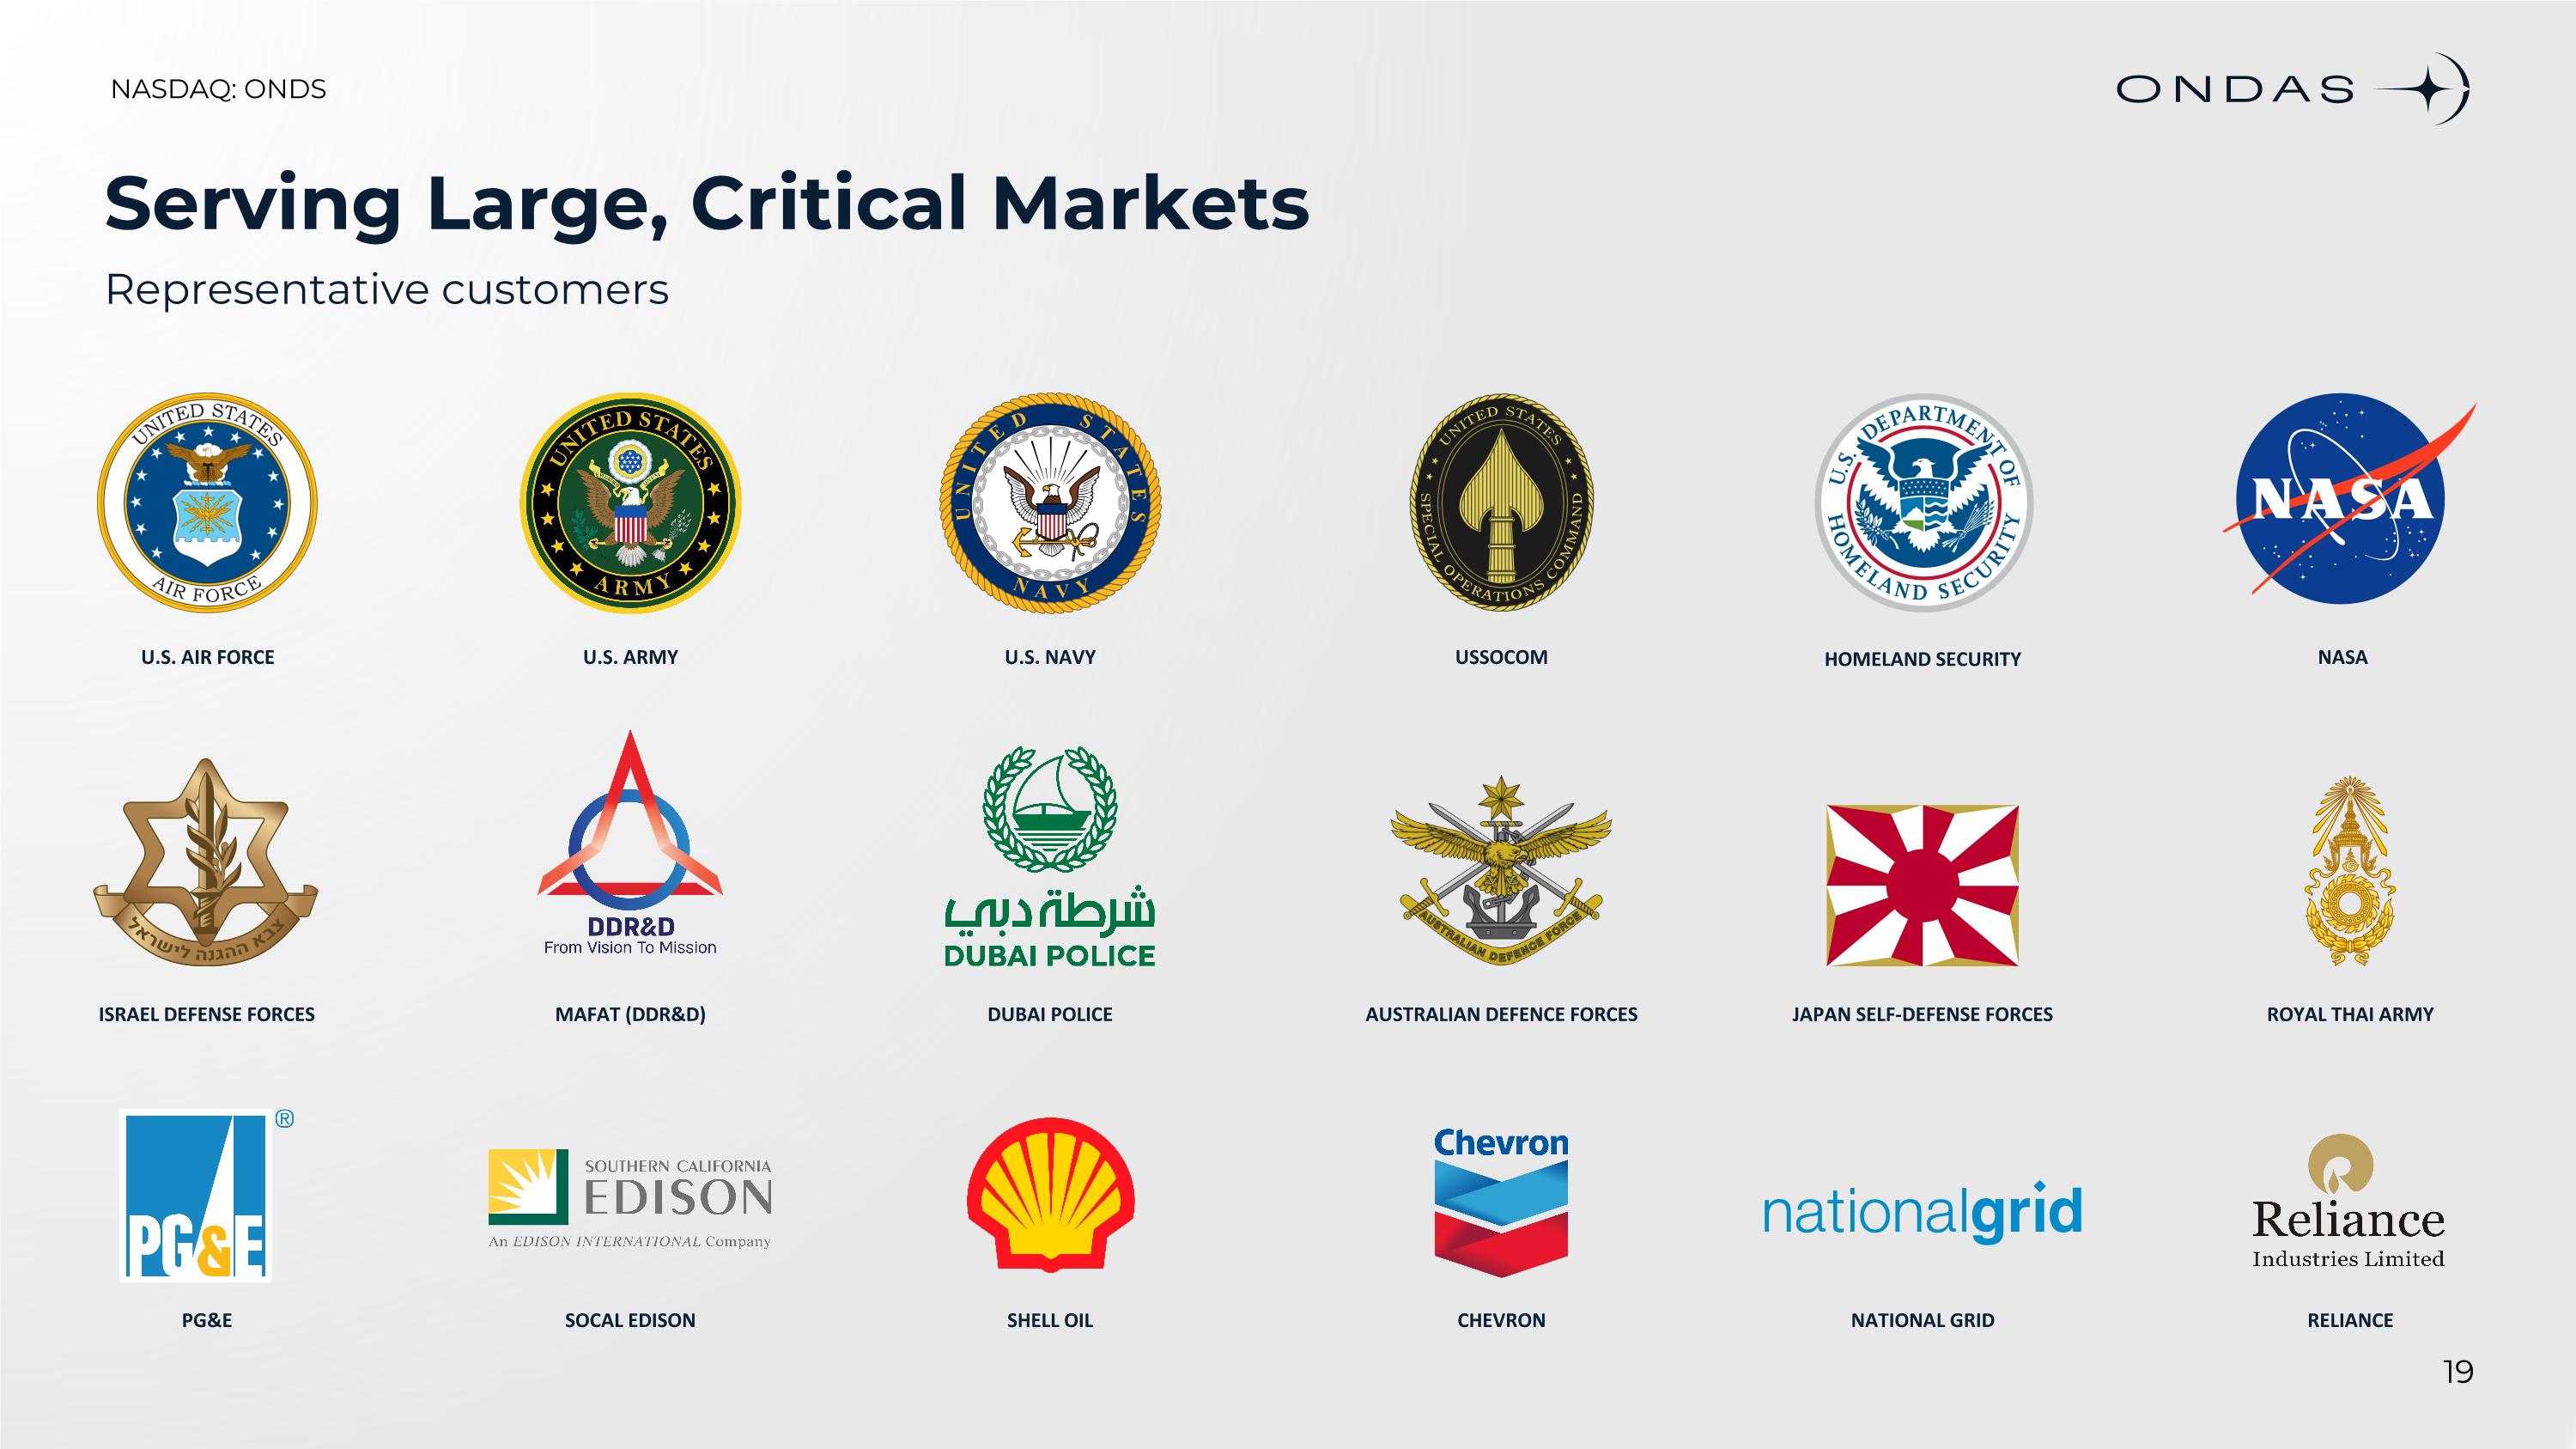
Serving Large, Critical Markets Representative customers U.S. AIR FORCE U.S. ARMY USSOCOM HOMELAND SECURITY NASA JAPAN SELF-DEFENSE FORCES ROYAL THAI ARMY AUSTRALIAN DEFENCE FORCES U.S. NAVY PG&E SOCAL EDISON SHELL OIL CHEVRON NATIONAL GRID RELIANCE ISRAEL DEFENSE FORCES MAFAT (DDR&D) DUBAI POLICE
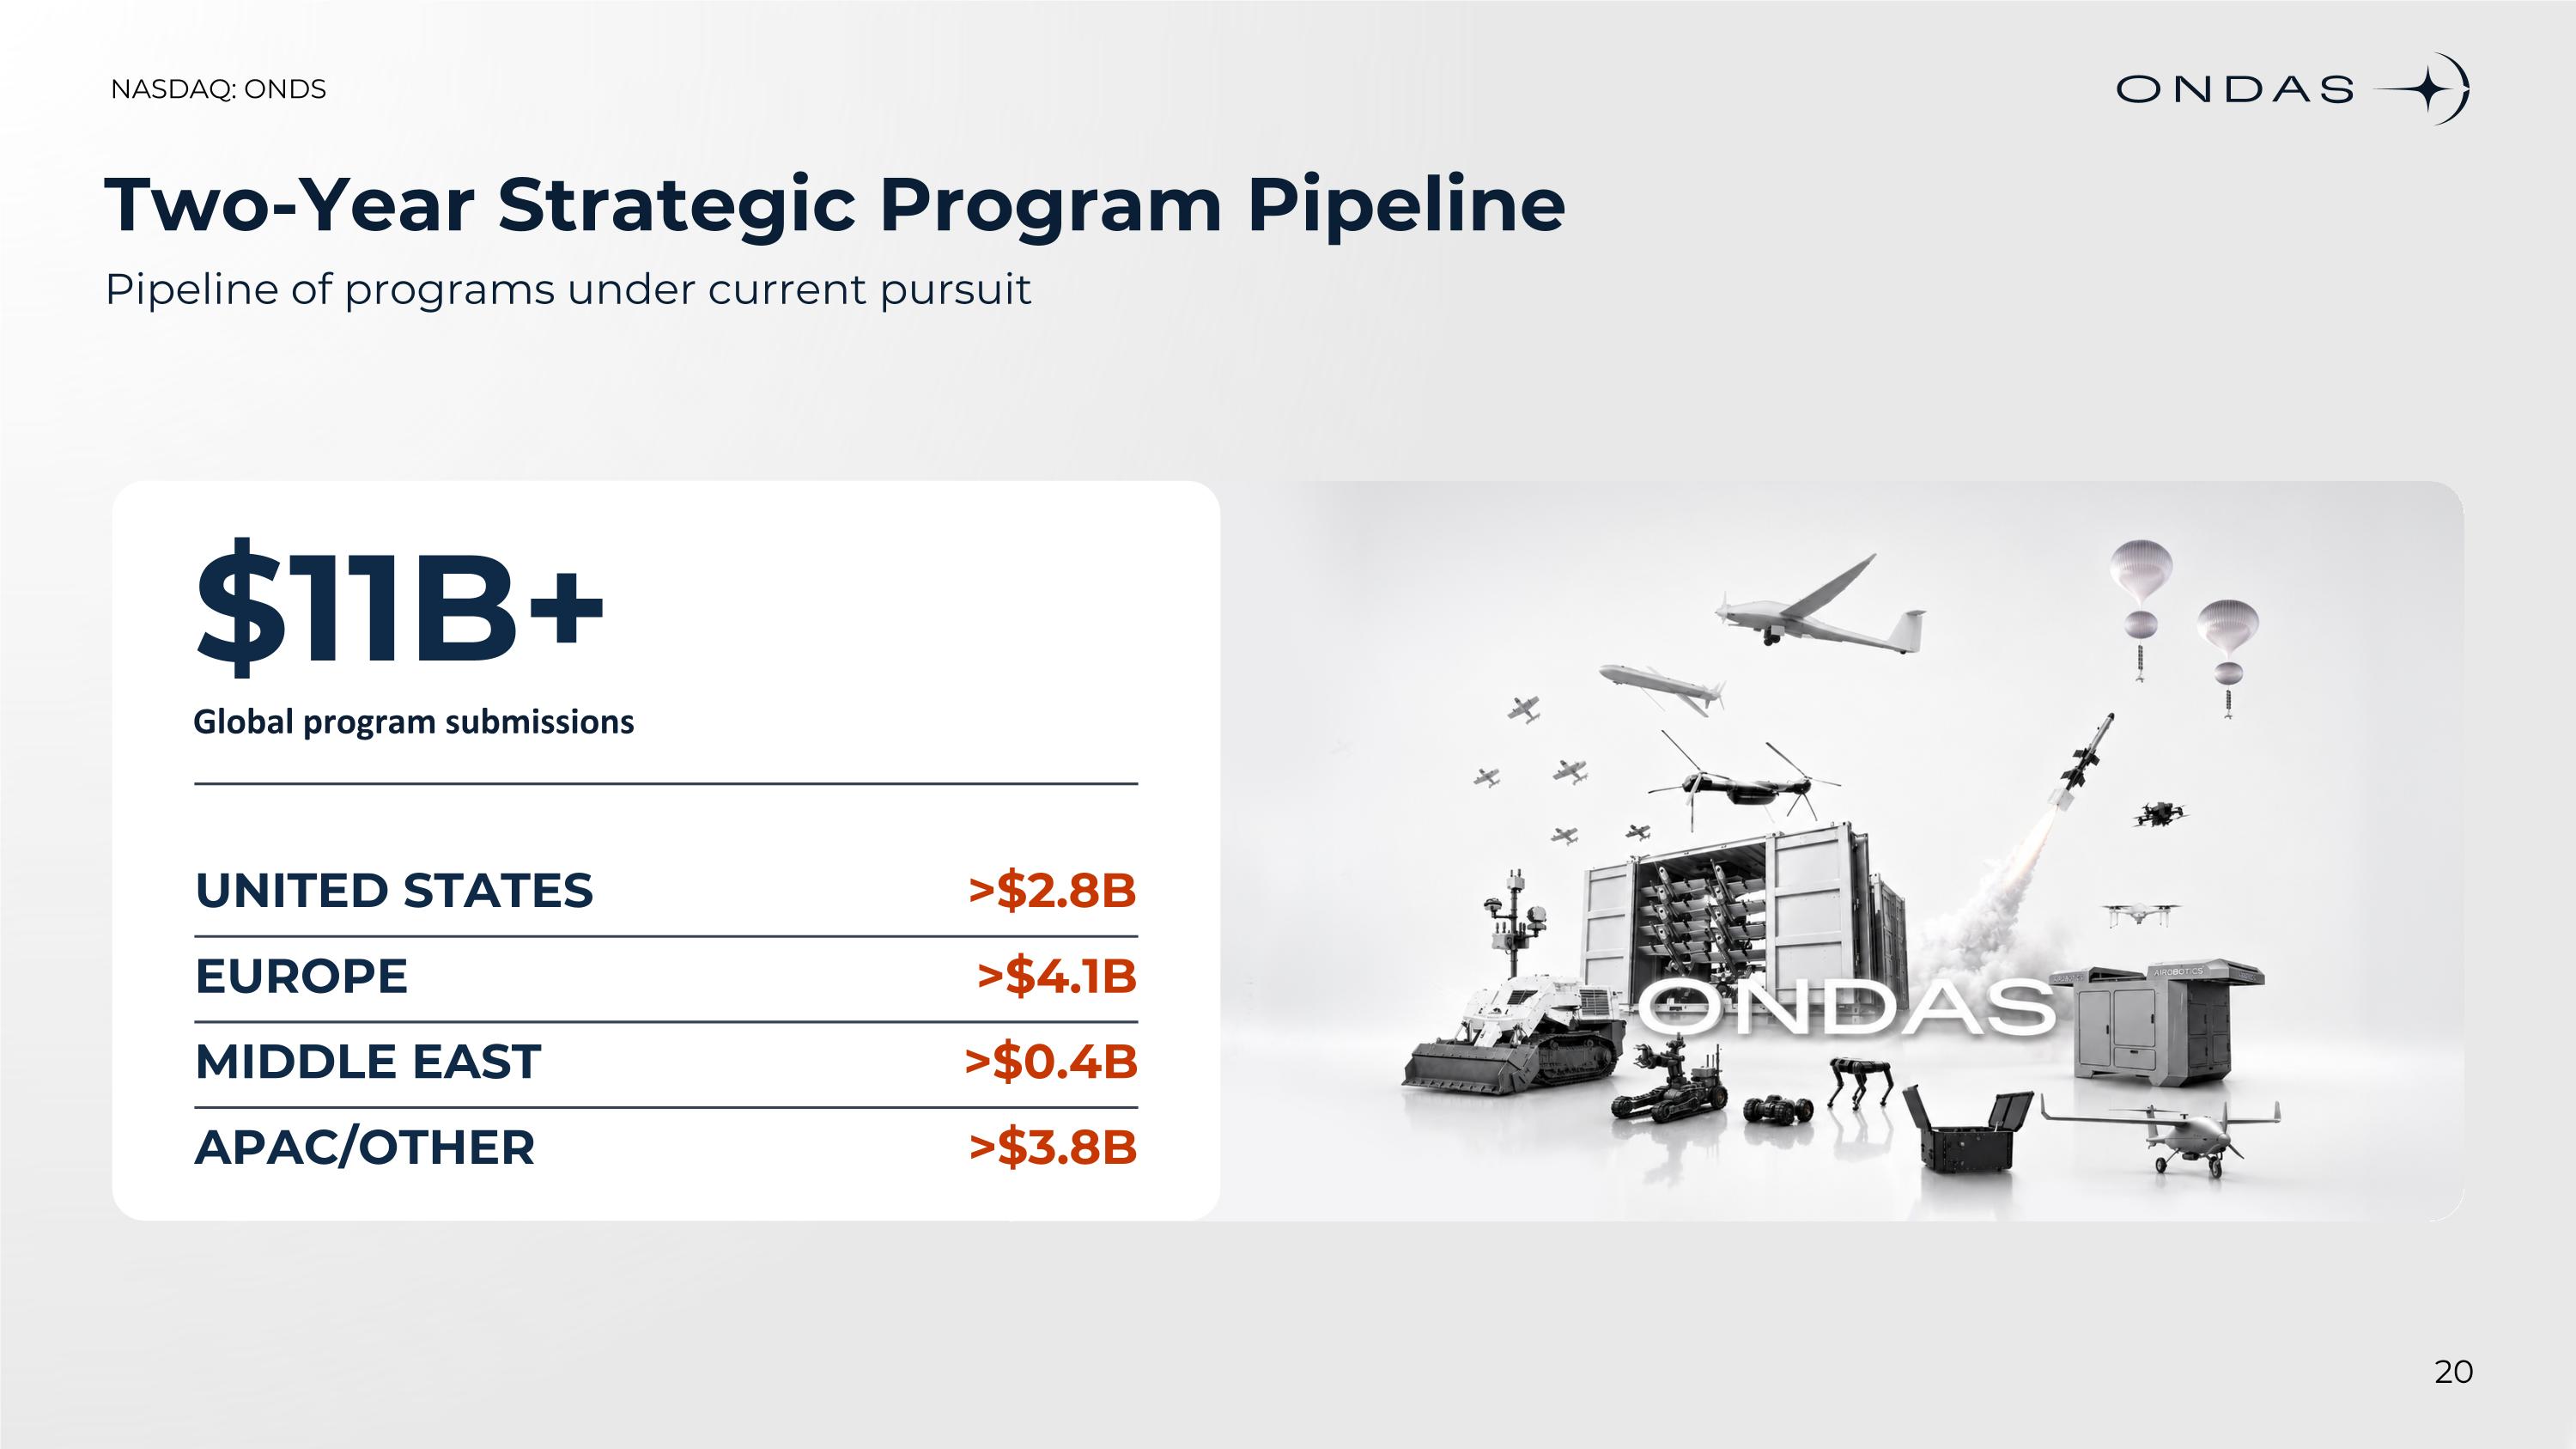
Two-Year Strategic Program Pipeline Pipeline of programs under current pursuit $11B+ Global program submissions UNITED STATES >$2.8B EUROPE >$4.1B MIDDLE EAST >$0.4B APAC/OTHER >$3.8B
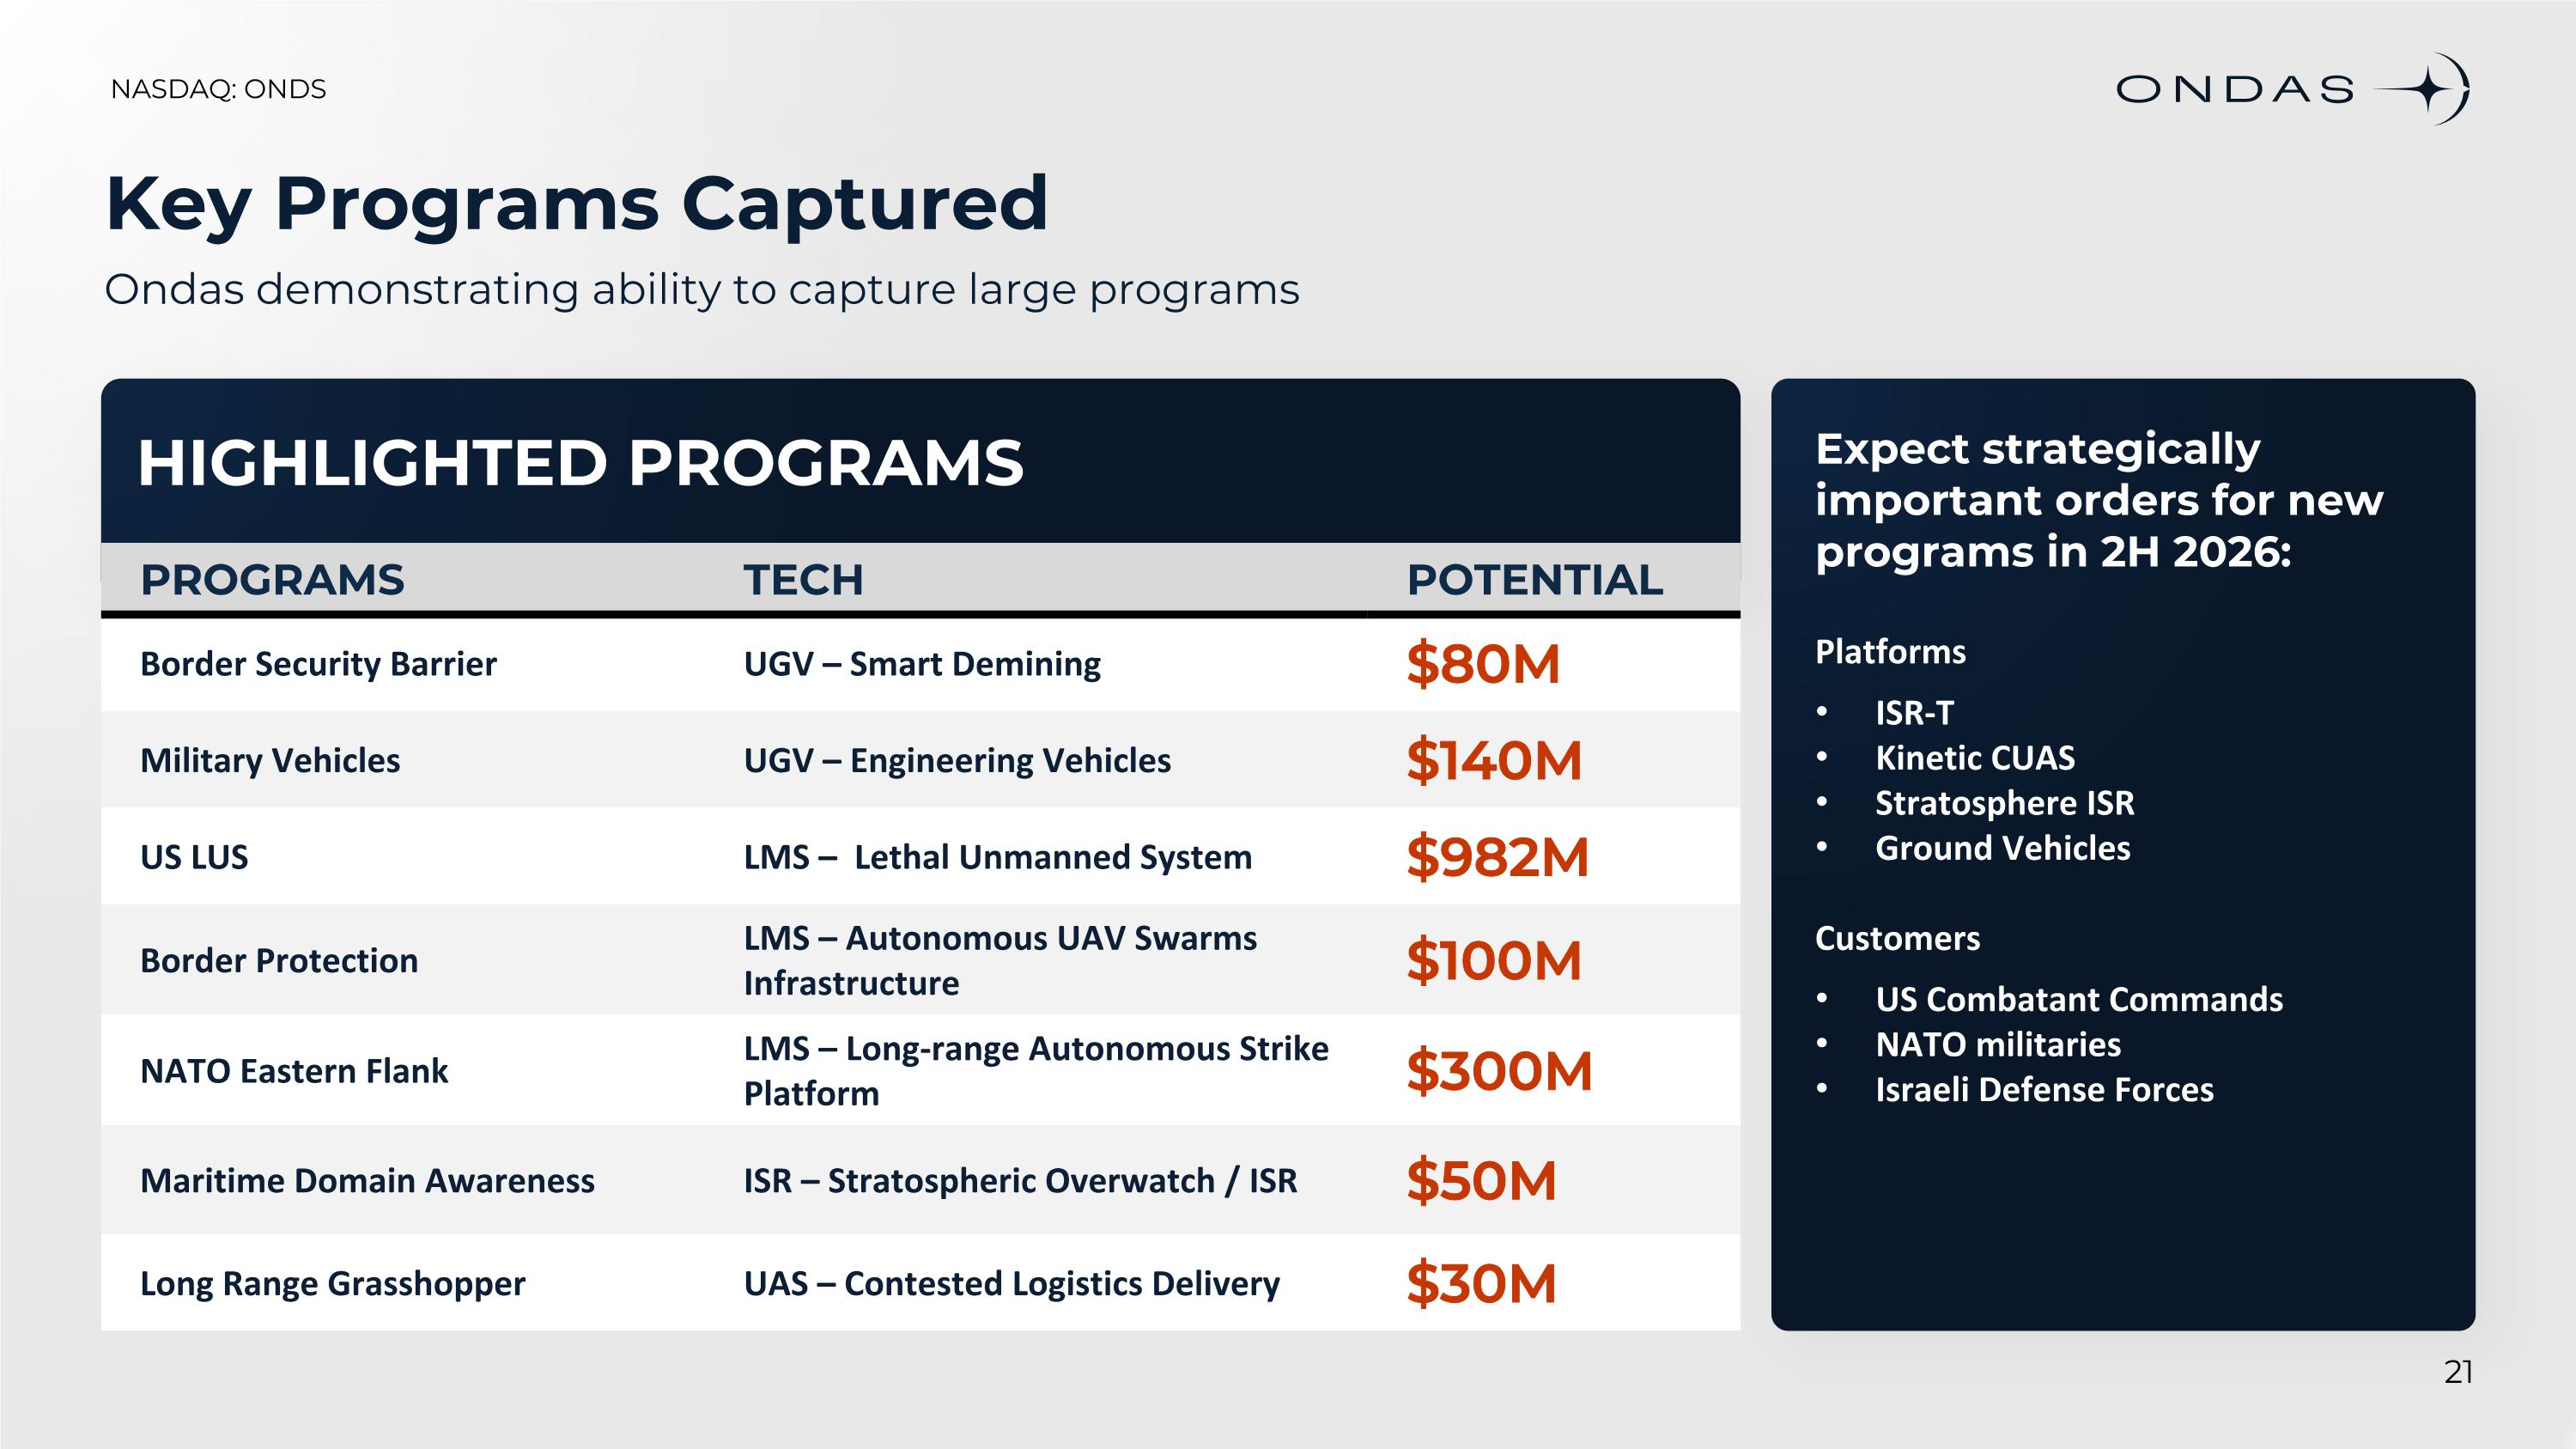
HIGHLIGHTED PROGRAMS Key Programs Captured Ondas demonstrating ability to capture large programs PROGRAMS TECH POTENTIAL Border Security Barrier UGV – Smart Demining $80M Military Vehicles UGV – Engineering Vehicles $140M US LUS LMS – Lethal Unmanned System $982M Border Protection LMS – Autonomous UAV Swarms Infrastructure $100M NATO Eastern Flank LMS – Long-range Autonomous Strike Platform $300M Maritime Domain Awareness ISR – Stratospheric Overwatch / ISR $50M Long Range Grasshopper UAS – Contested Logistics Delivery $30M Expect strategically important orders for new programs in 2H 2026: Platforms ISR-T Kinetic CUAS Stratosphere ISR Ground Vehicles Customers US Combatant Commands NATO militaries Israeli Defense Forces
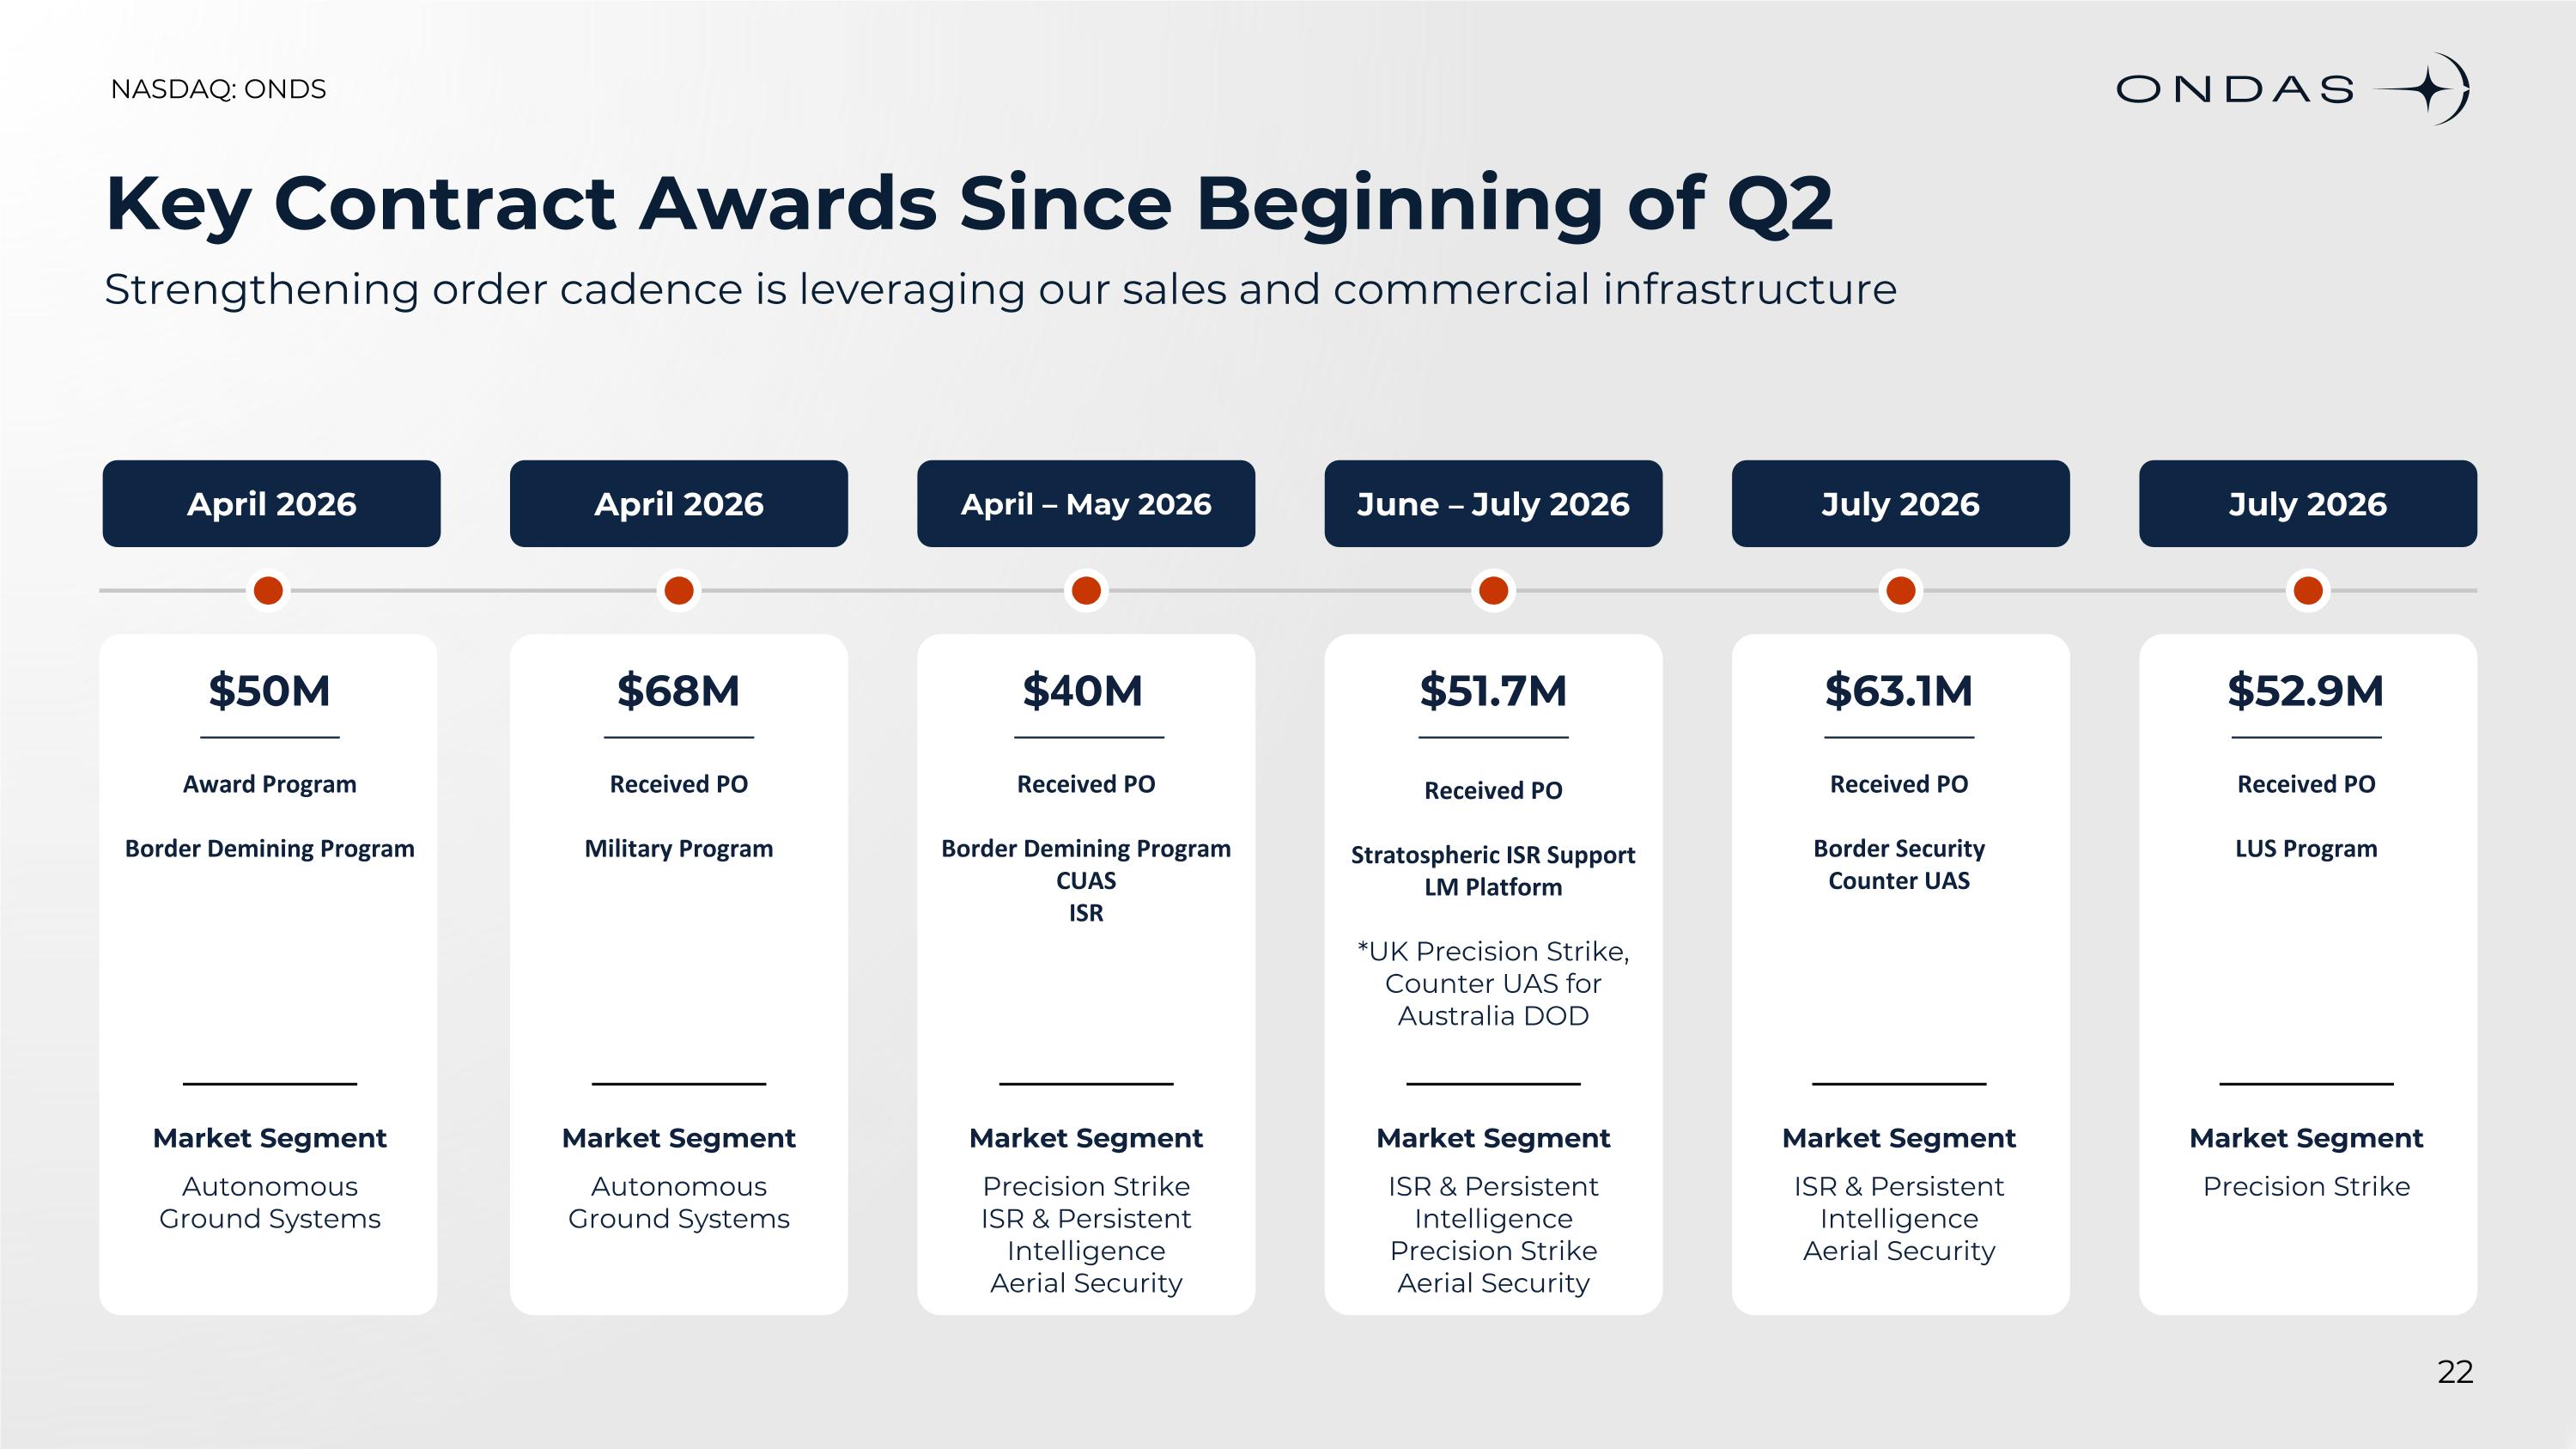
Key Contract Awards Since Beginning of Q2 Strengthening order cadence is leveraging our sales and commercial infrastructure $50M _____________ Award Program Border Demining Program _____________ Market Segment Autonomous Ground Systems April 2026 $68M ______________ Received PO Military Program _____________ Market Segment Autonomous Ground Systems April 2026 $40M ______________ Received PO Border Demining Program CUAS ISR _____________ Market Segment Precision Strike ISR & Persistent Intelligence Aerial Security April – May 2026 $51.7M ______________ Received PO Stratospheric ISR Support LM Platform *UK Precision Strike, Counter UAS for Australia DOD _____________ Market Segment ISR & Persistent Intelligence Precision Strike Aerial Security June – July 2026 $63.1M ______________ Received PO Border Security Counter UAS _____________ Market Segment ISR & Persistent Intelligence Aerial Security July 2026 $52.9M ______________ Received PO LUS Program _____________ Market Segment Precision Strike July 2026
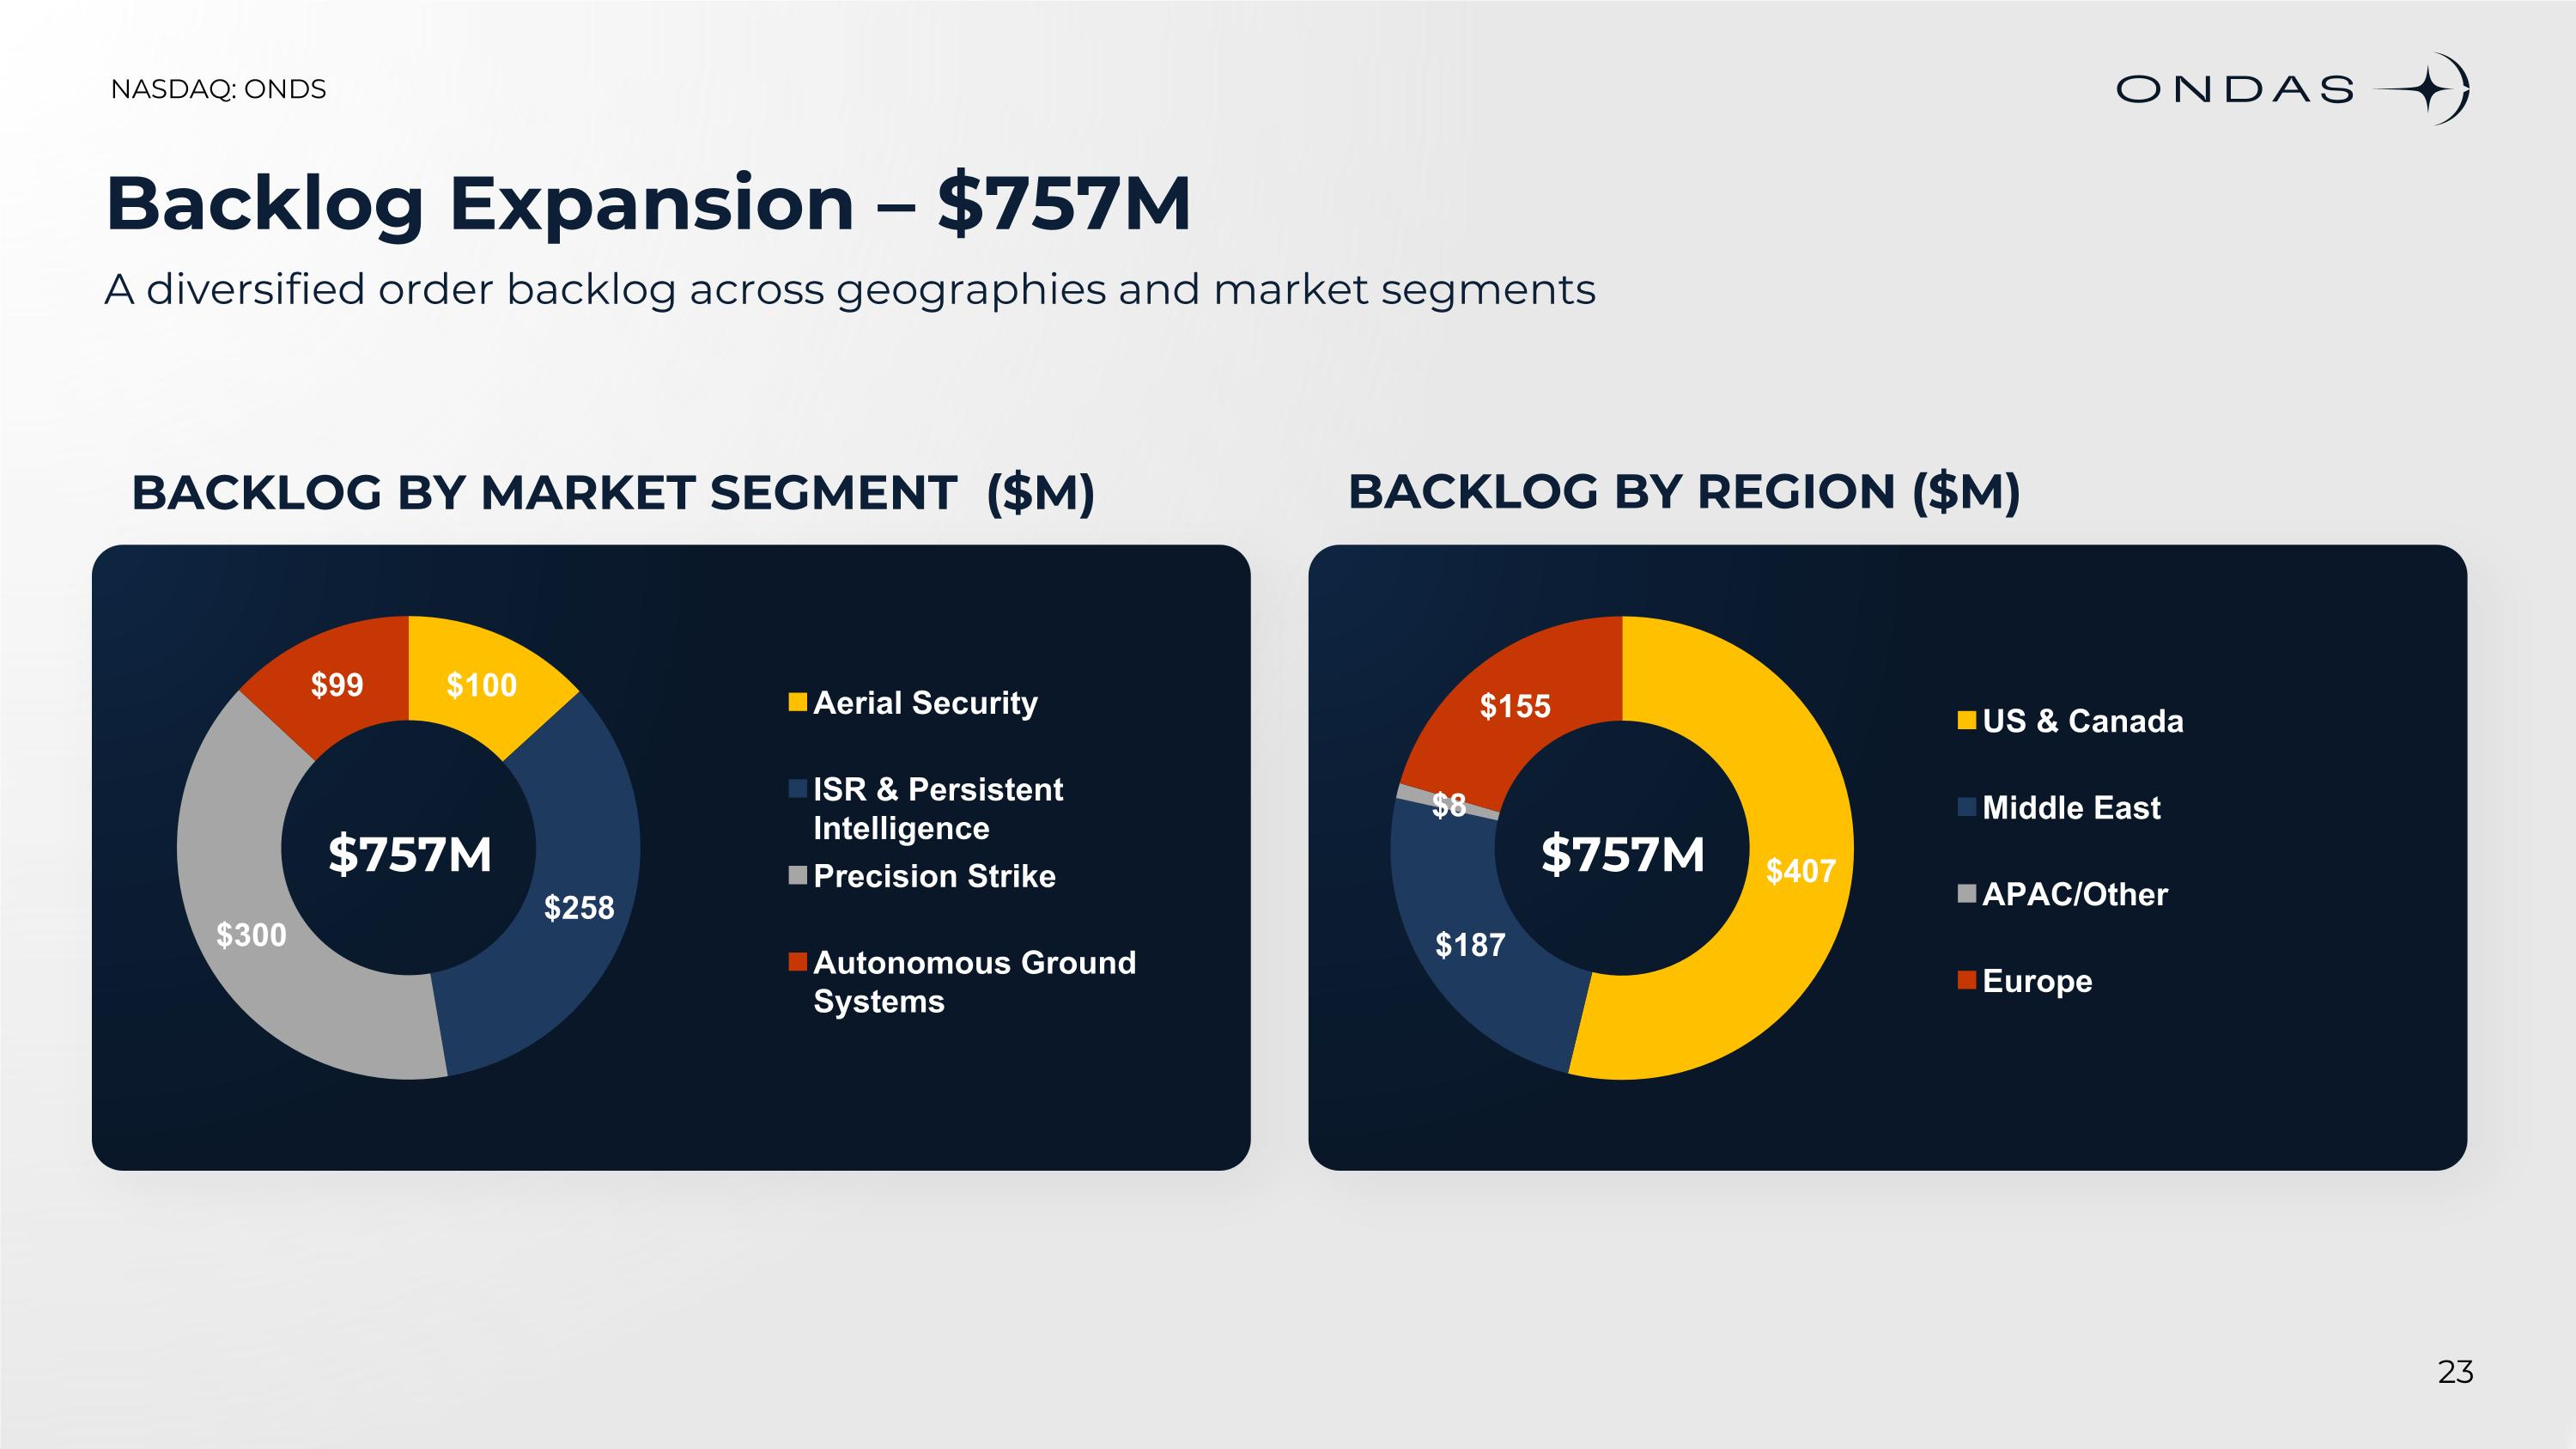
Backlog Expansion – $757M A diversified order backlog across geographies and market segments BACKLOG BY MARKET SEGMENT ($M) BACKLOG BY REGION ($M) $757M $757M
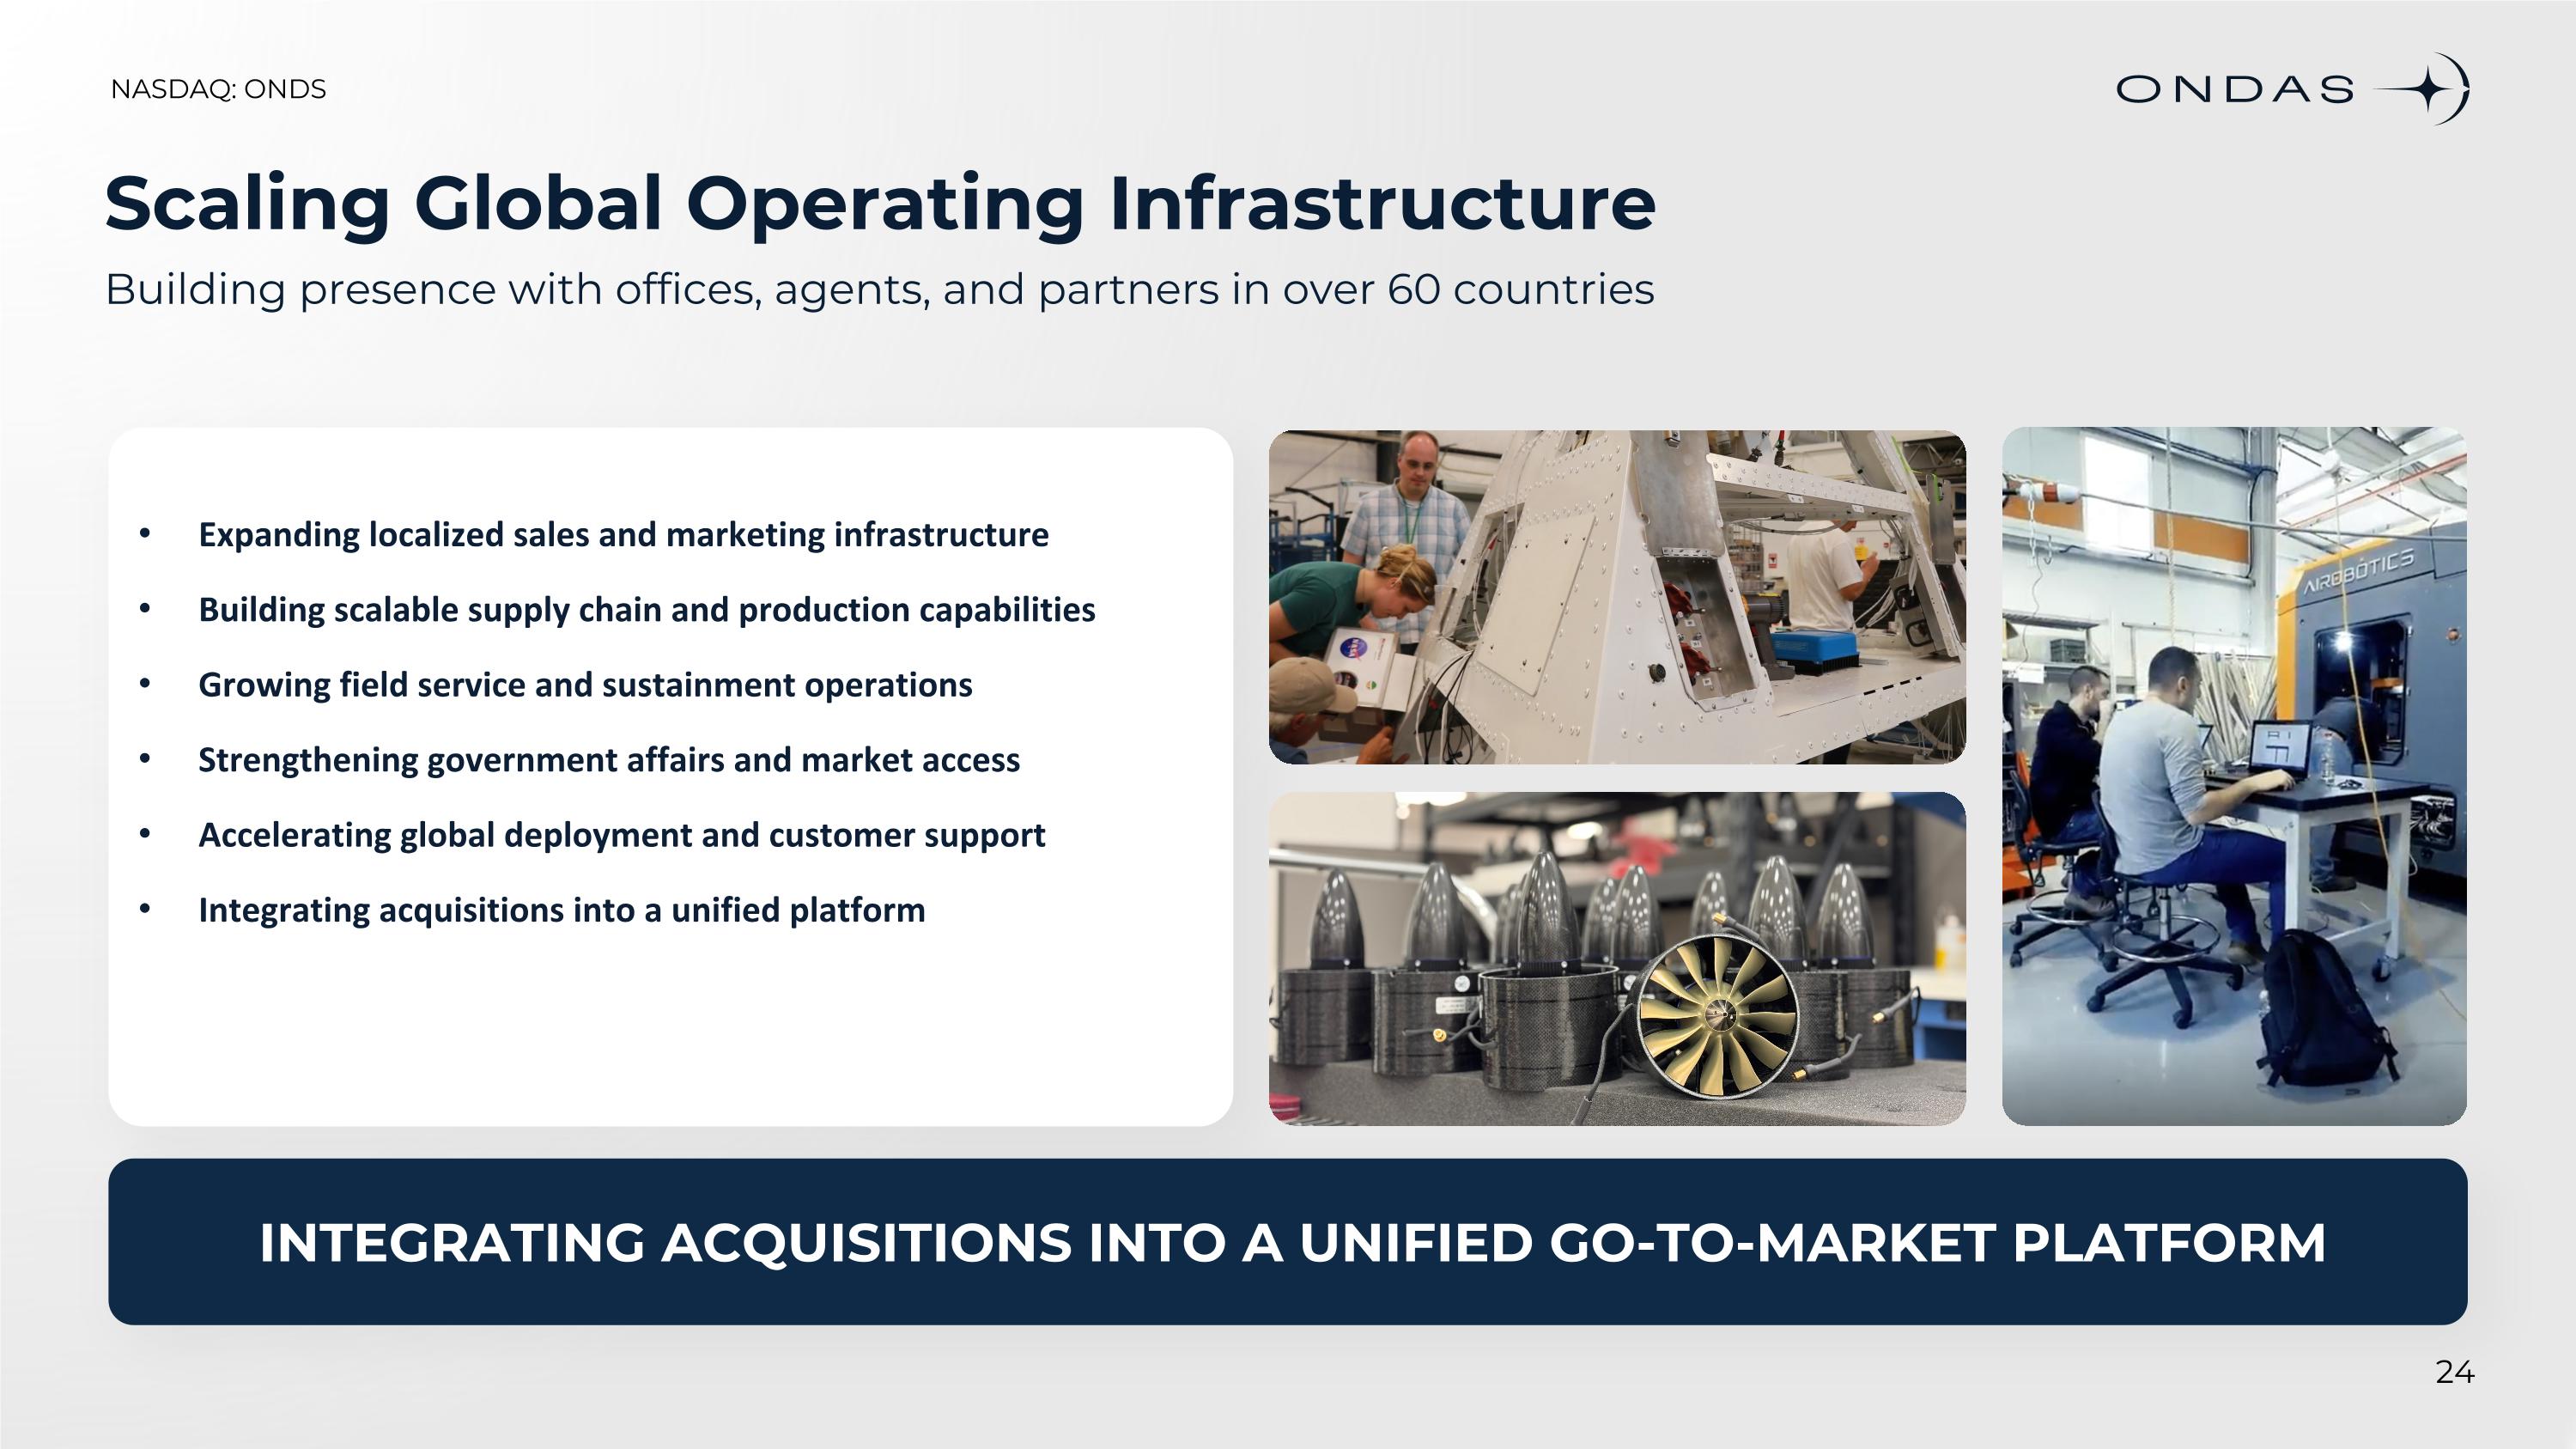
Scaling Global Operating Infrastructure Building presence with offices, agents, and partners in over 60 countries Expanding localized sales and marketing infrastructure Building scalable supply chain and production capabilities Growing field service and sustainment operations Strengthening government affairs and market access Accelerating global deployment and customer support Integrating acquisitions into a unified platform INTEGRATING ACQUISITIONS INTO A UNIFIED GO-TO-MARKET PLATFORM
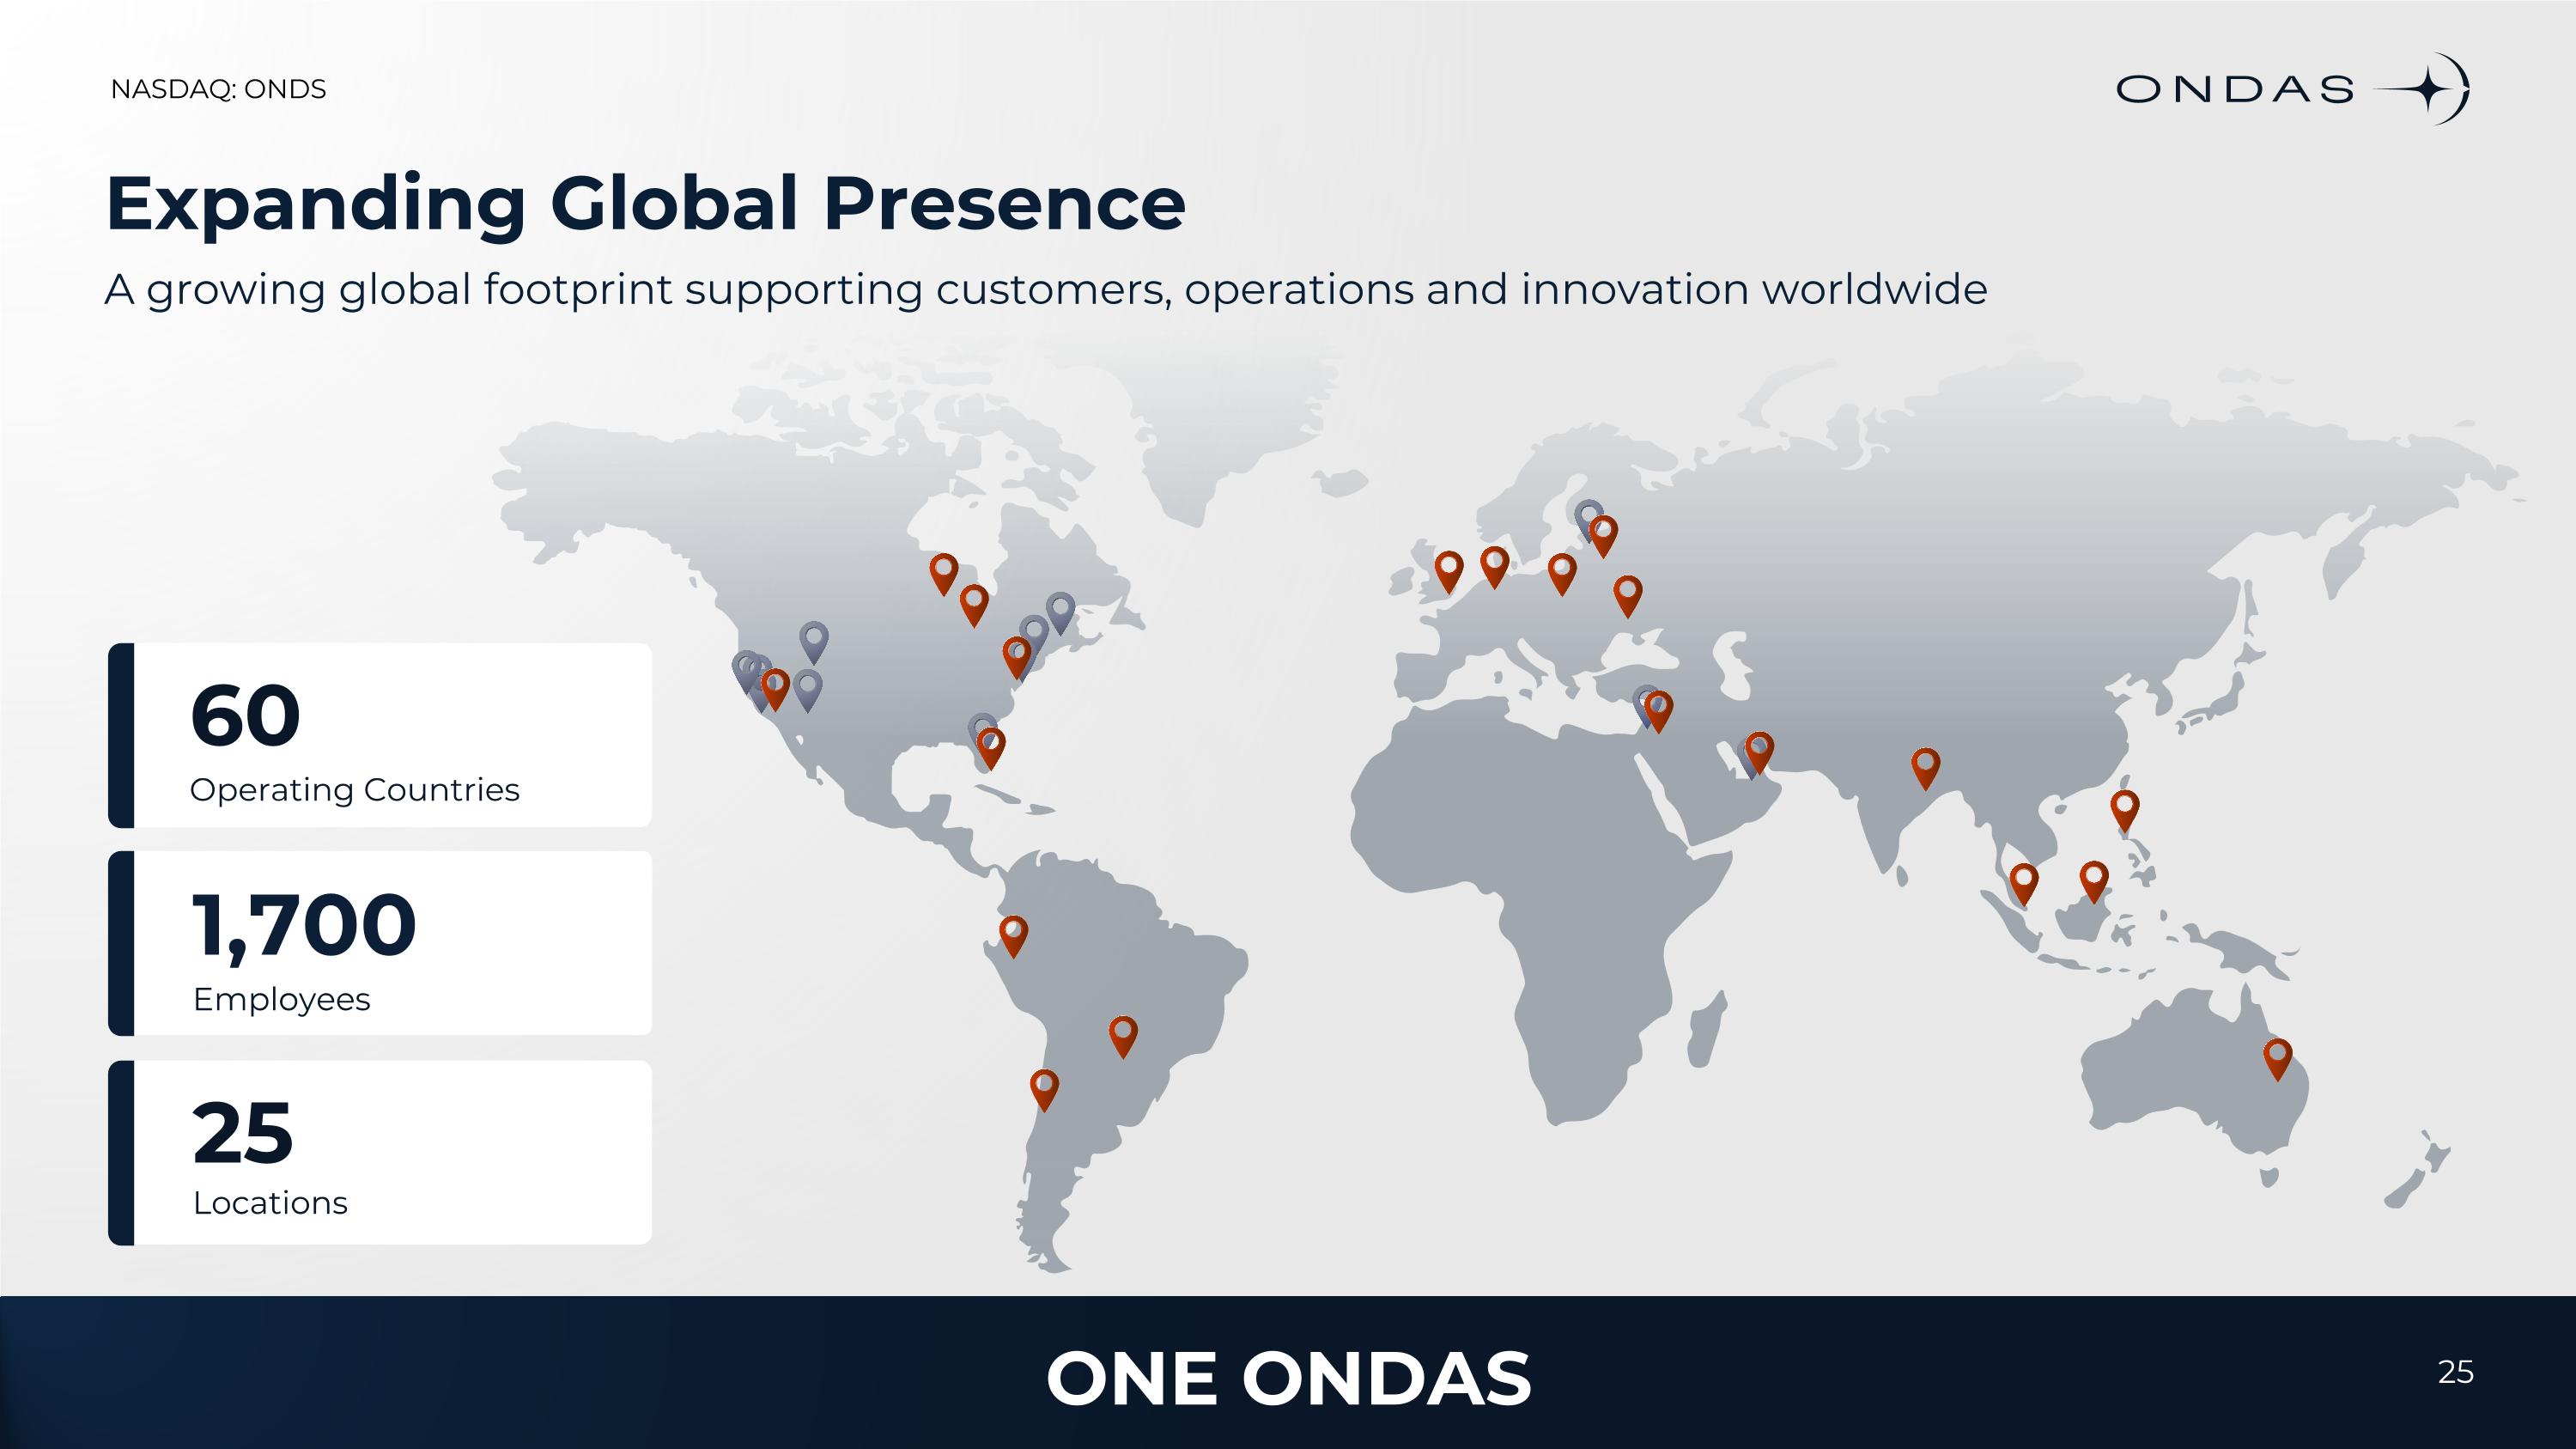
Expanding Global Presence A growing global footprint supporting customers, operations and innovation worldwide 60 Operating Countries 1,700 Employees 25 Locations ONE ONDAS 25
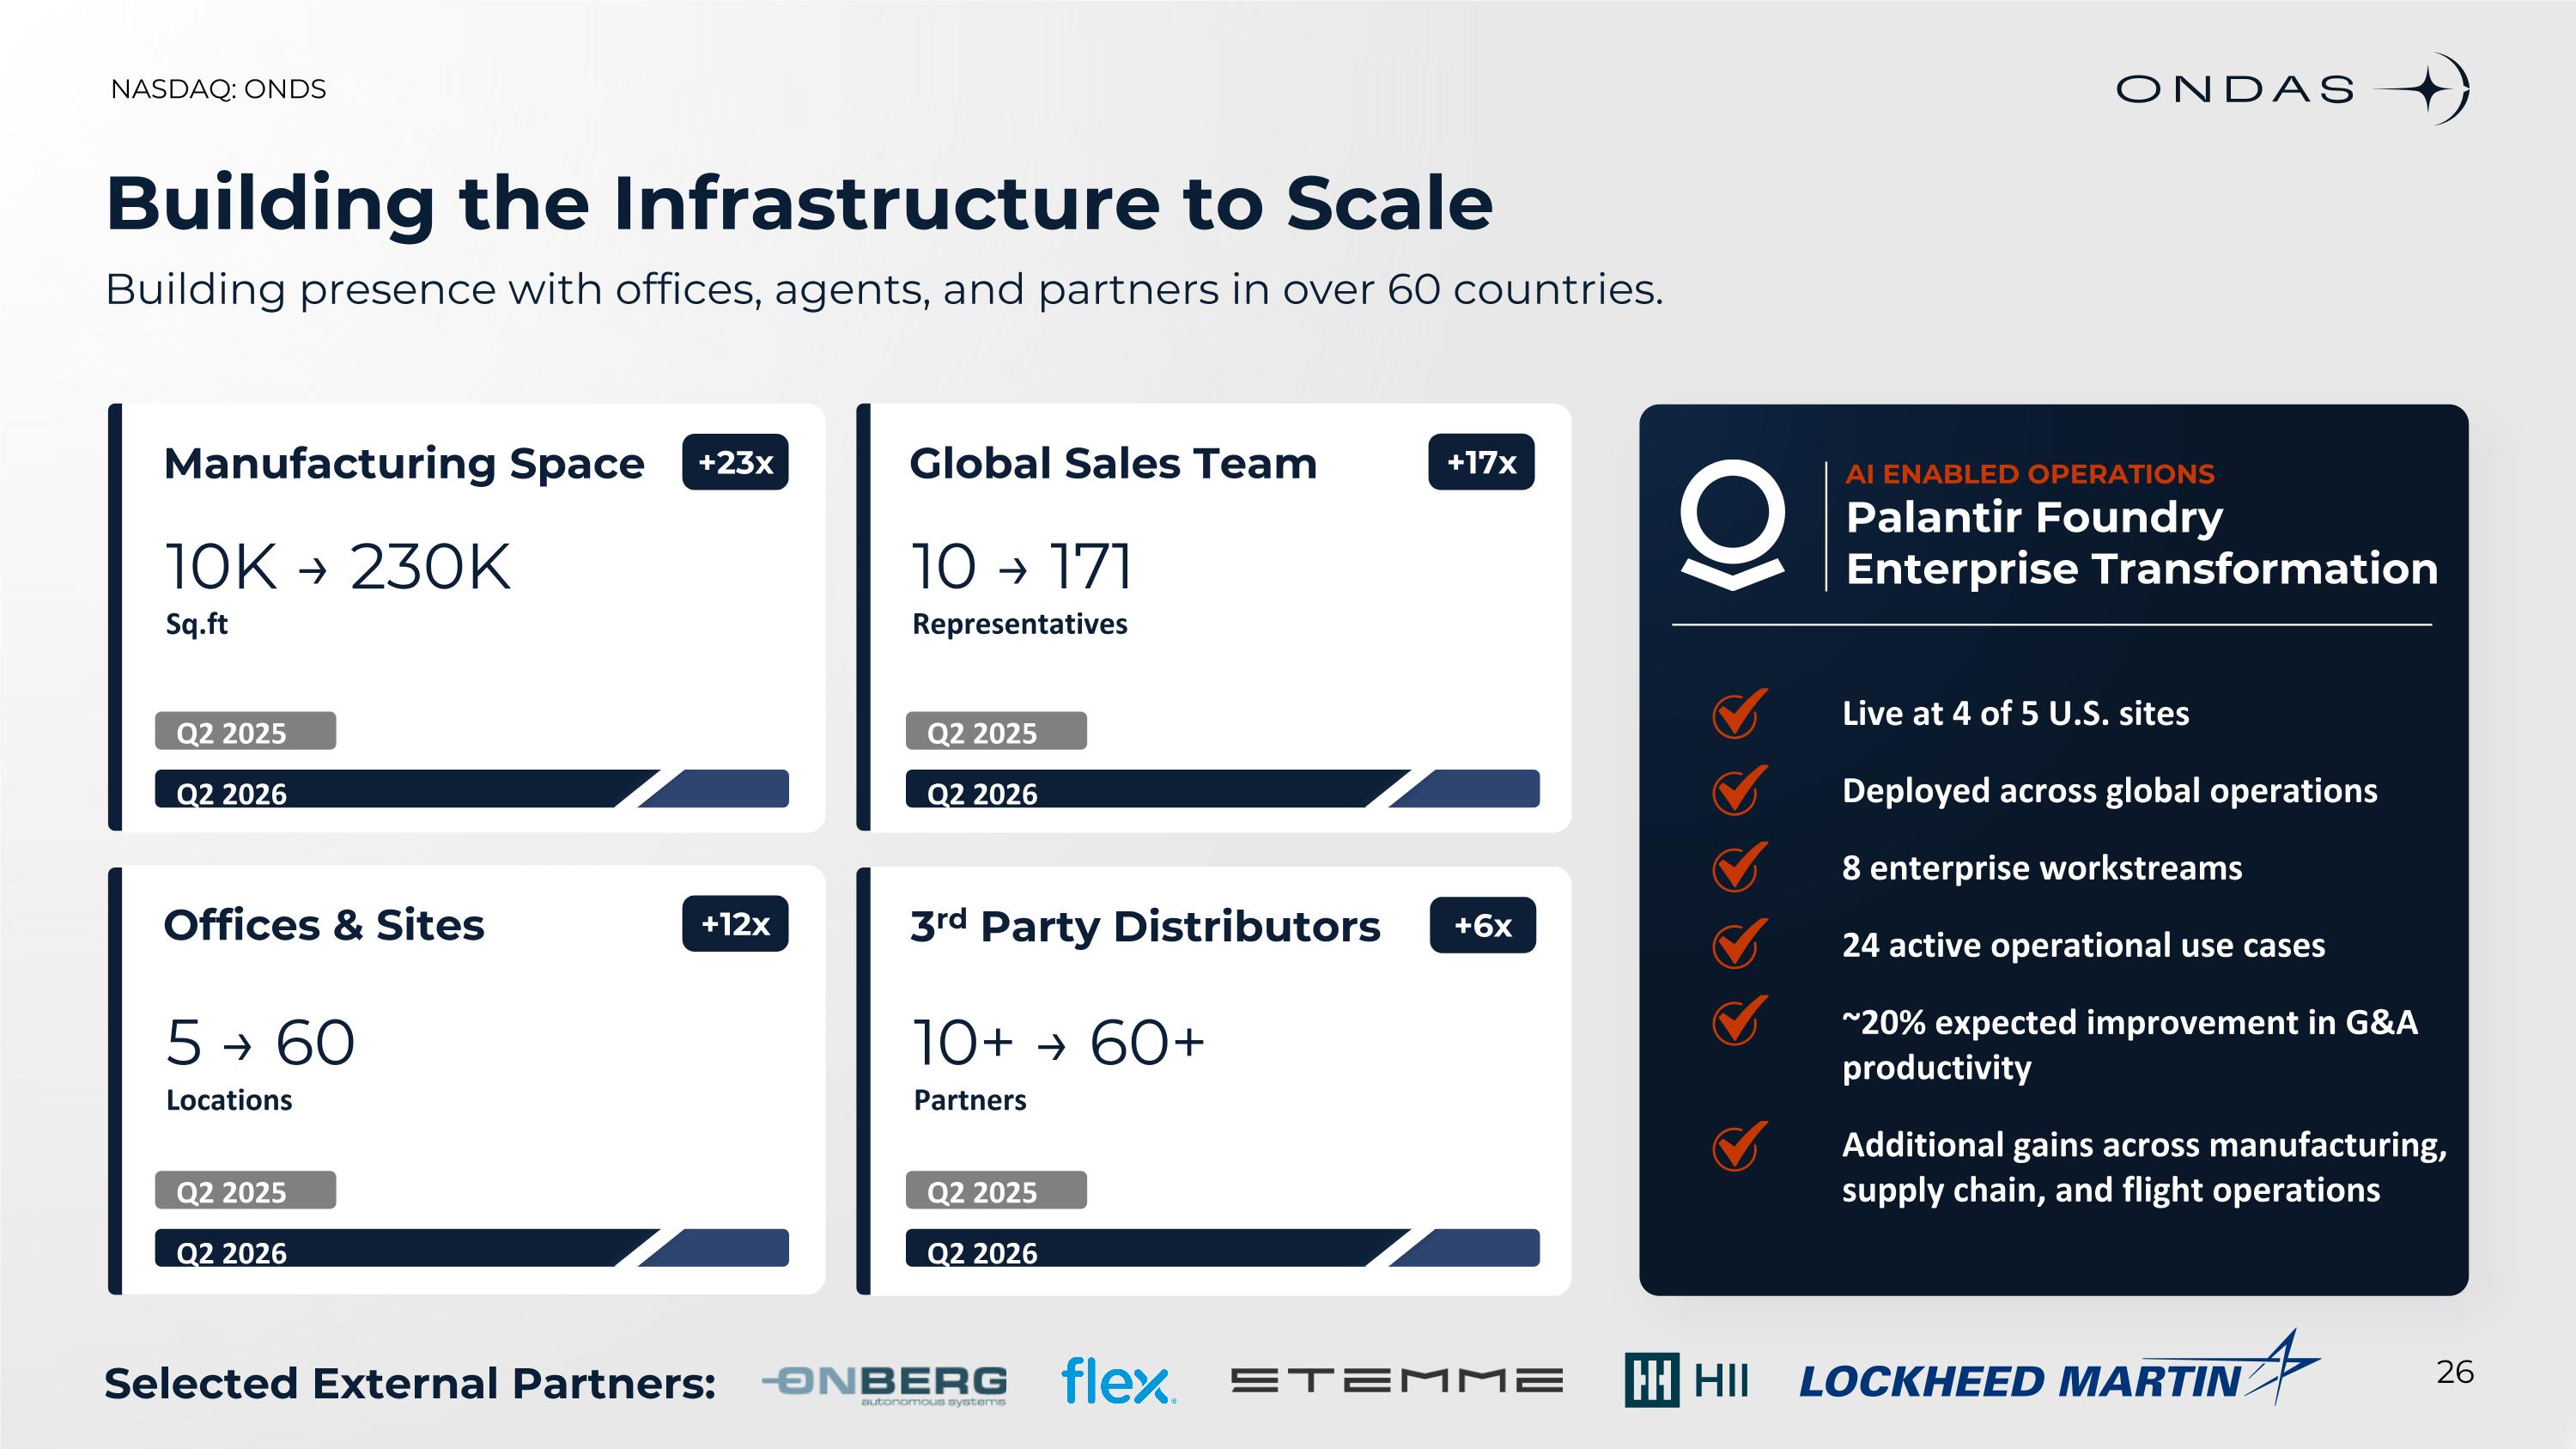
Building the Infrastructure to Scale Building presence with offices, agents, and partners in over 60 countries. Manufacturing Space 10K → 230K Sq.ft +23x Q2 2025 Q2 2026 Global Sales Team 10 → 171 Representatives +17x Q2 2025 Q2 2026 Offices & Sites 5 → 60 Locations +12x Q2 2025 Q2 2026 3rd Party Distributors 10+ → 60+ Partners +6x Q2 2025 Q2 2026 AI ENABLED OPERATIONS Palantir Foundry Enterprise Transformation Live at 4 of 5 U.S. sites Deployed across global operations 8 enterprise workstreams 24 active operational use cases ~20% expected improvement in G&A productivity Additional gains across manufacturing, supply chain, and flight operations Selected External Partners:
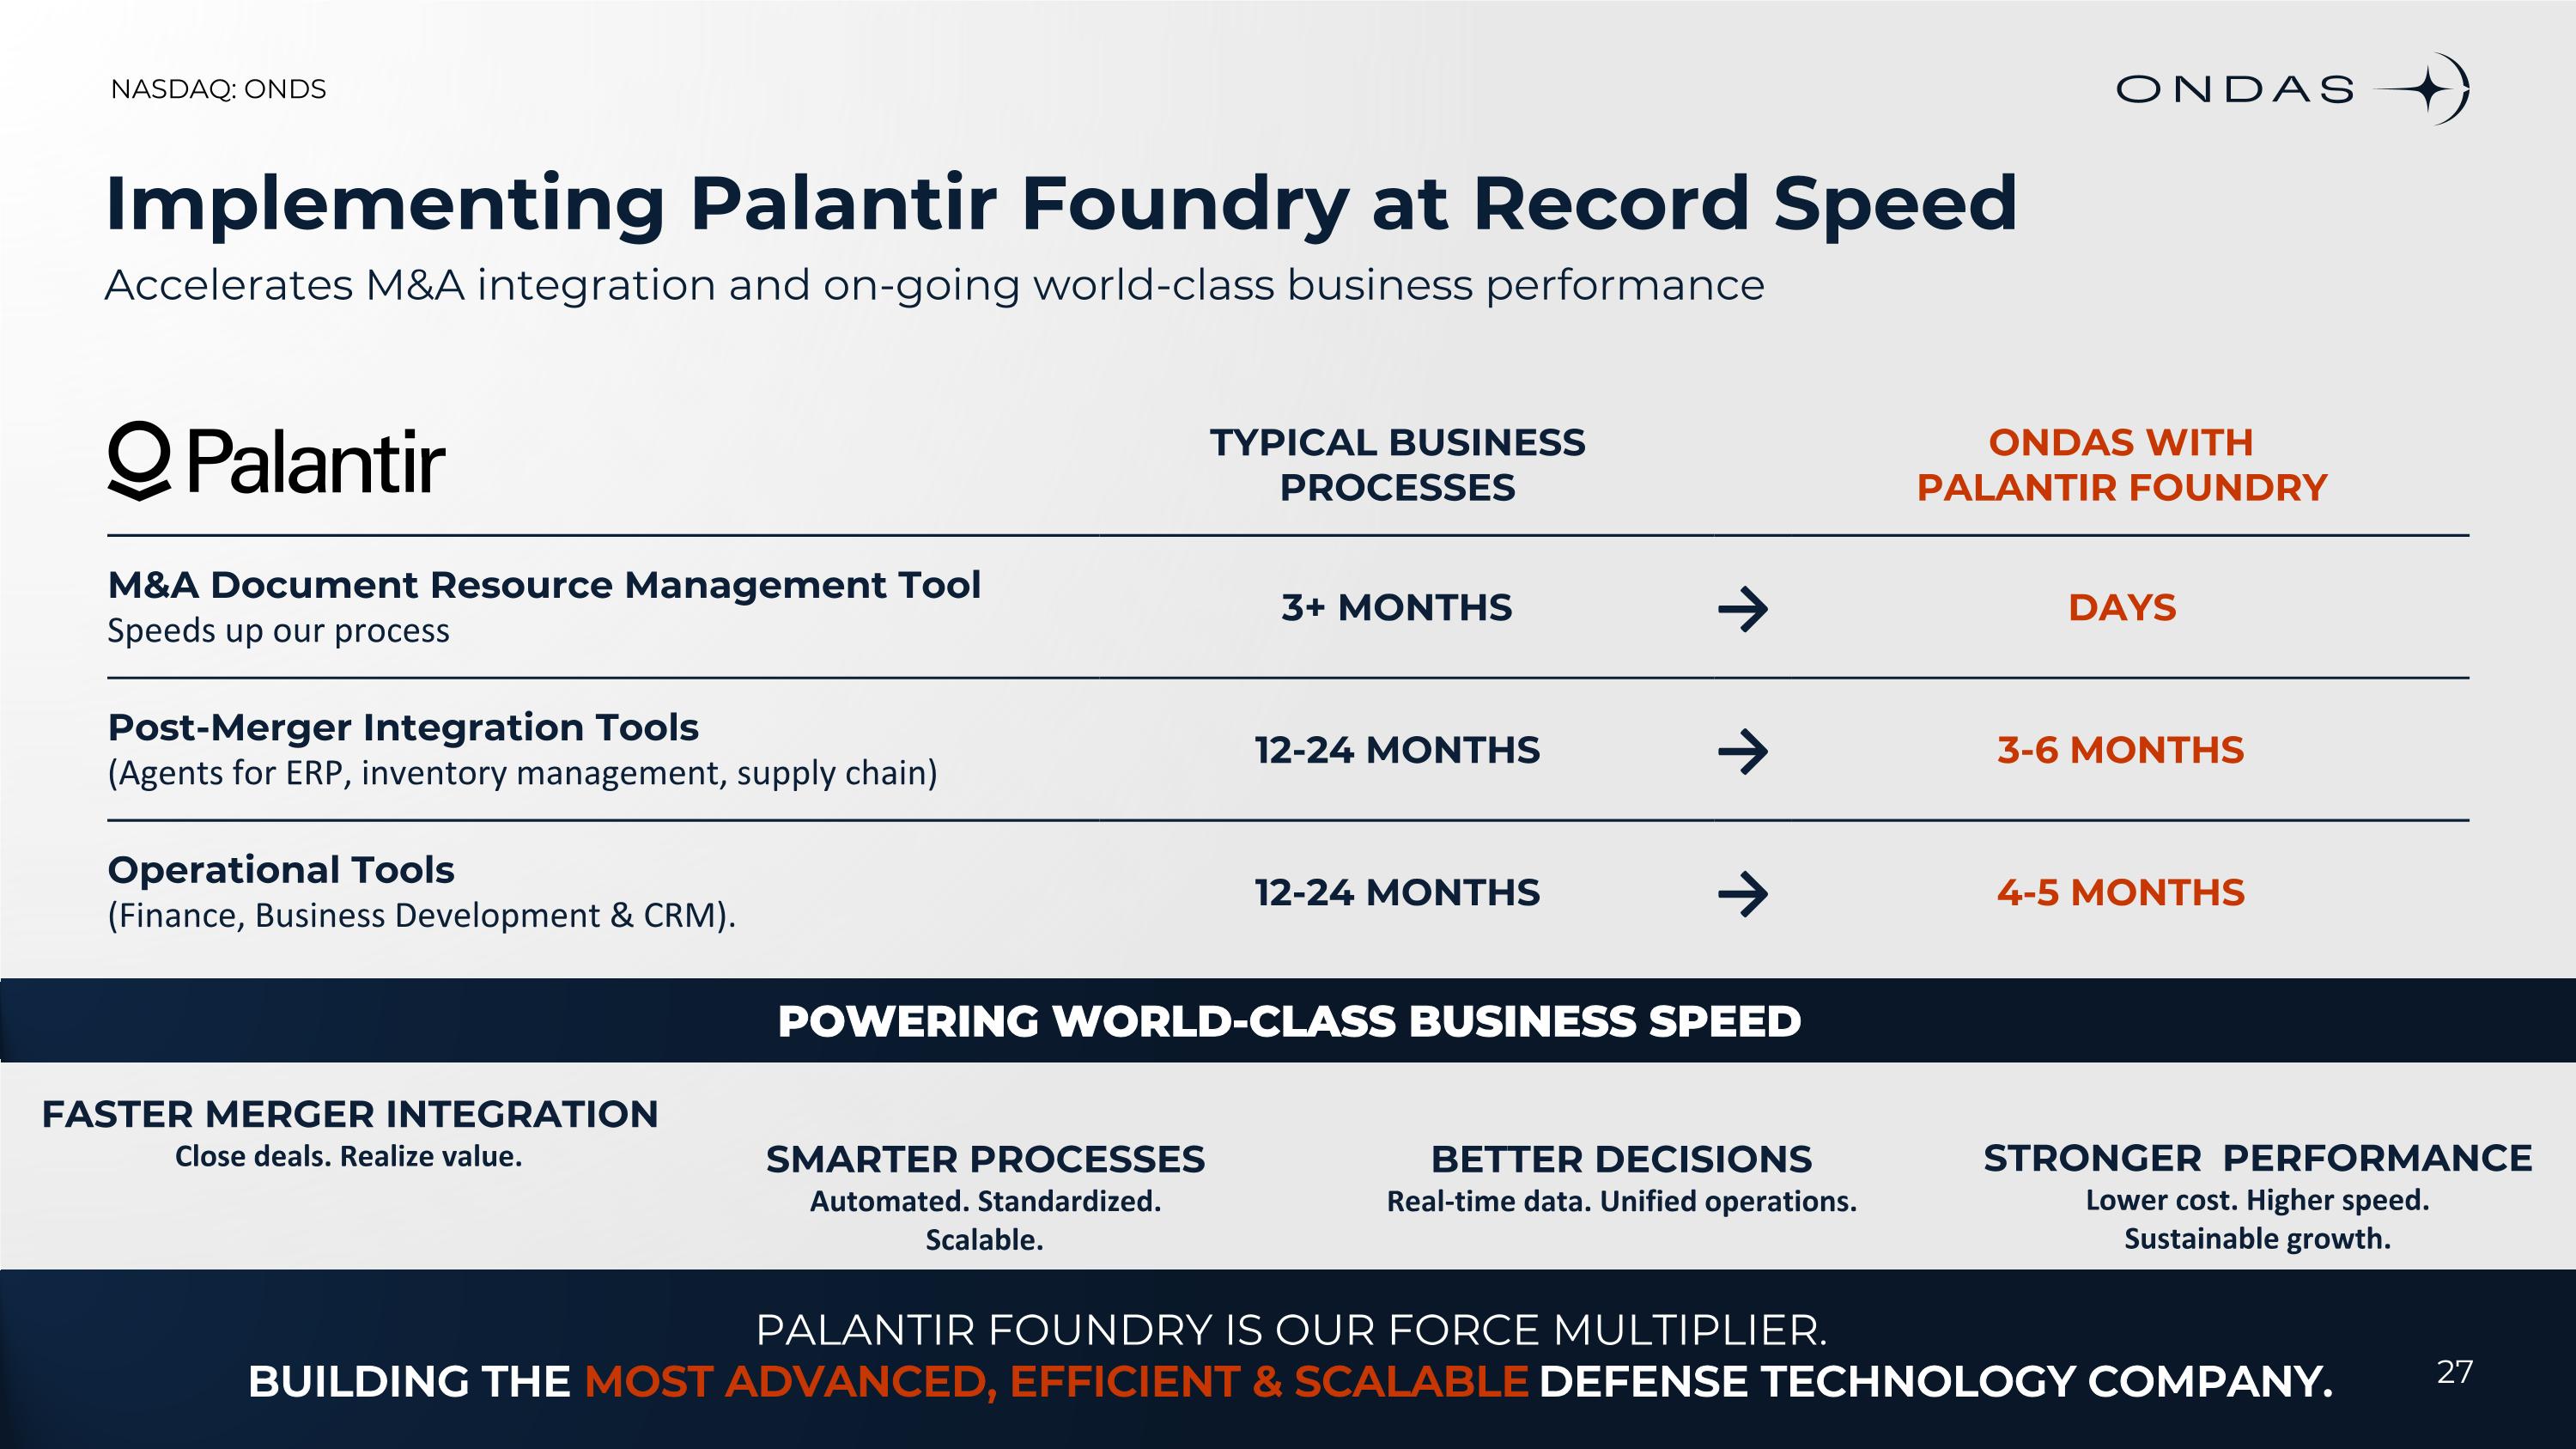
Implementing Palantir Foundry at Record Speed Accelerates M&A integration and on-going world-class business performance PALANTIR FOUNDRY IS OUR FORCE MULTIPLIER. BUILDING THE MOST ADVANCED, EFFICIENT & SCALABLE DEFENSE TECHNOLOGY COMPANY. 27 FASTER MERGER INTEGRATION Close deals. Realize value. SMARTER PROCESSES Automated. Standardized. Scalable. BETTER DECISIONS Real-time data. Unified operations. STRONGER PERFORMANCE Lower cost. Higher speed. Sustainable growth. POWERING WORLD-CLASS BUSINESS SPEED TYPICAL BUSINESS PROCESSES ONDAS WITH PALANTIR FOUNDRY M&A Document Resource Management Tool Speeds up our process 3+ MONTHS → DAYS Post-Merger Integration Tools (Agents for ERP, inventory management, supply chain) 12-24 MONTHS → 3-6 MONTHS Operational Tools (Finance, Business Development & CRM). 12-24 MONTHS → 4-5 MONTHS
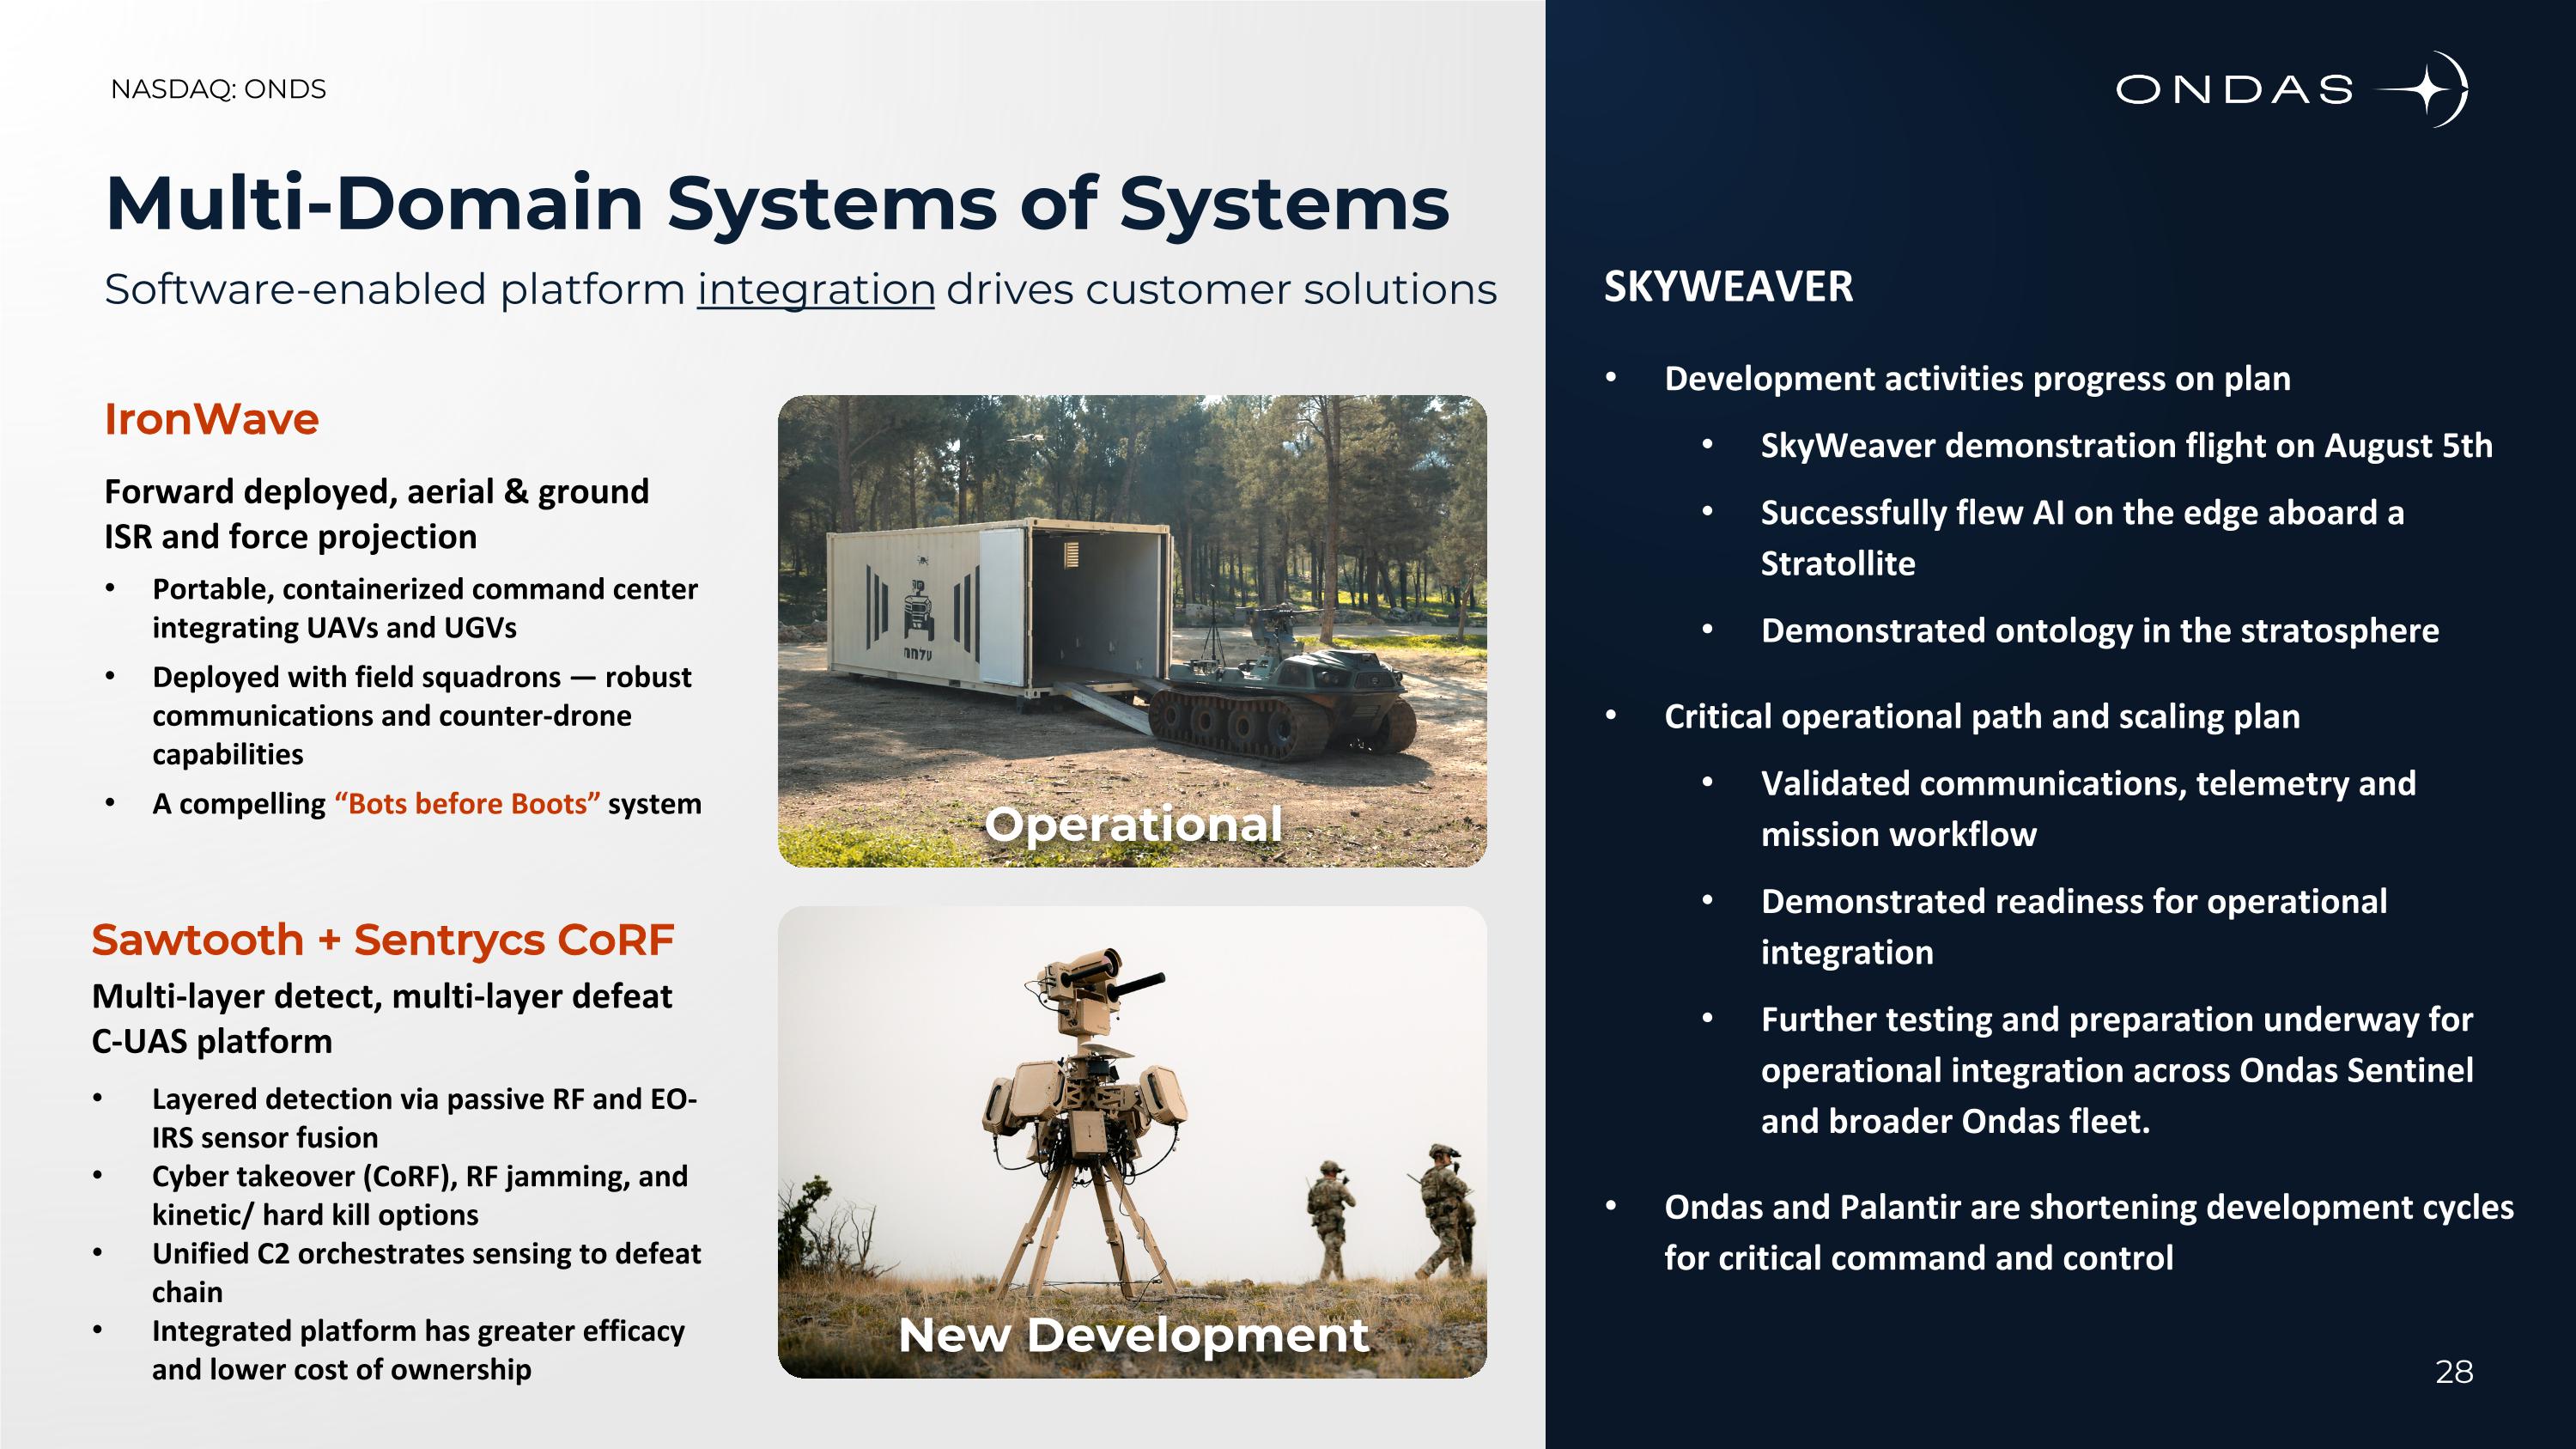
Multi-Domain Systems of Systems Software-enabled platform integration drives customer solutions IronWave Forward deployed, aerial & ground ISR and force projection Portable, containerized command center integrating UAVs and UGVs Deployed with field squadrons — robust communications and counter-drone capabilities A compelling “Bots before Boots” system SKYWEAVER Development activities progress on plan SkyWeaver demonstration flight on August 5th Successfully flew AI on the edge aboard a Stratollite Demonstrated ontology in the stratosphere Critical operational path and scaling plan Validated communications, telemetry and mission workflow Demonstrated readiness for operational integration Further testing and preparation underway for operational integration across Ondas Sentinel and broader Ondas fleet. Ondas and Palantir are shortening development cycles for critical command and control Sawtooth + Sentrycs CoRF Multi-layer detect, multi-layer defeat C-UAS platform Layered detection via passive RF and EO-IRS sensor fusion Cyber takeover (CoRF), RF jamming, and kinetic/ hard kill options Unified C2 orchestrates sensing to defeat chain Integrated platform has greater efficacy and lower cost of ownership Operational New Development 28
OUTLOOK Second Quarter 2026 Earnings Release NASDAQ: ONDS | August 13, 2026
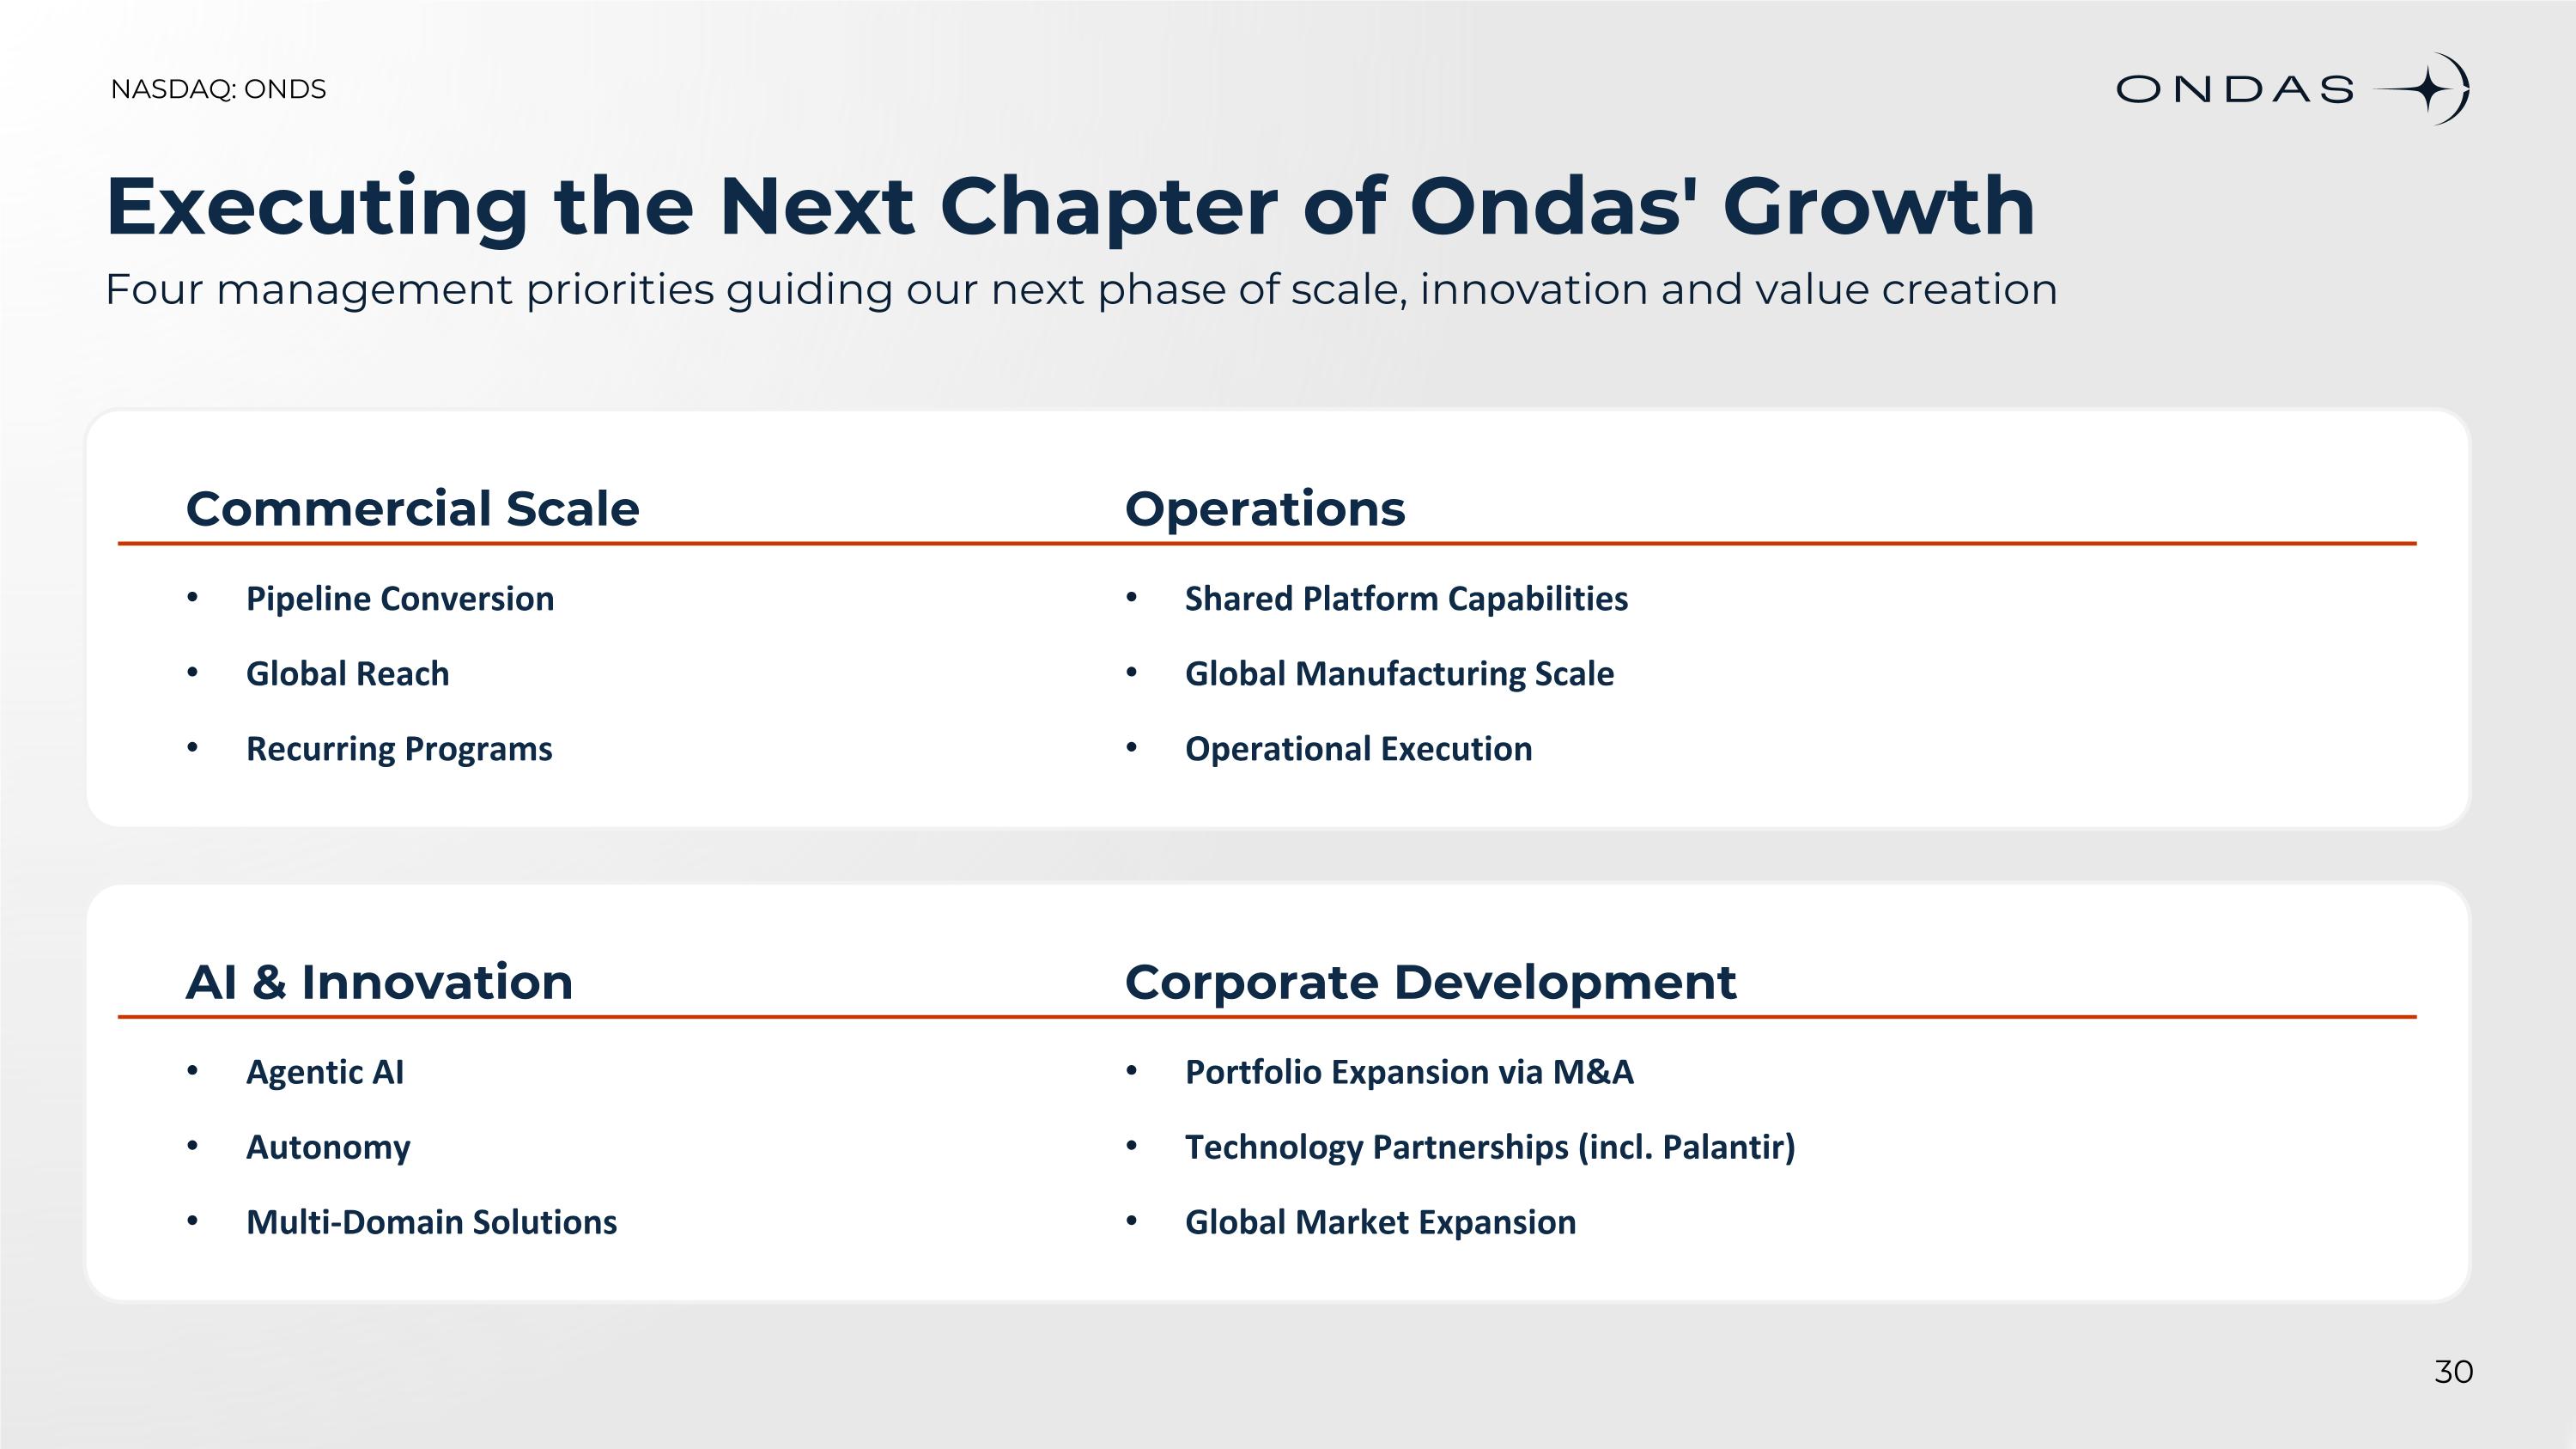
Executing the Next Chapter of Ondas' Growth Four management priorities guiding our next phase of scale, innovation and value creation Commercial Scale Pipeline Conversion Global Reach Recurring Programs Operations Shared Platform Capabilities Global Manufacturing Scale Operational Execution Corporate Development Portfolio Expansion via M&A Technology Partnerships (incl. Palantir) Global Market Expansion AI & Innovation Agentic AI Autonomy Multi-Domain Solutions
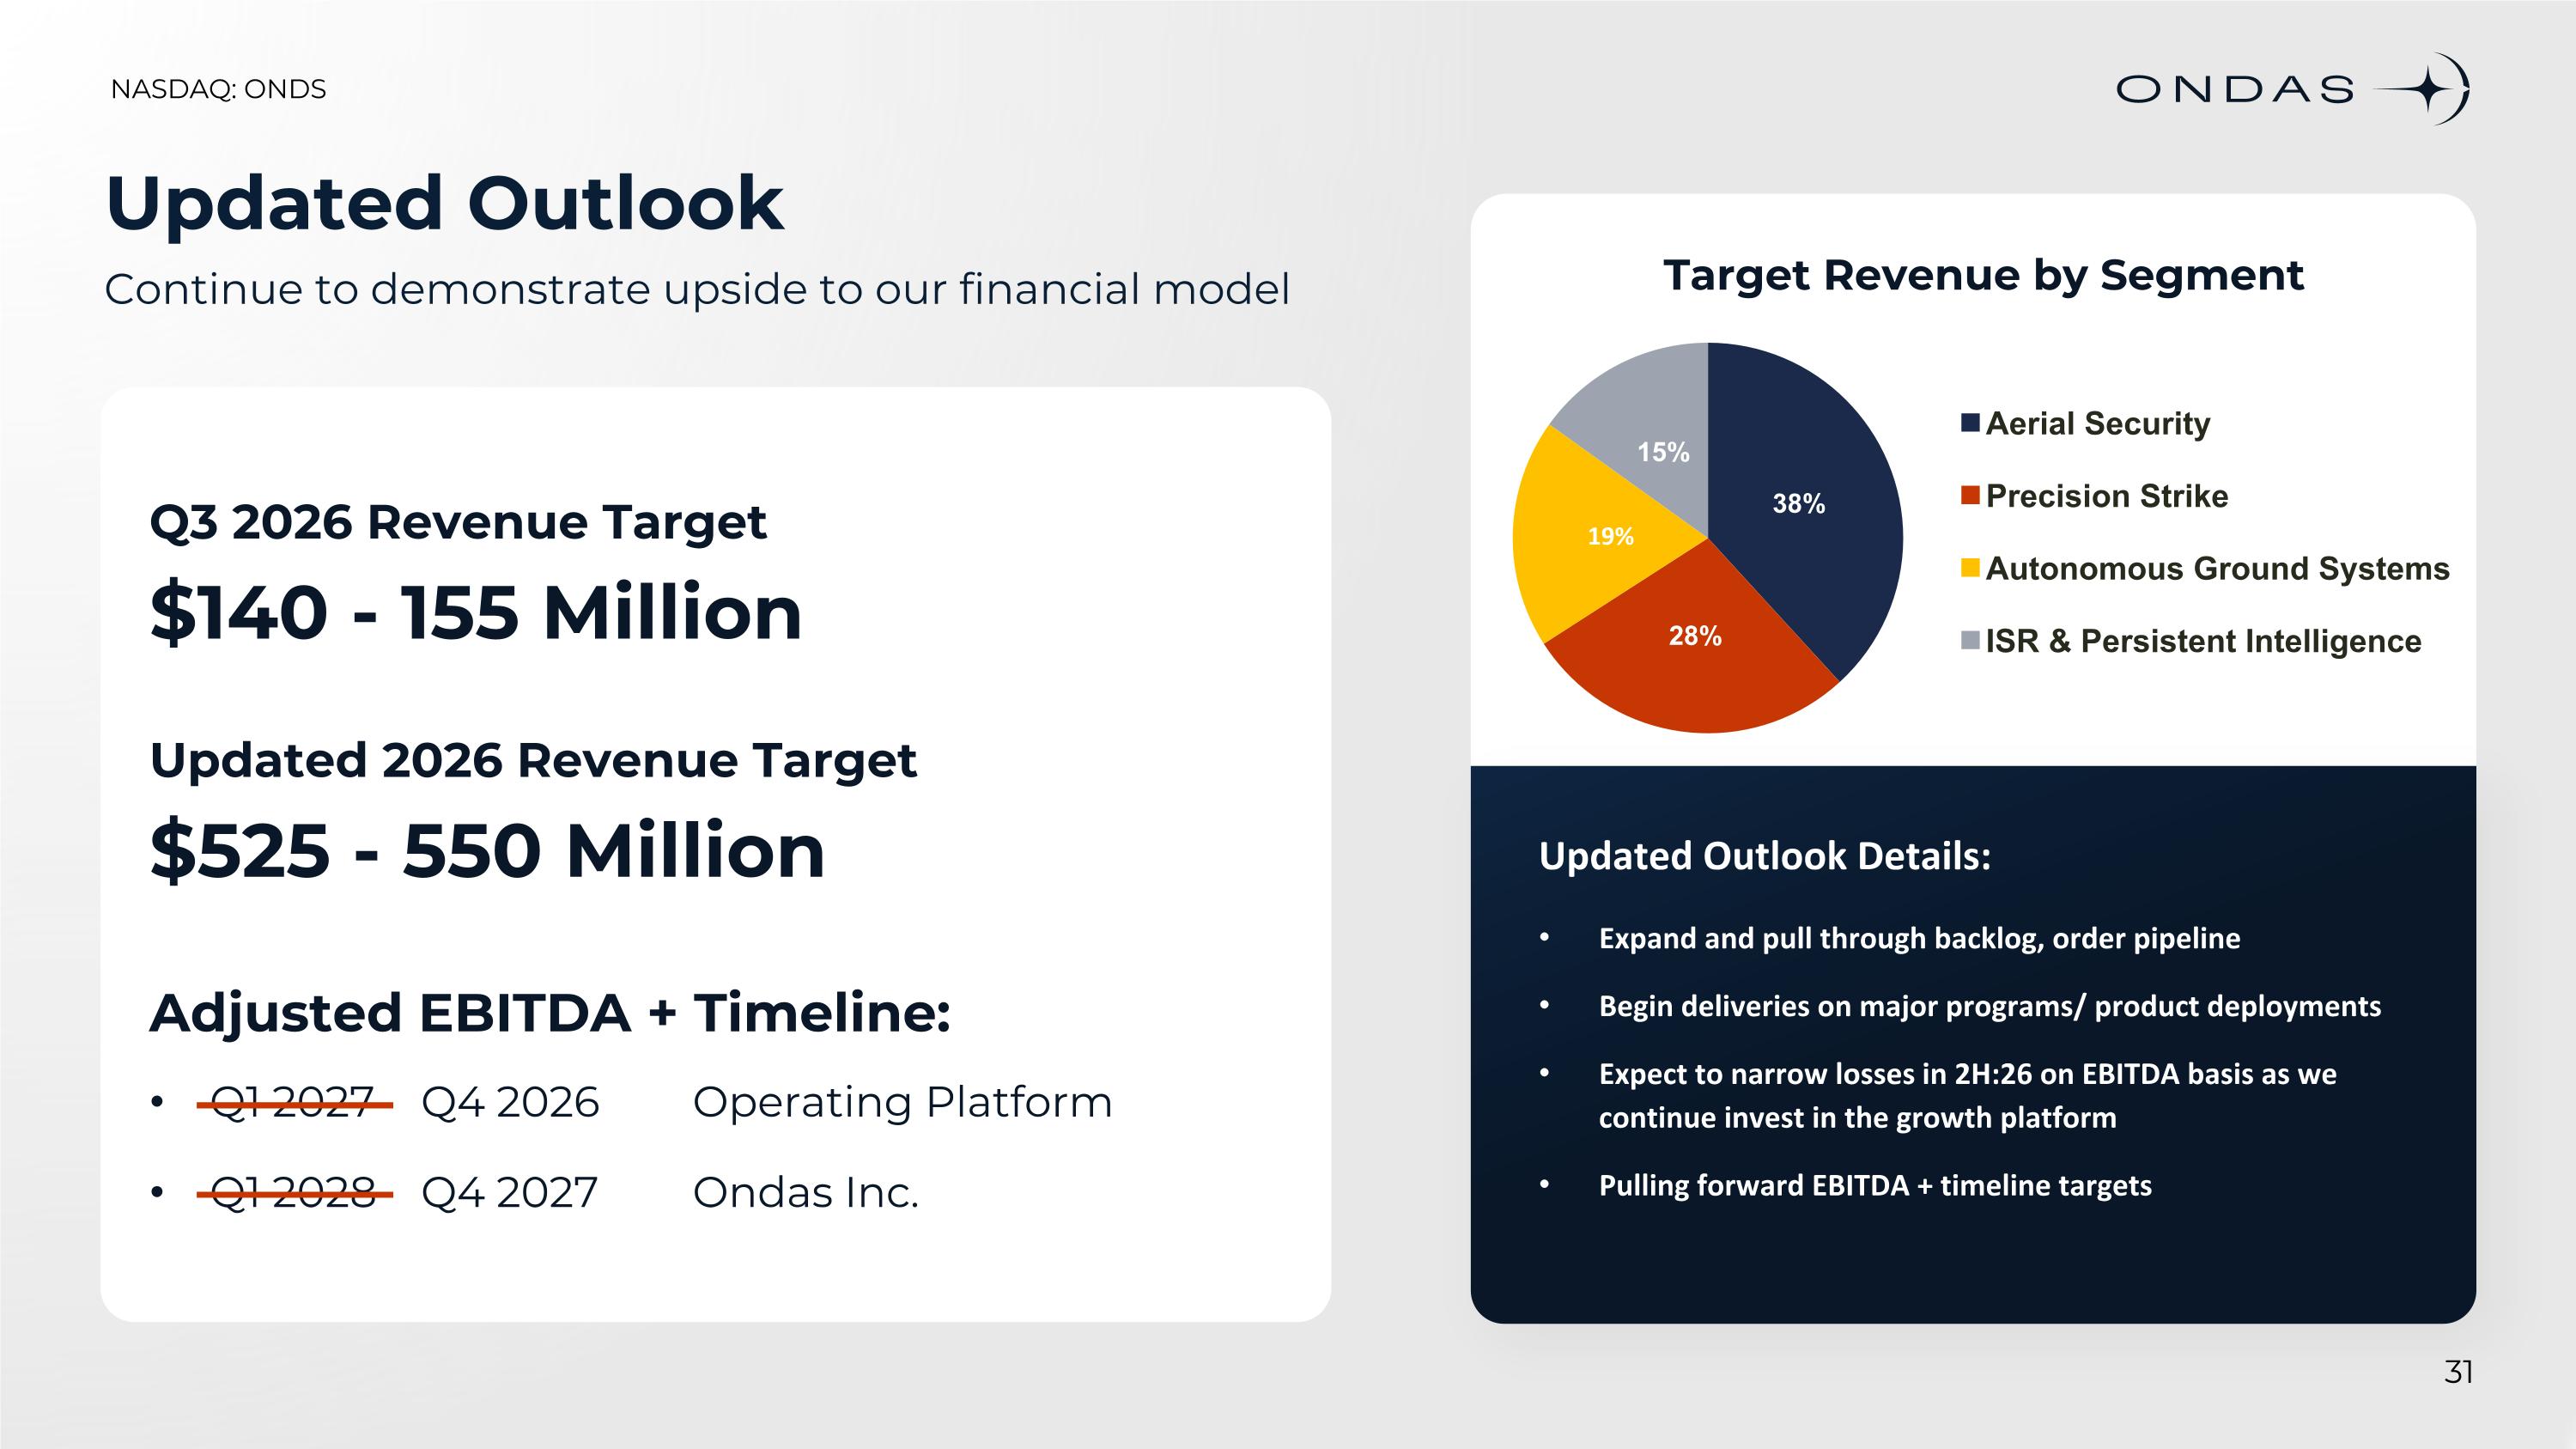
Updated Outlook Continue to demonstrate upside to our financial model Target Revenue by Segment Updated Outlook Details: Expand and pull through backlog, order pipeline Begin deliveries on major programs/ product deployments Expect to narrow losses in 2H:26 on EBITDA basis as we continue invest in the growth platform Pulling forward EBITDA + timeline targets Q3 2026 Revenue Target $140 - 155 Million Updated 2026 Revenue Target $525 - 550 Million Adjusted EBITDA + Timeline: Q1 2027 Q4 2026 Operating Platform Q1 2028 Q4 2027 Ondas Inc.
Positioned to Win A differentiated platform with the assets, technology and execution capabilities to create long-term value Large and expanding defense markets. Diversified portfolio across four strategic segments. Growing backlog and commercial momentum. Global customer base and strategic partnerships. Integrated technology platform. Clear path to profitable, scalable growth. BUILDING THE GLOBAL LEADER IN AUTONOMOUS DEFENSE AND SECURITY TECHNOLOGIES
Q&A Second Quarter 2026 Earnings Release NASDAQ: ONDS | August 13, 2026
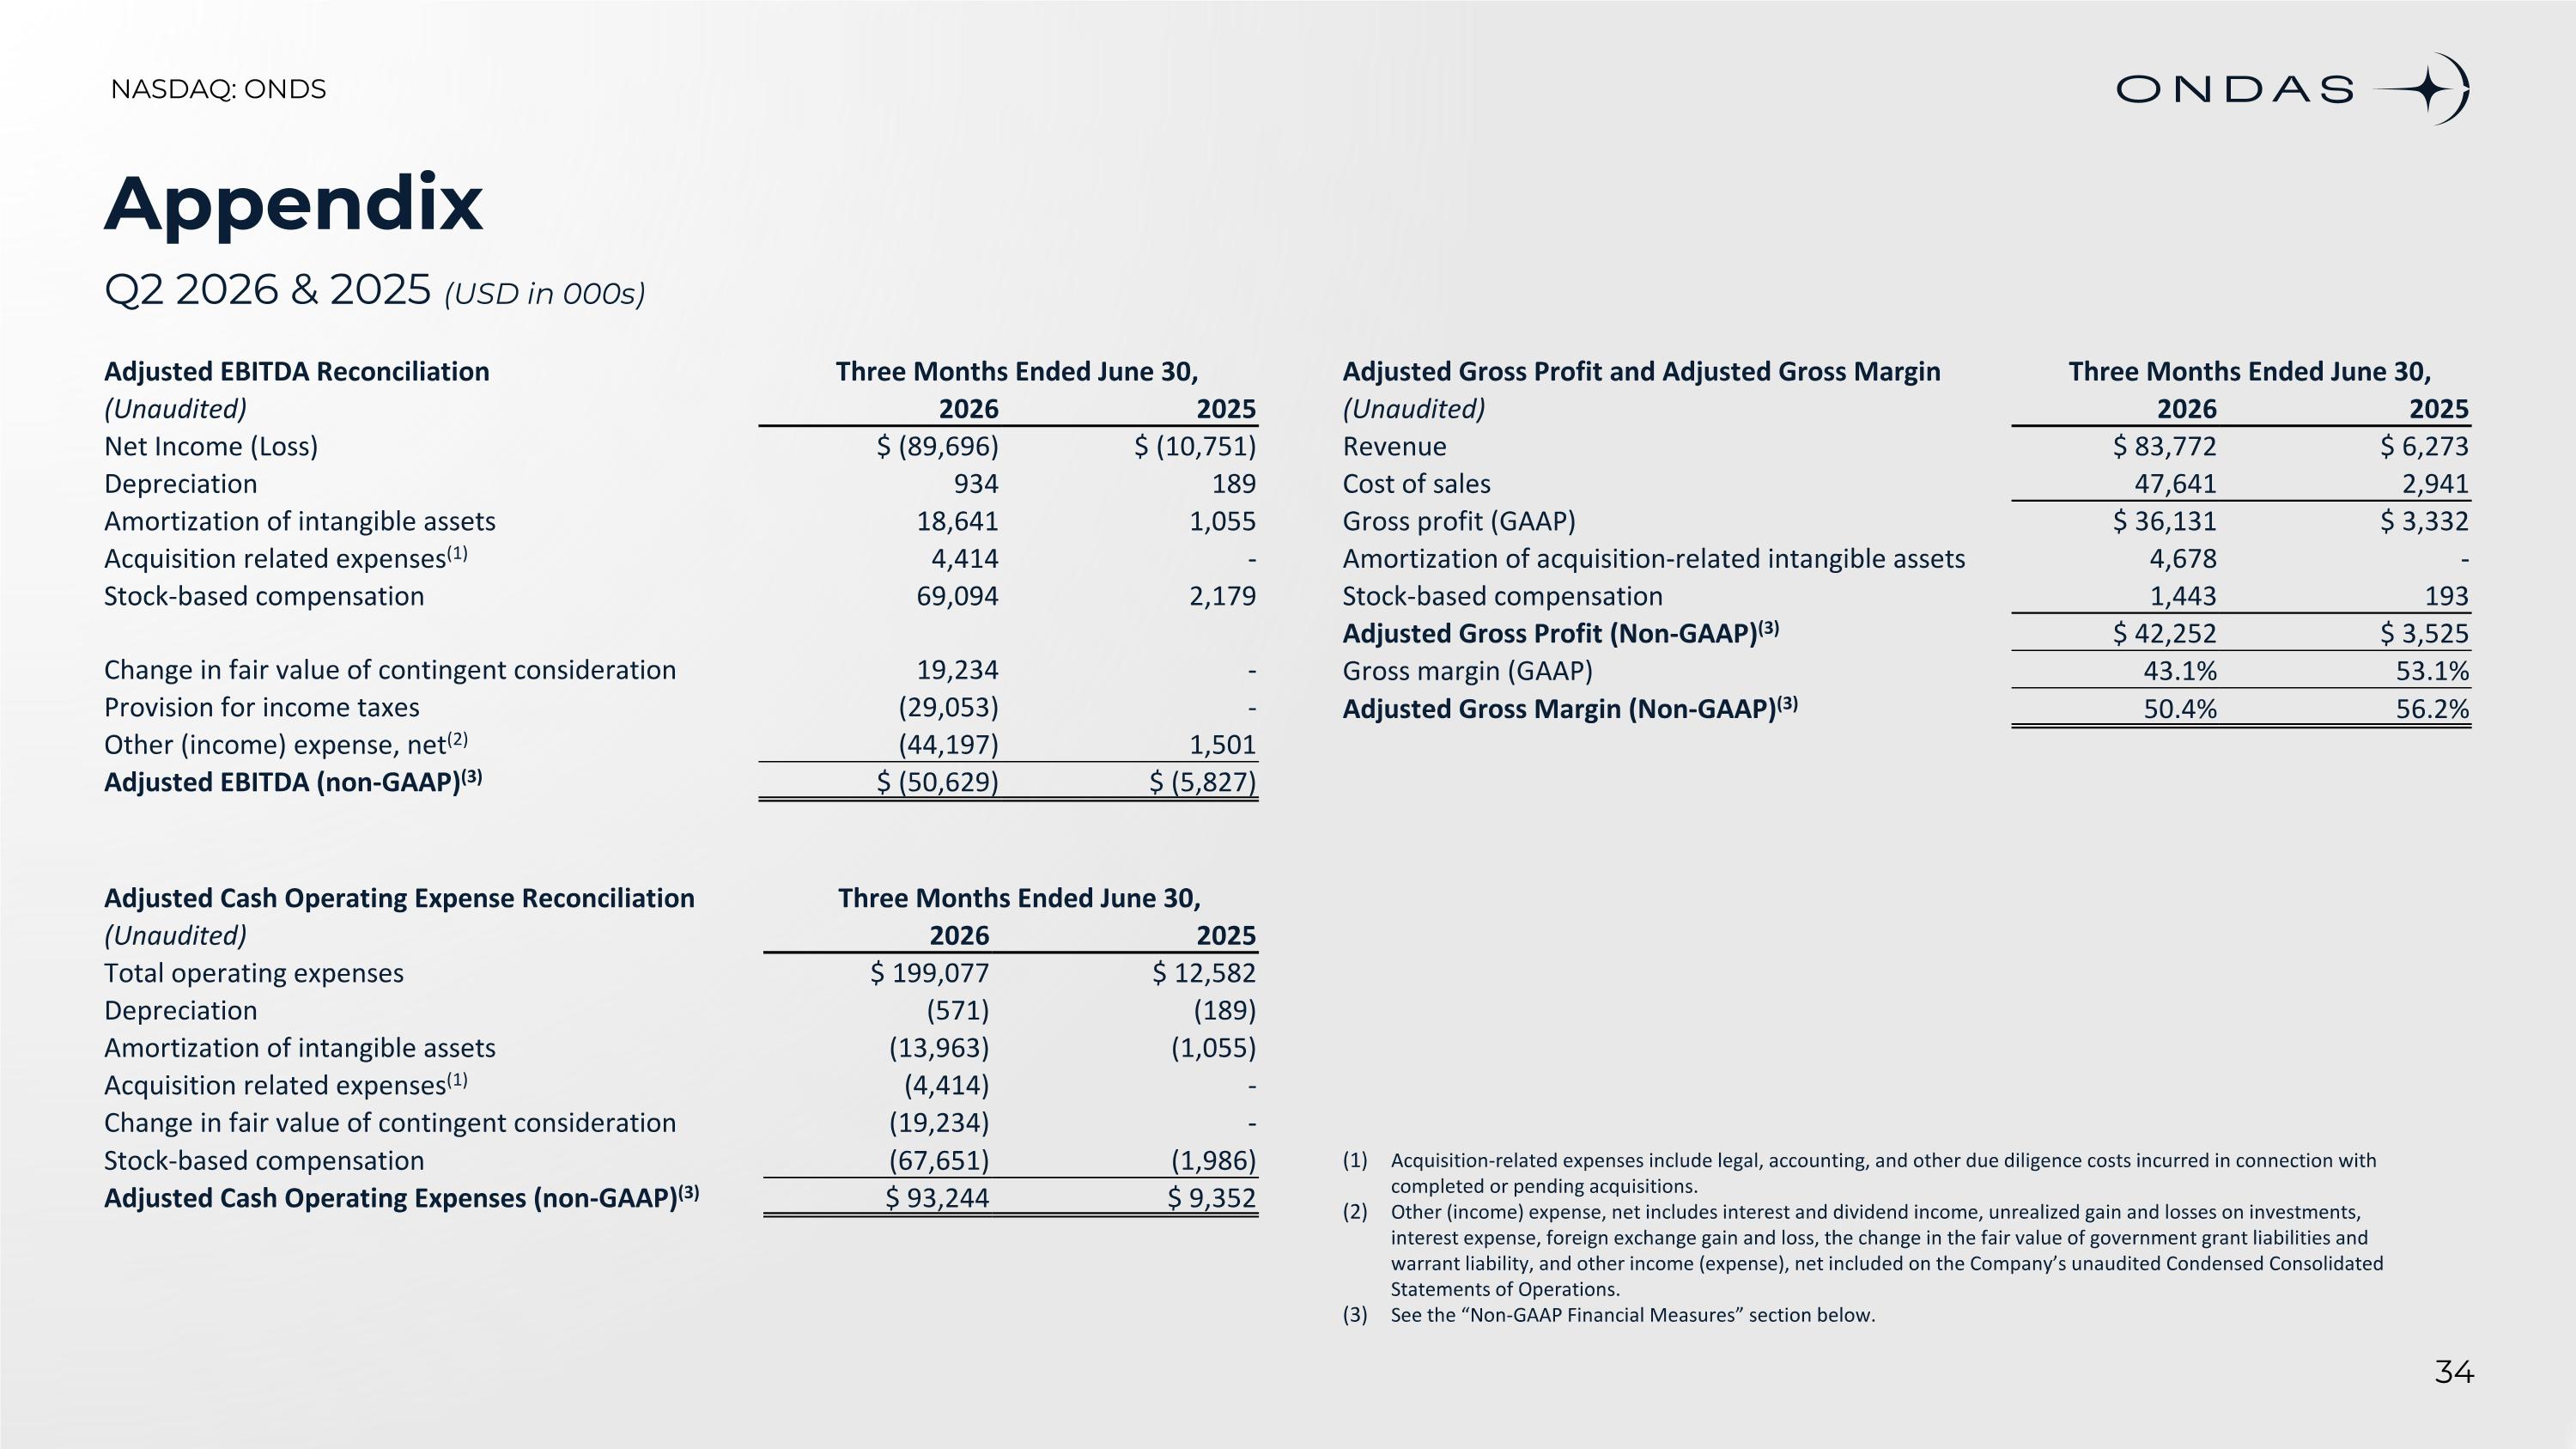
Appendix Q2 2026 & 2025 (USD in 000s) Acquisition-related expenses include legal, accounting, and other due diligence costs incurred in connection with completed or pending acquisitions. Other (income) expense, net includes interest and dividend income, unrealized gain and losses on investments, interest expense, foreign exchange gain and loss, the change in the fair value of government grant liabilities and warrant liability, and other income (expense), net included on the Company’s unaudited Condensed Consolidated Statements of Operations. See the “Non-GAAP Financial Measures” section below. Adjusted EBITDA Reconciliation Three Months Ended June 30, (Unaudited) 2026 2025 Net Income (Loss) $ (89,696) $ (10,751) Depreciation 934 189 Amortization of intangible assets 18,641 1,055 Acquisition related expenses(1) 4,414 - Stock-based compensation 69,094 2,179 Change in fair value of contingent consideration 19,234 - Provision for income taxes (29,053) - Other (income) expense, net(2) (44,197) 1,501 Adjusted EBITDA (non-GAAP)(3) $ (50,629) $ (5,827) Adjusted Cash Operating Expense Reconciliation Three Months Ended June 30, (Unaudited) 2026 2025 Total operating expenses $ 199,077 $ 12,582 Depreciation (571) (189) Amortization of intangible assets (13,963) (1,055) Acquisition related expenses(1) (4,414) - Change in fair value of contingent consideration (19,234) - Stock-based compensation (67,651) (1,986) Adjusted Cash Operating Expenses (non-GAAP)(3) $ 93,244 $ 9,352 Adjusted Gross Profit and Adjusted Gross Margin Three Months Ended June 30, (Unaudited) 2026 2025 Revenue $ 83,772 $ 6,273 Cost of sales 47,641 2,941 Gross profit (GAAP) $ 36,131 $ 3,332 Amortization of acquisition-related intangible assets 4,678 - Stock-based compensation 1,443 193 Adjusted Gross Profit (Non-GAAP)(3) $ 42,252 $ 3,525 Gross margin (GAAP) 43.1% 53.1% Adjusted Gross Margin (Non-GAAP)(3) 50.4% 56.2%
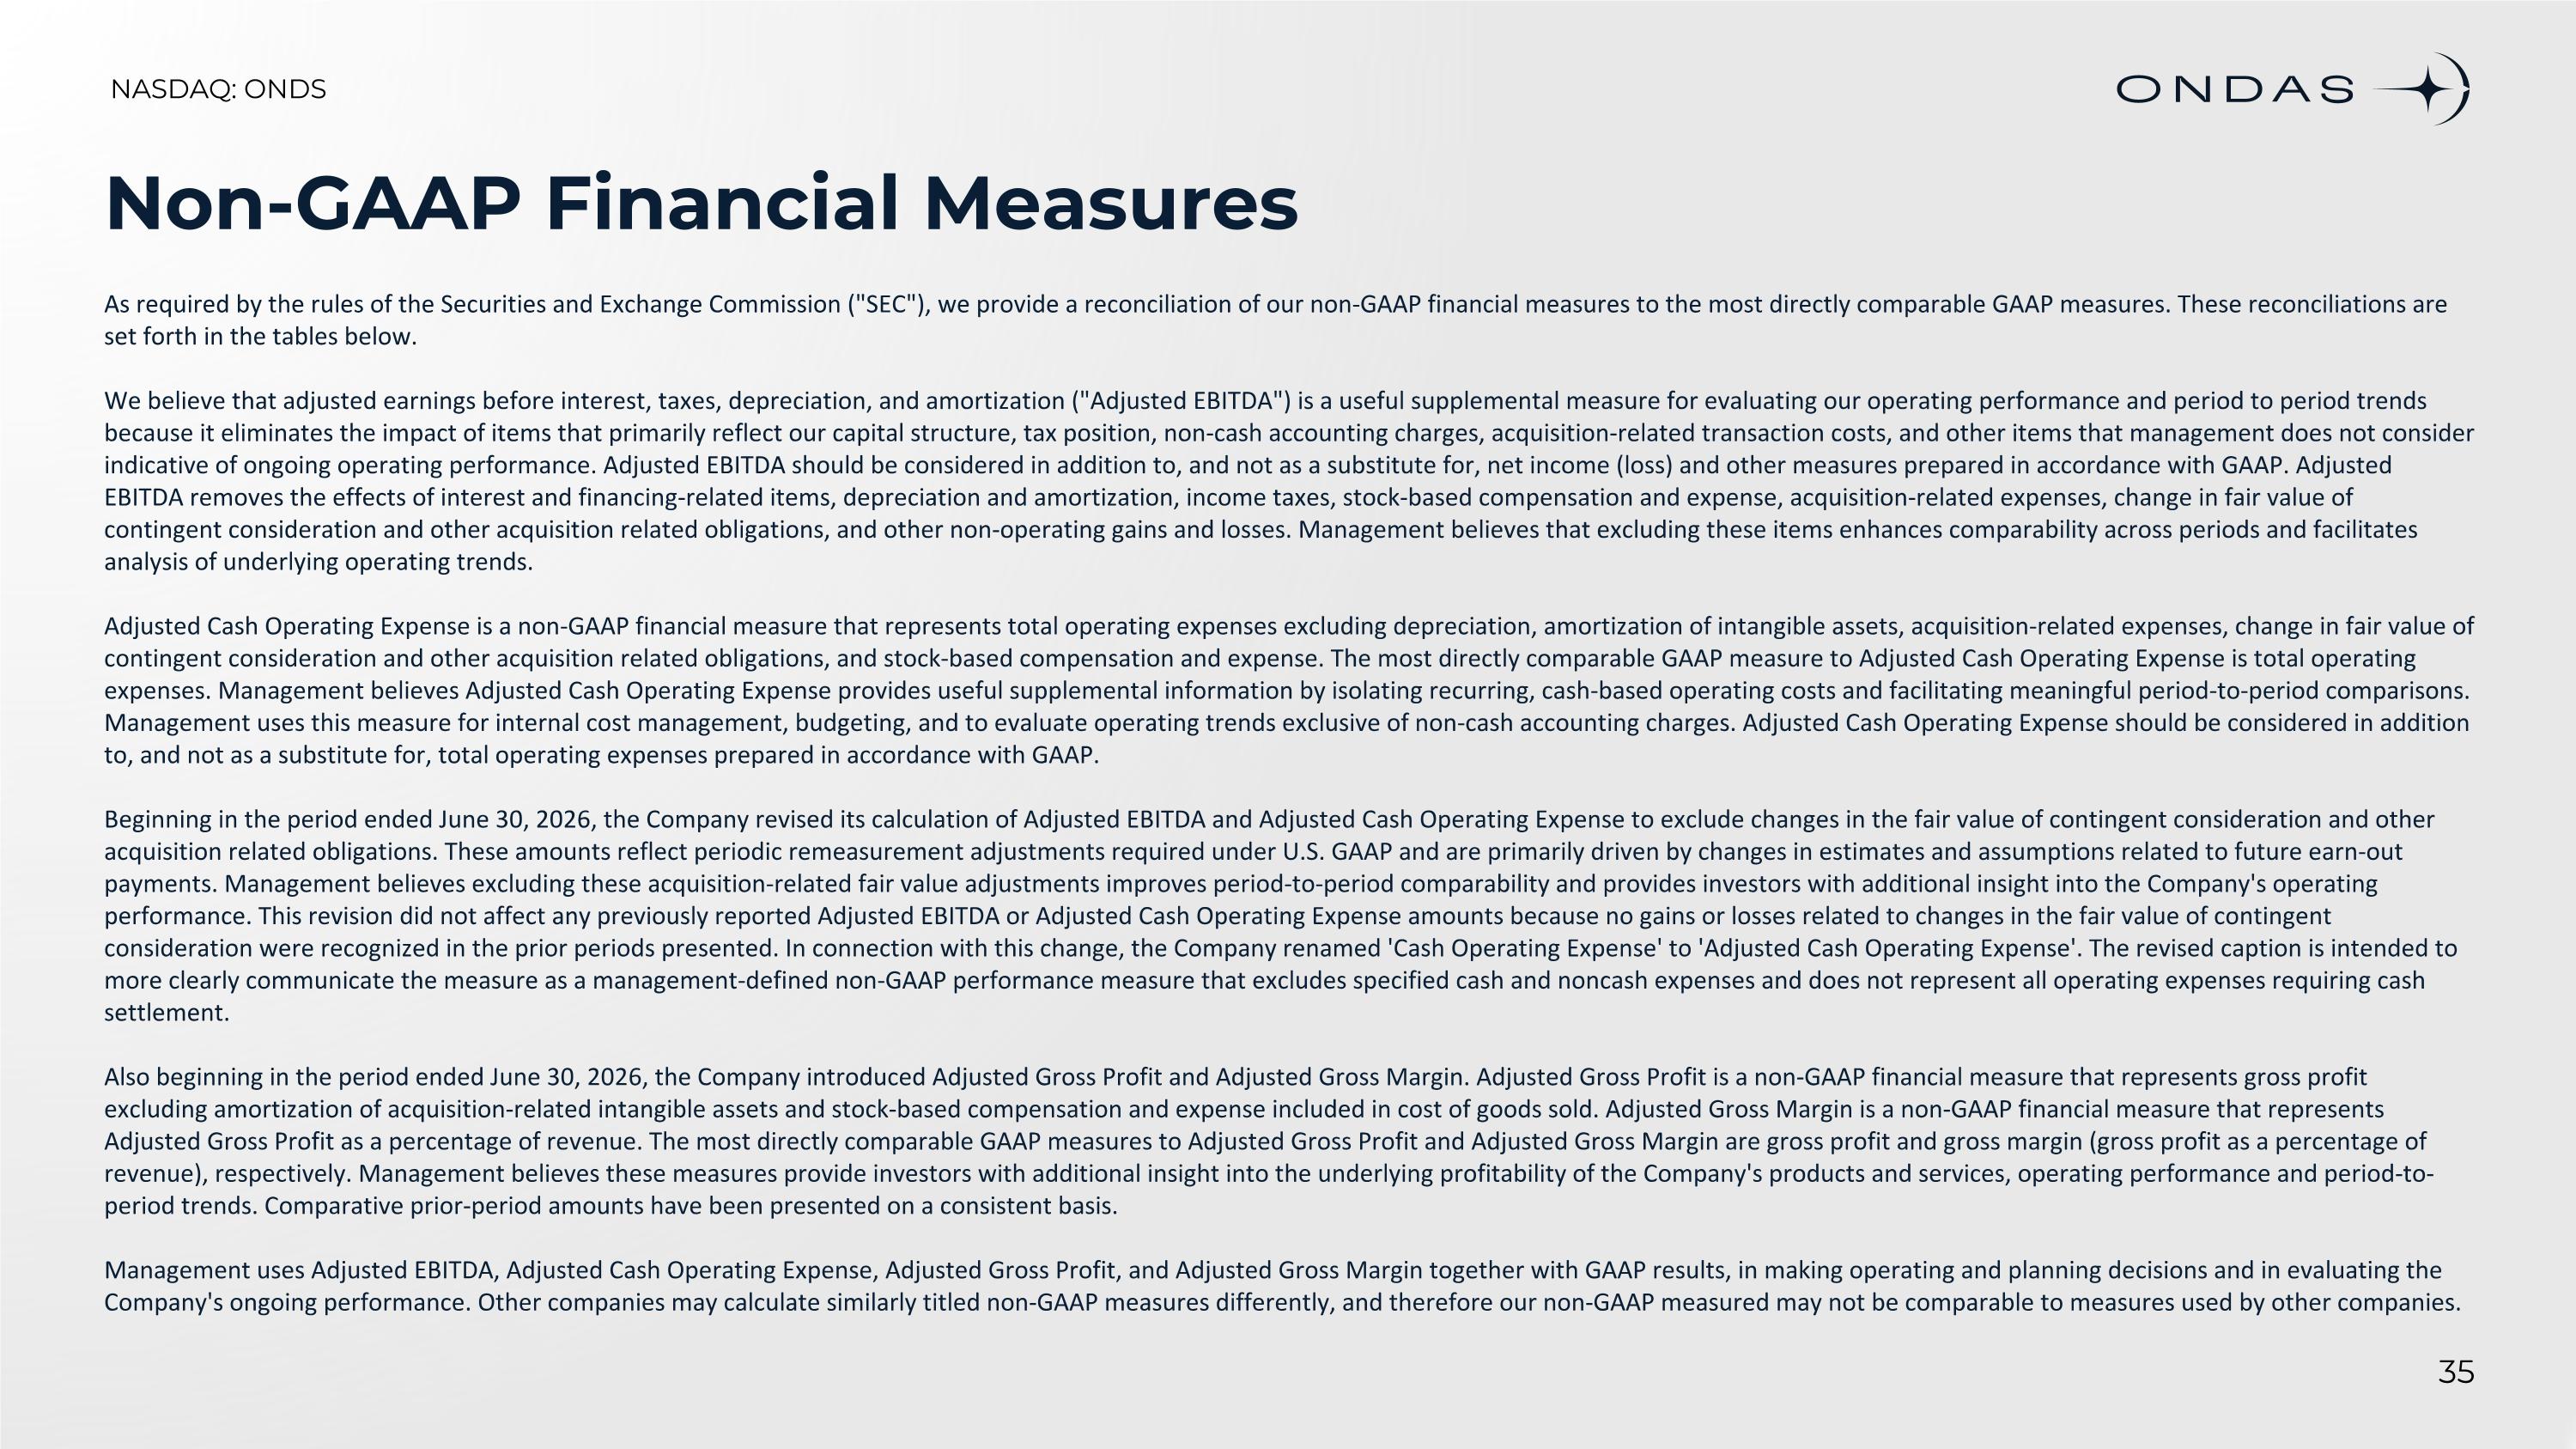
As required by the rules of the Securities and Exchange Commission ("SEC"), we provide a reconciliation of our non-GAAP financial measures to the most directly comparable GAAP measures. These reconciliations are set forth in the tables below. We believe that adjusted earnings before interest, taxes, depreciation, and amortization ("Adjusted EBITDA") is a useful supplemental measure for evaluating our operating performance and period to period trends because it eliminates the impact of items that primarily reflect our capital structure, tax position, non-cash accounting charges, acquisition-related transaction costs, and other items that management does not consider indicative of ongoing operating performance. Adjusted EBITDA should be considered in addition to, and not as a substitute for, net income (loss) and other measures prepared in accordance with GAAP. Adjusted EBITDA removes the effects of interest and financing-related items, depreciation and amortization, income taxes, stock-based compensation and expense, acquisition-related expenses, change in fair value of contingent consideration and other acquisition related obligations, and other non-operating gains and losses. Management believes that excluding these items enhances comparability across periods and facilitates analysis of underlying operating trends. Adjusted Cash Operating Expense is a non-GAAP financial measure that represents total operating expenses excluding depreciation, amortization of intangible assets, acquisition-related expenses, change in fair value of contingent consideration and other acquisition related obligations, and stock-based compensation and expense. The most directly comparable GAAP measure to Adjusted Cash Operating Expense is total operating expenses. Management believes Adjusted Cash Operating Expense provides useful supplemental information by isolating recurring, cash-based operating costs and facilitating meaningful period-to-period comparisons. Management uses this measure for internal cost management, budgeting, and to evaluate operating trends exclusive of non-cash accounting charges. Adjusted Cash Operating Expense should be considered in addition to, and not as a substitute for, total operating expenses prepared in accordance with GAAP. Beginning in the period ended June 30, 2026, the Company revised its calculation of Adjusted EBITDA and Adjusted Cash Operating Expense to exclude changes in the fair value of contingent consideration and other acquisition related obligations. These amounts reflect periodic remeasurement adjustments required under U.S. GAAP and are primarily driven by changes in estimates and assumptions related to future earn-out payments. Management believes excluding these acquisition-related fair value adjustments improves period-to-period comparability and provides investors with additional insight into the Company's operating performance. This revision did not affect any previously reported Adjusted EBITDA or Adjusted Cash Operating Expense amounts because no gains or losses related to changes in the fair value of contingent consideration were recognized in the prior periods presented. In connection with this change, the Company renamed 'Cash Operating Expense' to 'Adjusted Cash Operating Expense'. The revised caption is intended to more clearly communicate the measure as a management-defined non-GAAP performance measure that excludes specified cash and noncash expenses and does not represent all operating expenses requiring cash settlement. Also beginning in the period ended June 30, 2026, the Company introduced Adjusted Gross Profit and Adjusted Gross Margin. Adjusted Gross Profit is a non-GAAP financial measure that represents gross profit excluding amortization of acquisition-related intangible assets and stock-based compensation and expense included in cost of goods sold. Adjusted Gross Margin is a non-GAAP financial measure that represents Adjusted Gross Profit as a percentage of revenue. The most directly comparable GAAP measures to Adjusted Gross Profit and Adjusted Gross Margin are gross profit and gross margin (gross profit as a percentage of revenue), respectively. Management believes these measures provide investors with additional insight into the underlying profitability of the Company's products and services, operating performance and period-to-period trends. Comparative prior-period amounts have been presented on a consistent basis. Management uses Adjusted EBITDA, Adjusted Cash Operating Expense, Adjusted Gross Profit, and Adjusted Gross Margin together with GAAP results, in making operating and planning decisions and in evaluating the Company's ongoing performance. Other companies may calculate similarly titled non-GAAP measures differently, and therefore our non-GAAP measured may not be comparable to measures used by other companies. Non-GAAP Financial Measures
THANK YOU ir@ondas.com NASDAQ: ONDS | August 13, 2026 Copyright 2026. All rights reserved.