Exhibit 99.2
CONFIDENTIAL | Chicago Atlantic BDC, Inc. Second Quarter 2026 Earnings Presentation Chicago Atlantic BDC, Inc. (NASDAQ: LIEN) August 13, 2026
CONFIDENTIAL | Chicago Atlantic BDC, Inc. 2 The information contained in this presentation should be viewed in conjunction with the earnings conference call of Chicago Atlantic BDC, Inc. (the "Company") (Nasdaq: LIEN) held on August 13, 2026, and the Company's Quarterly Report on Form 10-Q for the quarter ended June 30, 2026. The information contained herein may not be used, reproduced or distributed to others, in whole or in part, for any other purpose without the prior written consent of the Company. This presentation does not constitute a prospectus and should under no circumstances be understood as an offer to sell or the solicitation of an offer to buy the Company's common stock or any other securities nor will there be any sale of the common stock or any other securities referred to in this presentation in any state or jurisdiction in which such offer, solicitation or sale would be unlawful prior to the registration or qualification under the securities laws of such state or jurisdiction. Nothing in these materials should be construed as a recommendation to invest in any securities that may be issued by the Company or as legal, accounting or tax advice. An investment in securities of the type described herein presents certain risks. Nothing contained herein shall be relied upon as a promise or representation whether as to the past or future performance. Information regarding performance by the Company's management team and their affiliates is presented for informational purposes only. You should not rely on the historical record of the Company's management team and their affiliates as indicative of the future performance of an investment in the Company or the returns the Company will, or is likely to, generate going forward. Certain information contained herein has been derived from sources prepared by third parties. While such information is believed to be reliable for the purposes used herein, the Company makes no representation or warranty with respect to the accuracy of such information. This presentation contains references to trademarks and service marks belonging to other entities. Solely for convenience, trademarks and trade names referred to in this presentation may appear without the ® or symbols, but such references are not intended to indicate, in any way, that the applicable licensor will not assert, to the fullest extent under applicable law, its rights to these trademarks and trade names. The Company does not intend its use or display of other companies' trade names, trademarks or service marks to imply a relationship with, or endorsement or sponsorship of the Company by, any other companies. The information contained in this presentation is summary information that is intended to be considered in the context of other public announcements that the Company may make, by press release or otherwise, from time to time. The Company undertakes no duty or obligation to publicly update or revise the information contained in this presentation, except as required by law. These materials contain information about the Company, certain of its personnel and affiliates and its historical performance. You should not view information related to the past performance of the Company as indicative of the Company's future results, the achievement of which cannot be assured. Past performance does not guarantee future results, which may vary. The value of investments and the income derived from investments will fluctuate and can go down as well as up. A loss of principal may occur. Certain information contained herein may constitute "forward-looking statements" that involve substantial risks and uncertainties. Such statements involve known and unknown risks, uncertainties and other factors and undue reliance should not be placed thereon. These forward-looking statements are not historical facts, but rather are based on current expectations, estimates and projections about the Company, its current and prospective portfolio investments, its industry, its beliefs and opinions, and its assumptions. Words such as "anticipates," "expects," "intends," "plans," "will," "may," "continue," "believes," "seeks," "estimates," "would," "could," "should," "targets," "projects," "outlook," "potential," "predicts" and variations of these words and similar expressions are intended to identify forward-looking statements. These statements are not guarantees of future performance and are subject to risks, uncertainties and other factors, some of which are beyond the Company's control and difficult to predict and could cause actual results to differ materially from those expressed or forecasted in the forward- looking statements including, without limitation, the risks, uncertainties and other factors identified in the Company's filings with the Securities and Exchange Commission (the "SEC"). Investors should not place undue reliance on these forward-looking statements, which apply only as of the date on which the Company makes them. The Company does not undertake any obligation to update or revise any forward-looking statements or any other information contained herein, except as required by applicable law. Disclaimers and Forward-Looking Statements
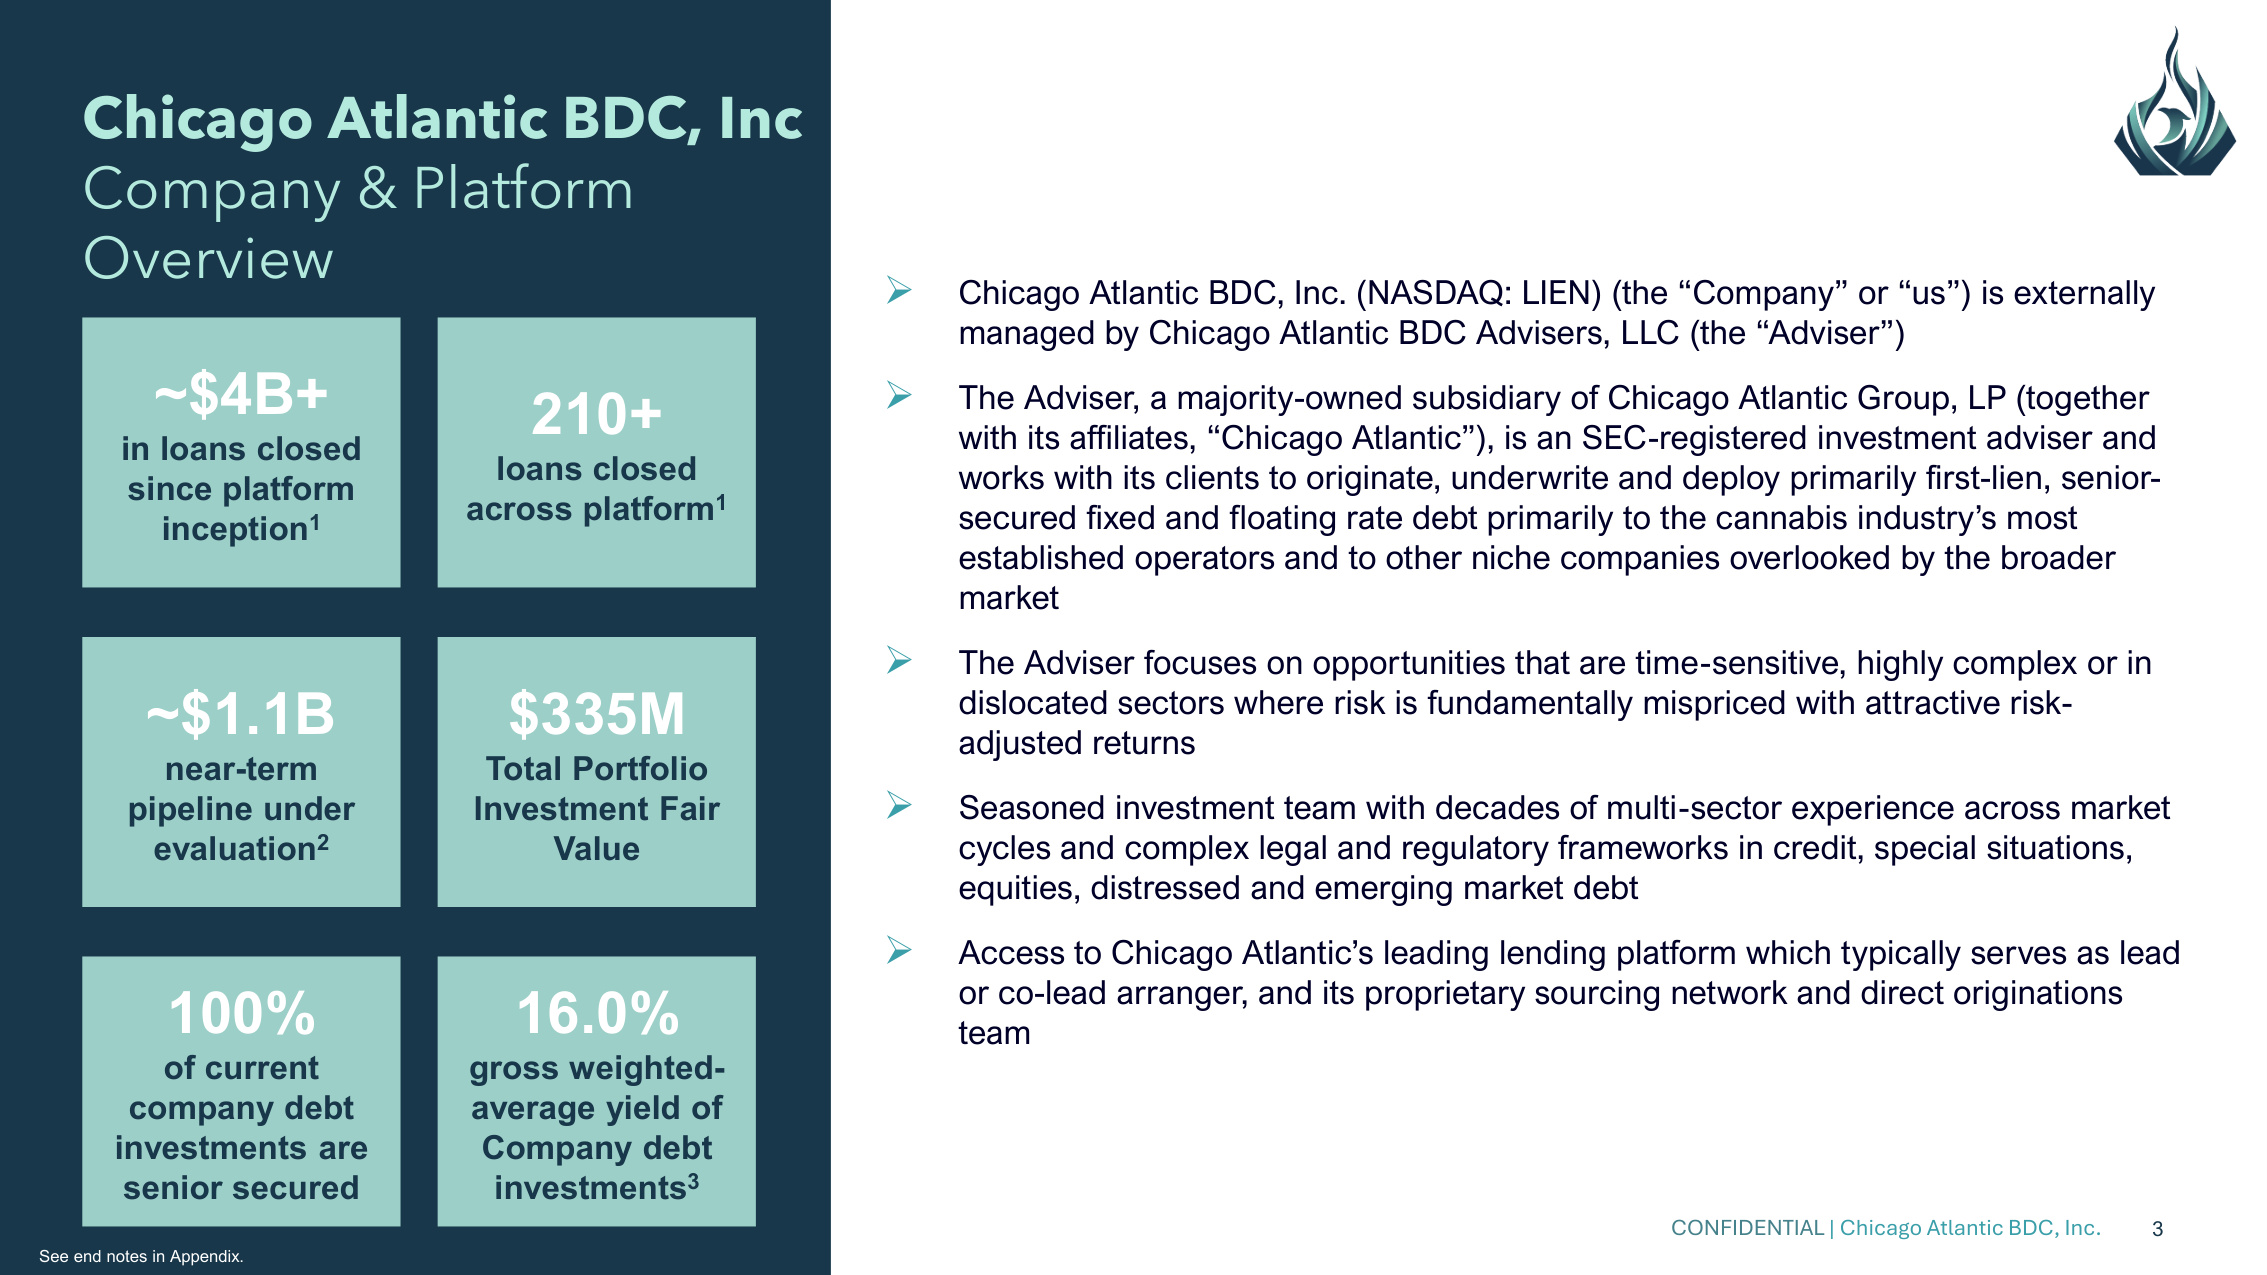
CONFIDENTIAL | Chicago Atlantic BDC, Inc. 3 Chicago Atlantic BDC, Inc Company & Platform Overview ~$1.1B near-term pipeline under evaluation2 ~$4B+ in loans closed since platform inception1 210+ loans closed across platform1 $335M Total Portfolio Investment Fair Value 16.0% gross weighted- average yield of Company debt investments3 100% of current company debt investments are senior secured Chicago Atlantic BDC, Inc. (NASDAQ: LIEN) (the "Company" or "us") is externally managed by Chicago Atlantic BDC Advisers, LLC (the "Adviser") The Adviser, a majority-owned subsidiary of Chicago Atlantic Group, LP (together with its affiliates, "Chicago Atlantic"), is an SEC-registered investment adviser and works with its clients to originate, underwrite and deploy primarily first-lien, senior- secured fixed and floating rate debt primarily to the cannabis industry's most established operators and to other niche companies overlooked by the broader market The Adviser focuses on opportunities that are time-sensitive, highly complex or in dislocated sectors where risk is fundamentally mispriced with attractive risk- adjusted returns Seasoned investment team with decades of multi-sector experience across market cycles and complex legal and regulatory frameworks in credit, special situations, equities, distressed and emerging market debt Access to Chicago Atlantic's leading lending platform which typically serves as lead or co-lead arranger, and its proprietary sourcing network and direct originations team See end notes in Appendix.
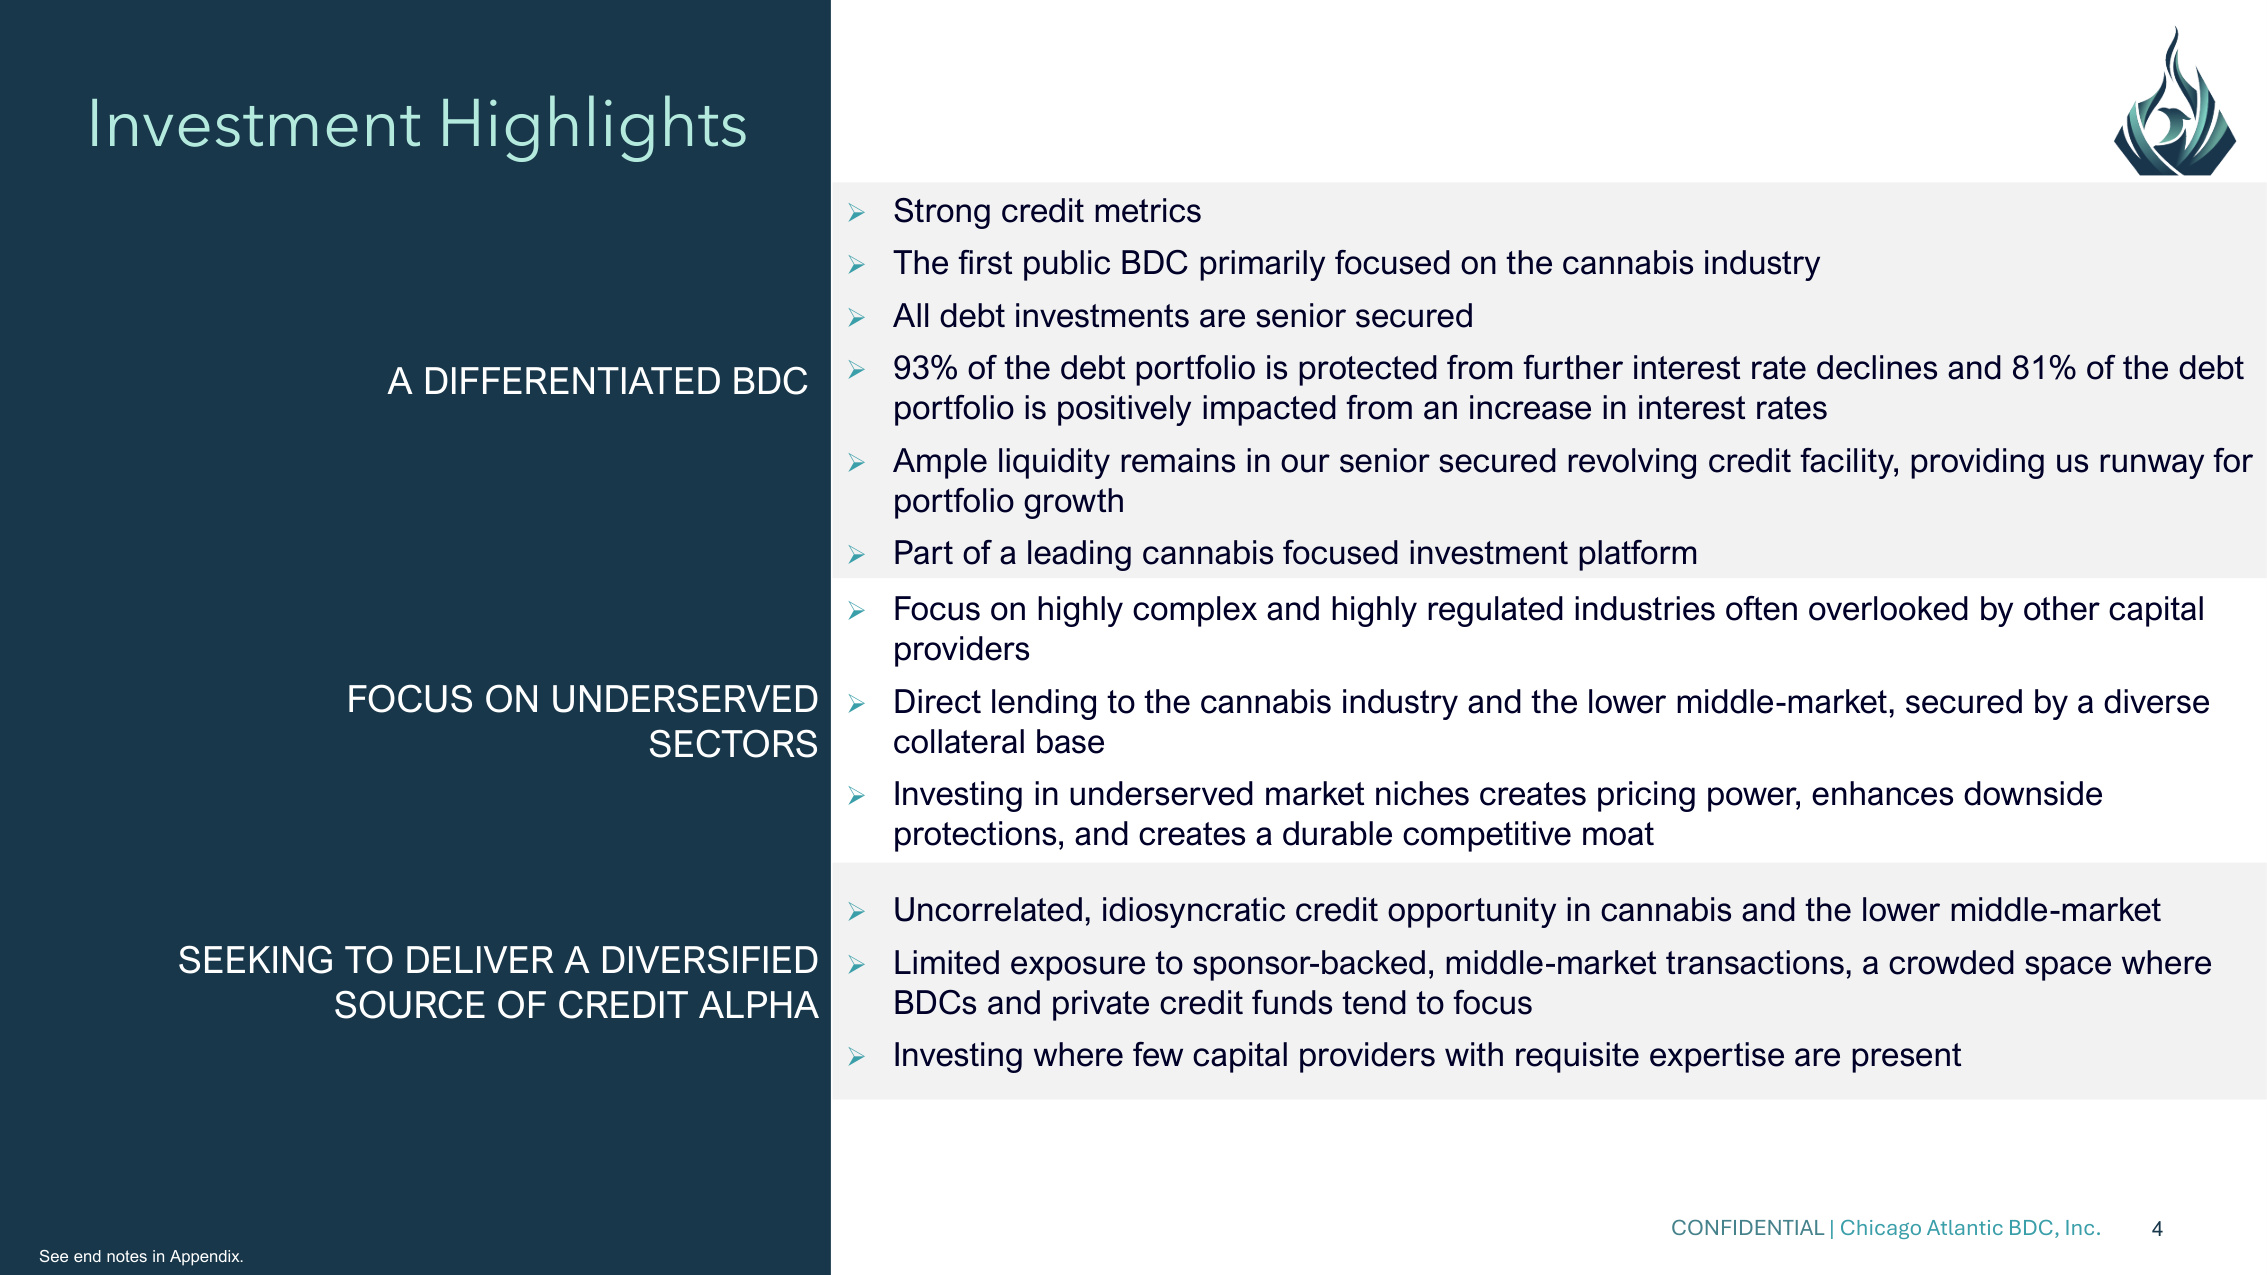
CONFIDENTIAL | Chicago Atlantic BDC, Inc. 4 Investment Highlights A DIFFERENTIATED BDC Strong credit metrics The first public BDC primarily focused on the cannabis industry All debt investments are senior secured 93% of the debt portfolio is protected from further interest rate declines and 81% of the debt portfolio is positively impacted from an increase in interest rates Ample liquidity remains in our senior secured revolving credit facility, providing us runway for portfolio growth Part of a leading cannabis focused investment platform FOCUS ON UNDERSERVED SECTORS Focus on highly complex and highly regulated industries often overlooked by other capital providers Direct lending to the cannabis industry and the lower middle-market, secured by a diverse collateral base Investing in underserved market niches creates pricing power, enhances downside protections, and creates a durable competitive moat SEEKING TO DELIVER A DIVERSIFIED SOURCE OF CREDIT ALPHA Uncorrelated, idiosyncratic credit opportunity in cannabis and the lower middle-market Limited exposure to sponsor-backed, middle-market transactions, a crowded space where BDCs and private credit funds tend to focus Investing where few capital providers with requisite expertise are present See end notes in Appendix.
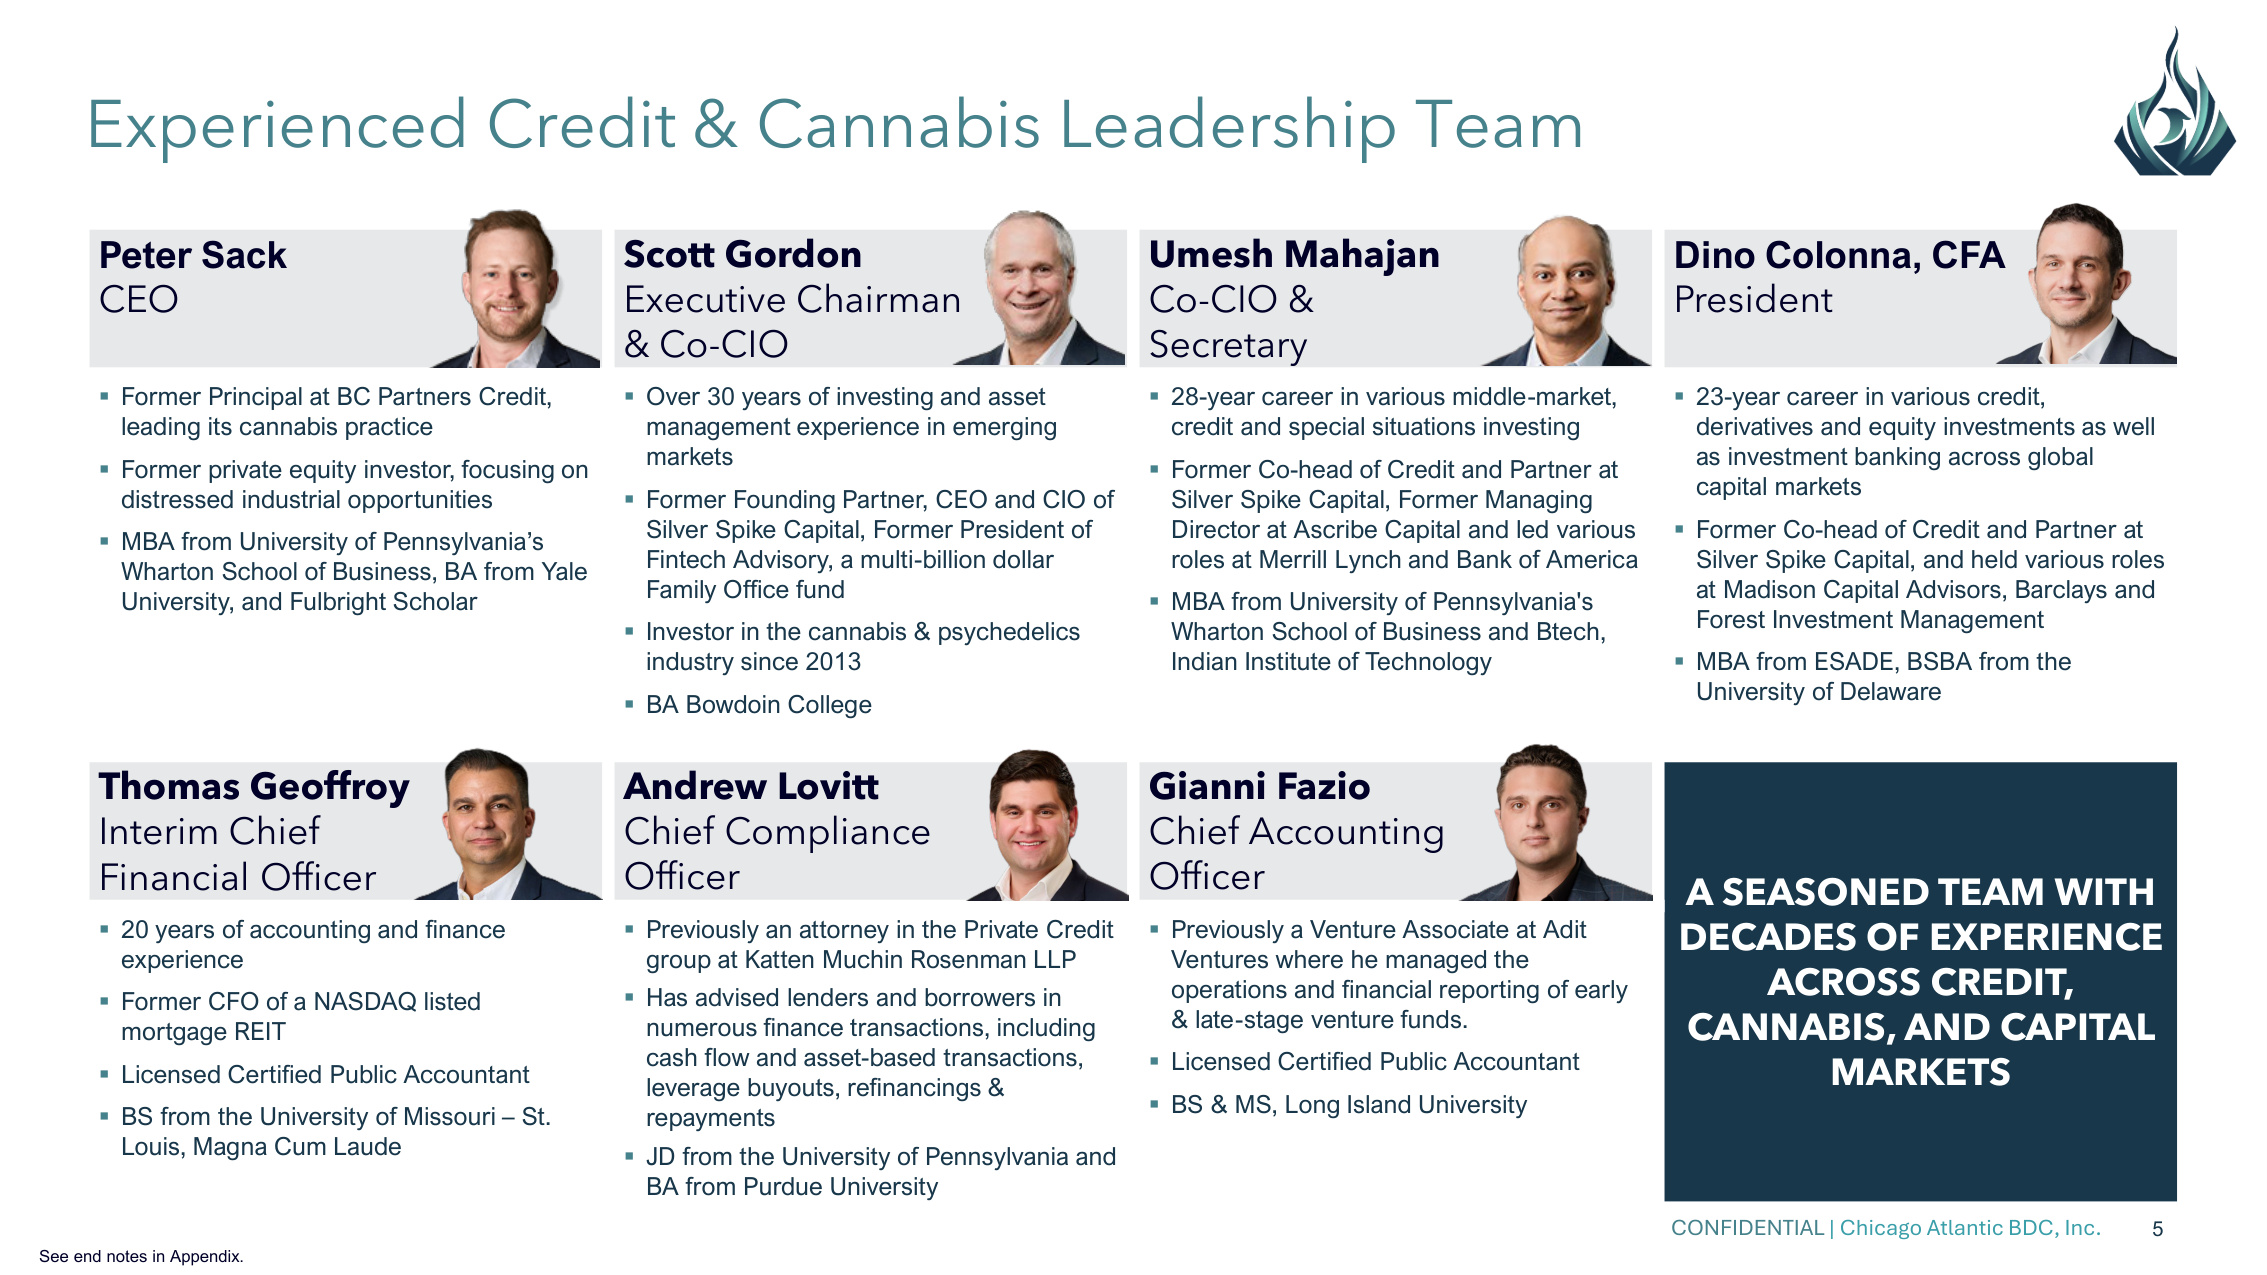
CONFIDENTIAL | Chicago Atlantic BDC, Inc. 5 Peter Sack CEO Scott Gordon Executive Chairman & Co-CIO Umesh Mahajan Co-CIO & Secretary Dino Colonna, CFA President Former Principal at BC Partners Credit, leading its cannabis practice Former private equity investor, focusing on distressed industrial opportunities MBA from University of Pennsylvania's Wharton School of Business, BA from Yale University, and Fulbright Scholar Over 30 years of investing and asset management experience in emerging markets Former Founding Partner, CEO and CIO of Silver Spike Capital, Former President of Fintech Advisory, a multi-billion dollar Family Office fund Investor in the cannabis & psychedelics industry since 2013 BA Bowdoin College 28-year career in various middle-market, credit and special situations investing Former Co-head of Credit and Partner at Silver Spike Capital, Former Managing Director at Ascribe Capital and led various roles at Merrill Lynch and Bank of America MBA from University of Pennsylvania's Wharton School of Business and Btech, Indian Institute of Technology 23-year career in various credit, derivatives and equity investments as well as investment banking across global capital markets Former Co-head of Credit and Partner at Silver Spike Capital, and held various roles at Madison Capital Advisors, Barclays and Forest Investment Management MBA from ESADE, BSBA from the University of Delaware Thomas Geoffroy Interim Chief Financial Officer Andrew Lovitt Chief Compliance Officer Gianni Fazio Chief Accounting Officer A SEASONED TEAM WITH DECADES OF EXPERIENCE ACROSS CREDIT, CANNABIS, AND CAPITAL MARKETS 20 years of accounting and finance experience Former CFO of a NASDAQ listed mortgage REIT Licensed Certified Public Accountant BS from the University of Missouri – St. Louis, Magna Cum Laude Previously an attorney in the Private Credit group at Katten Muchin Rosenman LLP Has advised lenders and borrowers in numerous finance transactions, including cash flow and asset-based transactions, leverage buyouts, refinancings & repayments JD from the University of Pennsylvania and BA from Purdue University Previously a Venture Associate at Adit Ventures where he managed the operations and financial reporting of early & late-stage venture funds. Licensed Certified Public Accountant BS & MS, Long Island University Experienced Credit & Cannabis Leadership Team See end notes in Appendix.
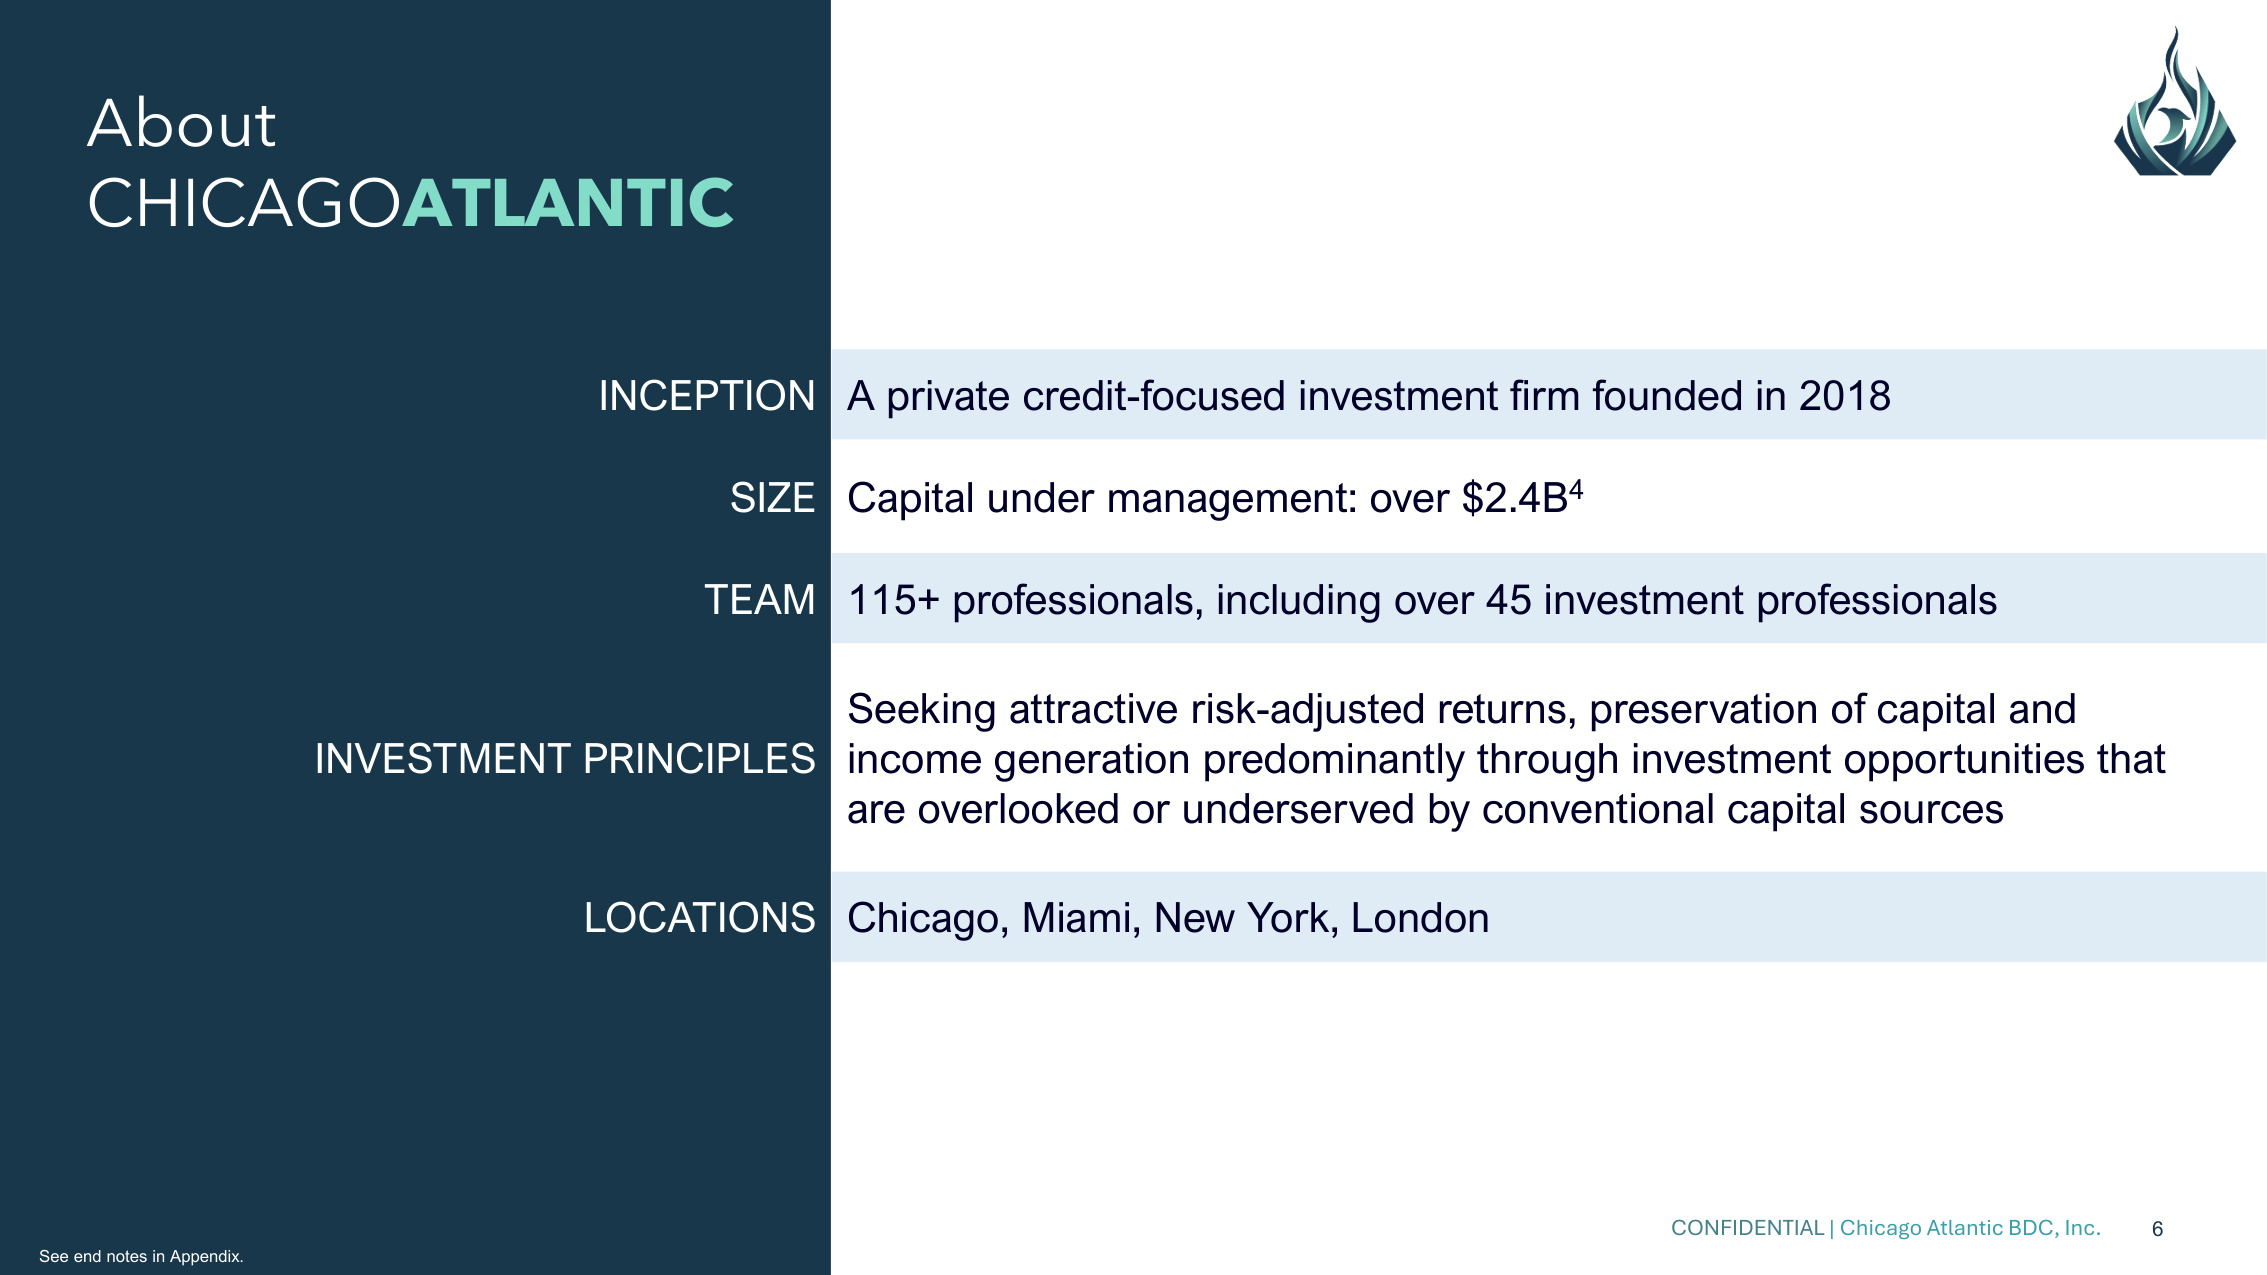
CONFIDENTIAL | Chicago Atlantic BDC, Inc. 6 About CHICAGOATLANTIC INCEPTION A private credit-focused investment firm founded in 2018 SIZE Capital under management: over $2.4B4 TEAM 115+ professionals, including over 45 investment professionals INVESTMENT PRINCIPLES Seeking attractive risk-adjusted returns, preservation of capital and income generation predominantly through investment opportunities that are overlooked or underserved by conventional capital sources LOCATIONS Chicago, Miami, New York, London See end notes in Appendix.
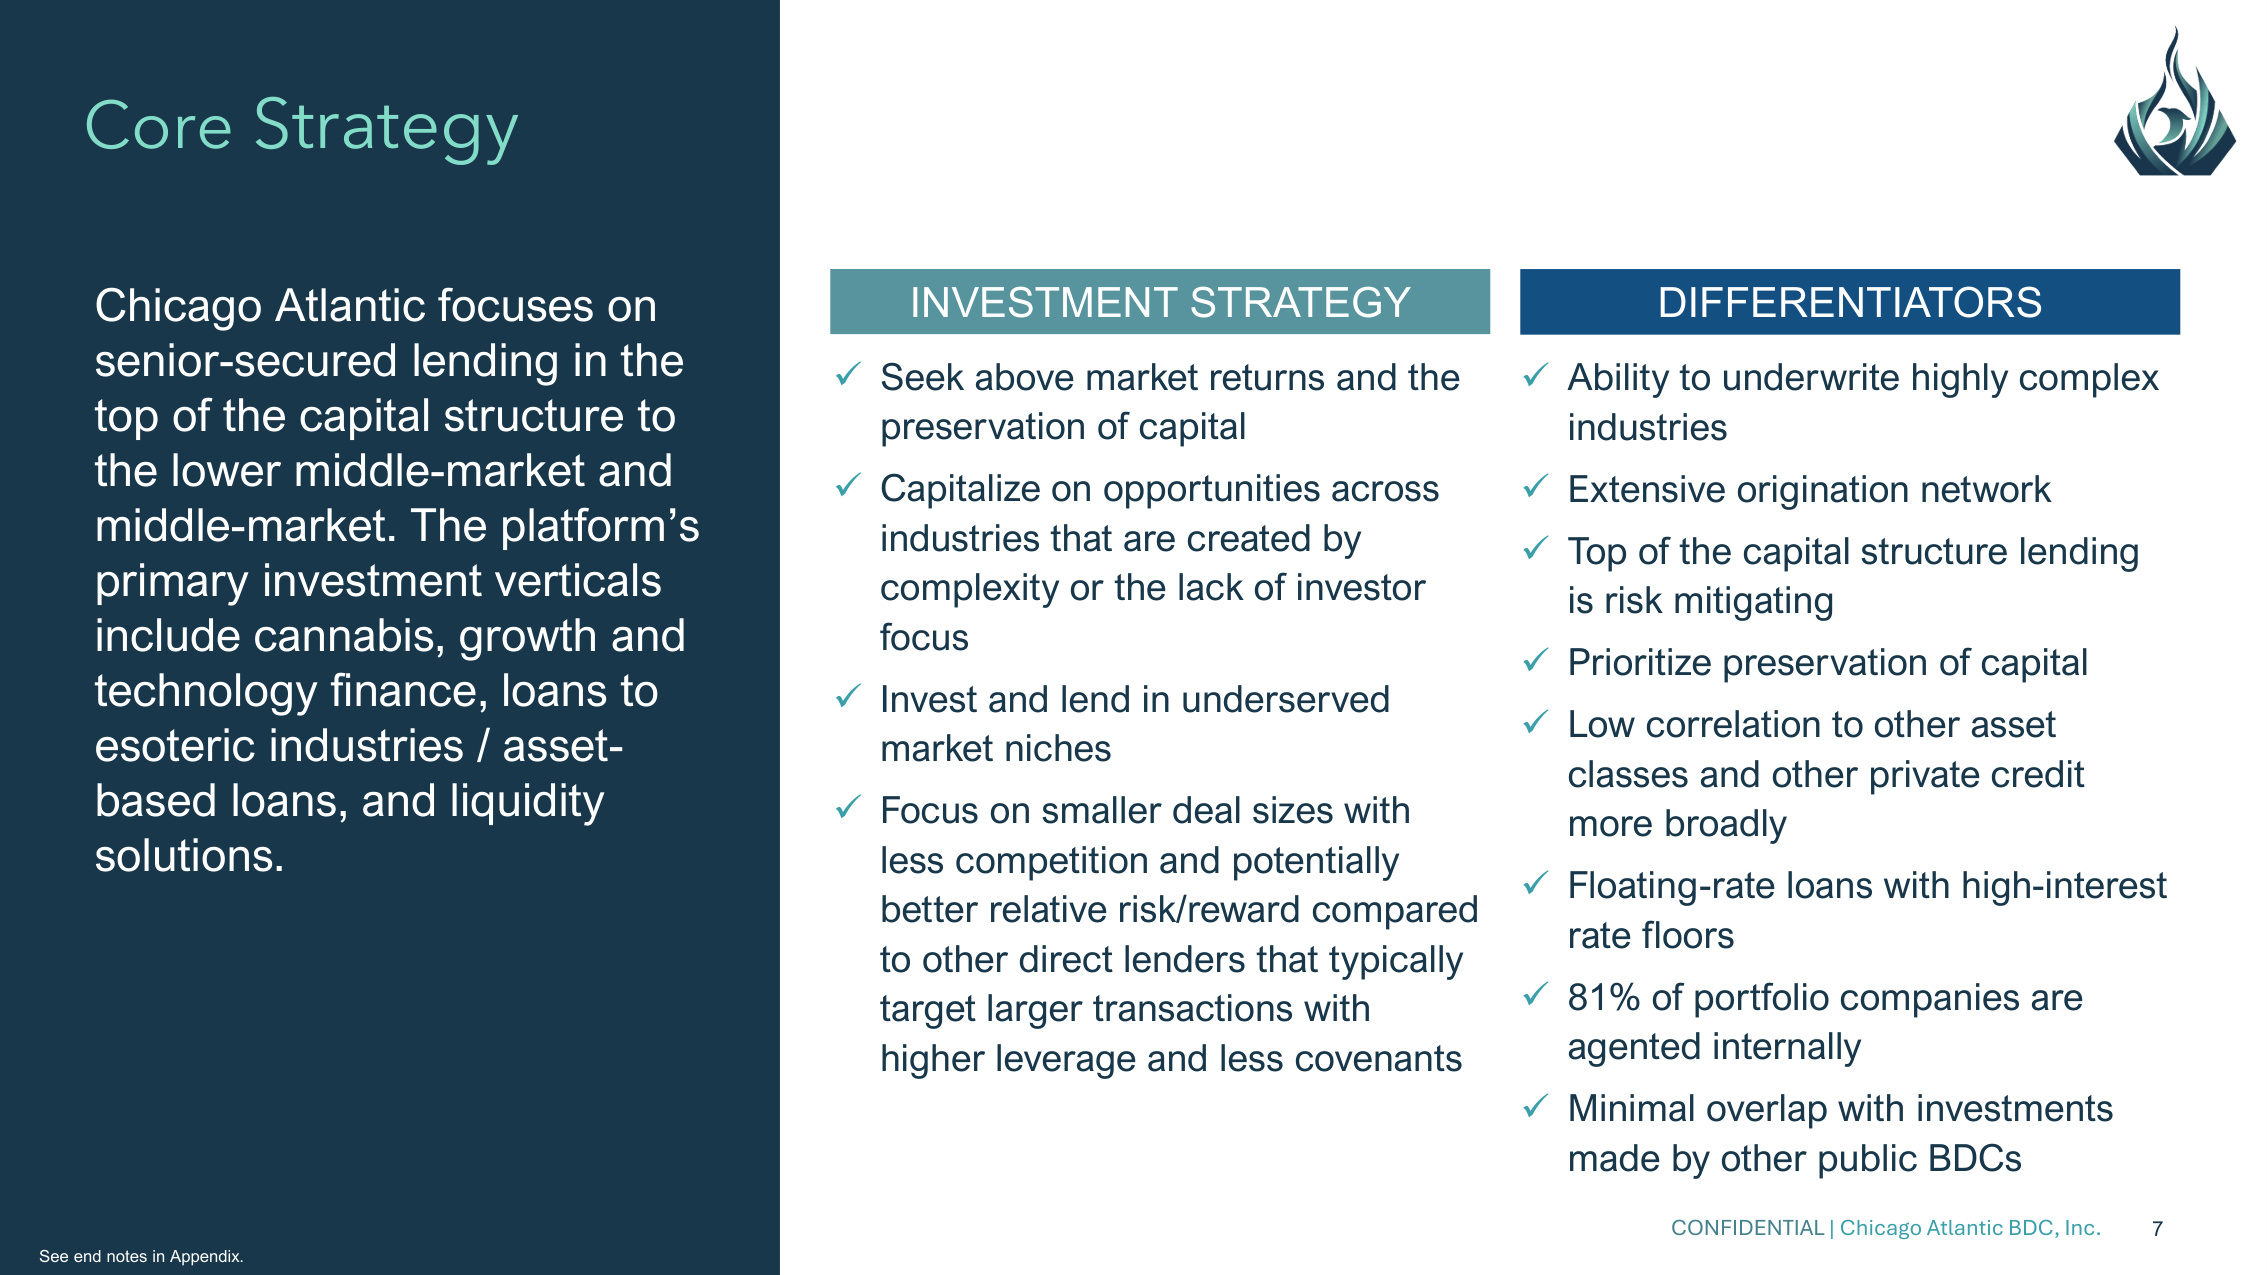
CONFIDENTIAL | Chicago Atlantic BDC, Inc. 7 Core Strategy Chicago Atlantic focuses on senior-secured lending in the top of the capital structure to the lower middle-market and middle-market. The platform's primary investment verticals include cannabis, growth and technology finance, loans to esoteric industries / asset- based loans, and liquidity solutions. INVESTMENT STRATEGY DIFFERENTIATORS Seek above market returns and the preservation of capital Capitalize on opportunities across industries that are created by complexity or the lack of investor focus Invest and lend in underserved market niches Focus on smaller deal sizes with less competition and potentially better relative risk/reward compared to other direct lenders that typically target larger transactions with higher leverage and less covenants Ability to underwrite highly complex industries Extensive origination network Top of the capital structure lending is risk mitigating Prioritize preservation of capital Low correlation to other asset classes and other private credit more broadly Floating-rate loans with high-interest rate floors 81% of portfolio companies are agented internally Minimal overlap with investments made by other public BDCs See end notes in Appendix.
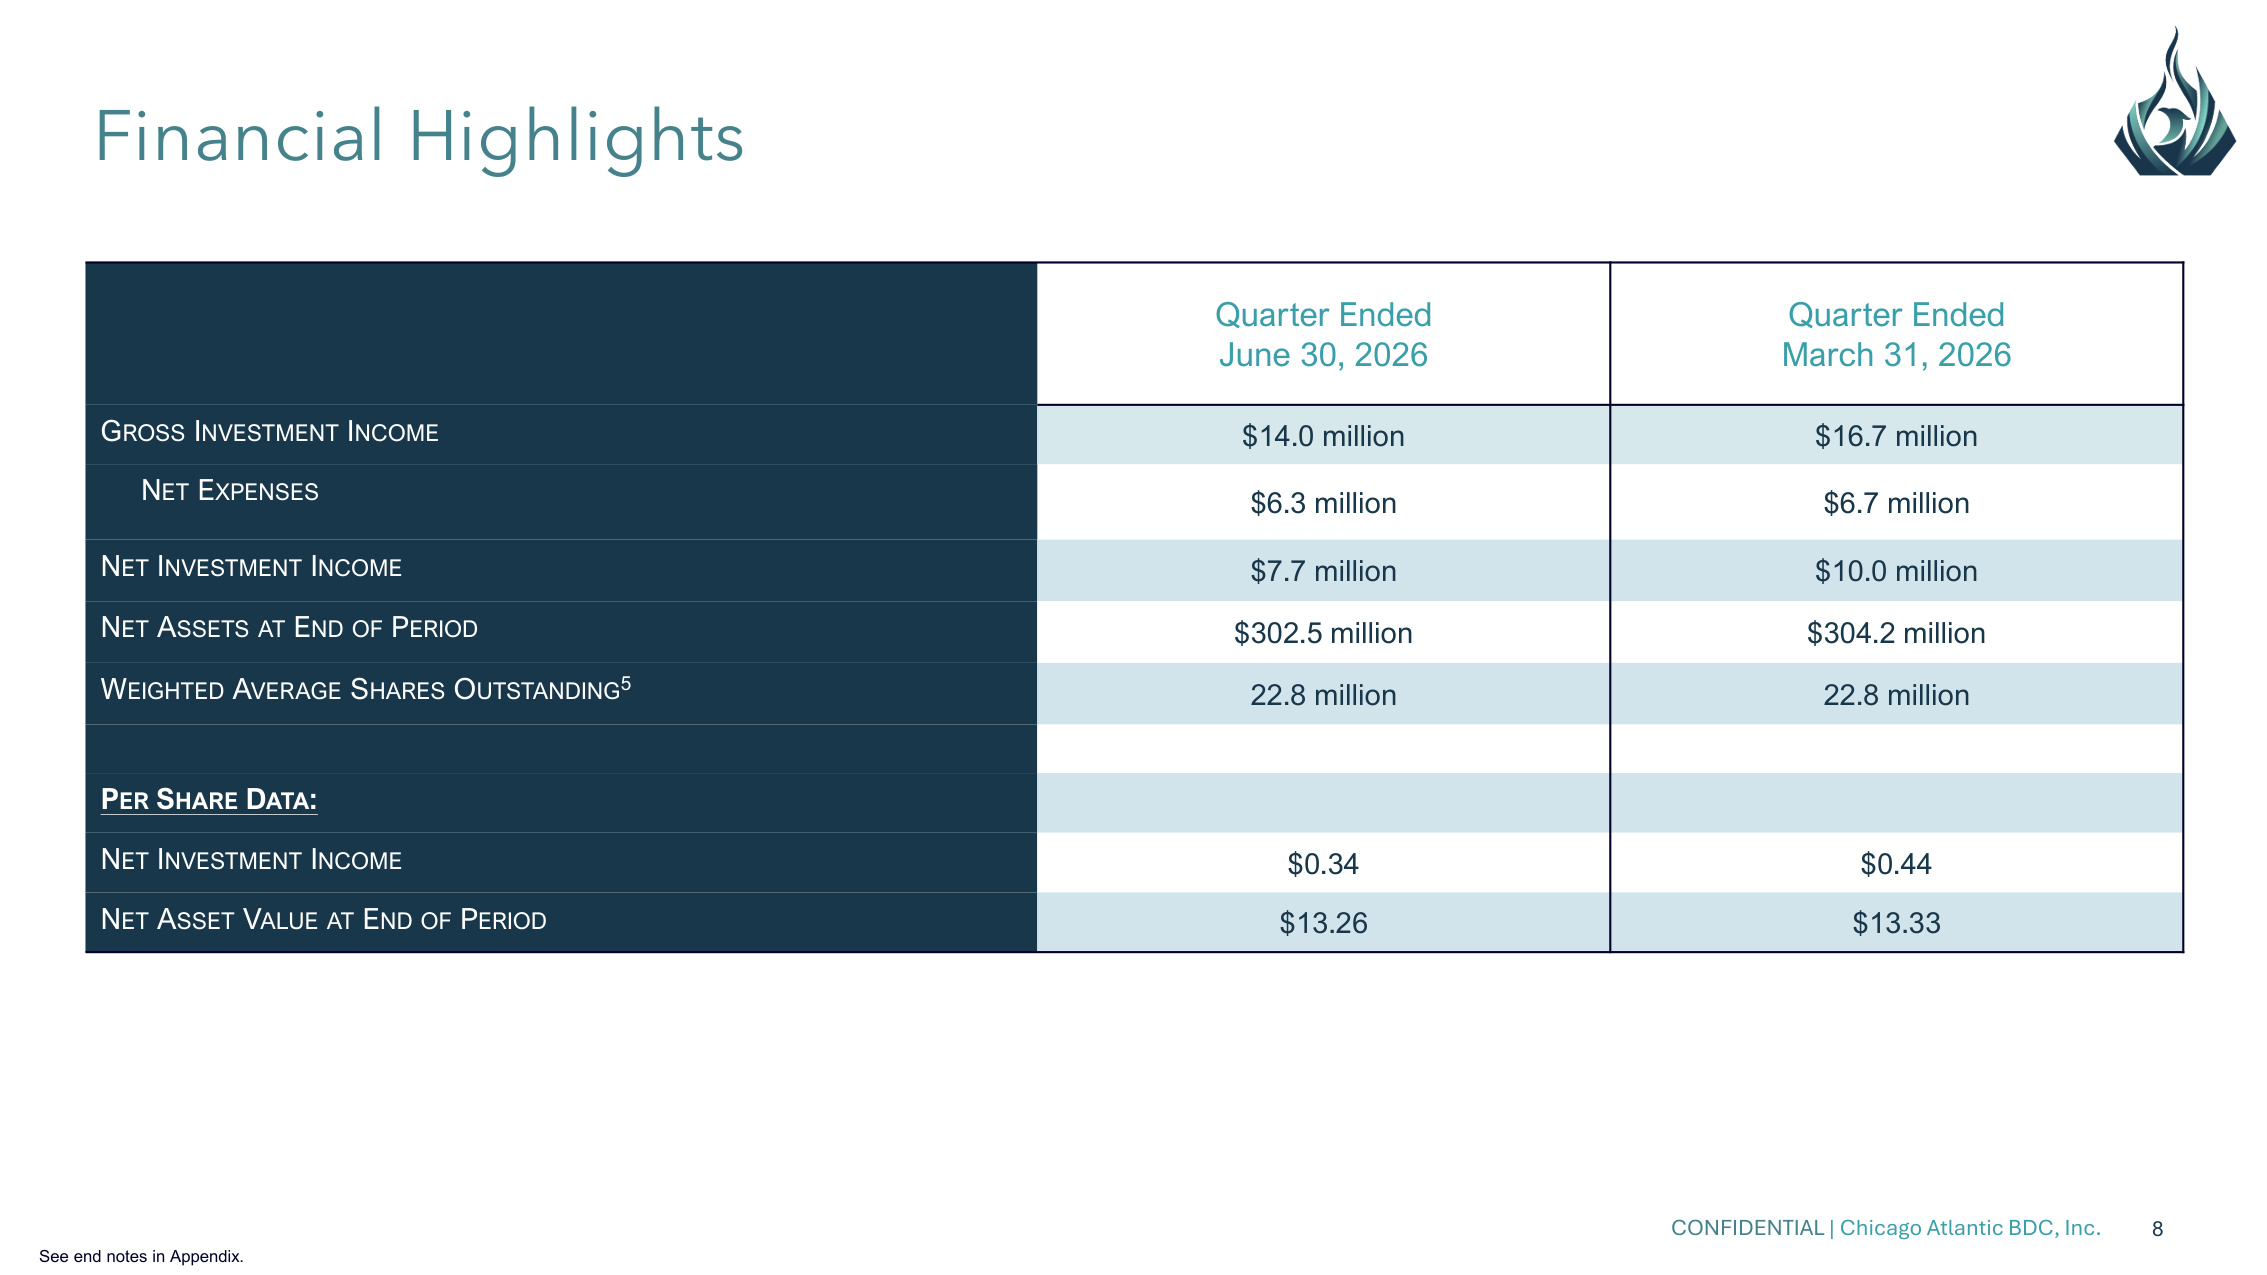
CONFIDENTIAL | Chicago Atlantic BDC, Inc. 8 Quarter Ended June 30, 2026 Quarter Ended March 31, 2026 GROSS INVESTMENT INCOME $14.0 million $16.7 million NET EXPENSES $6.3 million $6.7 million NET INVESTMENT INCOME $7.7 million $10.0 million NET ASSETS AT END OF PERIOD $302.5 million $304.2 million WEIGHTED AVERAGE SHARES OUTSTANDING5 22.8 million 22.8 million PER SHARE DATA: NET INVESTMENT INCOME $0.34 $0.44 NET ASSET VALUE AT END OF PERIOD $13.26 $13.33 See end notes in Appendix. Financial Highlights
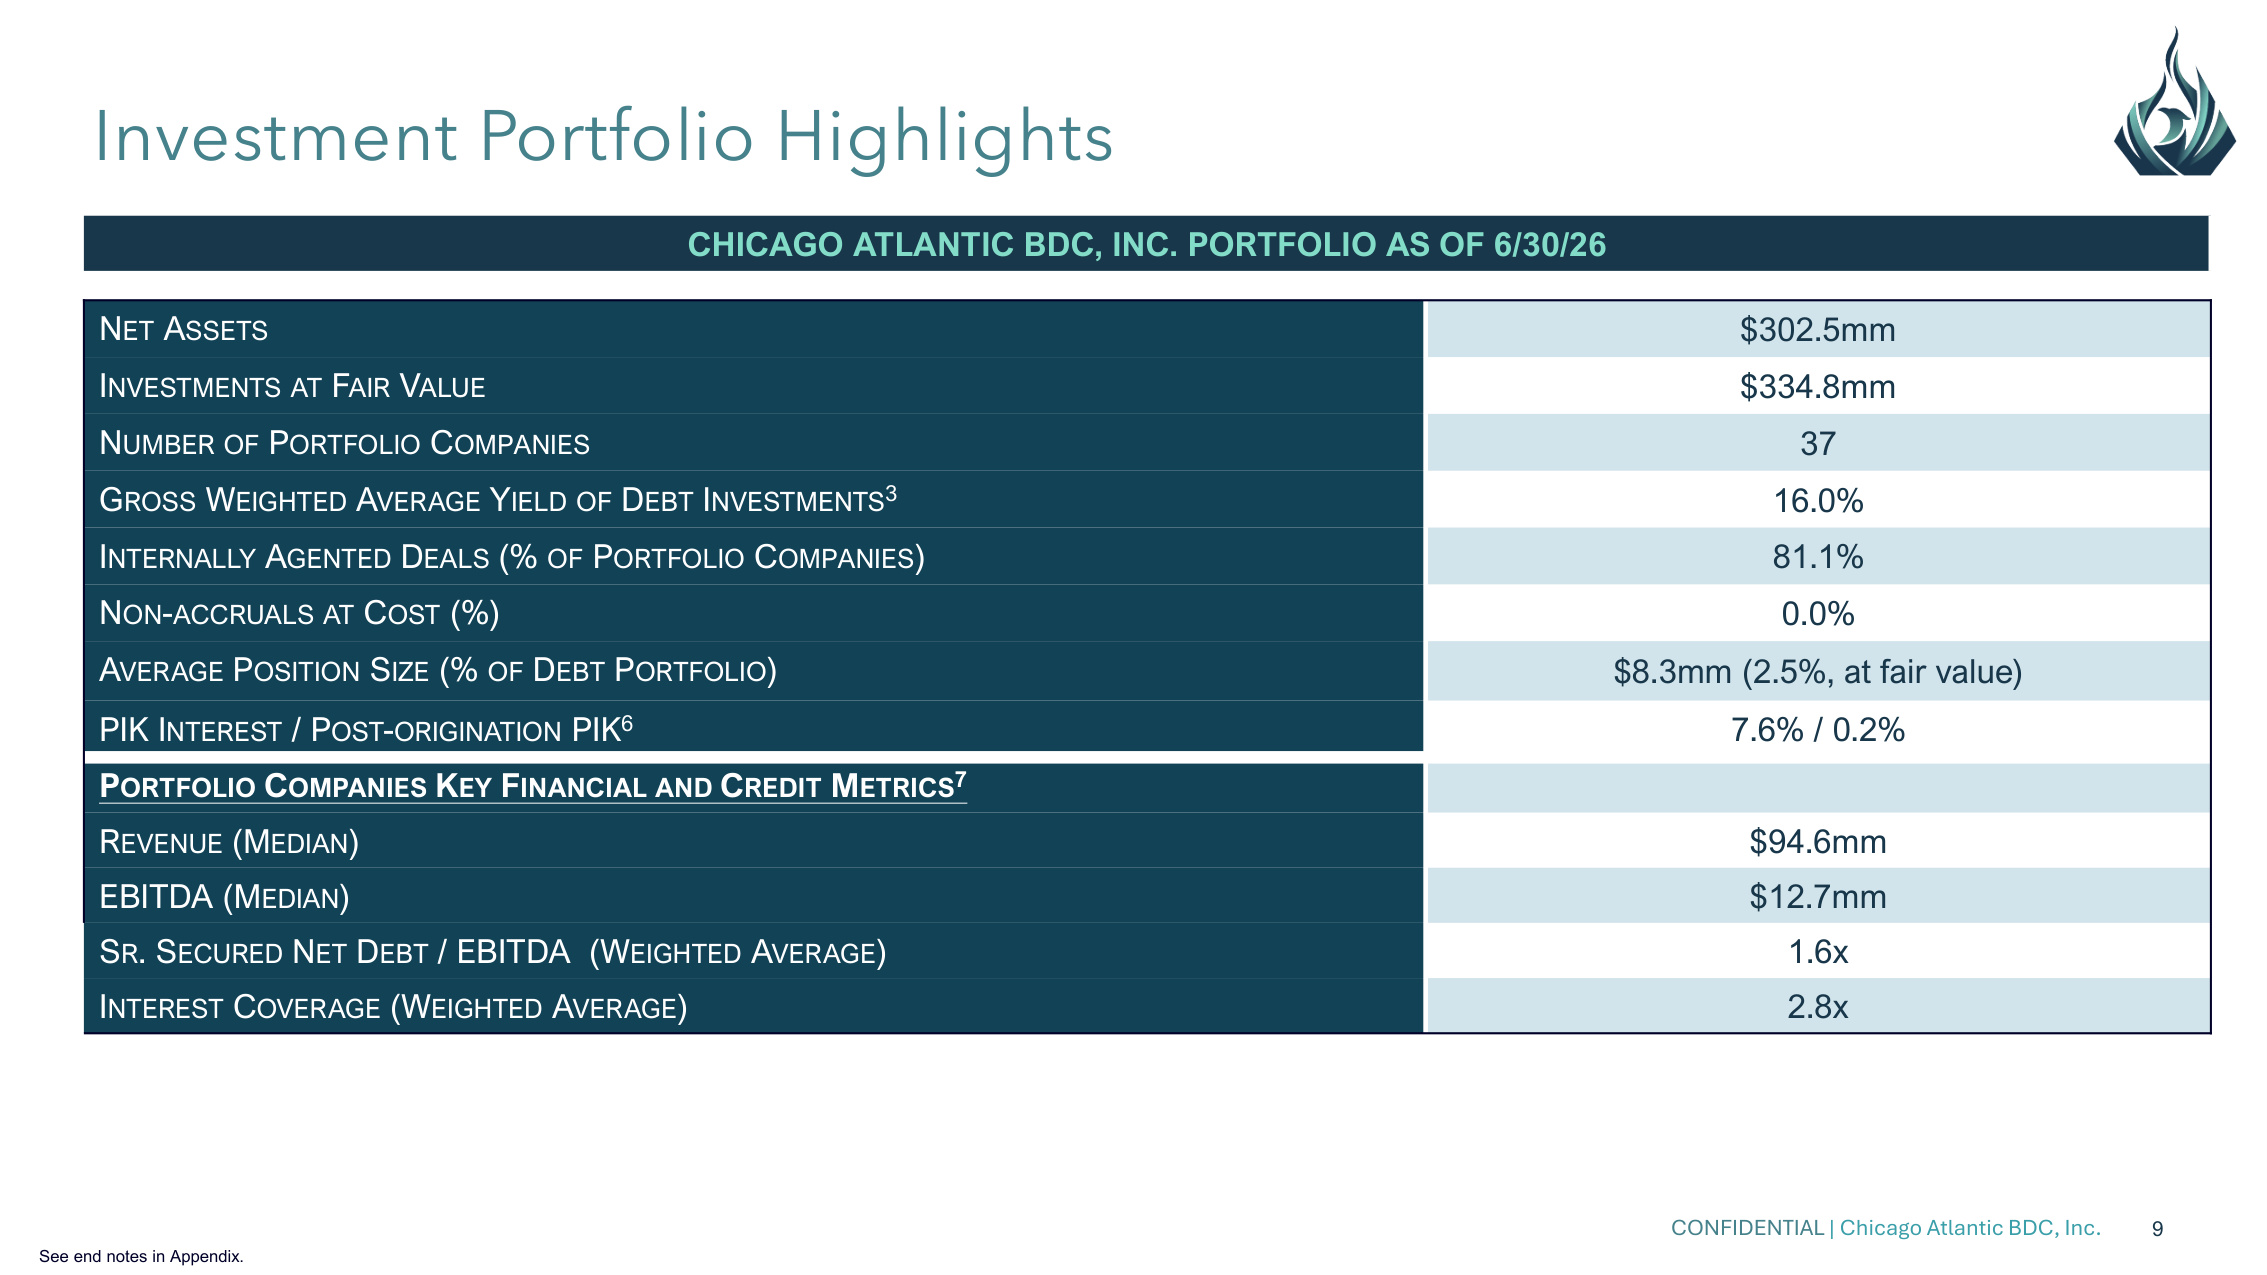
CONFIDENTIAL | Chicago Atlantic BDC, Inc. 9 CHICAGO ATLANTIC BDC, INC. PORTFOLIO AS OF 6/30/26 NET ASSETS $302.5mm INVESTMENTS AT FAIR VALUE $334.8mm NUMBER OF PORTFOLIO COMPANIES 37 GROSS WEIGHTED AVERAGE YIELD OF DEBT INVESTMENTS3 16.0% INTERNALLY AGENTED DEALS (% OF PORTFOLIO COMPANIES) 81.1% NON-ACCRUALS AT COST (%) 0.0% AVERAGE POSITION SIZE (% OF DEBT PORTFOLIO) $8.3mm (2.5%, at fair value) PIK INTEREST / POST-ORIGINATION PIK6 7.6% / 0.2% PORTFOLIO COMPANIES KEY FINANCIAL AND CREDIT METRICS7 REVENUE (MEDIAN) $94.6mm EBITDA (MEDIAN) $12.7mm SR. SECURED NET DEBT / EBITDA (WEIGHTED AVERAGE) 1.6x INTEREST COVERAGE (WEIGHTED AVERAGE) 2.8x See end notes in Appendix. Investment Portfolio Highlights
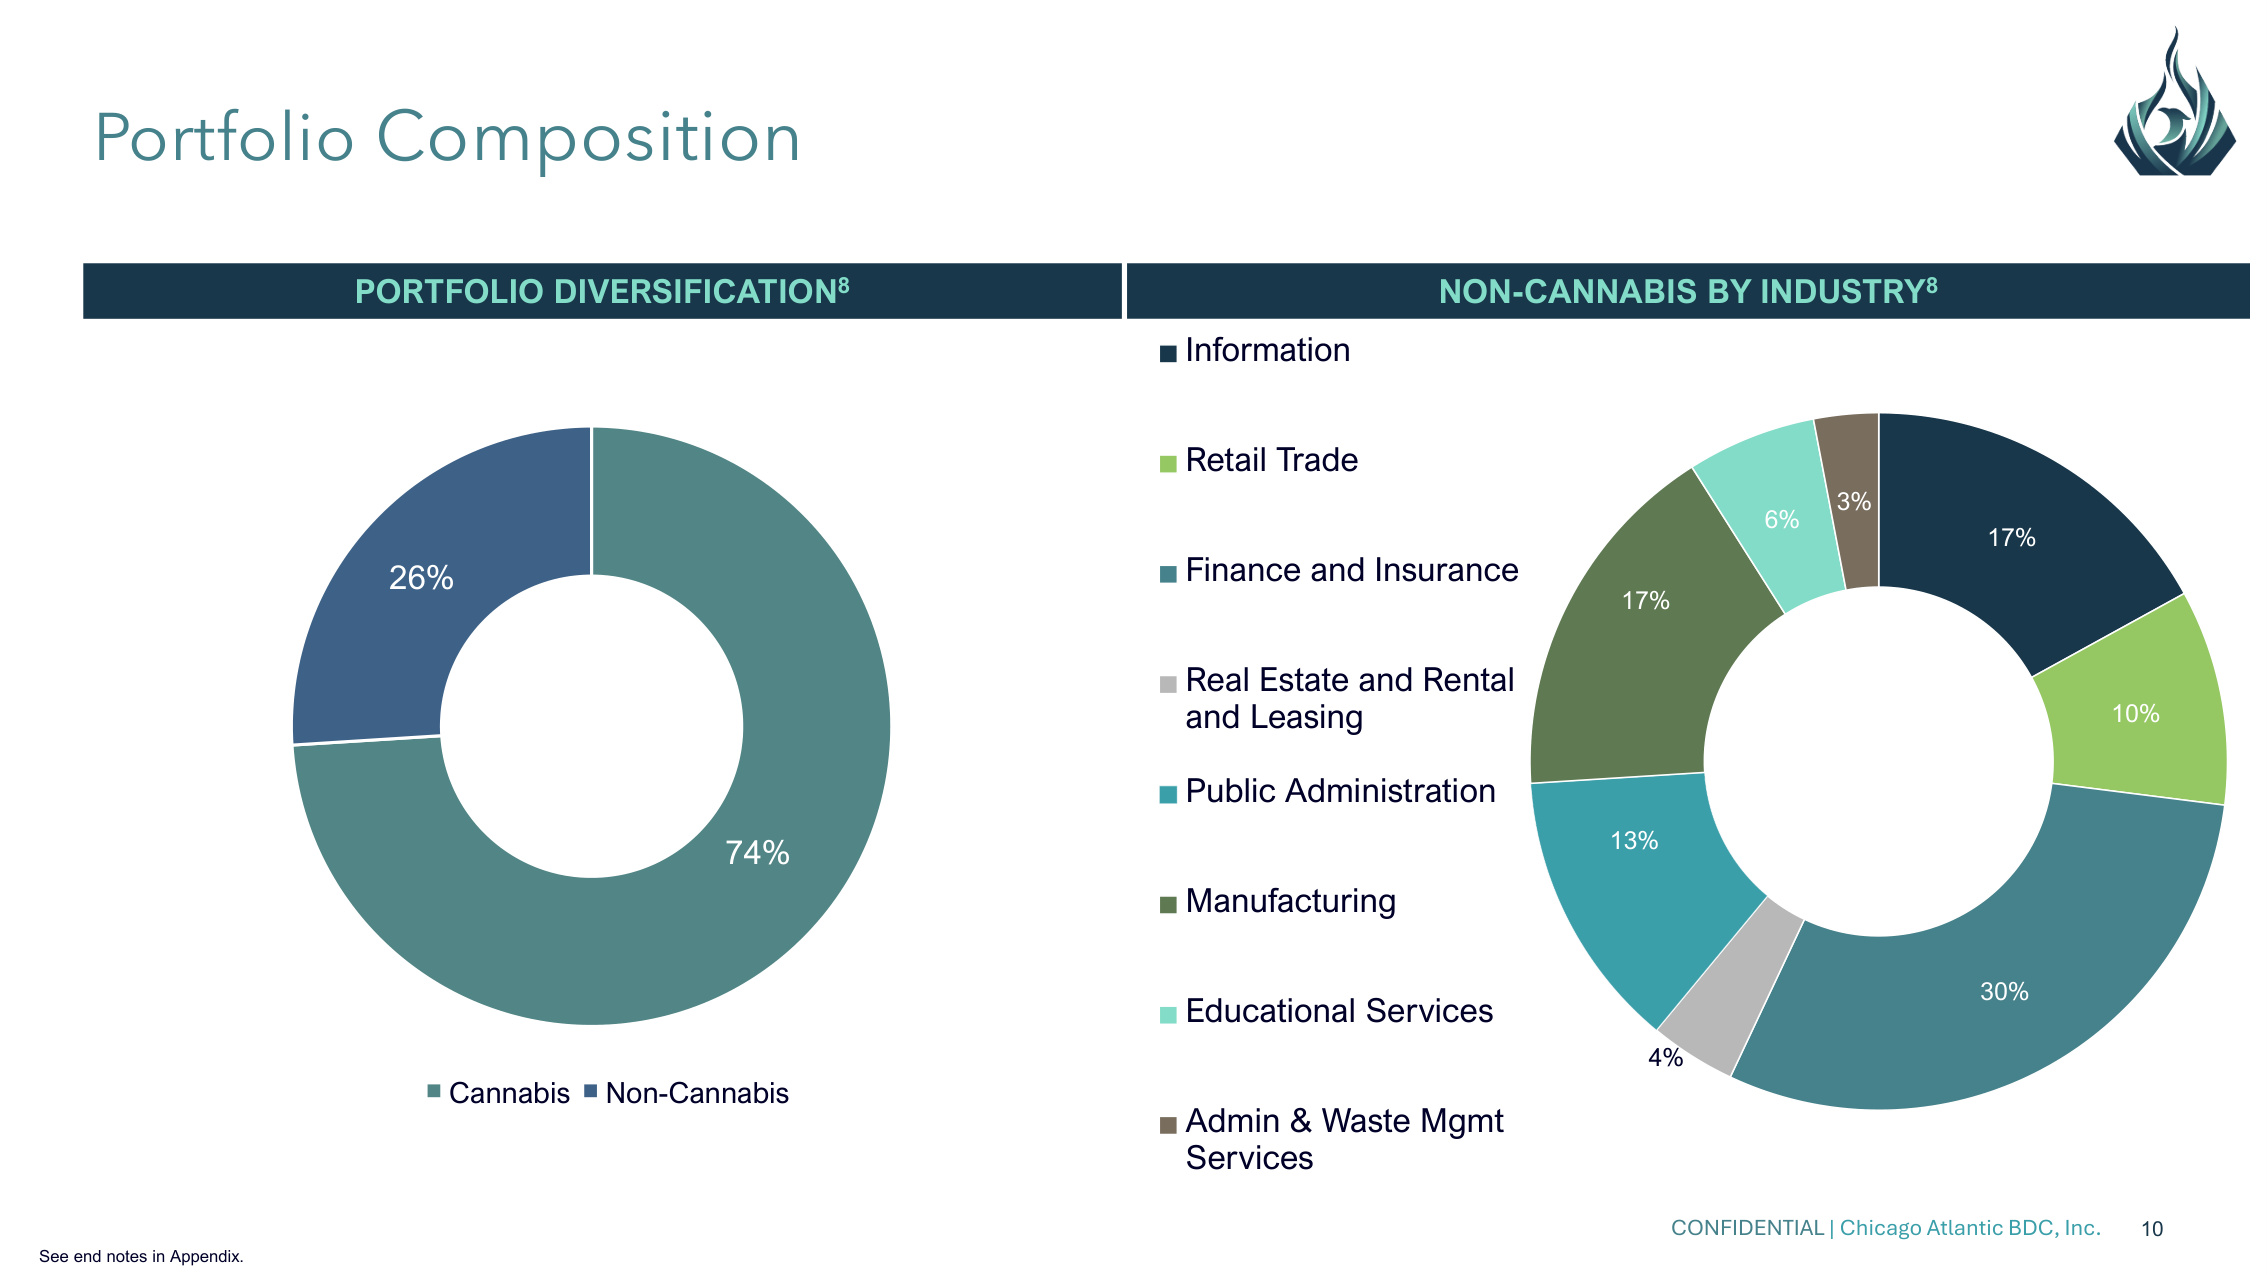
CONFIDENTIAL | Chicago Atlantic BDC, Inc. 10 74% 26% Cannabis Non-Cannabis NON-CANNABIS BY INDUSTRY8 PORTFOLIO DIVERSIFICATION8 Portfolio Composition 17% 10% 30% 4% 13% 17% 6% 3% Information Retail Trade Finance and Insurance Real Estate and Rental and Leasing Public Administration Manufacturing Educational Services Admin & Waste Mgmt Services See end notes in Appendix.
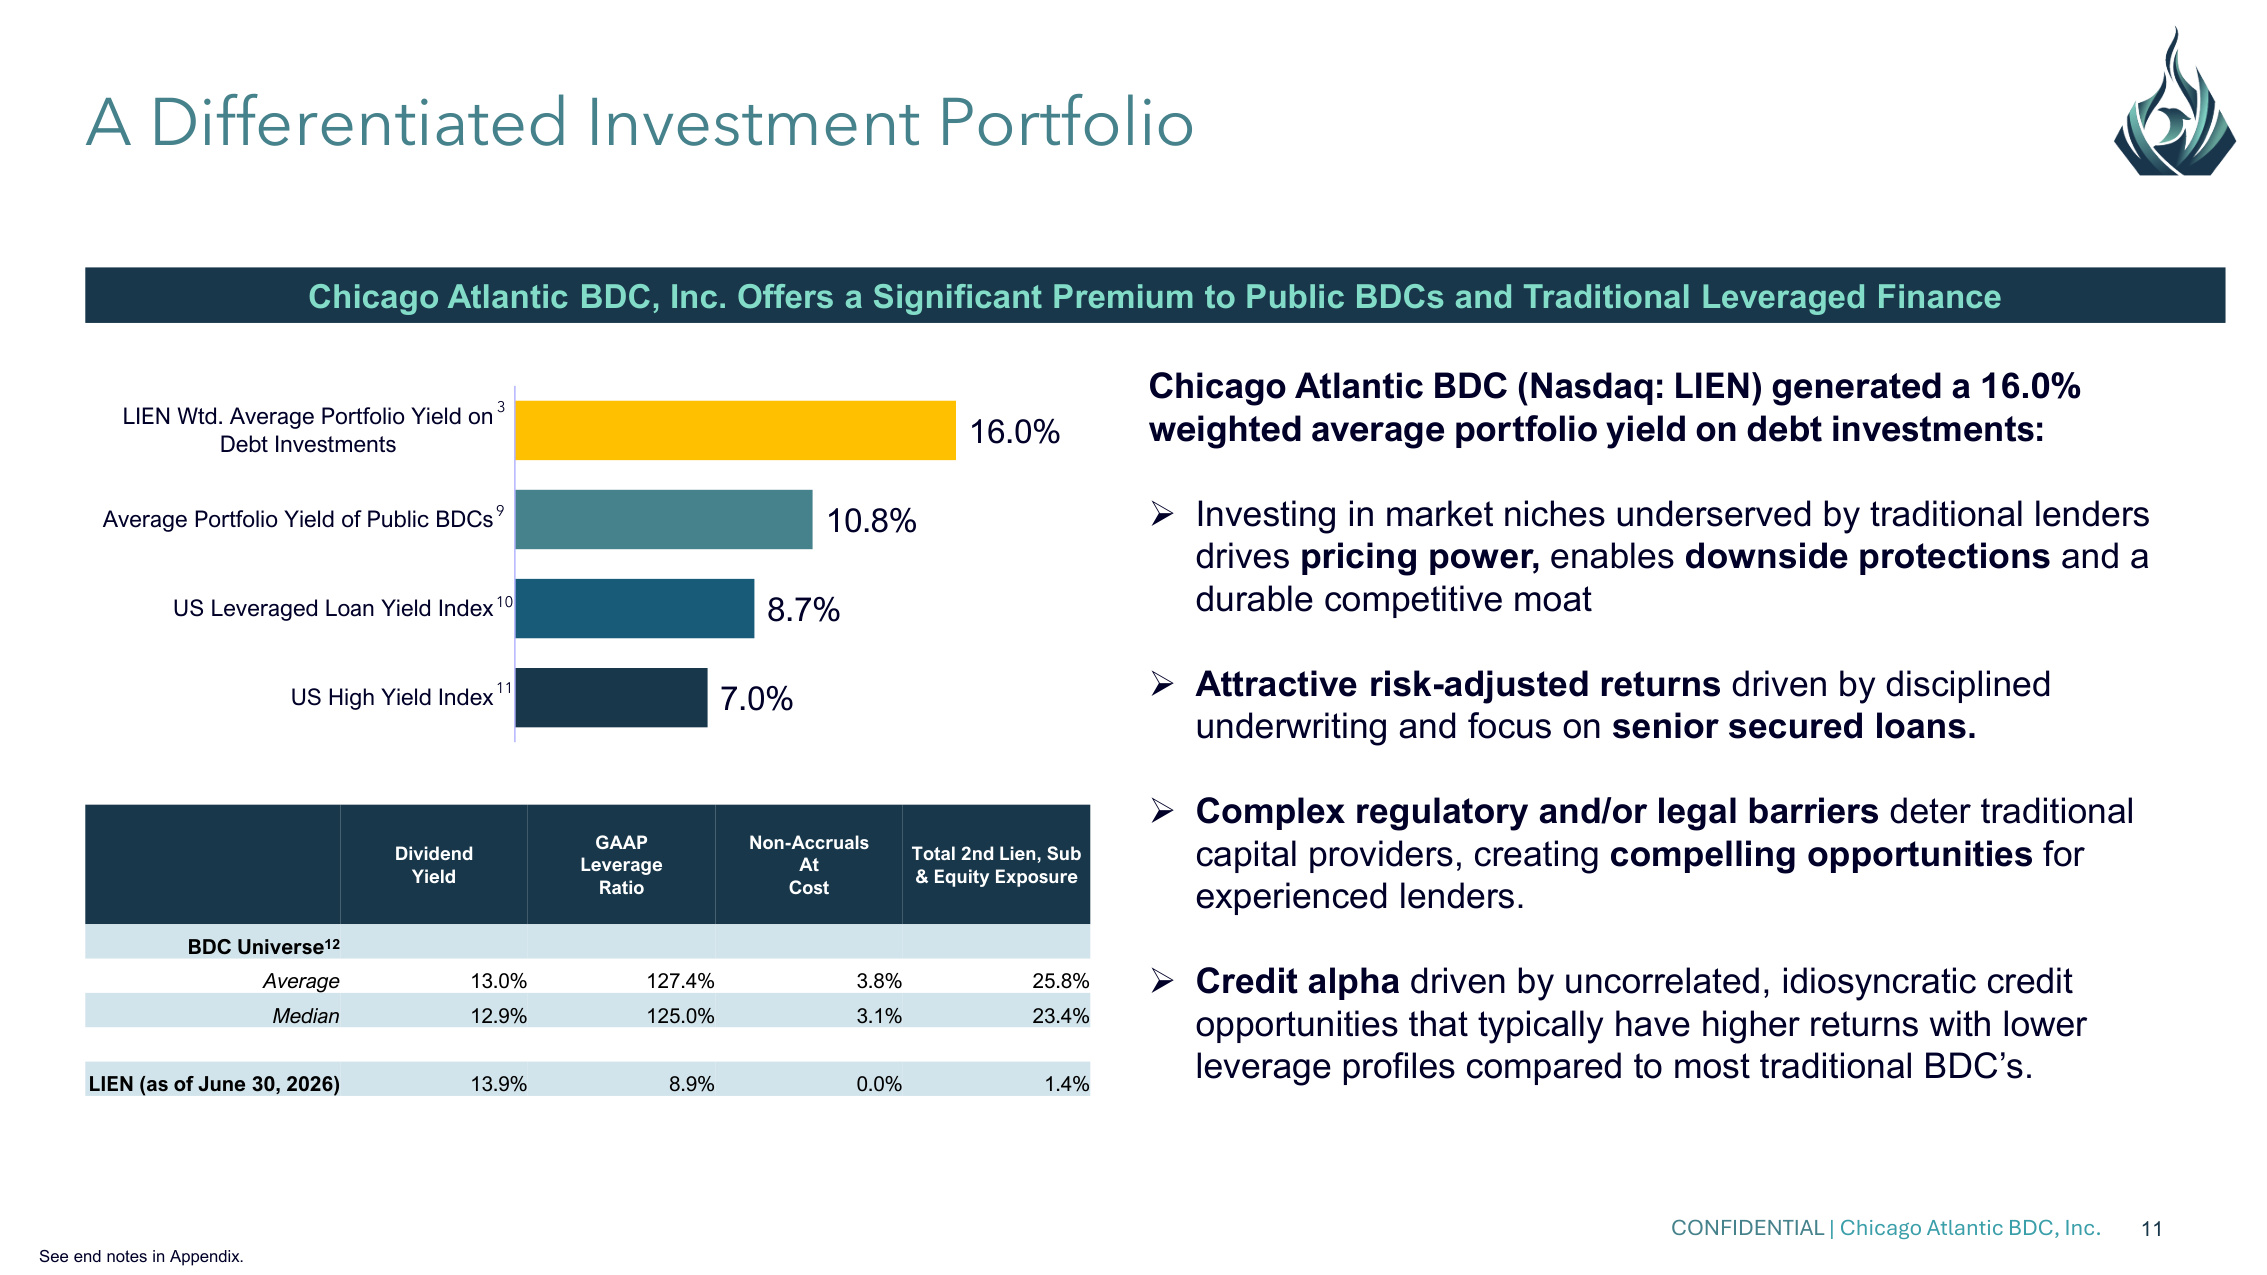
CONFIDENTIAL | Chicago Atlantic BDC, Inc. 11 A Differentiated Investment Portfolio Chicago Atlantic BDC, Inc. Offers a Significant Premium to Public BDCs and Traditional Leveraged Finance Chicago Atlantic BDC (Nasdaq: LIEN) generated a 16.0% weighted average portfolio yield on debt investments: Investing in market niches underserved by traditional lenders drives pricing power, enables downside protections and a durable competitive moat Attractive risk-adjusted returns driven by disciplined underwriting and focus on senior secured loans. Complex regulatory and/or legal barriers deter traditional capital providers, creating compelling opportunities for experienced lenders. Credit alpha driven by uncorrelated, idiosyncratic credit opportunities that typically have higher returns with lower leverage profiles compared to most traditional BDC's. 7.0% 8.7% 10.8% 16.0% US High Yield Index US Leveraged Loan Yield Index Average Portfolio Yield of Public BDCs LIEN Wtd. Average Portfolio Yield on Debt Investments 3 9 10 11 Dividend Yield GAAP Leverage Ratio Non-Accruals At Cost Total 2nd Lien, Sub & Equity Exposure BDC Universe12 Average 13.0% 127.4% 3.8% 25.8% Median 12.9% 125.0% 3.1% 23.4% LIEN (as of June 30, 2026) 13.9% 8.9% 0.0% 1.4% See end notes in Appendix.
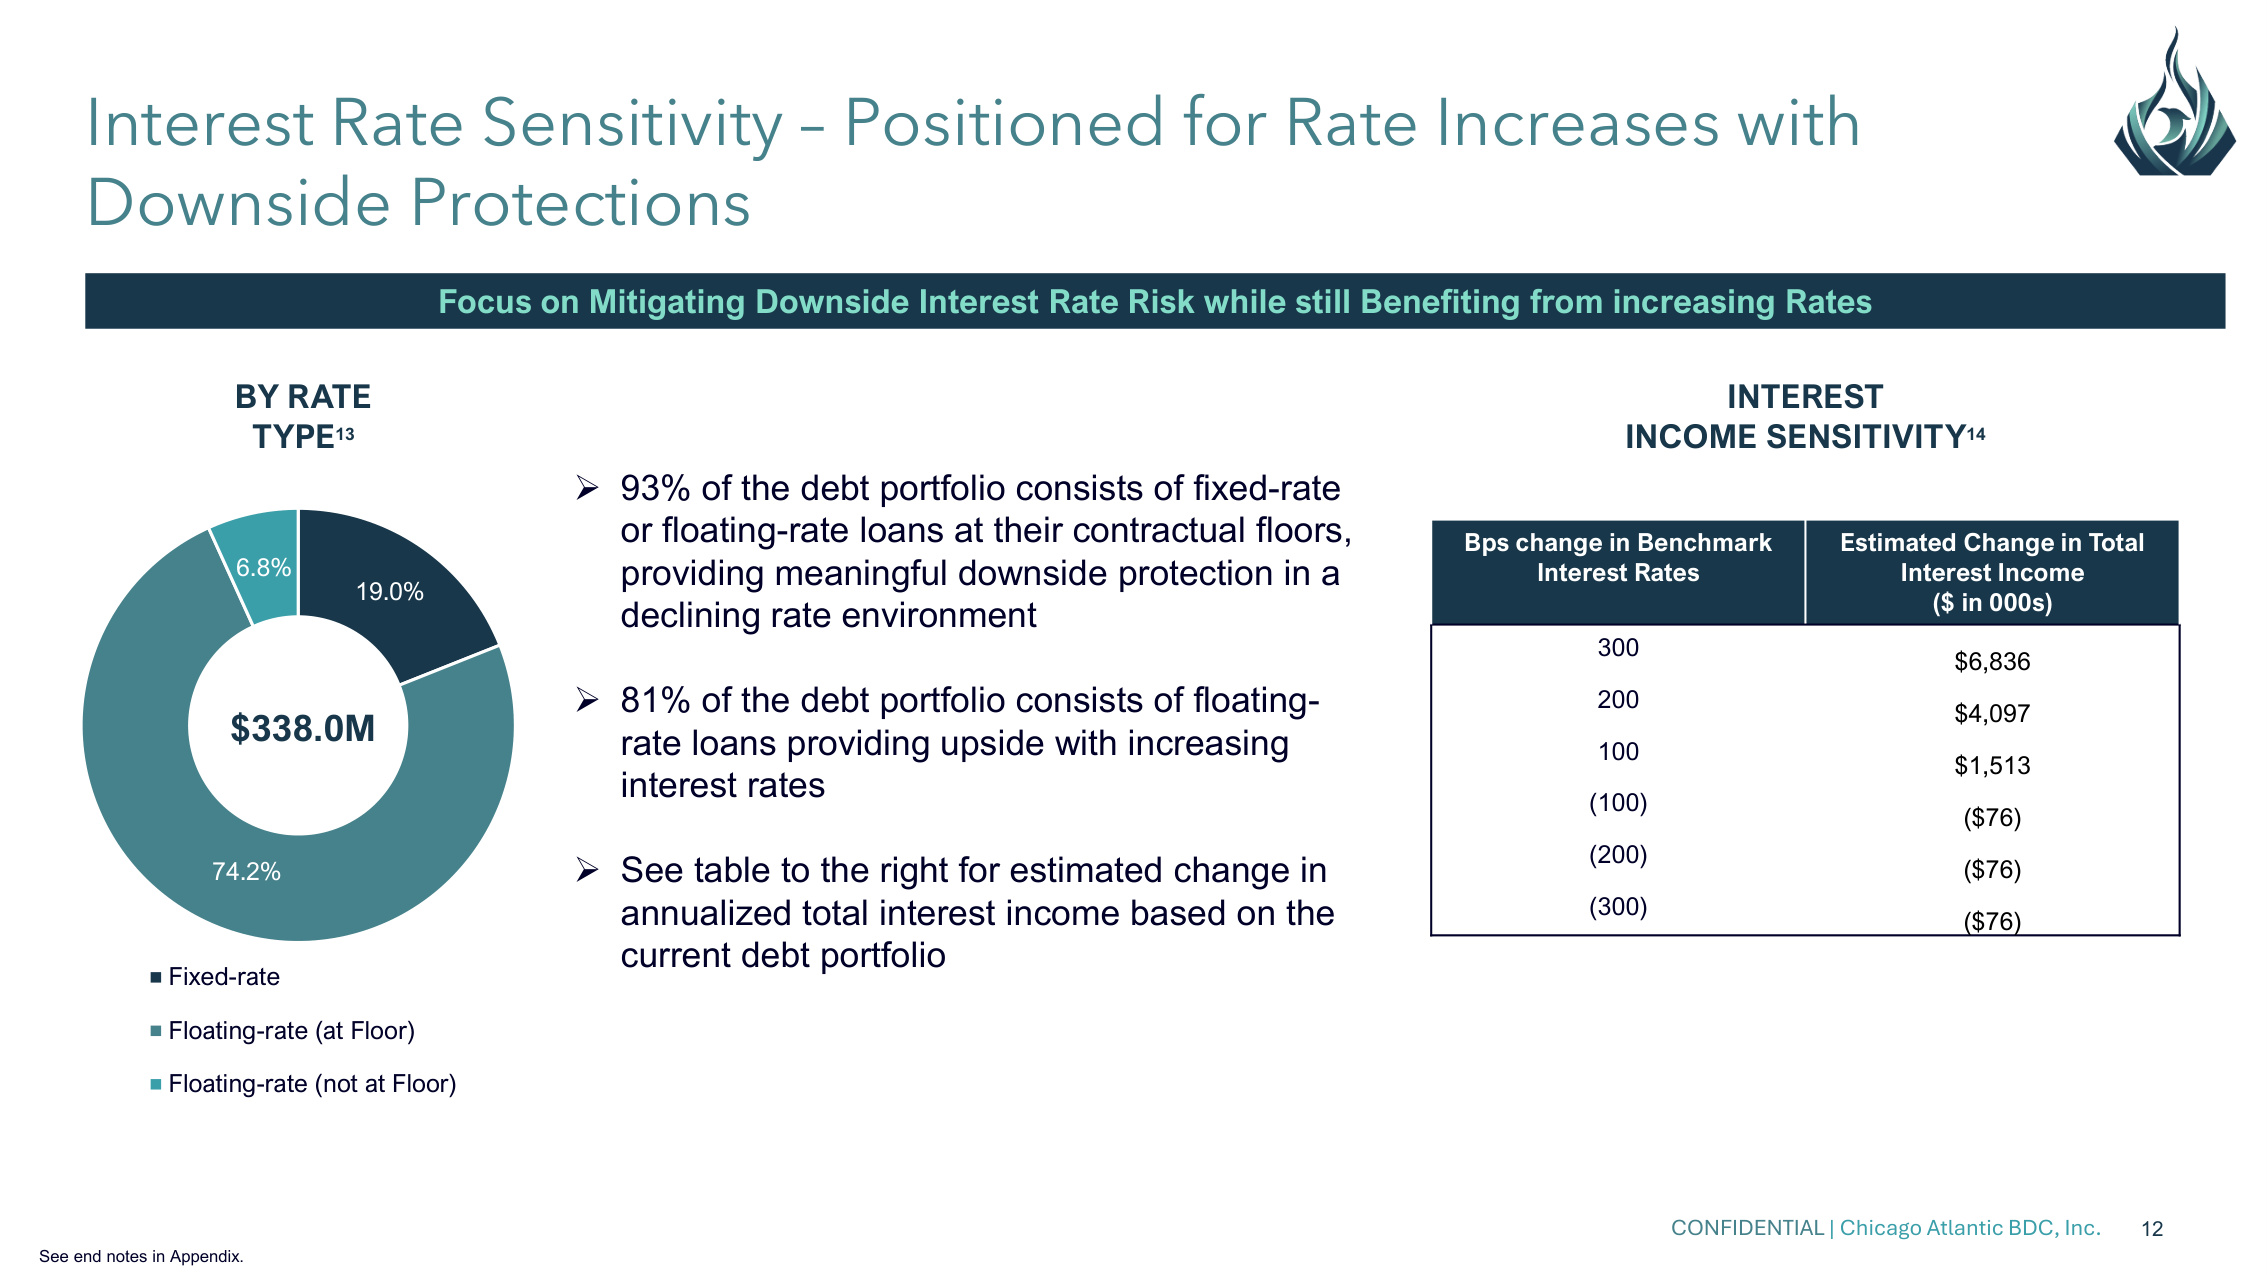
CONFIDENTIAL | Chicago Atlantic BDC, Inc. 12 Interest Rate Sensitivity – Positioned for Rate Increases with Downside Protections BY RATE TYPE13 19.0% 74.2% 6.8% Fixed-rate Floating-rate (at Floor) Floating-rate (not at Floor) $338.0M INTEREST INCOME SENSITIVITY14 Bps change in Benchmark Interest Rates Estimated Change in Total Interest Income ($ in 000s) 300 $6,836 200 $4,097 100 $1,513 (100) ($76) (200) ($76) (300) ($76) Focus on Mitigating Downside Interest Rate Risk while still Benefiting from increasing Rates 93% of the debt portfolio consists of fixed-rate or floating-rate loans at their contractual floors, providing meaningful downside protection in a declining rate environment 81% of the debt portfolio consists of floating- rate loans providing upside with increasing interest rates See table to the right for estimated change in annualized total interest income based on the current debt portfolio See end notes in Appendix.
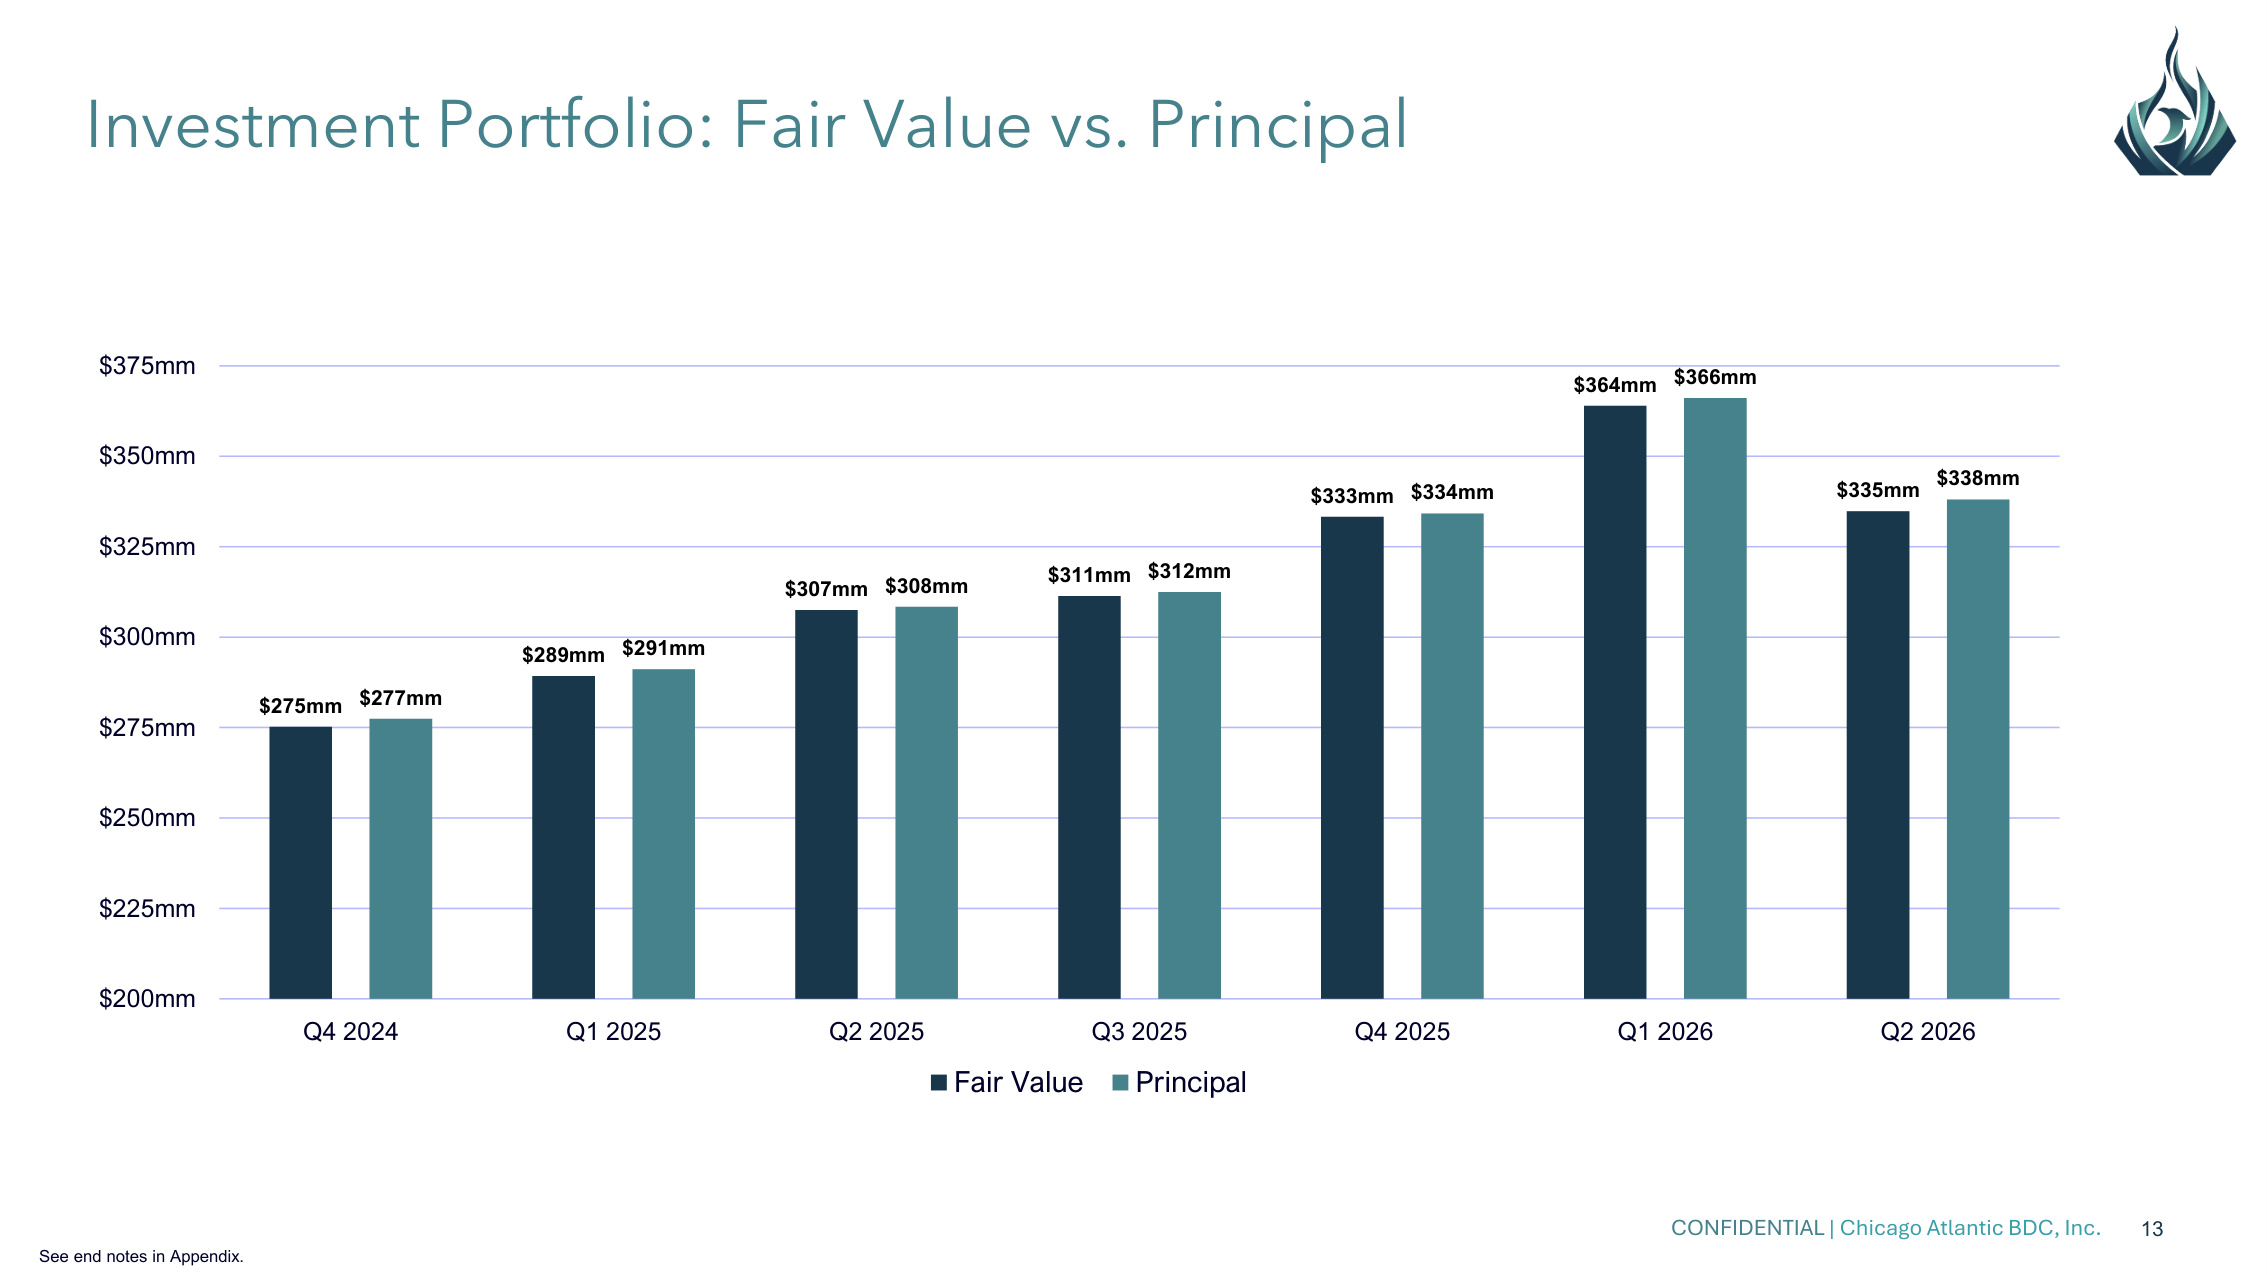
CONFIDENTIAL | Chicago Atlantic BDC, Inc. 13 Investment Portfolio: Fair Value vs. Principal $275mm $289mm $307mm $311mm $333mm $364mm $335mm $277mm $291mm $308mm $312mm $334mm $366mm $338mm $200mm $225mm $250mm $275mm $300mm $325mm $350mm $375mm Q4 2024 Q1 2025 Q2 2025 Q3 2025 Q4 2025 Q1 2026 Q2 2026 Fair Value Principal See end notes in Appendix.
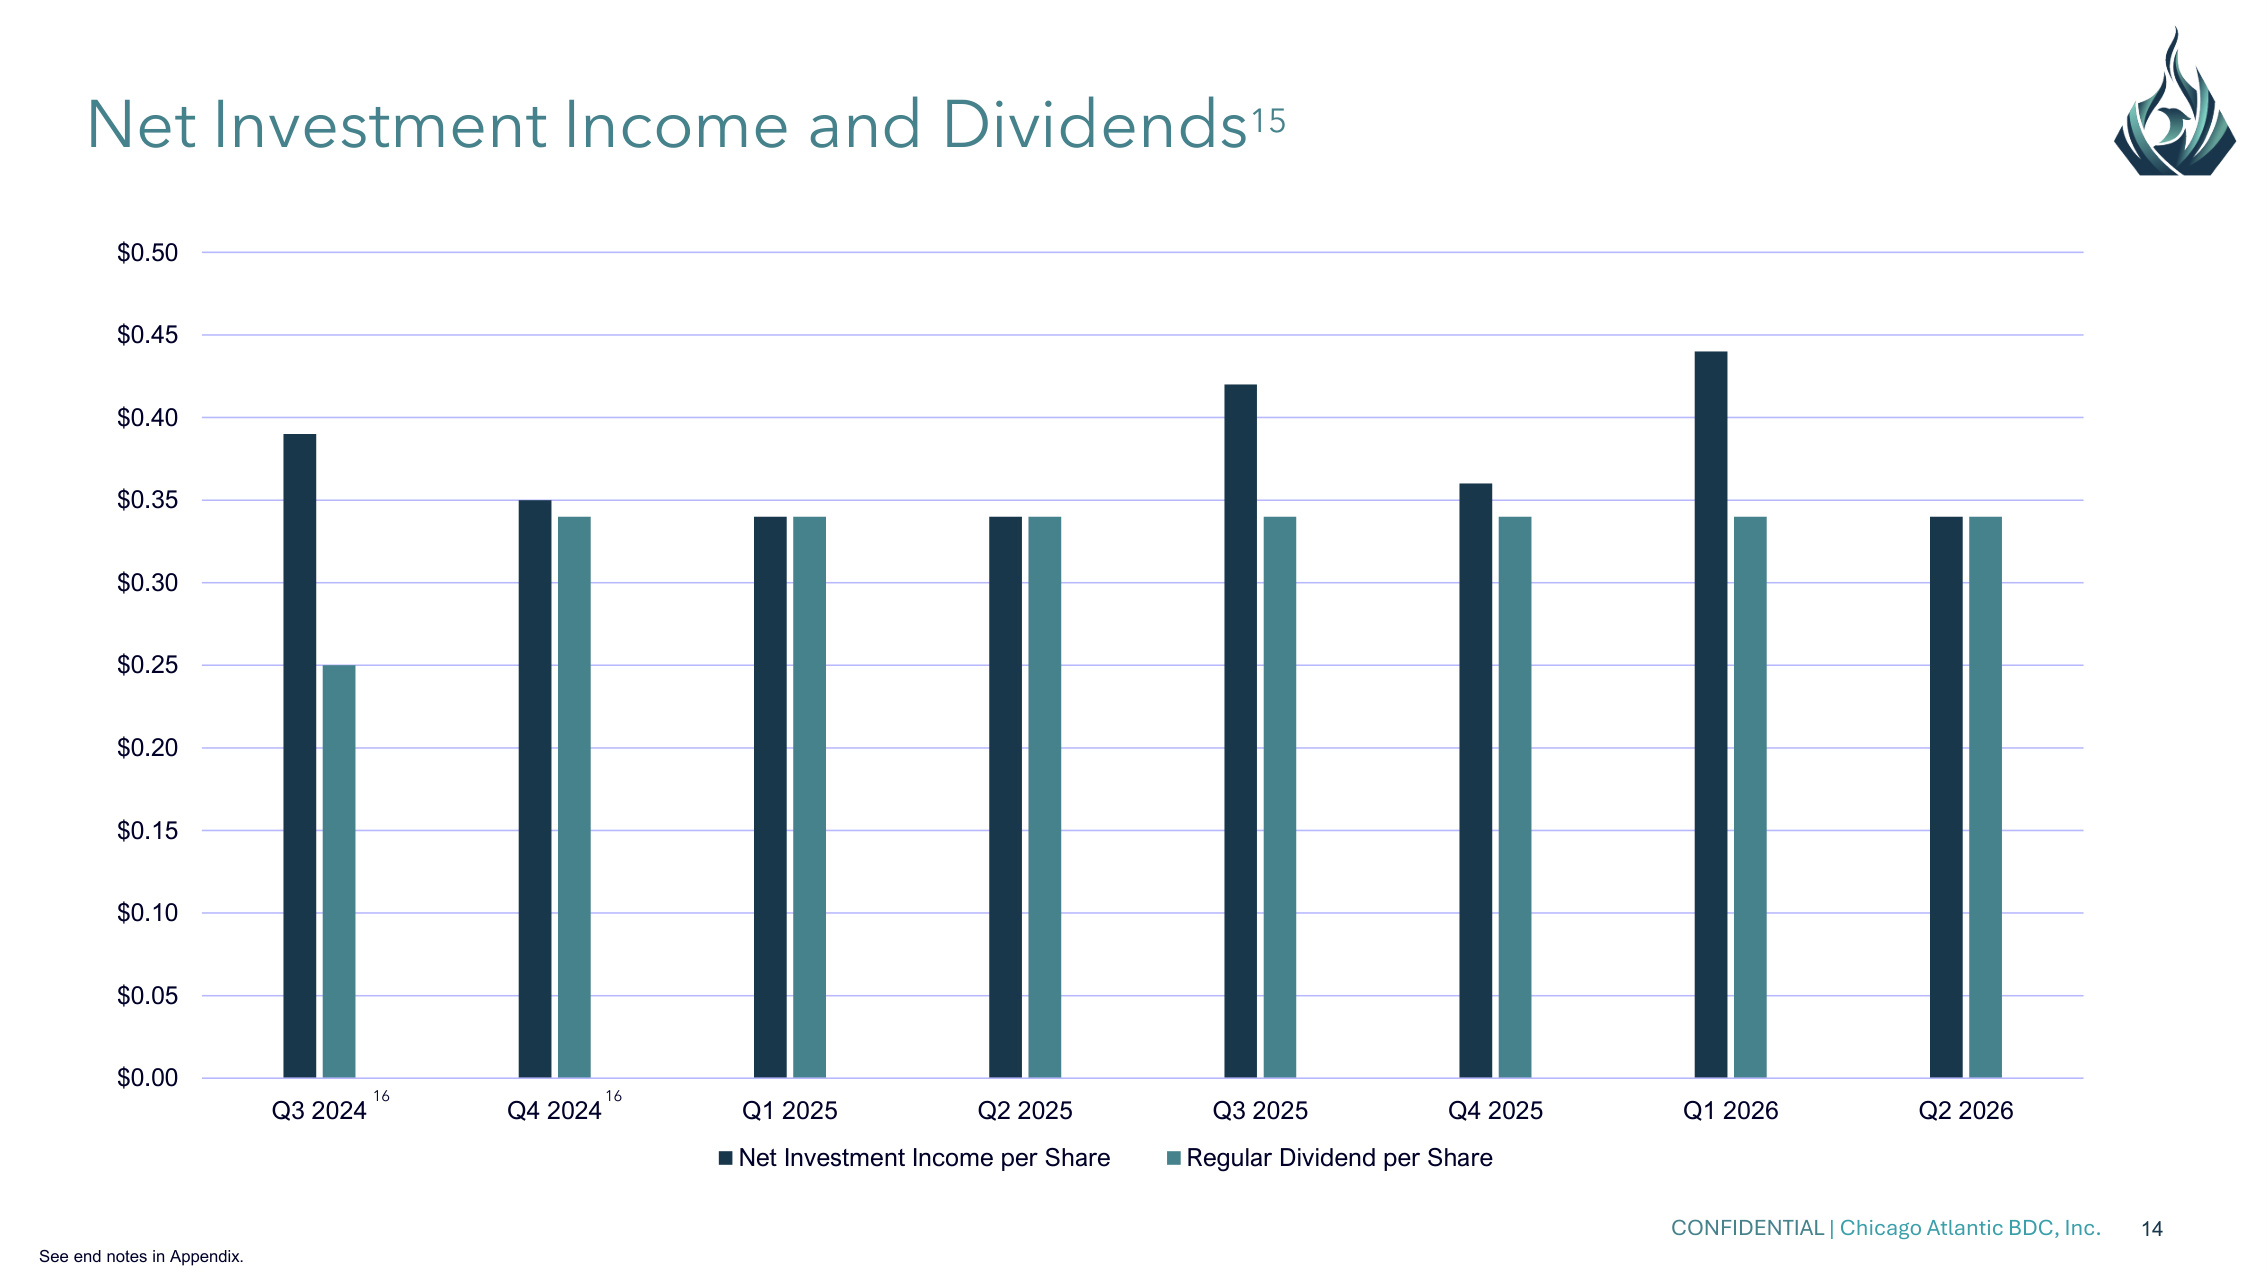
CONFIDENTIAL | Chicago Atlantic BDC, Inc. 14 $0.00 $0.05 $0.10 $0.15 $0.20 $0.25 $0.30 $0.35 $0.40 $0.45 $0.50 Q3 2024 Q4 2024 Q1 2025 Q2 2025 Q3 2025 Q4 2025 Q1 2026 Q2 2026 Net Investment Income per Share Regular Dividend per Share Net Investment Income and Dividends15 16 16 See end notes in Appendix.
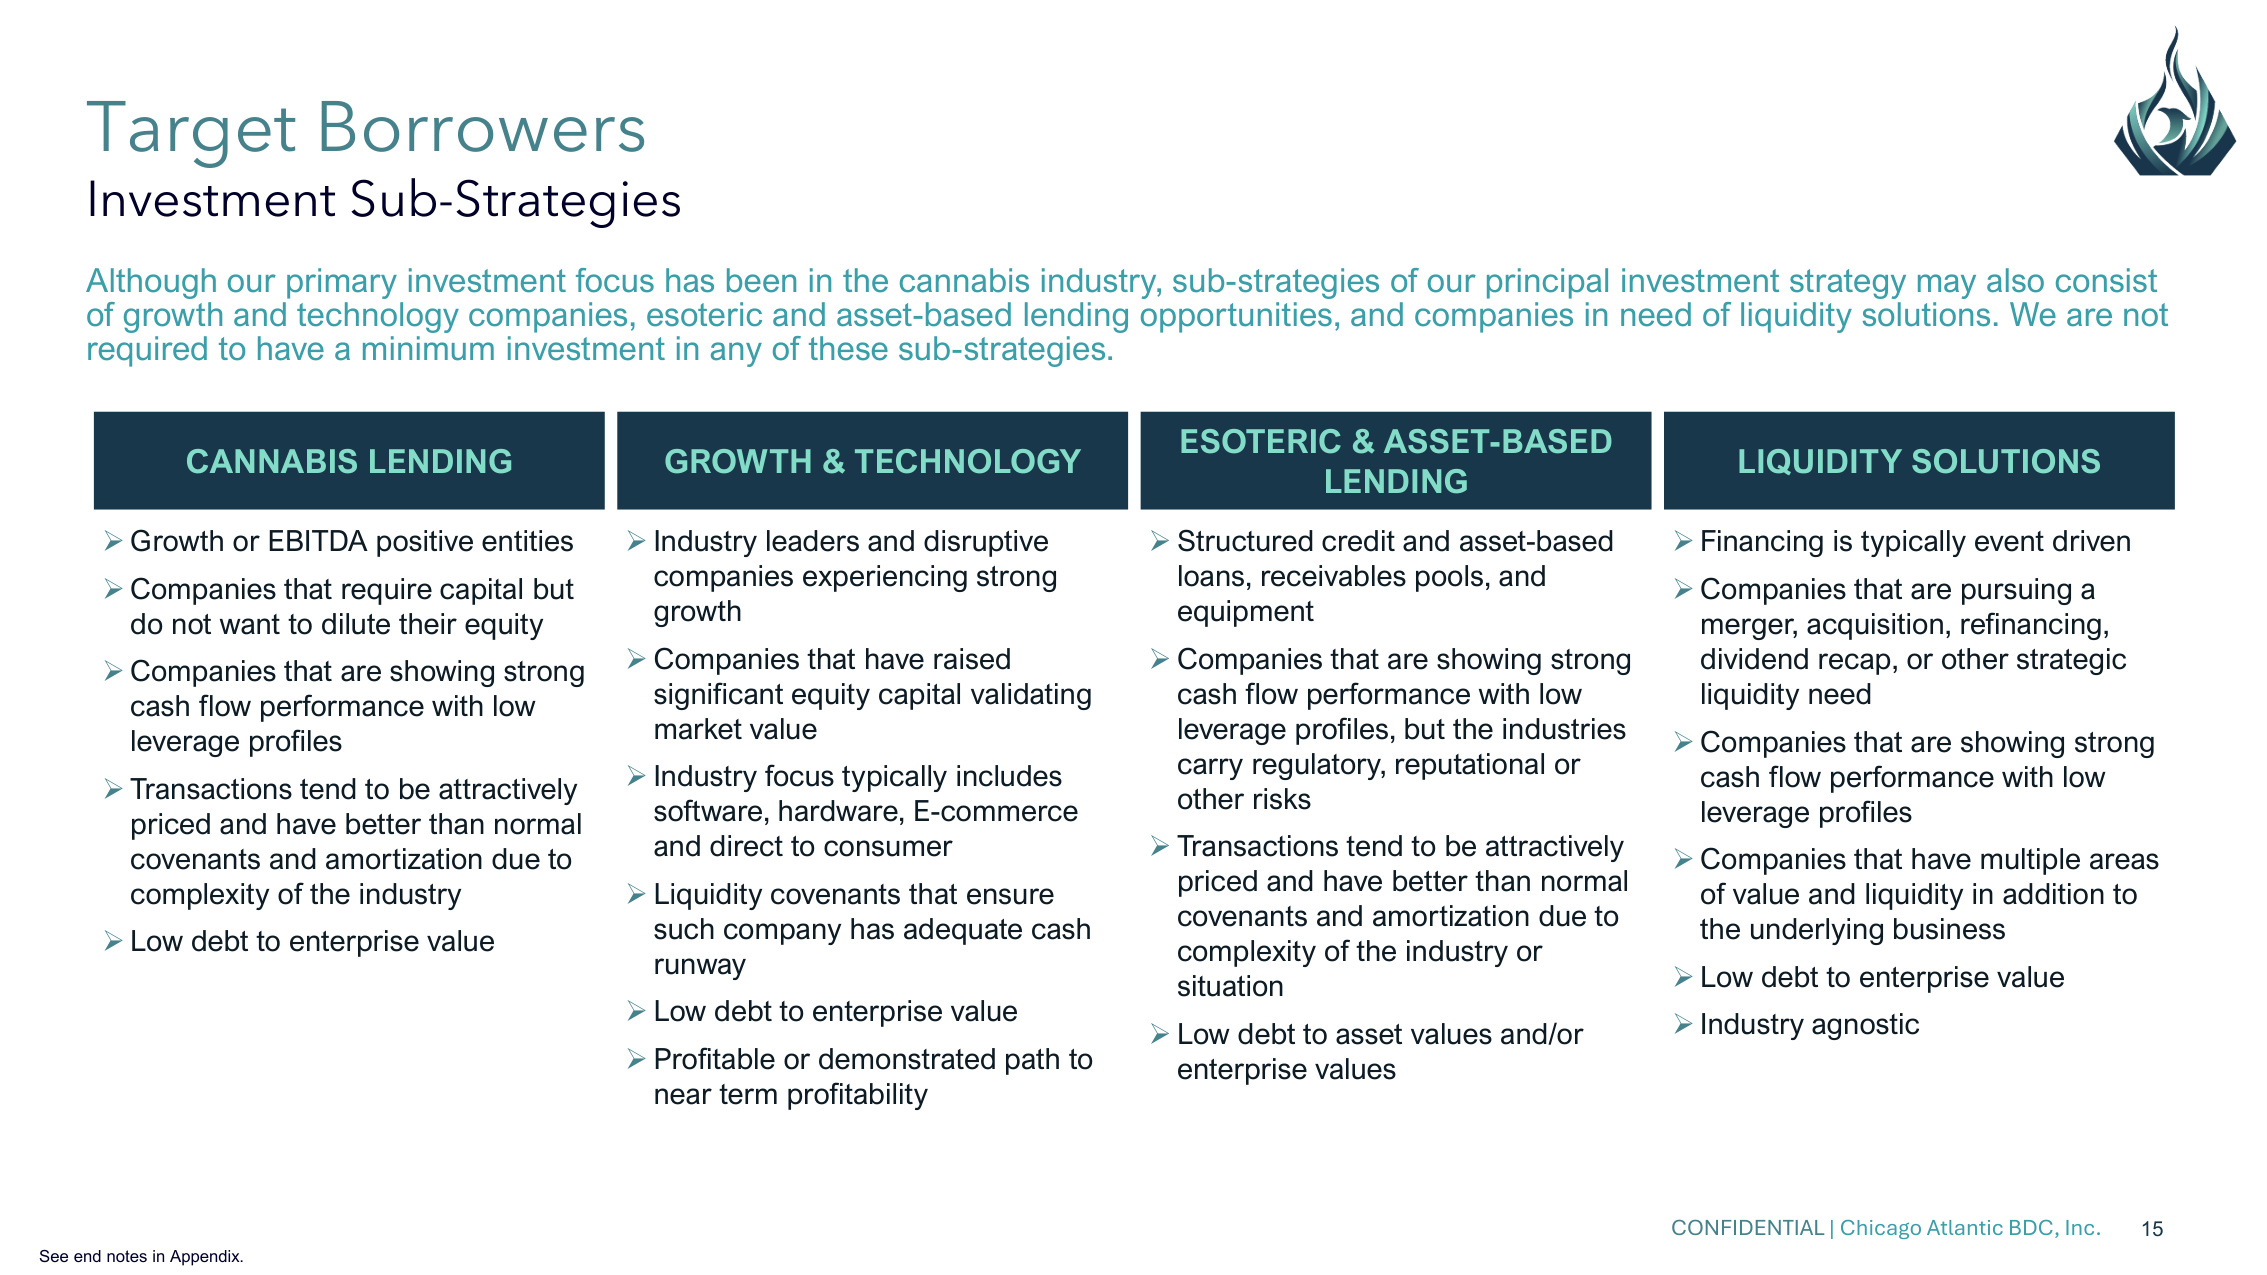
CONFIDENTIAL | Chicago Atlantic BDC, Inc. 15 Target Borrowers Investment Sub-Strategies CANNABIS LENDING GROWTH & TECHNOLOGY ESOTERIC & ASSET-BASED LENDING LIQUIDITY SOLUTIONS Growth or EBITDA positive entities Companies that require capital but do not want to dilute their equity Companies that are showing strong cash flow performance with low leverage profiles Transactions tend to be attractively priced and have better than normal covenants and amortization due to complexity of the industry Low debt to enterprise value Industry leaders and disruptive companies experiencing strong growth Companies that have raised significant equity capital validating market value Industry focus typically includes software, hardware, E-commerce and direct to consumer Liquidity covenants that ensure such company has adequate cash runway Low debt to enterprise value Profitable or demonstrated path to near term profitability Structured credit and asset-based loans, receivables pools, and equipment Companies that are showing strong cash flow performance with low leverage profiles, but the industries carry regulatory, reputational or other risks Transactions tend to be attractively priced and have better than normal covenants and amortization due to complexity of the industry or situation Low debt to asset values and/or enterprise values Financing is typically event driven Companies that are pursuing a merger, acquisition, refinancing, dividend recap, or other strategic liquidity need Companies that are showing strong cash flow performance with low leverage profiles Companies that have multiple areas of value and liquidity in addition to the underlying business Low debt to enterprise value Industry agnostic Although our primary investment focus has been in the cannabis industry, sub-strategies of our principal investment strategy may also consist of growth and technology companies, esoteric and asset-based lending opportunities, and companies in need of liquidity solutions. We are not required to have a minimum investment in any of these sub-strategies. See end notes in Appendix.
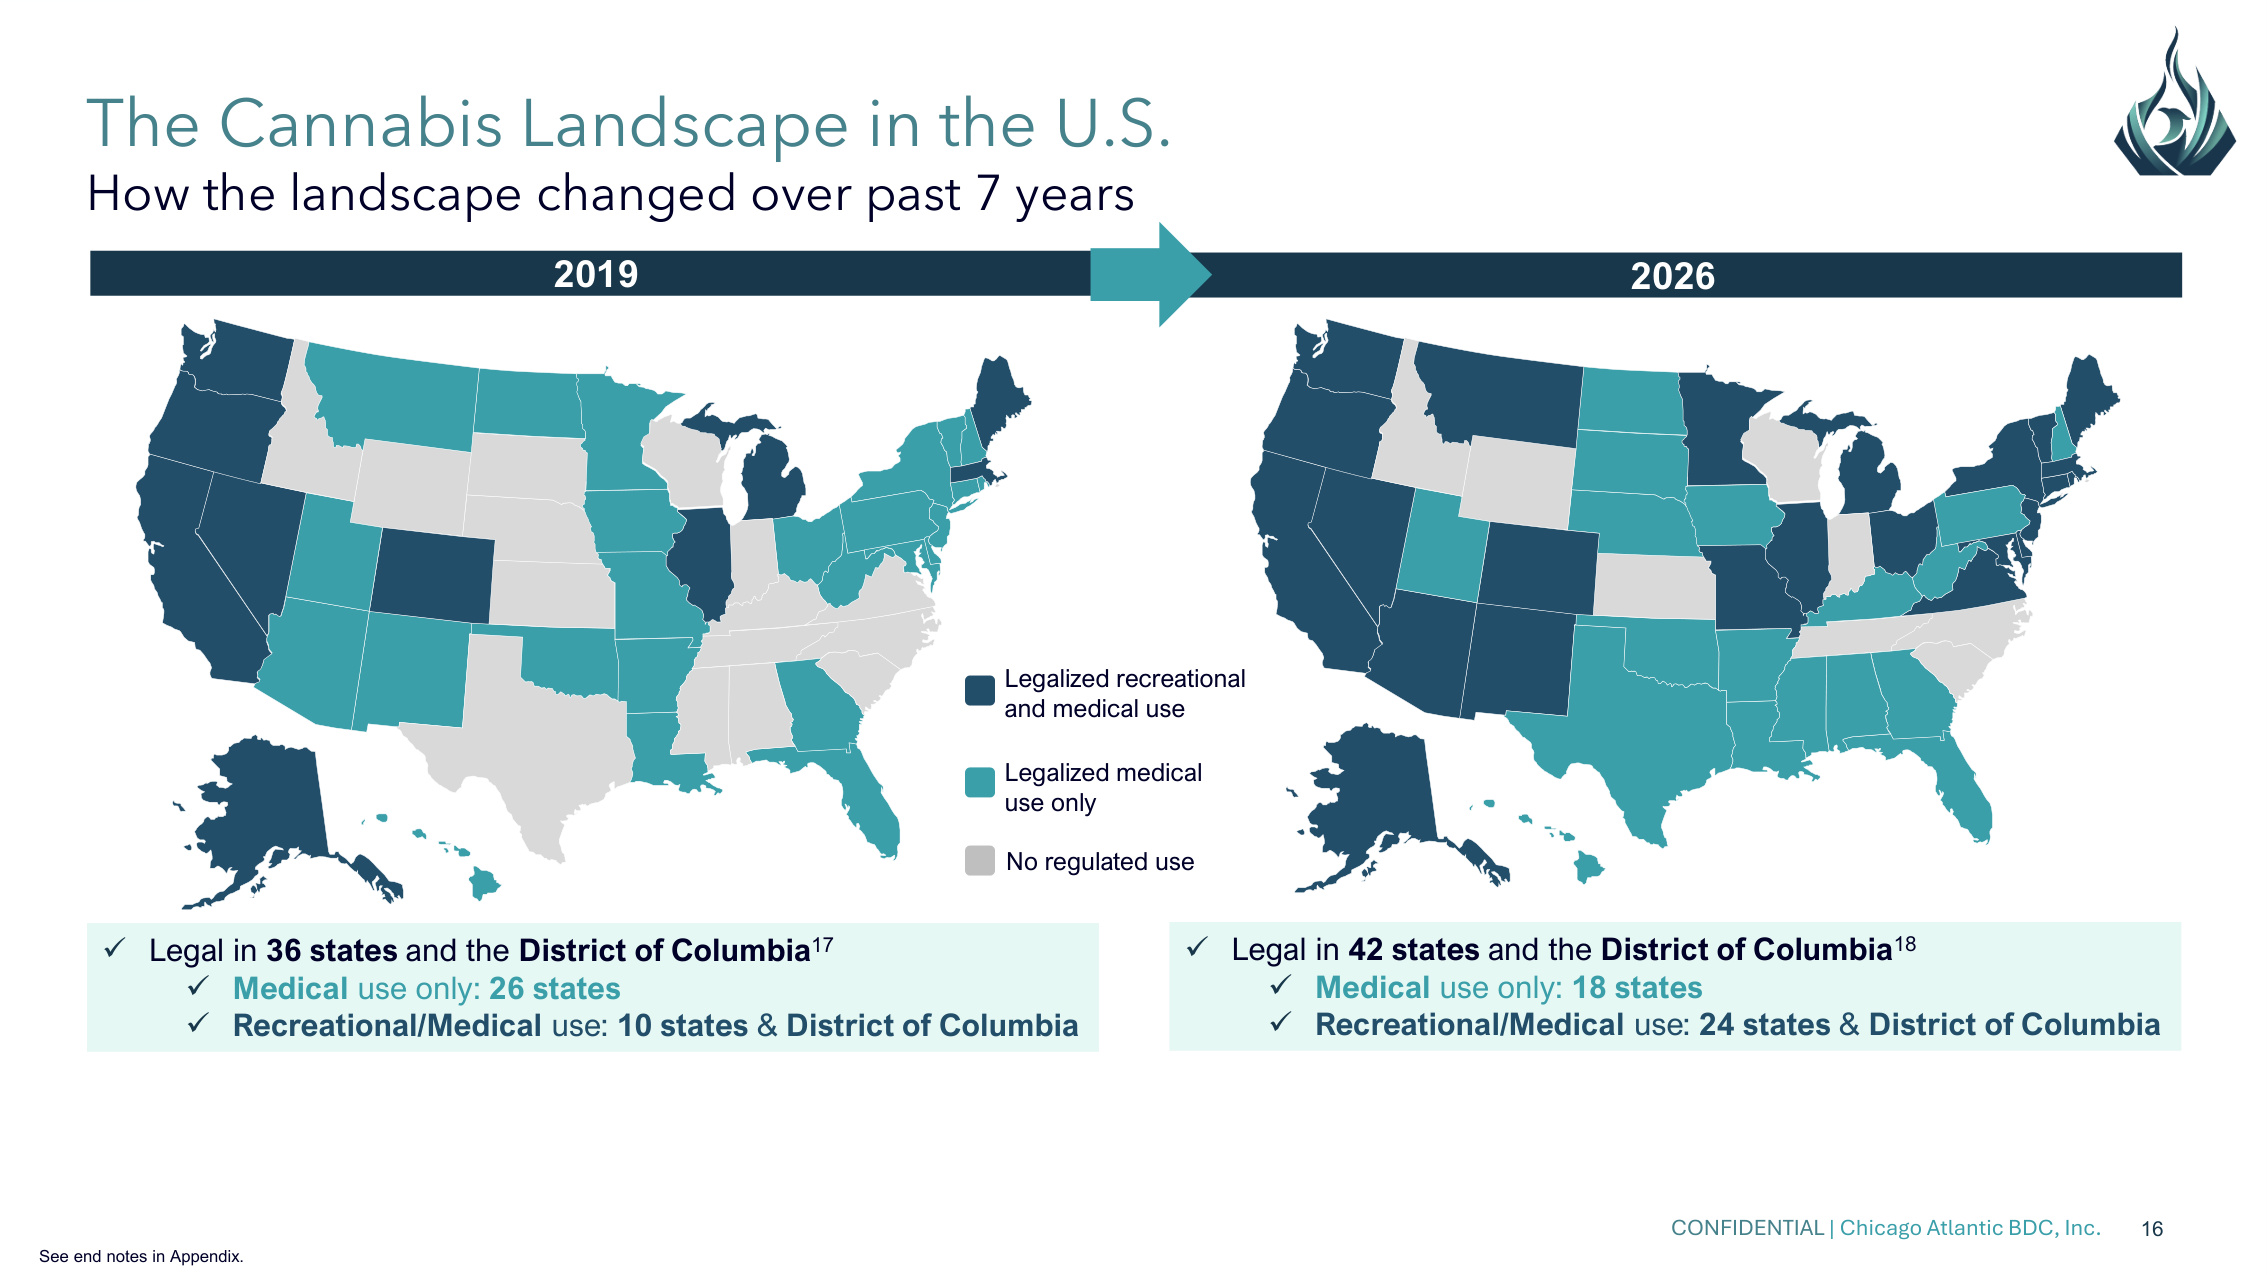
CONFIDENTIAL | Chicago Atlantic BDC, Inc. 16 The Cannabis Landscape in the U.S. How the landscape changed over past 7 years 2019 2026 Legal in 42 states and the District of Columbia18 Medical use only: 18 states Recreational/Medical use: 24 states & District of Columbia Legal in 36 states and the District of Columbia17 Medical use only: 26 states Recreational/Medical use: 10 states & District of Columbia No regulated use Legalized recreational and medical use Legalized medical use only See end notes in Appendix.
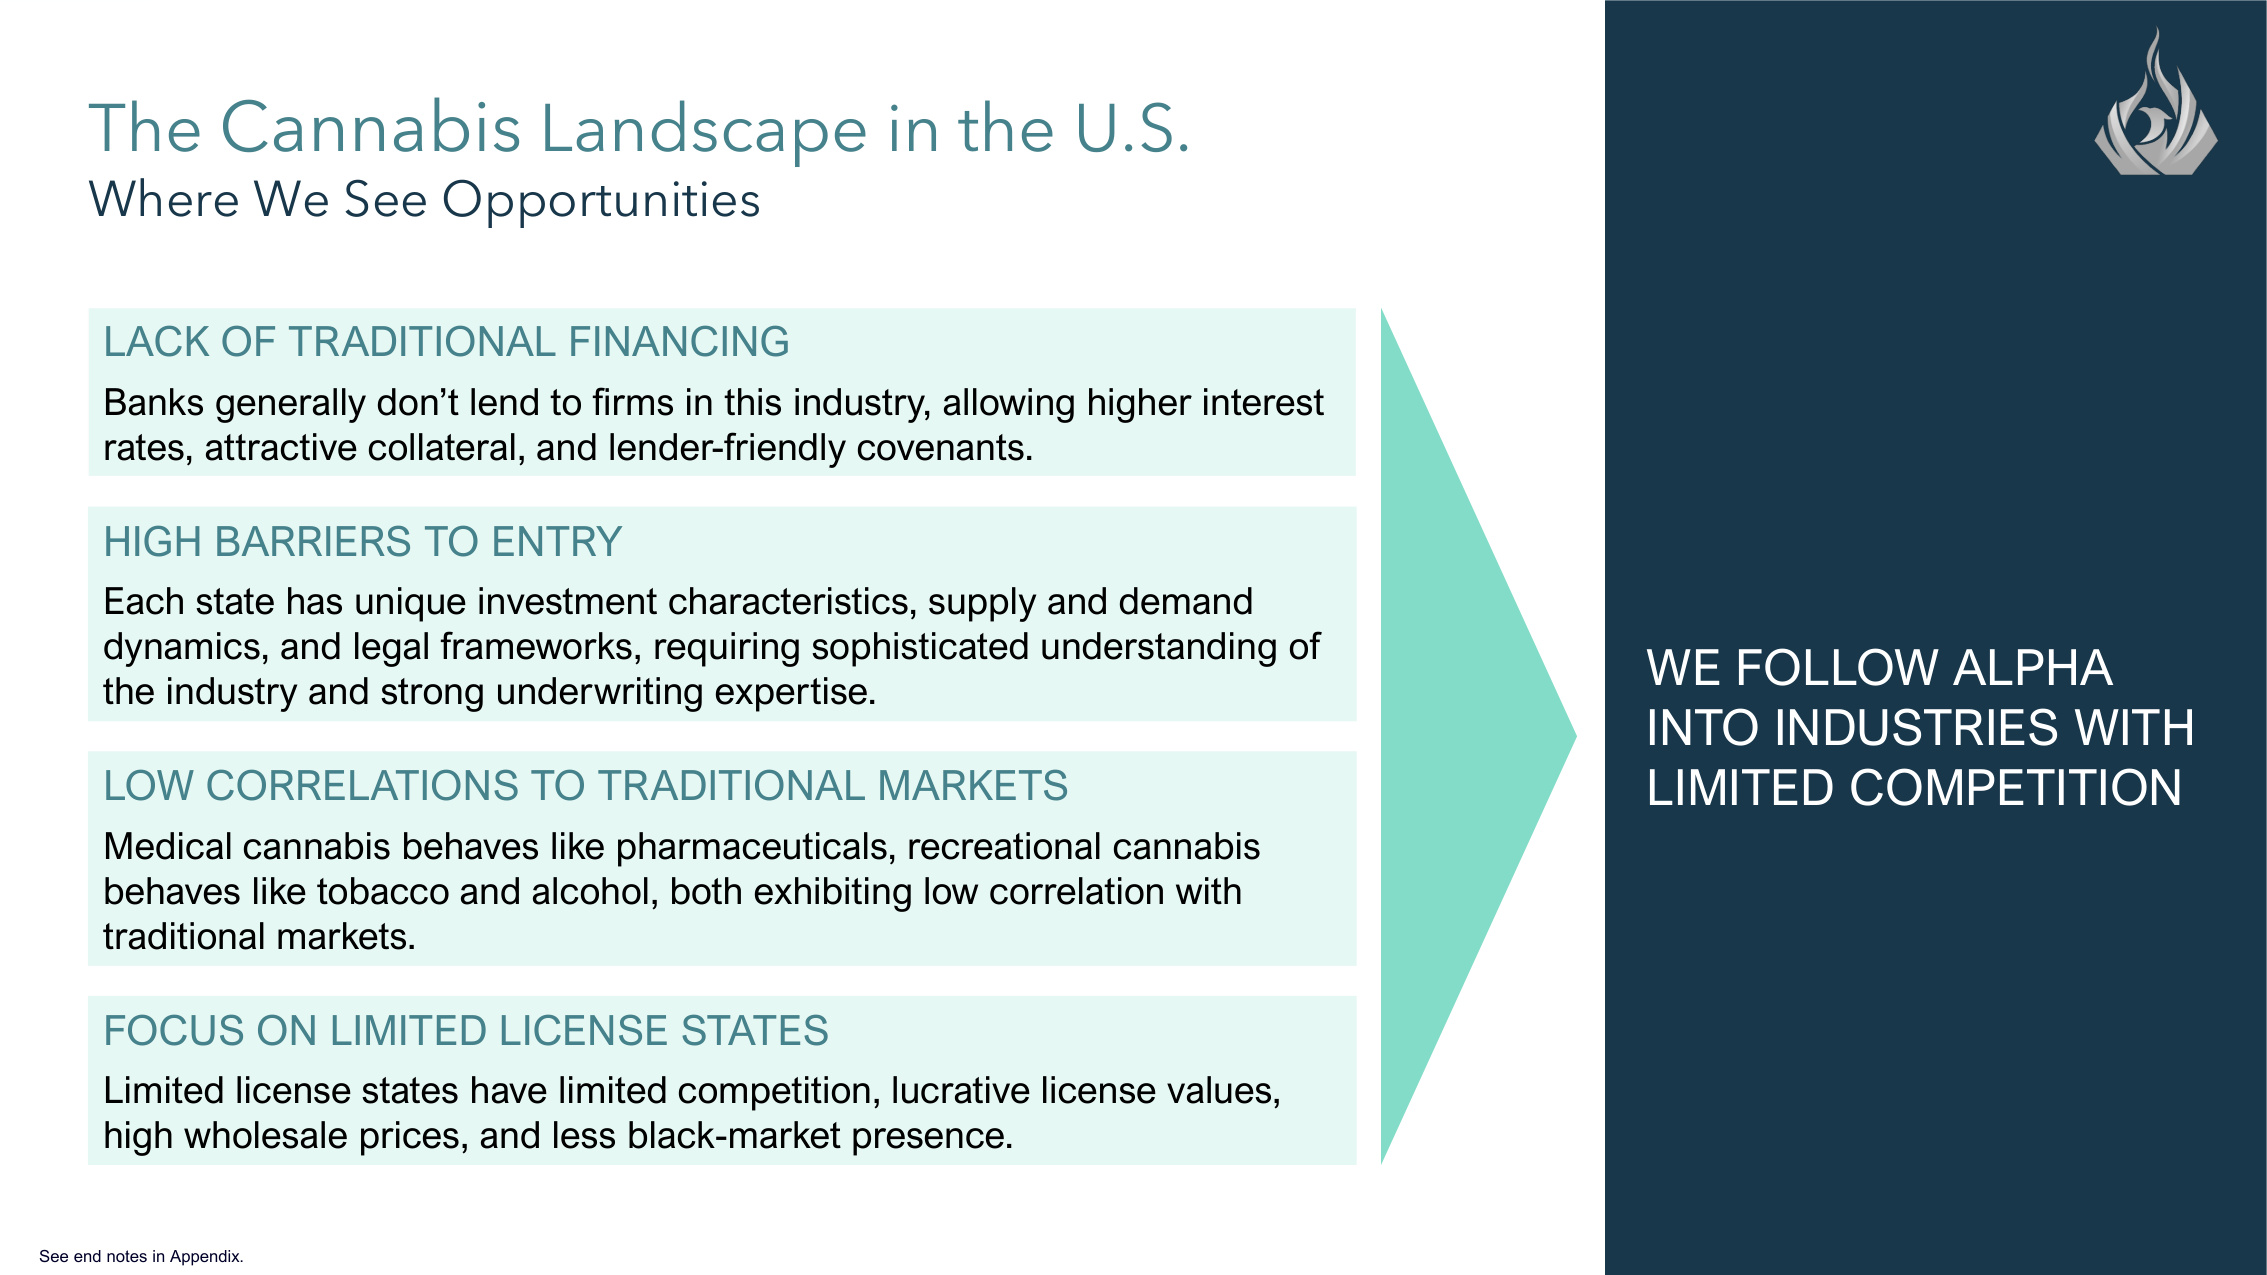
CONFIDENTIAL | Chicago Atlantic BDC, Inc. 17 The Cannabis Landscape in the U.S. Where We See Opportunities WE FOLLOW ALPHA INTO INDUSTRIES WITH LIMITED COMPETITION LACK OF TRADITIONAL FINANCING Banks generally don't lend to firms in this industry, allowing higher interest rates, attractive collateral, and lender-friendly covenants. LOW CORRELATIONS TO TRADITIONAL MARKETS Medical cannabis behaves like pharmaceuticals, recreational cannabis behaves like tobacco and alcohol, both exhibiting low correlation with traditional markets. HIGH BARRIERS TO ENTRY Each state has unique investment characteristics, supply and demand dynamics, and legal frameworks, requiring sophisticated understanding of the industry and strong underwriting expertise. FOCUS ON LIMITED LICENSE STATES Limited license states have limited competition, lucrative license values, high wholesale prices, and less black-market presence. See end notes in Appendix.
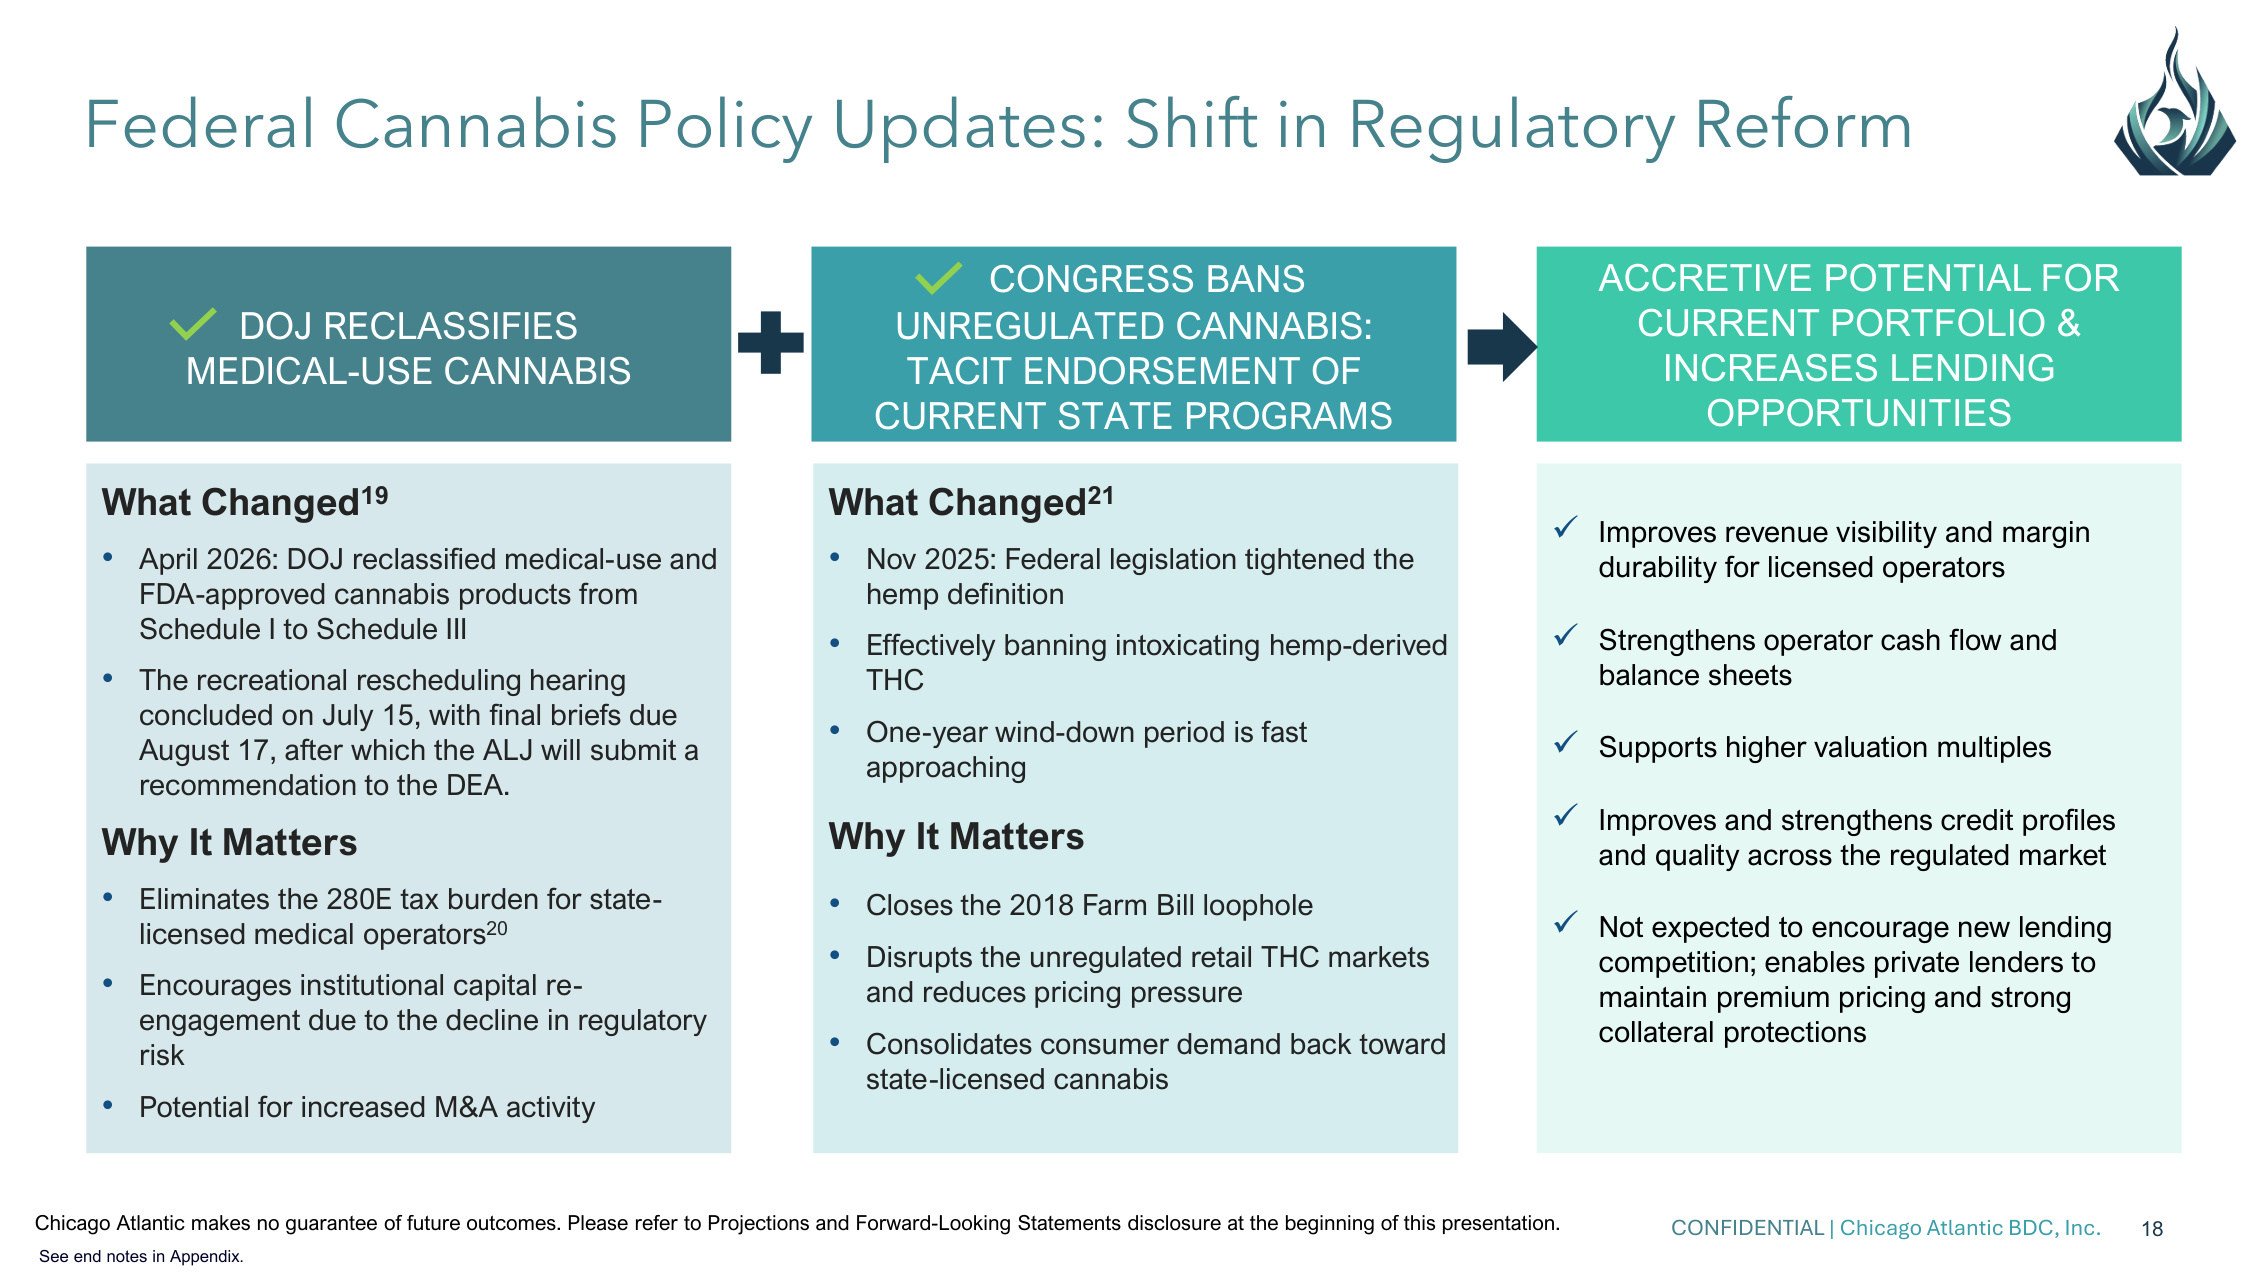
CONFIDENTIAL | Chicago Atlantic BDC, Inc. 18 Federal Cannabis Policy Updates: Shift in Regulatory Reform Chicago Atlantic makes no guarantee of future outcomes. Please refer to Projections and Forward-Looking Statements disclosure at the beginning of this presentation. DOJ RECLASSIFIES MEDICAL-USE CANNABIS CONGRESS BANS UNREGULATED CANNABIS: TACIT ENDORSEMENT OF CURRENT STATE PROGRAMS What Changed19 • April 2026: DOJ reclassified medical-use and FDA-approved cannabis products from Schedule I to Schedule III • The recreational rescheduling hearing concluded on July 15, with final briefs due August 17, after which the ALJ will submit a recommendation to the DEA. Why It Matters • Eliminates the 280E tax burden for state- licensed medical operators20 • Encourages institutional capital re- engagement due to the decline in regulatory risk • Potential for increased M&A activity What Changed21 • Nov 2025: Federal legislation tightened the hemp definition • Effectively banning intoxicating hemp-derived THC • One-year wind-down period is fast approaching Why It Matters • Closes the 2018 Farm Bill loophole • Disrupts the unregulated retail THC markets and reduces pricing pressure • Consolidates consumer demand back toward state-licensed cannabis ACCRETIVE POTENTIAL FOR CURRENT PORTFOLIO & INCREASES LENDING OPPORTUNITIES Improves revenue visibility and margin durability for licensed operators Strengthens operator cash flow and balance sheets Supports higher valuation multiples Improves and strengthens credit profiles and quality across the regulated market Not expected to encourage new lending competition; enables private lenders to maintain premium pricing and strong collateral protections See end notes in Appendix.
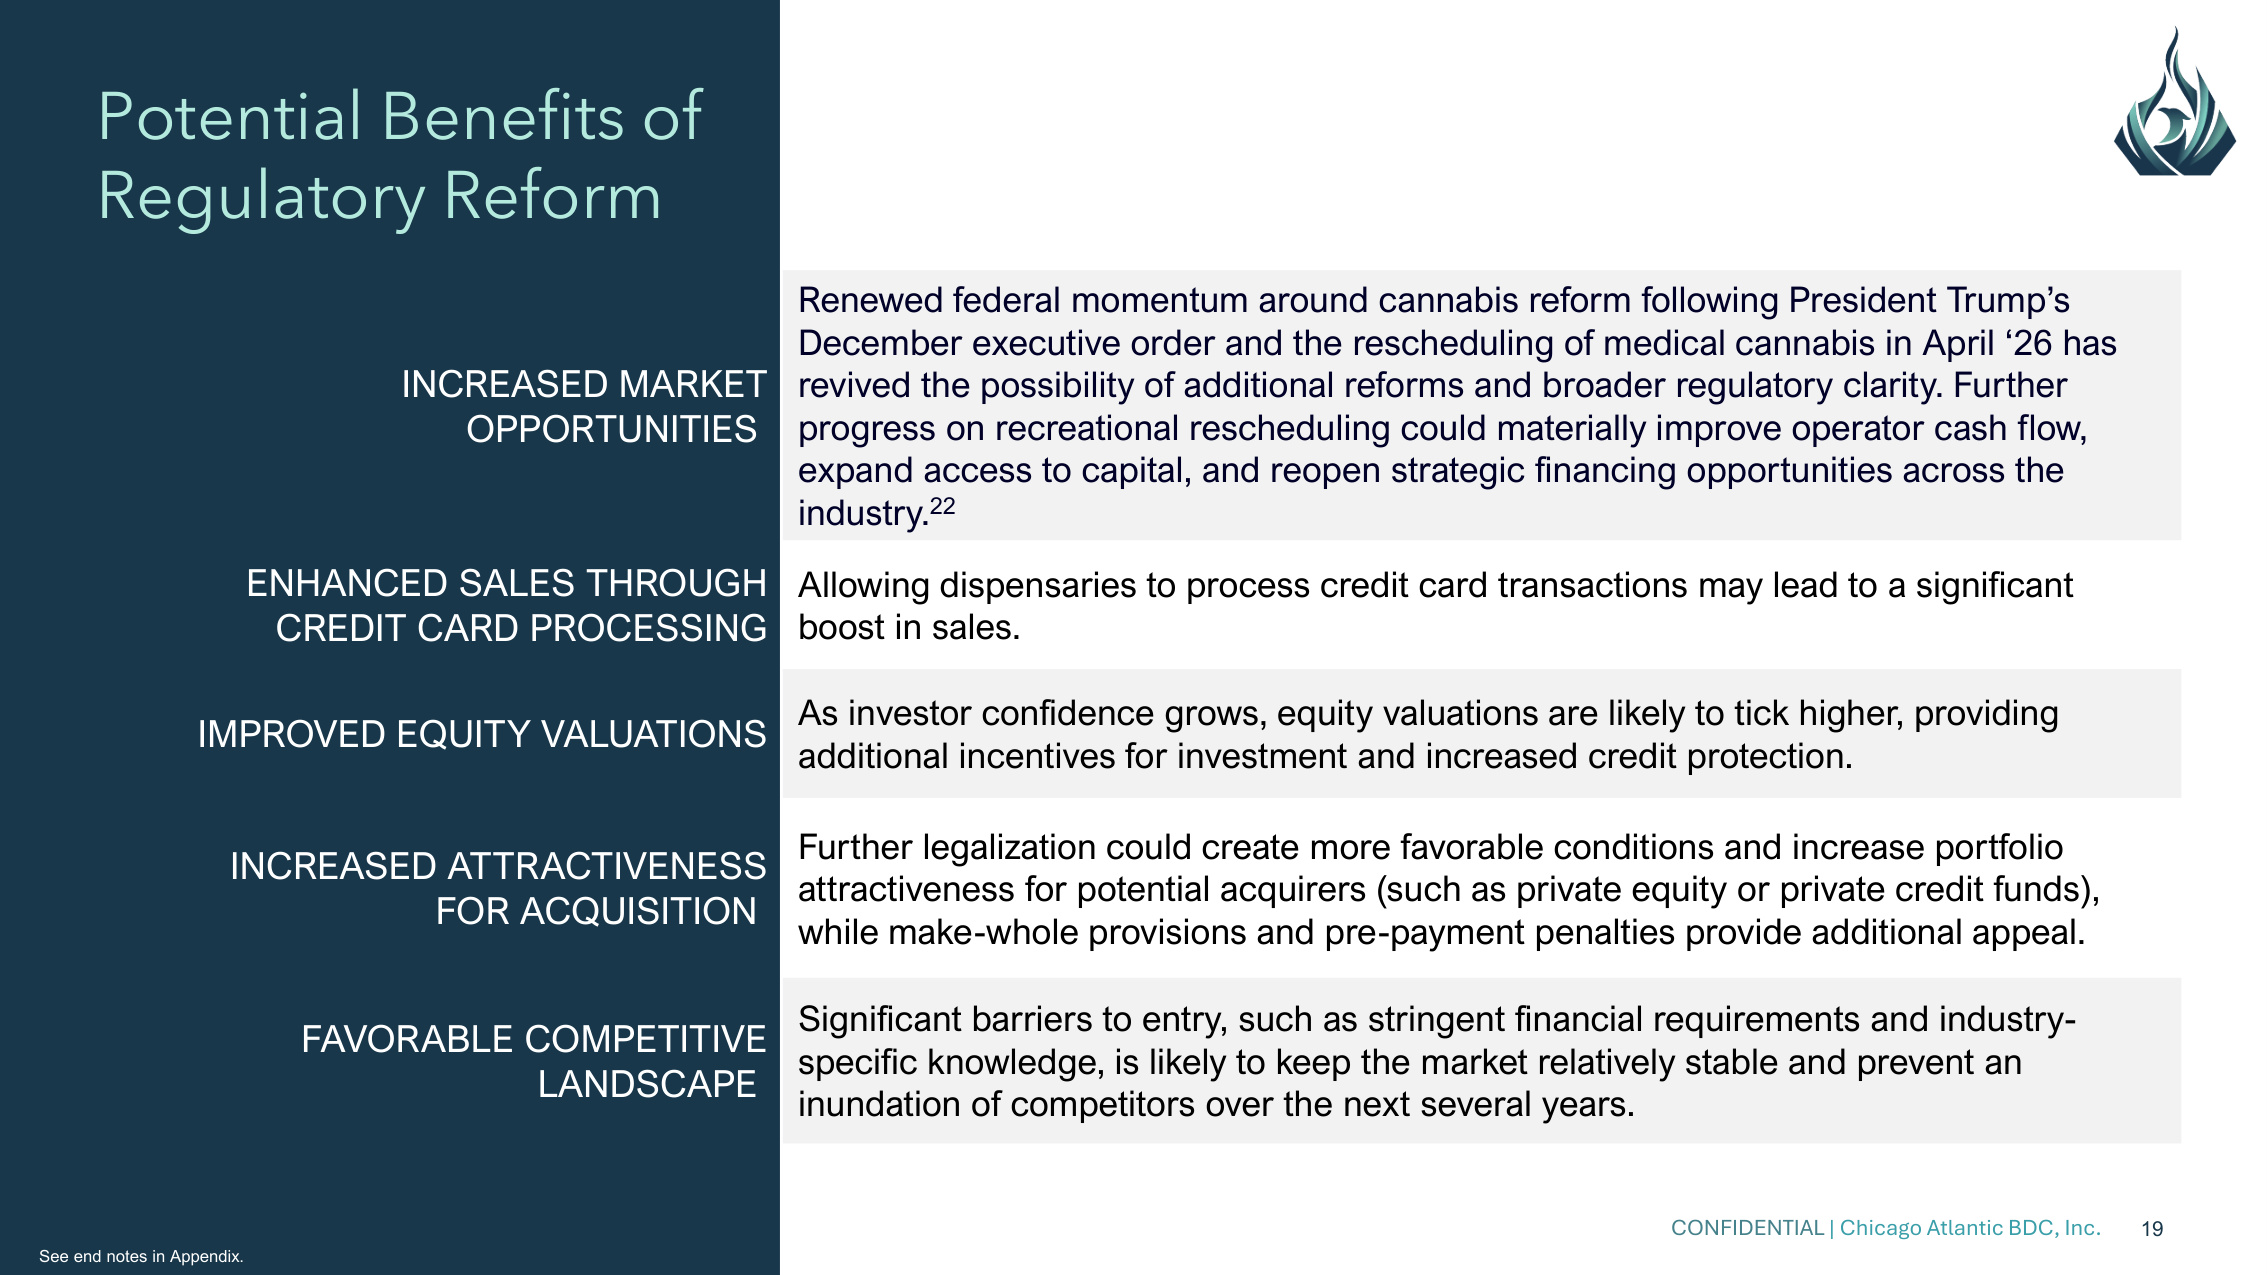
CONFIDENTIAL | Chicago Atlantic BDC, Inc. 19 Potential Benefits of Regulatory Reform INCREASED MARKET OPPORTUNITIES Renewed federal momentum around cannabis reform following President Trump's December executive order and the rescheduling of medical cannabis in April '26 has revived the possibility of additional reforms and broader regulatory clarity. Further progress on recreational rescheduling could materially improve operator cash flow, expand access to capital, and reopen strategic financing opportunities across the industry.22 ENHANCED SALES THROUGH CREDIT CARD PROCESSING Allowing dispensaries to process credit card transactions may lead to a significant boost in sales. IMPROVED EQUITY VALUATIONS As investor confidence grows, equity valuations are likely to tick higher, providing additional incentives for investment and increased credit protection. INCREASED ATTRACTIVENESS FOR ACQUISITION Further legalization could create more favorable conditions and increase portfolio attractiveness for potential acquirers (such as private equity or private credit funds), while make-whole provisions and pre-payment penalties provide additional appeal. FAVORABLE COMPETITIVE LANDSCAPE Significant barriers to entry, such as stringent financial requirements and industry- specific knowledge, is likely to keep the market relatively stable and prevent an inundation of competitors over the next several years. See end notes in Appendix.

Appendix:
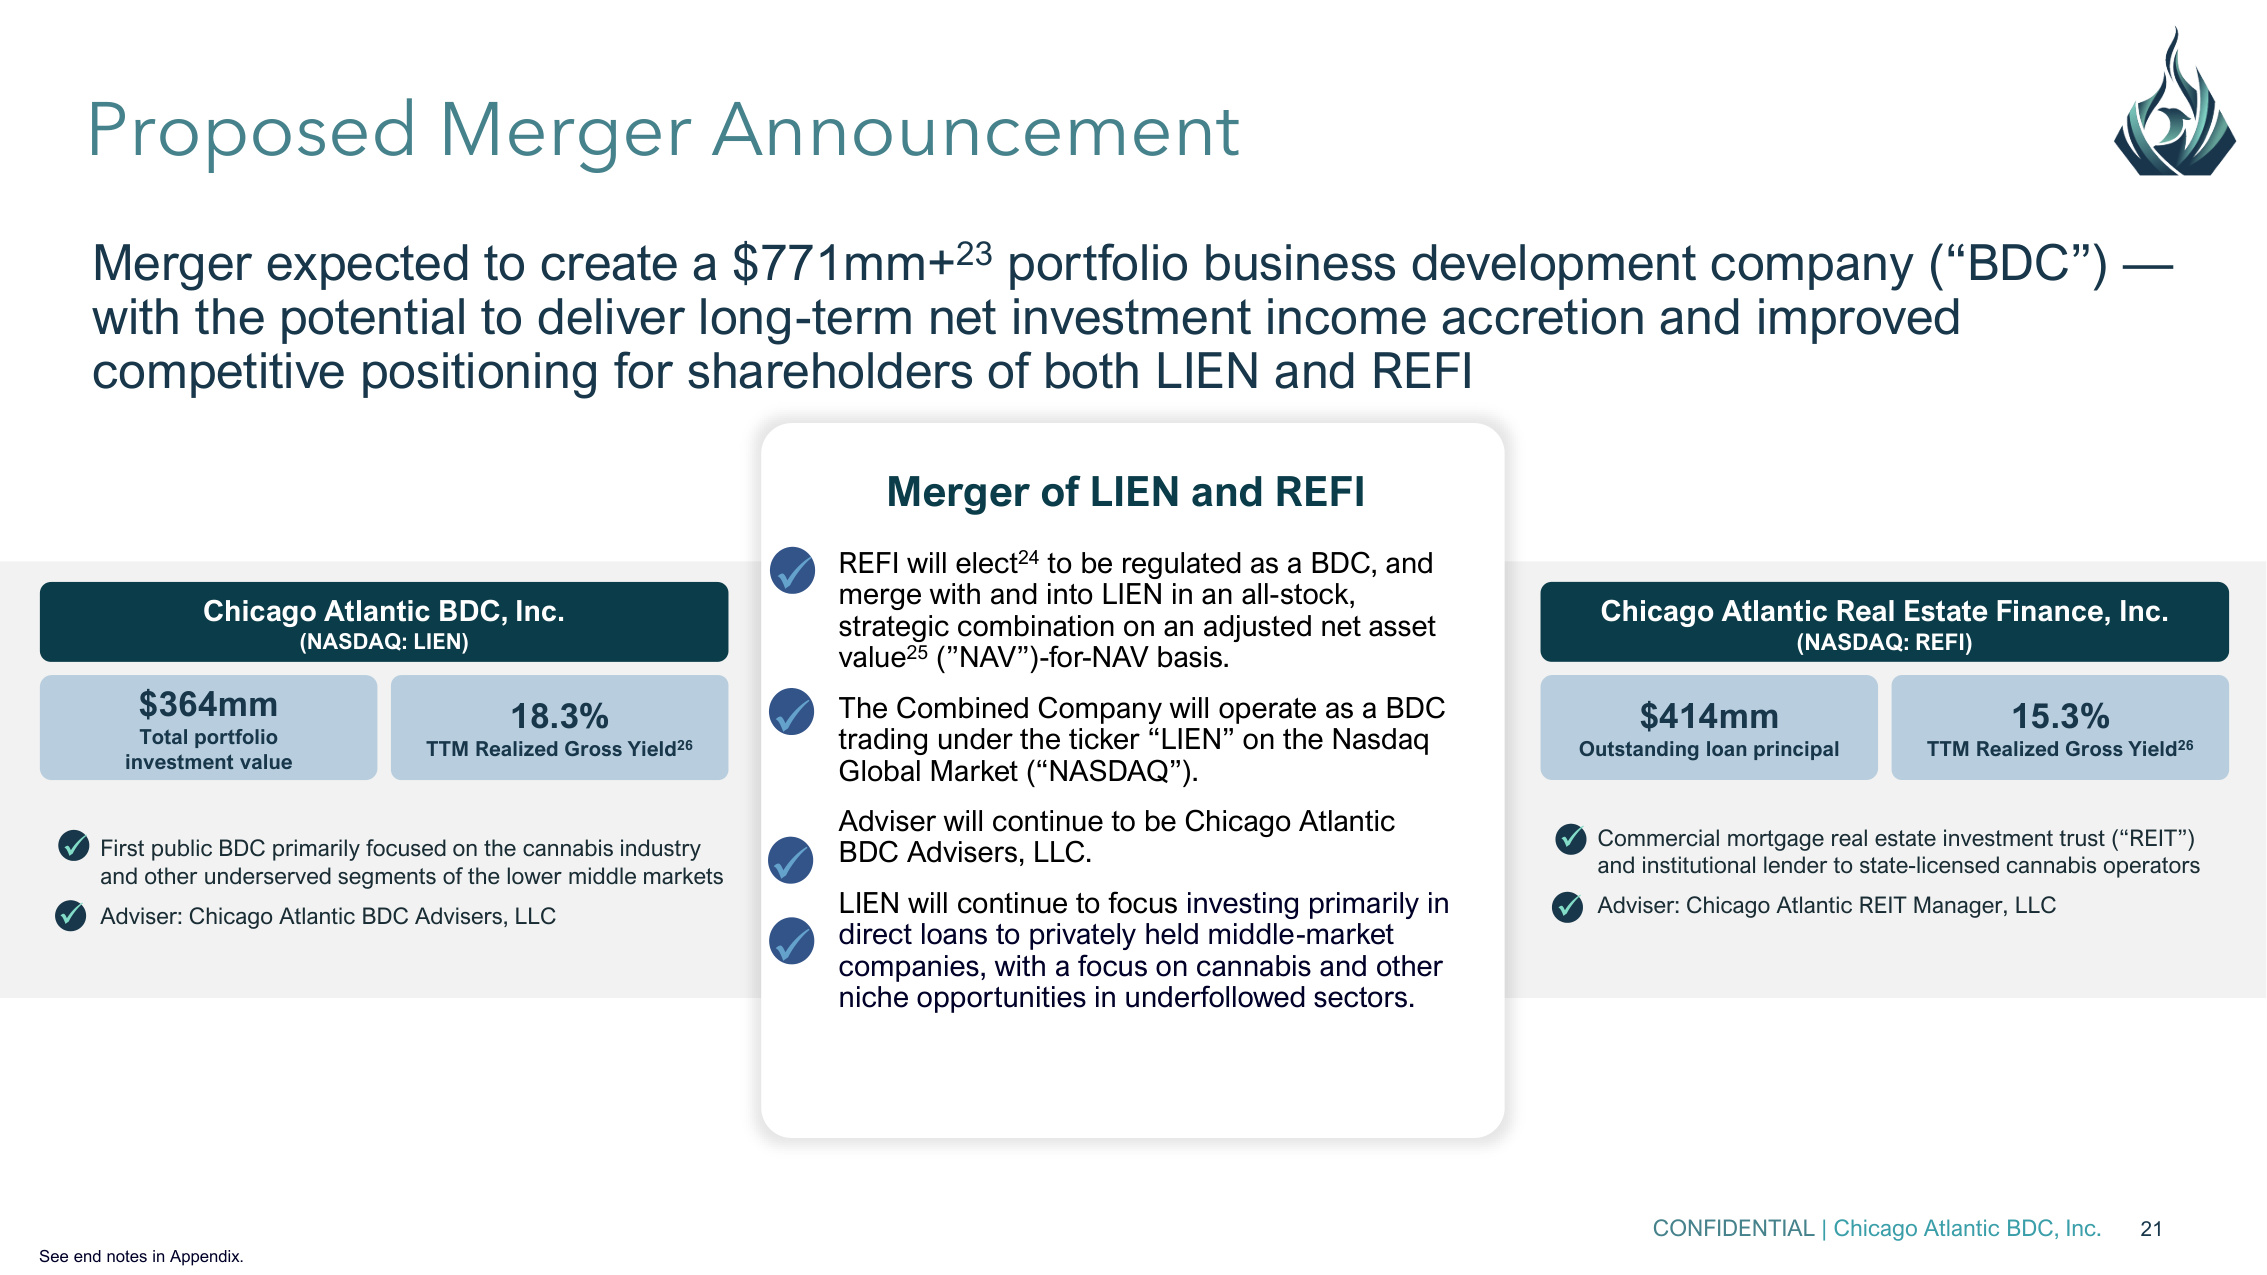
CONFIDENTIAL | Chicago Atlantic BDC, Inc. 21 Merger expected to create a $771mm+23 portfolio business development company ("BDC") — with the potential to deliver long-term net investment income accretion and improved competitive positioning for shareholders of both LIEN and REFI Proposed Merger Announcement Commercial mortgage real estate investment trust ("REIT") and institutional lender to state-licensed cannabis operators Adviser: Chicago Atlantic REIT Manager, LLC Chicago Atlantic Real Estate Finance, Inc. (NASDAQ: REFI) $414mm Outstanding loan principal 15.3% TTM Realized Gross Yield26 First public BDC primarily focused on the cannabis industry and other underserved segments of the lower middle markets Adviser: Chicago Atlantic BDC Advisers, LLC Chicago Atlantic BDC, Inc. (NASDAQ: LIEN) $364mm Total portfolio investment value 18.3% TTM Realized Gross Yield26 a REFI will elect24 to be regulated as a BDC, and merge with and into LIEN in an all-stock, strategic combination on an adjusted net asset value25 ("NAV")-for-NAV basis. The Combined Company will operate as a BDC trading under the ticker "LIEN" on the Nasdaq Global Market ("NASDAQ"). Adviser will continue to be Chicago Atlantic BDC Advisers, LLC. LIEN will continue to focus investing primarily in direct loans to privately held middle-market companies, with a focus on cannabis and other niche opportunities in underfollowed sectors. Merger of LIEN and REFI See end notes in Appendix.
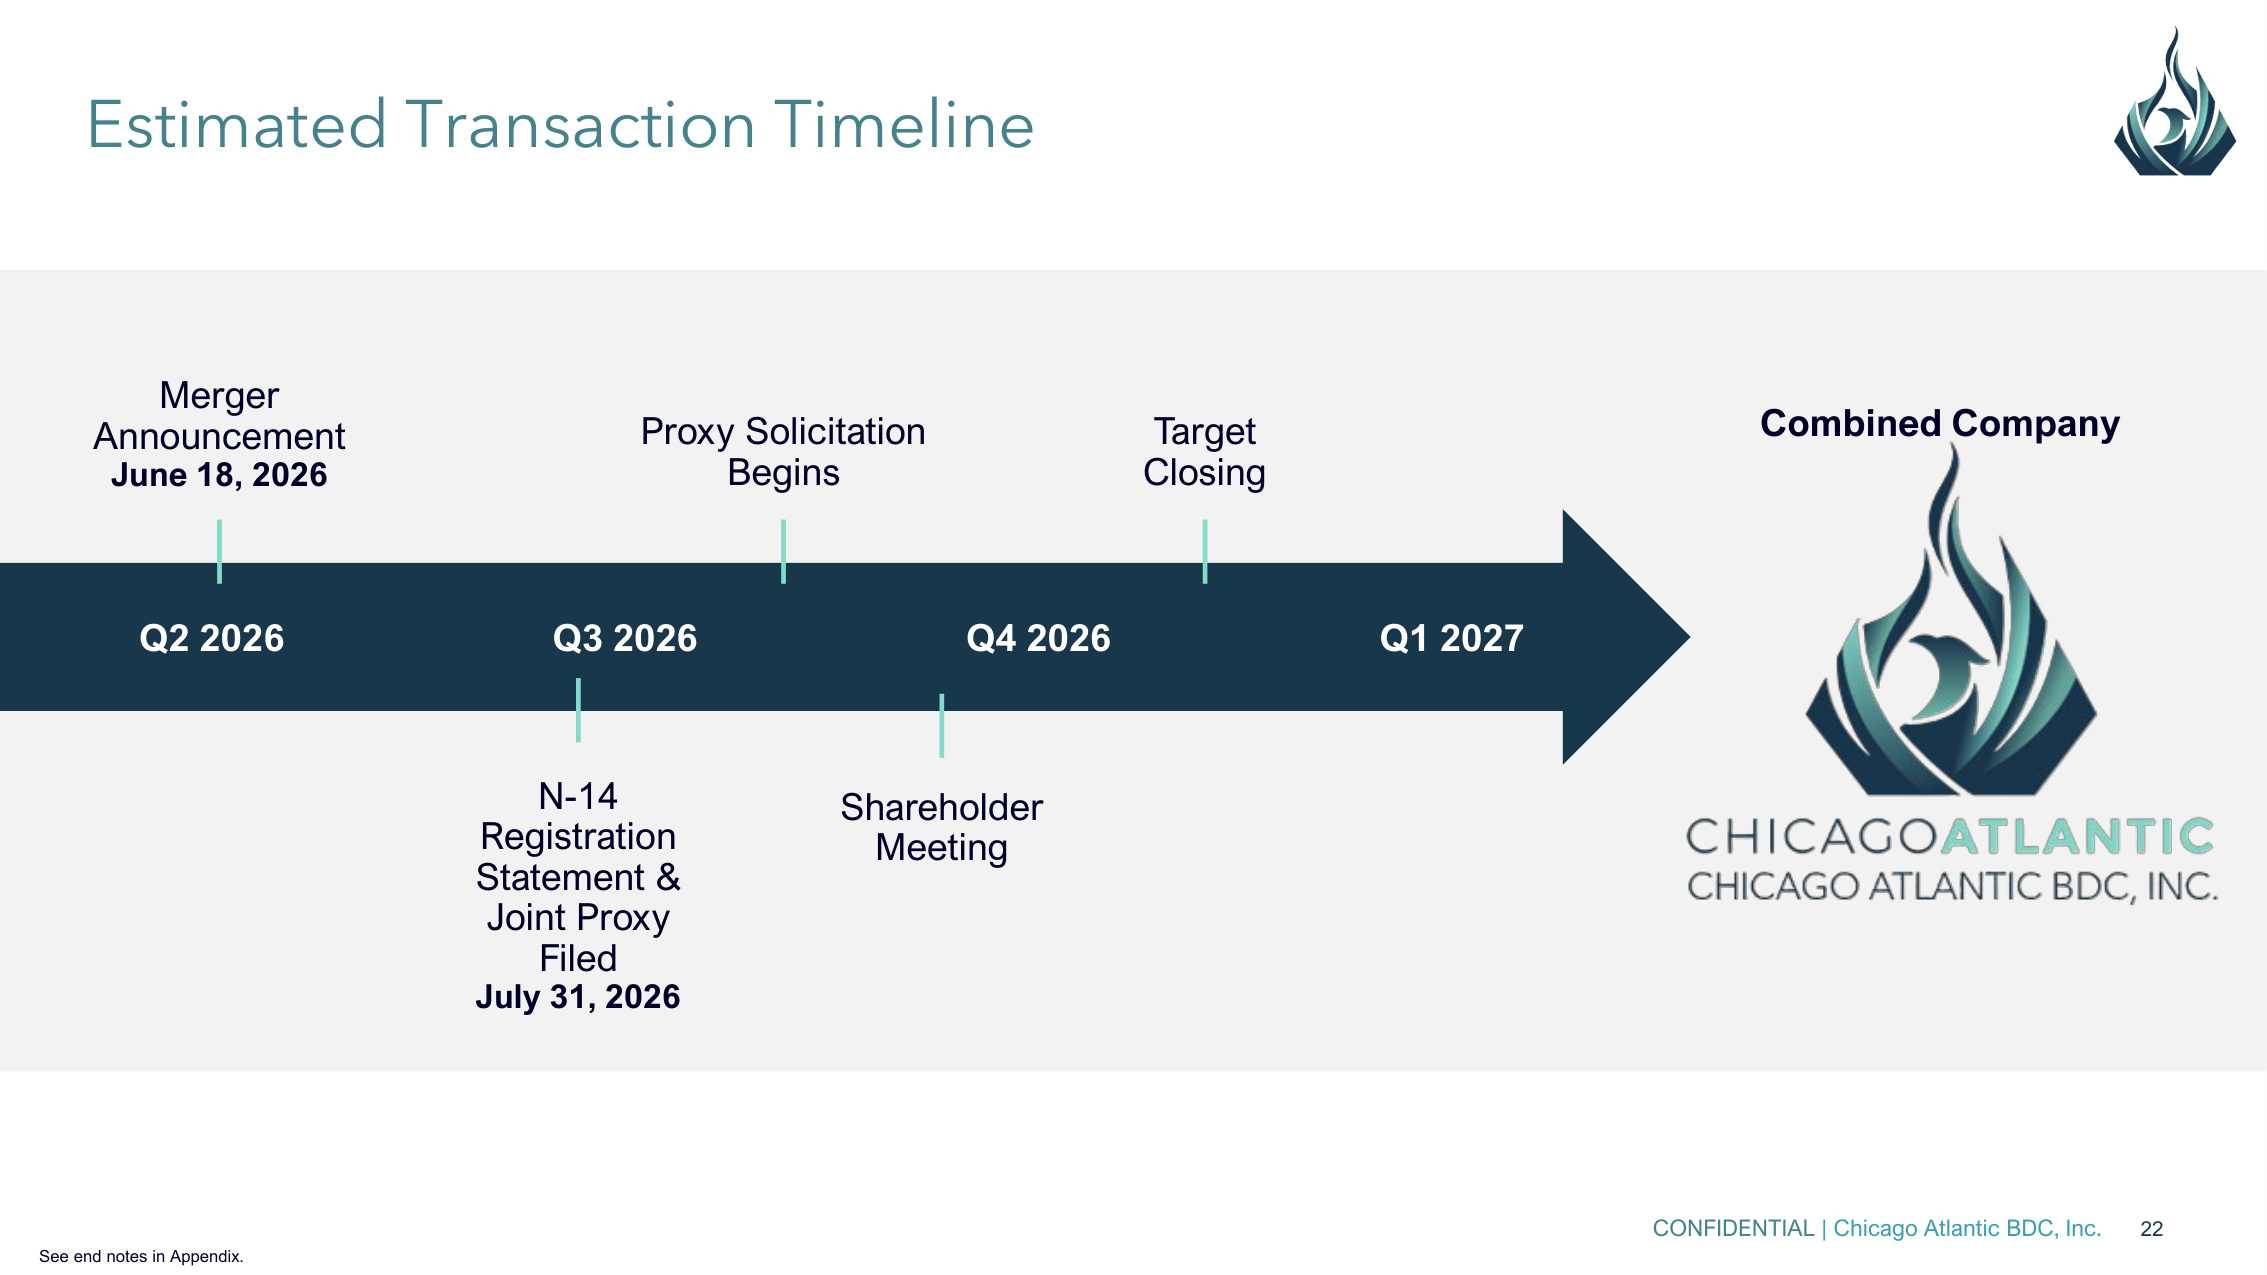
CONFIDENTIAL | Chicago Atlantic BDC, Inc. 22 Q2 2026 Merger Announcement June 18, 2026 Q3 2026 Q4 2026 Target Closing Proxy Solicitation Begins Combined Company Q1 2027 Estimated Transaction Timeline N-14 Registration Statement & Joint Proxy Filed July 31, 2026 Shareholder Meeting See end notes in Appendix.
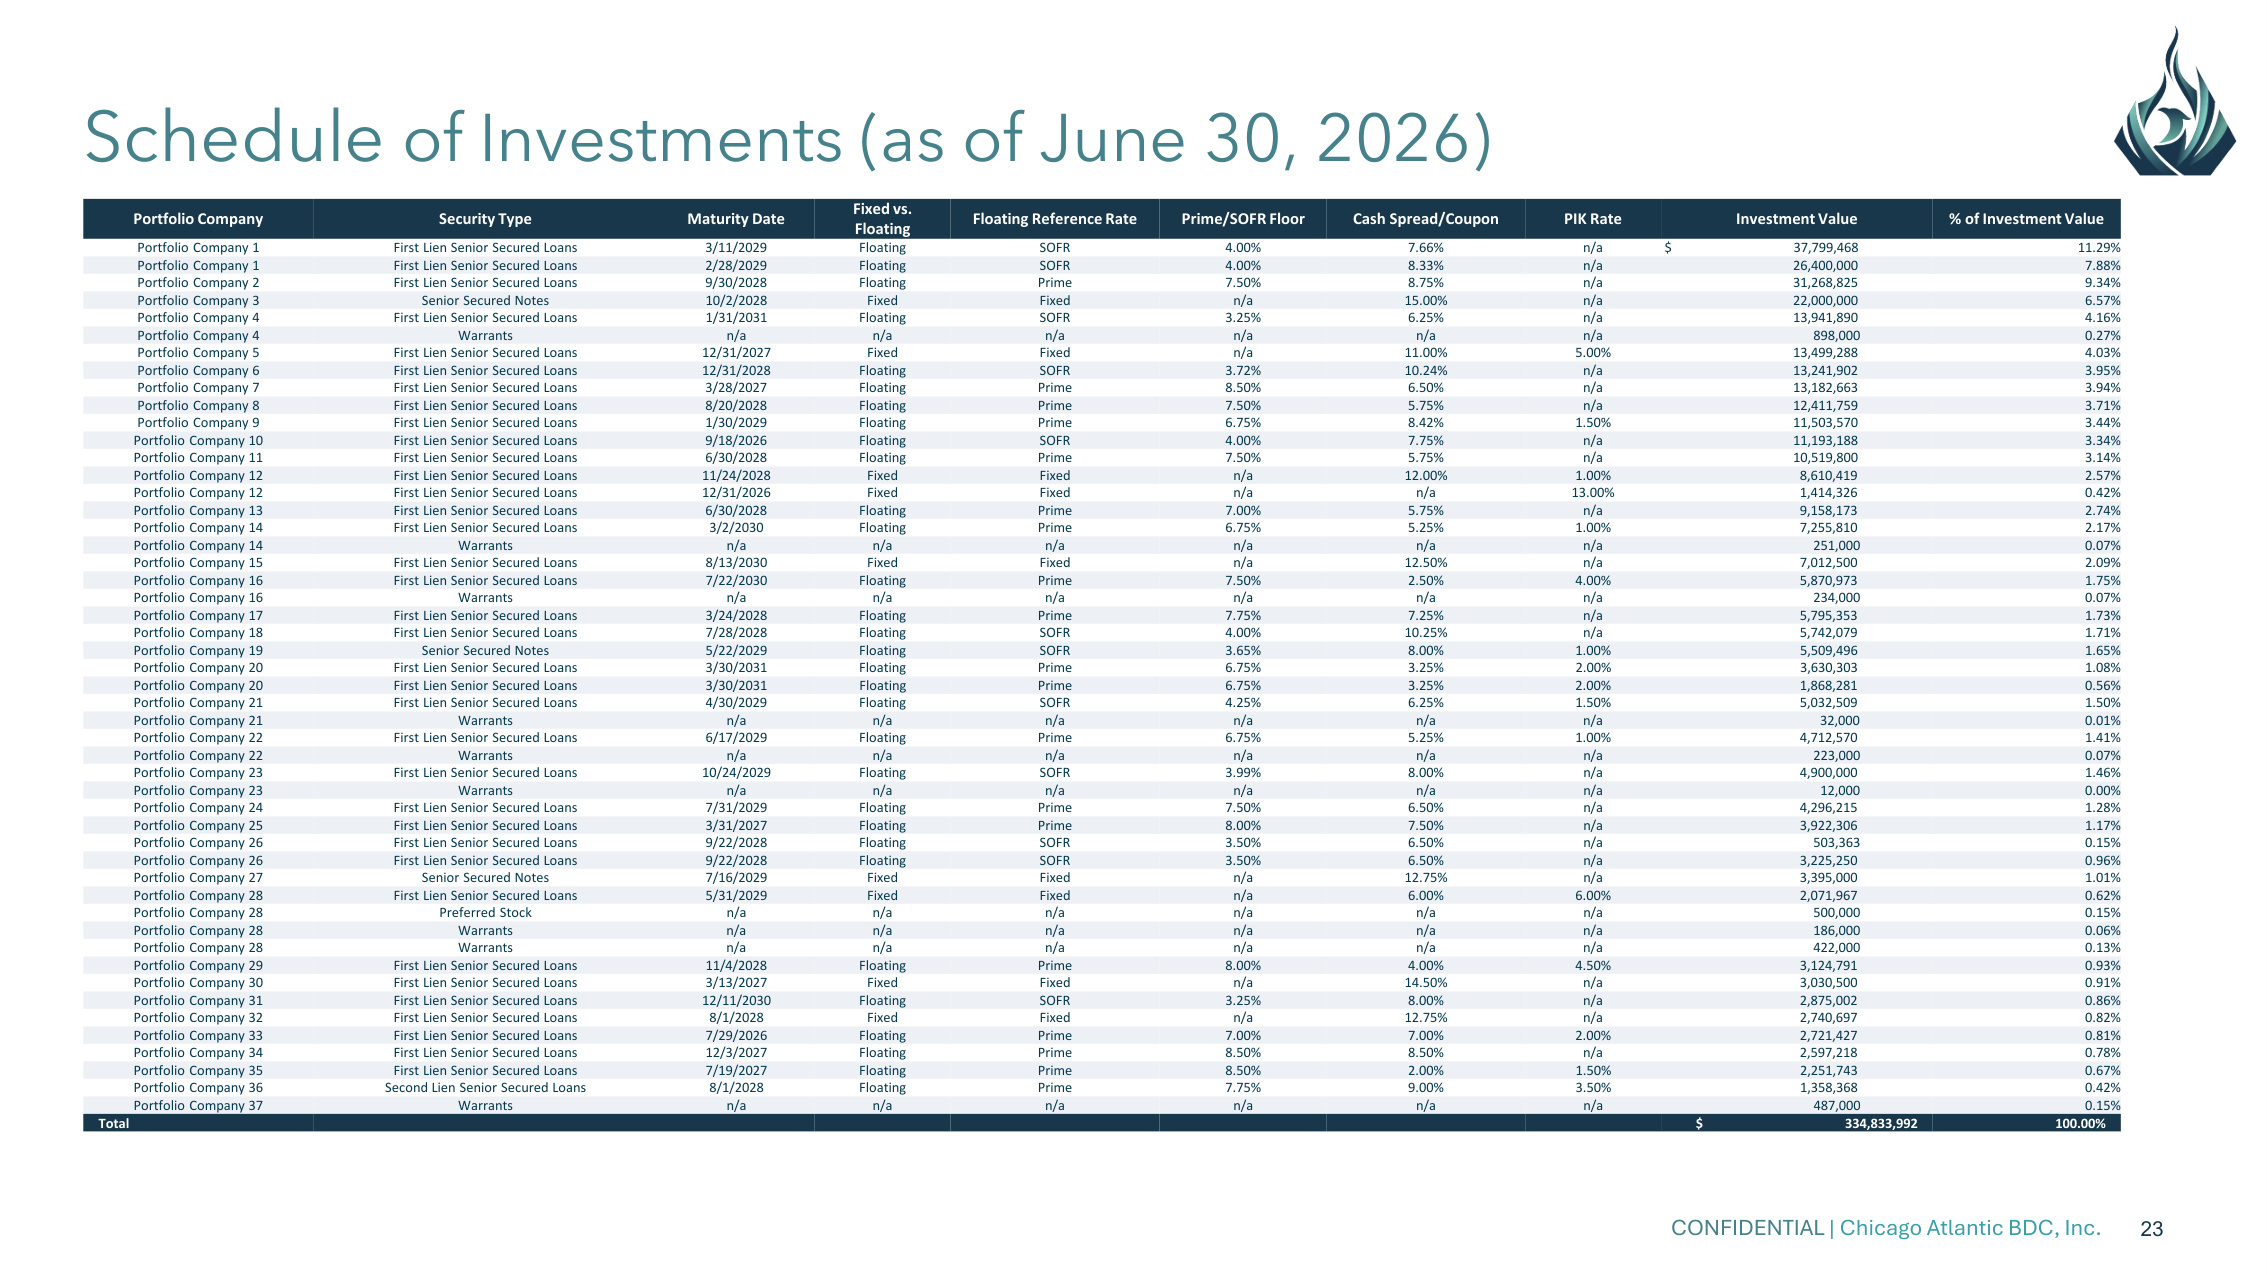
CONFIDENTIAL | Chicago Atlantic BDC, Inc. 23 Schedule of Investments (as of June 30, 2026) Portfolio Company Security Type Maturity Date Fixed vs. Floating Floating Reference Rate Prime/SOFR Floor Cash Spread/Coupon PIK Rate Investment Value % of Investment Value Portfolio Company 1 First Lien Senior Secured Loans 3/11/2029 Floating SOFR 4.00% 7.66% n/a $ 37,799,468 11.29% Portfolio Company 1 First Lien Senior Secured Loans 2/28/2029 Floating SOFR 4.00% 8.33% n/a 26,400,000 7.88% Portfolio Company 2 First Lien Senior Secured Loans 9/30/2028 Floating Prime 7.50% 8.75% n/a 31,268,825 9.34% Portfolio Company 3 Senior Secured Notes 10/2/2028 Fixed Fixed n/a 15.00% n/a 22,000,000 6.57% Portfolio Company 4 First Lien Senior Secured Loans 1/31/2031 Floating SOFR 3.25% 6.25% n/a 13,941,890 4.16% Portfolio Company 4 Warrants n/a n/a n/a n/a n/a n/a 898,000 0.27% Portfolio Company 5 First Lien Senior Secured Loans 12/31/2027 Fixed Fixed n/a 11.00% 5.00% 13,499,288 4.03% Portfolio Company 6 First Lien Senior Secured Loans 12/31/2028 Floating SOFR 3.72% 10.24% n/a 13,241,902 3.95% Portfolio Company 7 First Lien Senior Secured Loans 3/28/2027 Floating Prime 8.50% 6.50% n/a 13,182,663 3.94% Portfolio Company 8 First Lien Senior Secured Loans 8/20/2028 Floating Prime 7.50% 5.75% n/a 12,411,759 3.71% Portfolio Company 9 First Lien Senior Secured Loans 1/30/2029 Floating Prime 6.75% 8.42% 1.50% 11,503,570 3.44% Portfolio Company 10 First Lien Senior Secured Loans 9/18/2026 Floating SOFR 4.00% 7.75% n/a 11,193,188 3.34% Portfolio Company 11 First Lien Senior Secured Loans 6/30/2028 Floating Prime 7.50% 5.75% n/a 10,519,800 3.14% Portfolio Company 12 First Lien Senior Secured Loans 11/24/2028 Fixed Fixed n/a 12.00% 1.00% 8,610,419 2.57% Portfolio Company 12 First Lien Senior Secured Loans 12/31/2026 Fixed Fixed n/a n/a 13.00% 1,414,326 0.42% Portfolio Company 13 First Lien Senior Secured Loans 6/30/2028 Floating Prime 7.00% 5.75% n/a 9,158,173 2.74% Portfolio Company 14 First Lien Senior Secured Loans 3/2/2030 Floating Prime 6.75% 5.25% 1.00% 7,255,810 2.17% Portfolio Company 14 Warrants n/a n/a n/a n/a n/a n/a 251,000 0.07% Portfolio Company 15 First Lien Senior Secured Loans 8/13/2030 Fixed Fixed n/a 12.50% n/a 7,012,500 2.09% Portfolio Company 16 First Lien Senior Secured Loans 7/22/2030 Floating Prime 7.50% 2.50% 4.00% 5,870,973 1.75% Portfolio Company 16 Warrants n/a n/a n/a n/a n/a n/a 234,000 0.07% Portfolio Company 17 First Lien Senior Secured Loans 3/24/2028 Floating Prime 7.75% 7.25% n/a 5,795,353 1.73% Portfolio Company 18 First Lien Senior Secured Loans 7/28/2028 Floating SOFR 4.00% 10.25% n/a 5,742,079 1.71% Portfolio Company 19 Senior Secured Notes 5/22/2029 Floating SOFR 3.65% 8.00% 1.00% 5,509,496 1.65% Portfolio Company 20 First Lien Senior Secured Loans 3/30/2031 Floating Prime 6.75% 3.25% 2.00% 3,630,303 1.08% Portfolio Company 20 First Lien Senior Secured Loans 3/30/2031 Floating Prime 6.75% 3.25% 2.00% 1,868,281 0.56% Portfolio Company 21 First Lien Senior Secured Loans 4/30/2029 Floating SOFR 4.25% 6.25% 1.50% 5,032,509 1.50% Portfolio Company 21 Warrants n/a n/a n/a n/a n/a n/a 32,000 0.01% Portfolio Company 22 First Lien Senior Secured Loans 6/17/2029 Floating Prime 6.75% 5.25% 1.00% 4,712,570 1.41% Portfolio Company 22 Warrants n/a n/a n/a n/a n/a n/a 223,000 0.07% Portfolio Company 23 First Lien Senior Secured Loans 10/24/2029 Floating SOFR 3.99% 8.00% n/a 4,900,000 1.46% Portfolio Company 23 Warrants n/a n/a n/a n/a n/a n/a 12,000 0.00% Portfolio Company 24 First Lien Senior Secured Loans 7/31/2029 Floating Prime 7.50% 6.50% n/a 4,296,215 1.28% Portfolio Company 25 First Lien Senior Secured Loans 3/31/2027 Floating Prime 8.00% 7.50% n/a 3,922,306 1.17% Portfolio Company 26 First Lien Senior Secured Loans 9/22/2028 Floating SOFR 3.50% 6.50% n/a 503,363 0.15% Portfolio Company 26 First Lien Senior Secured Loans 9/22/2028 Floating SOFR 3.50% 6.50% n/a 3,225,250 0.96% Portfolio Company 27 Senior Secured Notes 7/16/2029 Fixed Fixed n/a 12.75% n/a 3,395,000 1.01% Portfolio Company 28 First Lien Senior Secured Loans 5/31/2029 Fixed Fixed n/a 6.00% 6.00% 2,071,967 0.62% Portfolio Company 28 Preferred Stock n/a n/a n/a n/a n/a n/a 500,000 0.15% Portfolio Company 28 Warrants n/a n/a n/a n/a n/a n/a 186,000 0.06% Portfolio Company 28 Warrants n/a n/a n/a n/a n/a n/a 422,000 0.13% Portfolio Company 29 First Lien Senior Secured Loans 11/4/2028 Floating Prime 8.00% 4.00% 4.50% 3,124,791 0.93% Portfolio Company 30 First Lien Senior Secured Loans 3/13/2027 Fixed Fixed n/a 14.50% n/a 3,030,500 0.91% Portfolio Company 31 First Lien Senior Secured Loans 12/11/2030 Floating SOFR 3.25% 8.00% n/a 2,875,002 0.86% Portfolio Company 32 First Lien Senior Secured Loans 8/1/2028 Fixed Fixed n/a 12.75% n/a 2,740,697 0.82% Portfolio Company 33 First Lien Senior Secured Loans 7/29/2026 Floating Prime 7.00% 7.00% 2.00% 2,721,427 0.81% Portfolio Company 34 First Lien Senior Secured Loans 12/3/2027 Floating Prime 8.50% 8.50% n/a 2,597,218 0.78% Portfolio Company 35 First Lien Senior Secured Loans 7/19/2027 Floating Prime 8.50% 2.00% 1.50% 2,251,743 0.67% Portfolio Company 36 Second Lien Senior Secured Loans 8/1/2028 Floating Prime 7.75% 9.00% 3.50% 1,358,368 0.42% Portfolio Company 37 Warrants n/a n/a n/a n/a n/a n/a 487,000 0.15% Total $ 334,833,992 100.00%
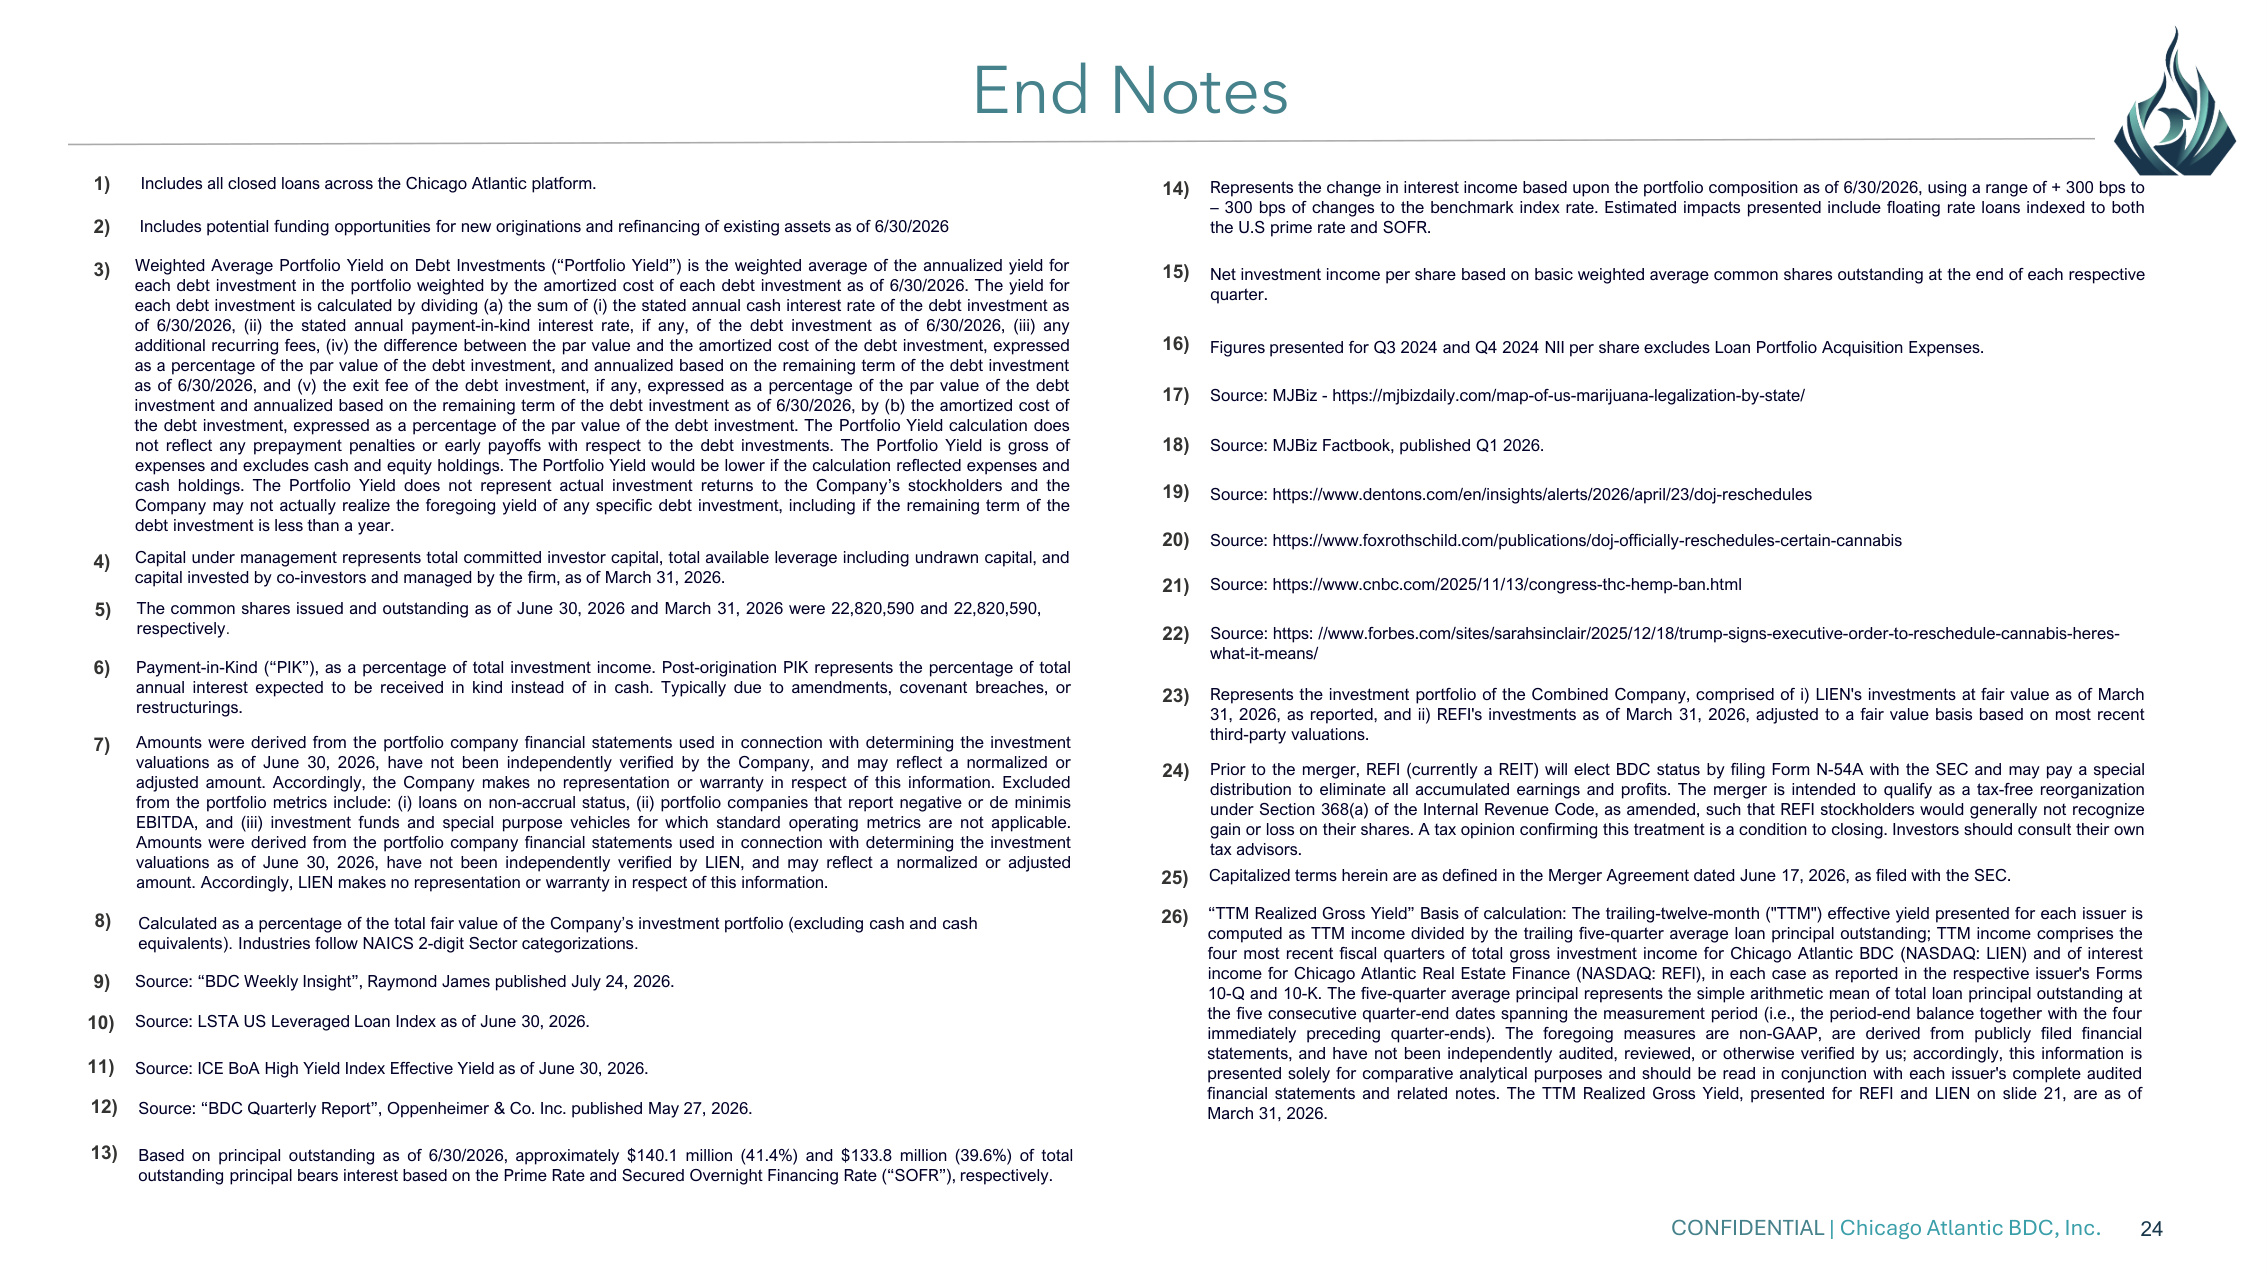
CONFIDENTIAL | Chicago Atlantic BDC, Inc. 24 End Notes 1) Includes all closed loans across the Chicago Atlantic platform. 2) Includes potential funding opportunities for new originations and refinancing of existing assets as of 6/30/2026 3) Capital under management represents total committed investor capital, total available leverage including undrawn capital, and capital invested by co-investors and managed by the firm, as of March 31, 2026. 4) Weighted Average Portfolio Yield on Debt Investments ("Portfolio Yield") is the weighted average of the annualized yield for each debt investment in the portfolio weighted by the amortized cost of each debt investment as of 6/30/2026. The yield for each debt investment is calculated by dividing (a) the sum of (i) the stated annual cash interest rate of the debt investment as of 6/30/2026, (ii) the stated annual payment-in-kind interest rate, if any, of the debt investment as of 6/30/2026, (iii) any additional recurring fees, (iv) the difference between the par value and the amortized cost of the debt investment, expressed as a percentage of the par value of the debt investment, and annualized based on the remaining term of the debt investment as of 6/30/2026, and (v) the exit fee of the debt investment, if any, expressed as a percentage of the par value of the debt investment and annualized based on the remaining term of the debt investment as of 6/30/2026, by (b) the amortized cost of the debt investment, expressed as a percentage of the par value of the debt investment. The Portfolio Yield calculation does not reflect any prepayment penalties or early payoffs with respect to the debt investments. The Portfolio Yield is gross of expenses and excludes cash and equity holdings. The Portfolio Yield would be lower if the calculation reflected expenses and cash holdings. The Portfolio Yield does not represent actual investment returns to the Company's stockholders and the Company may not actually realize the foregoing yield of any specific debt investment, including if the remaining term of the debt investment is less than a year. 5) The common shares issued and outstanding as of June 30, 2026 and March 31, 2026 were 22,820,590 and 22,820,590, respectively. 6) Payment-in-Kind ("PIK"), as a percentage of total investment income. Post-origination PIK represents the percentage of total annual interest expected to be received in kind instead of in cash. Typically due to amendments, covenant breaches, or restructurings. 7) Amounts were derived from the portfolio company financial statements used in connection with determining the investment valuations as of June 30, 2026, have not been independently verified by the Company, and may reflect a normalized or adjusted amount. Accordingly, the Company makes no representation or warranty in respect of this information. Excluded from the portfolio metrics include: (i) loans on non-accrual status, (ii) portfolio companies that report negative or de minimis EBITDA, and (iii) investment funds and special purpose vehicles for which standard operating metrics are not applicable. Amounts were derived from the portfolio company financial statements used in connection with determining the investment valuations as of June 30, 2026, have not been independently verified by LIEN, and may reflect a normalized or adjusted amount. Accordingly, LIEN makes no representation or warranty in respect of this information. 8) Calculated as a percentage of the total fair value of the Company's investment portfolio (excluding cash and cash equivalents). Industries follow NAICS 2-digit Sector categorizations. 9) Source: "BDC Weekly Insight", Raymond James published July 24, 2026. 10) Source: LSTA US Leveraged Loan Index as of June 30, 2026. 11) Source: ICE BoA High Yield Index Effective Yield as of June 30, 2026. 13) Based on principal outstanding as of 6/30/2026, approximately $140.1 million (41.4%) and $133.8 million (39.6%) of total outstanding principal bears interest based on the Prime Rate and Secured Overnight Financing Rate ("SOFR"), respectively. 14) Represents the change in interest income based upon the portfolio composition as of 6/30/2026, using a range of + 300 bps to – 300 bps of changes to the benchmark index rate. Estimated impacts presented include floating rate loans indexed to both the U.S prime rate and SOFR. 15) Net investment income per share based on basic weighted average common shares outstanding at the end of each respective quarter. 16) Figures presented for Q3 2024 and Q4 2024 NII per share excludes Loan Portfolio Acquisition Expenses. 17) Source: MJBiz - https://mjbizdaily.com/map-of-us-marijuana-legalization-by-state/ 18) Source: MJBiz Factbook, published Q1 2026. 19) Source: https://www.dentons.com/en/insights/alerts/2026/april/23/doj-reschedules 20) Source: https://www.foxrothschild.com/publications/doj-officially-reschedules-certain-cannabis 21) Source: https://www.cnbc.com/2025/11/13/congress-thc-hemp-ban.html 22) 23) Represents the investment portfolio of the Combined Company, comprised of i) LIEN's investments at fair value as of March 31, 2026, as reported, and ii) REFI's investments as of March 31, 2026, adjusted to a fair value basis based on most recent third-party valuations. 12) Source: "BDC Quarterly Report", Oppenheimer & Co. Inc. published May 27, 2026. 24) Prior to the merger, REFI (currently a REIT) will elect BDC status by filing Form N-54A with the SEC and may pay a special distribution to eliminate all accumulated earnings and profits. The merger is intended to qualify as a tax-free reorganization under Section 368(a) of the Internal Revenue Code, as amended, such that REFI stockholders would generally not recognize gain or loss on their shares. A tax opinion confirming this treatment is a condition to closing. Investors should consult their own tax advisors. 25) Capitalized terms herein are as defined in the Merger Agreement dated June 17, 2026, as filed with the SEC. Source: https: //www.forbes.com/sites/sarahsinclair/2025/12/18/trump-signs-executive-order-to-reschedule-cannabis-heres- what-it-means/ 26) "TTM Realized Gross Yield" Basis of calculation: The trailing-twelve-month ("TTM") effective yield presented for each issuer is computed as TTM income divided by the trailing five-quarter average loan principal outstanding; TTM income comprises the four most recent fiscal quarters of total gross investment income for Chicago Atlantic BDC (NASDAQ: LIEN) and of interest income for Chicago Atlantic Real Estate Finance (NASDAQ: REFI), in each case as reported in the respective issuer's Forms 10-Q and 10-K. The five-quarter average principal represents the simple arithmetic mean of total loan principal outstanding at the five consecutive quarter-end dates spanning the measurement period (i.e., the period-end balance together with the four immediately preceding quarter-ends). The foregoing measures are non-GAAP, are derived from publicly filed financial statements, and have not been independently audited, reviewed, or otherwise verified by us; accordingly, this information is presented solely for comparative analytical purposes and should be read in conjunction with each issuer's complete audited financial statements and related notes. The TTM Realized Gross Yield, presented for REFI and LIEN on slide 21, are as of March 31, 2026.