
Aug 2026

Disclaimer Forward-Looking Statements This presentation contains forward-looking statements within the meaning of the Private Securities Litigation Reform Act of 1995. We intend such forward-looking statements to be covered by the safe harbor provisions for forward-looking statements contained in Section 27A of the Securities Act of 1933, as amended, and Section 21E of the Securities Exchange Act of 1934, as amended. All statements other than statements of historical fact are forward-looking statements. These statements include, but are not limited to, statements regarding our operating results and financial position; anticipated expenses, including our financial outlook, and investments; expectations relating to our key financial and operating metrics; our business strategy and plans, including expectations related to our full-stack end-to-end marketplace and superapp strategy; expectations relating to legal and regulatory proceedings; expectations relating to our industry, the regulatory environment, market conditions, trends, and growth; expectations relating to customer behavior and preferences; our market position; potential market opportunities; and our objectives for future operations. The words “believe,” “may,” “will,” “estimate,” “potential,” “continue,” “anticipate,” “intend,” “expect,” “could,” “would,” “project,” “plan,” “target,” and similar expressions are intended to identify forward-looking statements. Forward-looking statements are based on management’s expectations, assumptions, and projections based on information available at the time the statements were made. These forward-looking statements are subject to a number of risks, uncertainties, and assumptions, including, among others: our ability to successfully execute our business and growth strategy and generate future profitability; market acceptance of our products and services; our ability to penetrate our existing customer base and expand our customer base; our ability to develop new products and services and achieve customer adoption of them; our ability to obtain applicable regulatory approvals; the success of any acquisitions or investments that we make; the effects of increased competition in our markets; our ability to stay in compliance with applicable laws and regulations; the possibility of adverse developments in pending litigation; the risk that the outcome of currently ongoing and potential future regulatory litigation and/or enforcement actions, as well as potential changes in federal or state law, could immediately or subsequently prevent us from offering, or continuing to offer, event contracts; stock price fluctuations; market conditions across the cryptoeconomy, including crypto price volatility; and general market, political, and economic conditions, including interest rate fluctuations, inflation, tariffs, instability in the global banking system, economic downturns, and other global events, including regional wars and conflicts and government shutdowns. It is not possible for our management to predict all risks, nor can we assess the impact of all factors on our business or the extent to which any factor, or combination of factors, may cause actual results to differ materially from those contained in any forward-looking statements we may make. In light of these risks, uncertainties, and assumptions, our actual results could differ materially and adversely from those anticipated or implied in the forward-looking statements. Further information on risks that could cause actual results to differ materially from anticipated results is included, or will be included, in our filings we make with the Securities and Exchange Commission from time to time, including our Annual Reports on Form 10-K and Quarterly Reports on Form 10-Q. Except as required by law, we assume no obligation to update these forward-looking statements, or to update the reasons if actual results differ materially from those anticipated in the forward-looking statements. Key Performance Metrics This presentation includes key performance metrics that our management uses to help evaluate our business, identify trends affecting our business, formulate business plans, and make strategic decisions. Our key performance metrics include certain metrics, such as MTUs, Trading Volume, and Assets on Platform. Definitions of these key performance metrics can be found in the footnotes to this presentation. For more information and a more detailed discussion of our Key Performance Metrics, refer to the filings we make with the Securities and Exchange Commission from time to time, including our Quarterly Report on Form 10-Q for the quarterly period ended June 30, 2026. Market and Industry Data This presentation may include market and industry data, forecasts, and other statistical information. Unless otherwise indicated, information concerning the Company’s industry and the markets in which it operates, including general expectations, market position, market opportunity, and market size, are based on management’s knowledge and experience in the markets in which the Company operates, together with currently available information obtained from various sources, including publicly available information, industry reports and publications, surveys, our users, trade and business organizations, and other contacts in the markets in which the Company operates. Certain information is based on management estimates, which have been derived from third-party sources, as well as data from internal research. In presenting this information, the Company has made certain assumptions that it believes to be reasonable based on such data and other similar sources and on the Company’s knowledge of, and experience to date in, the markets in which the Company operates. While the Company believes the estimated market and industry data included in this presentation is reliable, such information is inherently uncertain and imprecise. Market and industry data is subject to change and may be limited by the availability of raw data, the nature of the data gathering process, and other limitations inherent in any statistical survey of such data. In addition, projections, assumptions, and estimates of the future performance of the markets in which the Company operates are necessarily subject to uncertainty and risk due to a variety of factors, which could cause results to differ materially from those expressed in the estimates made by third parties and the Company. Accordingly, you are cautioned not to place undue reliance on such market and industry data or any other such estimates. Trademarks “Gemini” and the Gemini logo are registered trademarks of Gemini Space Station, Inc. and/or its respective subsidiaries. All other names are trademarks and/or registered trademarks of their respective owners. This presentation includes financial information prepared in accordance with U.S. generally accepted accounting principles (“GAAP”). This presentation also includes non-GAAP financial information, which should be considered supplemental to, not a substitute for, or superior to, the financial measure calculated in accordance with GAAP. There are a number of limitations related to the use of these non-GAAP financial measures and their nearest GAAP equivalents. For example, the Company’s definitions of non-GAAP financial measures may differ from non-GAAP financial measures used by other companies. For a description of the non-GAAP financial information included herein, see the Appendix to this presentation. A reconciliation to the most directly comparable GAAP measure is set forth in the Appendix to this presentation. Non-GAAP Financial Measures Earnings Presentation | Q2'26 2 2
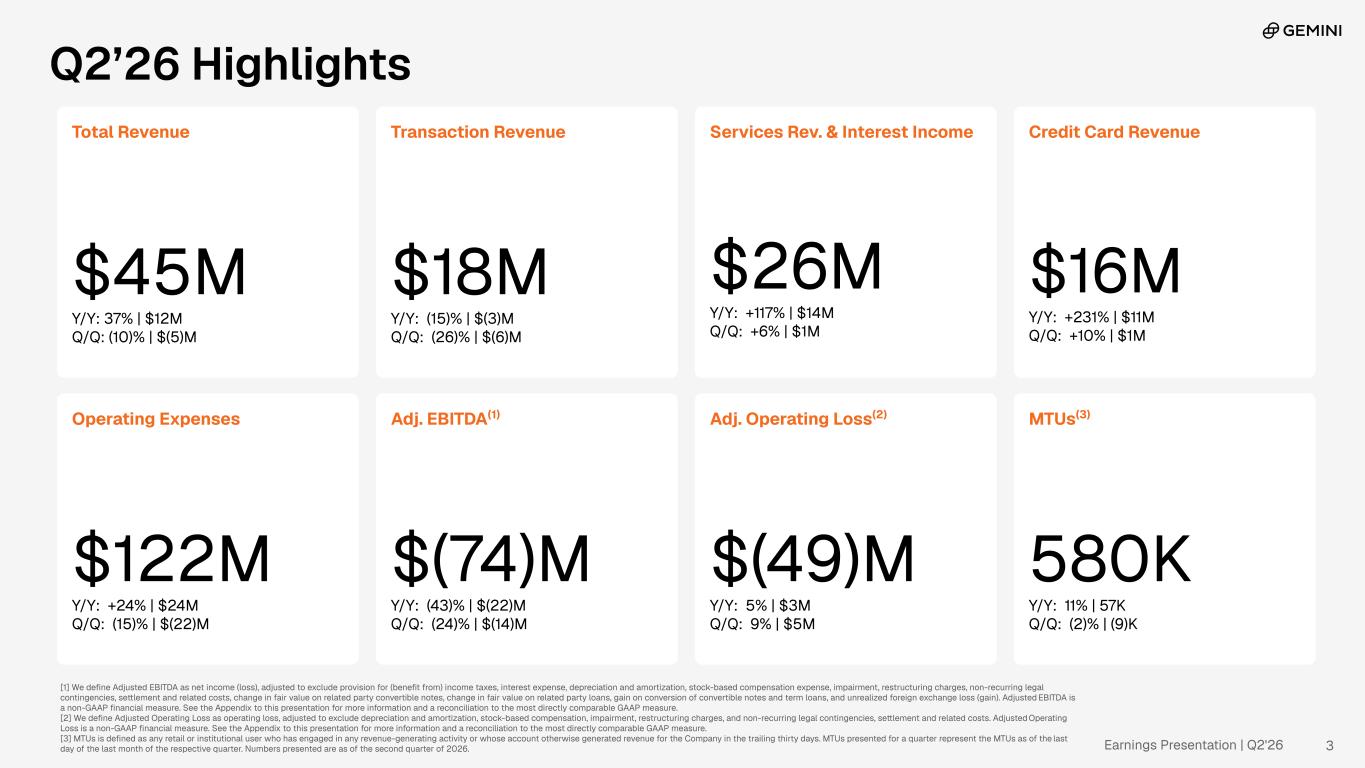
Earnings Presentation | Q2'26 Q2’26 Highlights Total Revenue $45M Y/Y: 37% | $12M Q/Q: (10)% | $(5)M Transaction Revenue $18M Y/Y: (15)% | $(3)M Q/Q: (26)% | $(6)M Services Rev. & Interest Income $26M Y/Y: +117% | $14M Q/Q: +6% | $1M Operating Expenses $122M Y/Y: +24% | $24M Q/Q: (15)% | $(22)M Adj. EBITDA(1) $(74)M Y/Y: (43)% | $(22)M Q/Q: (24)% | $(14)M MTUs(3) 580K Y/Y: 11% | 57K Q/Q: (2)% | (9)K [1] We define Adjusted EBITDA as net income (loss), adjusted to exclude provision for (benefit from) income taxes, interest expense, depreciation and amortization, stock-based compensation expense, impairment, restructuring charges, non-recurring legal contingencies, settlement and related costs, change in fair value on related party convertible notes, change in fair value on related party loans, gain on conversion of convertible notes and term loans, and unrealized foreign exchange loss (gain). Adjusted EBITDA is a non-GAAP financial measure. See the Appendix to this presentation for more information and a reconciliation to the most directly comparable GAAP measure. [2] We define Adjusted Operating Loss as operating loss, adjusted to exclude depreciation and amortization, stock-based compensation, impairment, restructuring charges, and non-recurring legal contingencies, settlement and related costs. Adjusted Operating Loss is a non-GAAP financial measure. See the Appendix to this presentation for more information and a reconciliation to the most directly comparable GAAP measure. [3] MTUs is defined as any retail or institutional user who has engaged in any revenue-generating activity or whose account otherwise generated revenue for the Company in the trailing thirty days. MTUs presented for a quarter represent the MTUs as of the last day of the last month of the respective quarter. Numbers presented are as of the second quarter of 2026. Credit Card Revenue $16M Y/Y: +231% | $11M Q/Q: +10% | $1M Adj. Operating Loss(2) $(49)M Y/Y: 5% | $3M Q/Q: 9% | $5M 3
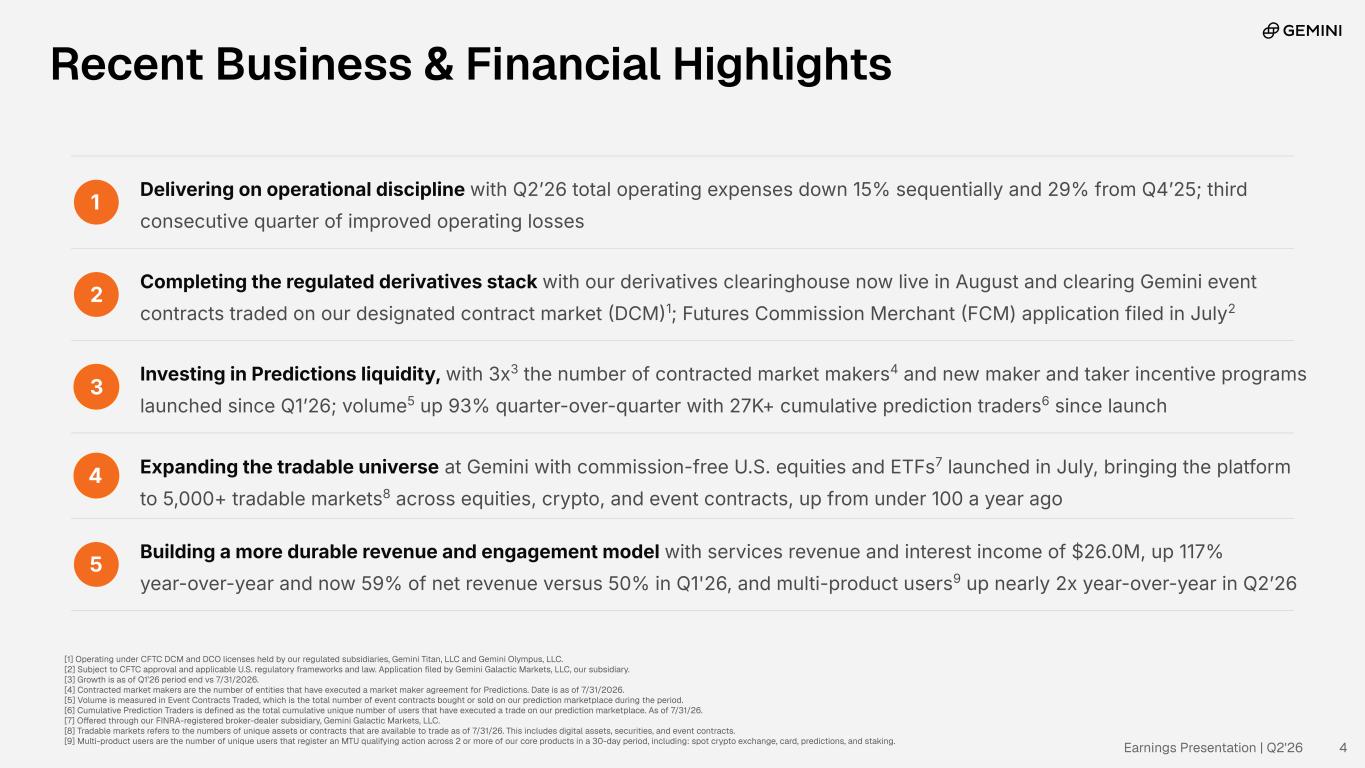
1 Delivering on operational discipline with Q2ʼ26 total operating expenses down 15% sequentially and 29% from Q4ʼ25; third consecutive quarter of improved operating losses 2 Completing the regulated derivatives stack with our derivatives clearinghouse now live in August and clearing Gemini event contracts traded on our designated contract market DCM1; Futures Commission Merchant FCM) application filed in July2 3 Investing in Predictions liquidity, with 3x3 the number of contracted market makers4 and new maker and taker incentive programs launched since Q1ʼ26; volume5 up 93% quarter-over-quarter with 27K+ cumulative prediction traders6 since launch 4 Expanding the tradable universe at Gemini with commission-free U.S. equities and ETFs7 launched in July, bringing the platform to 5,000+ tradable markets8 across equities, crypto, and event contracts, up from under 100 a year ago 5 Building a more durable revenue and engagement model with services revenue and interest income of $26.0M, up 117% year-over-year and now 59% of net revenue versus 50% in Q1'26, and multi-product users9 up nearly 2x year-over-year in Q2ʼ26 Recent Business & Financial Highlights [1] Operating under CFTC DCM and DCO licenses held by our regulated subsidiaries, Gemini Titan, LLC and Gemini Olympus, LLC. [2] Subject to CFTC approval and applicable U.S. regulatory frameworks and law. Application filed by Gemini Galactic Markets, LLC, our subsidiary. [3] Growth is as of Q1’26 period end vs 7/31/2026. [4] Contracted market makers are the number of entities that have executed a market maker agreement for Predictions. Date is as of 7/31/2026. [5] Volume is measured in Event Contracts Traded, which is the total number of event contracts bought or sold on our prediction marketplace during the period. [6] Cumulative Prediction Traders is defined as the total cumulative unique number of users that have executed a trade on our prediction marketplace. As of 7/31/26. [7] Offered through our FINRA-registered broker-dealer subsidiary, Gemini Galactic Markets, LLC. [8] Tradable markets refers to the numbers of unique assets or contracts that are available to trade as of 7/31/26. This includes digital assets, securities, and event contracts. [9] Multi-product users are the number of unique users that register an MTU qualifying action across 2 or more of our core products in a 30-day period, including: spot crypto exchange, card, predictions, and staking. Earnings Presentation | Q2'26 4
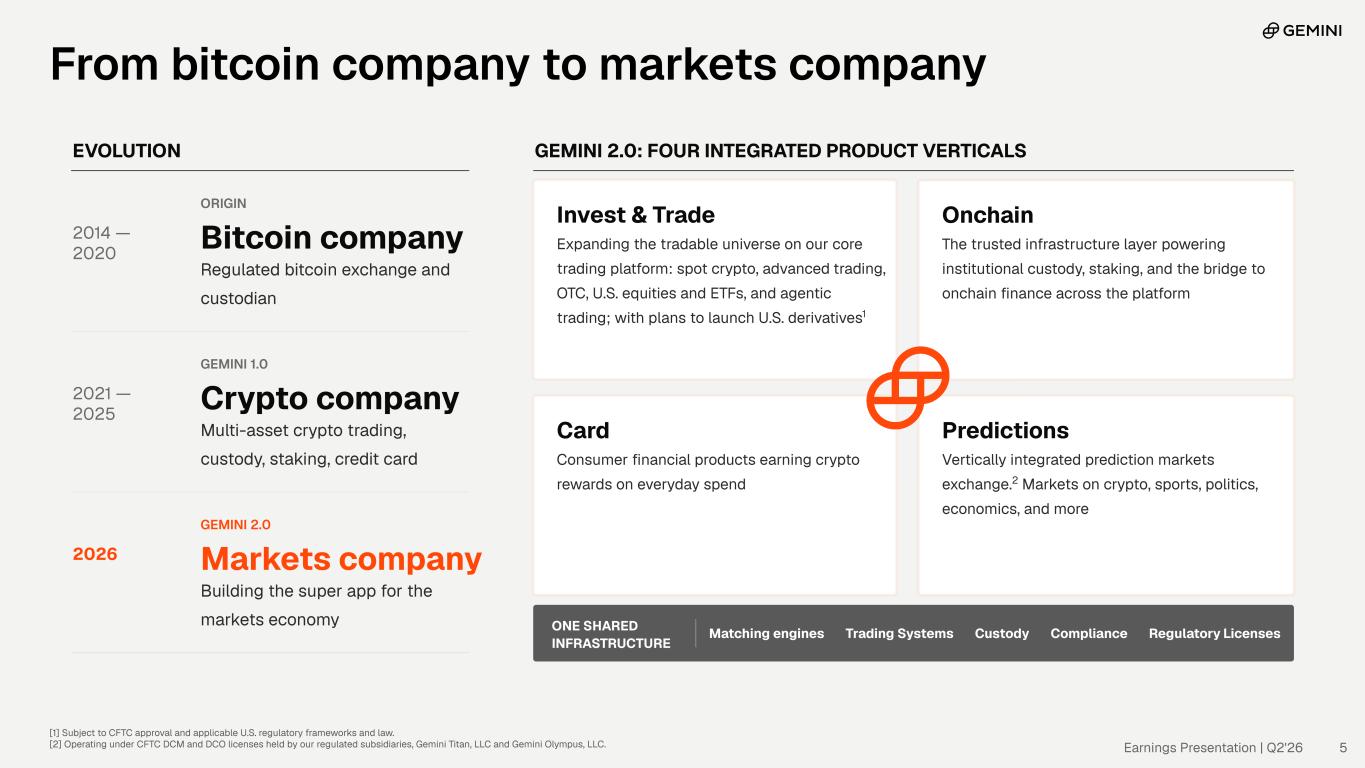
EVOLUTION 2014 — 2020 ORIGIN Bitcoin company Regulated bitcoin exchange and custodian 2021 — 2025 GEMINI 1.0 Crypto company Multi-asset crypto trading, custody, staking, credit card 2026 GEMINI 2.0 Markets company Building the super app for the markets economy GEMINI 2.0: FOUR INTEGRATED PRODUCT VERTICALS Invest & Trade Expanding the tradable universe on our core trading platform: spot crypto, advanced trading, OTC, U.S. equities and ETFs, and agentic trading; with plans to launch U.S. derivatives1 Onchain The trusted infrastructure layer powering institutional custody, staking, and the bridge to onchain finance across the platform Card Consumer financial products earning crypto rewards on everyday spend Predictions Vertically integrated prediction markets exchange.2 Markets on crypto, sports, politics, economics, and more ONE SHARED INFRASTRUCTURE Matching engines Trading Systems Custody Compliance Regulatory Licenses [1] Subject to CFTC approval and applicable U.S. regulatory frameworks and law. [2] Operating under CFTC DCM and DCO licenses held by our regulated subsidiaries, Gemini Titan, LLC and Gemini Olympus, LLC. Earnings Presentation | Q2'26 5 From bitcoin company to markets company
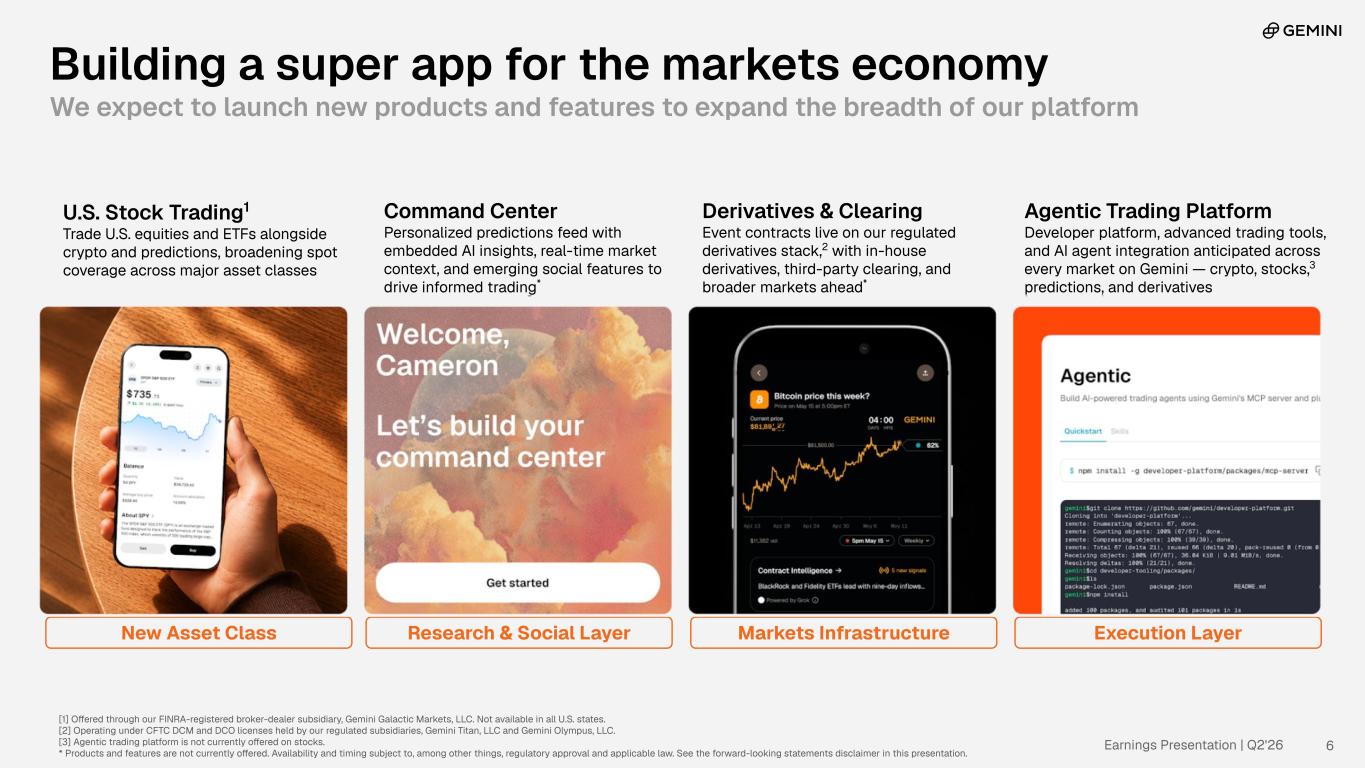
Earnings Presentation | Q2'26 6 Building a super app for the markets economy We expect to launch new products and features to expand the breadth of our platform New Asset Class Research & Social Layer Markets Infrastructure Execution Layer U.S. Stock Trading1 Trade U.S. equities and ETFs alongside crypto and predictions, broadening spot coverage across major asset classes Command Center Personalized predictions feed with embedded AI insights, real-time market context, and emerging social features to drive informed trading* Derivatives & Clearing Event contracts live on our regulated derivatives stack,2 with in-house derivatives, third-party clearing, and broader markets ahead* Agentic Trading Platform Developer platform, advanced trading tools, and AI agent integration anticipated across every market on Gemini — crypto, stocks,3 predictions, and derivatives [1] Offered through our FINRA-registered broker-dealer subsidiary, Gemini Galactic Markets, LLC. Not available in all U.S. states. [2] Operating under CFTC DCM and DCO licenses held by our regulated subsidiaries, Gemini Titan, LLC and Gemini Olympus, LLC. [3] Agentic trading platform is not currently offered on stocks. * Products and features are not currently offered. Availability and timing subject to, among other things, regulatory approval and applicable law. See the forward-looking statements disclaimer in this presentation.
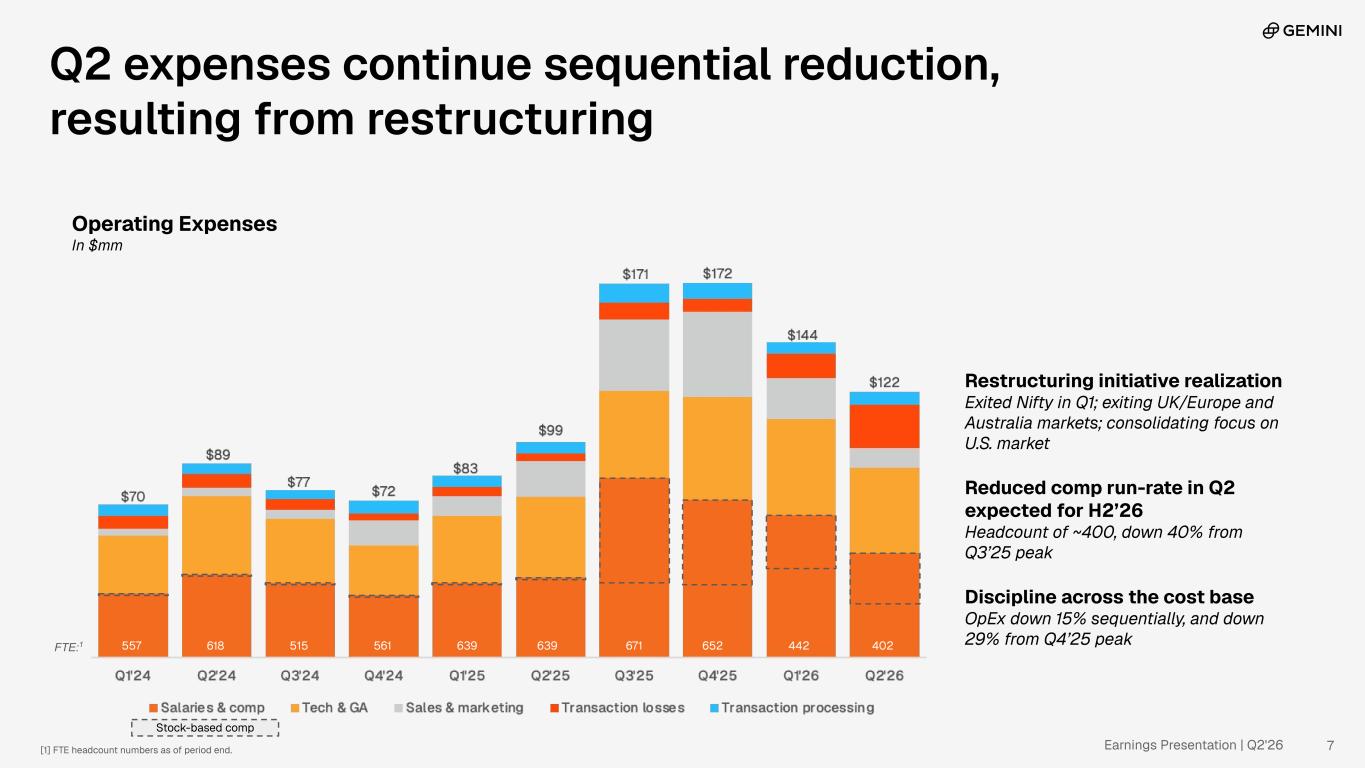
Earnings Presentation | Q2'26 Operating Expenses In $mm Restructuring initiative realization Exited Nifty in Q1; exiting UK/Europe and Australia markets; consolidating focus on U.S. market Reduced comp run-rate in Q2 expected for H2’26 Headcount of ~400, down 40% from Q3’25 peak Discipline across the cost base OpEx down 15% sequentially, and down 29% from Q4’25 peak 7[1] FTE headcount numbers as of period end. 557 618 515 561 639 639 671 652 442 402FTE:1 Stock-based comp Q2 expenses continue sequential reduction, resulting from restructuring
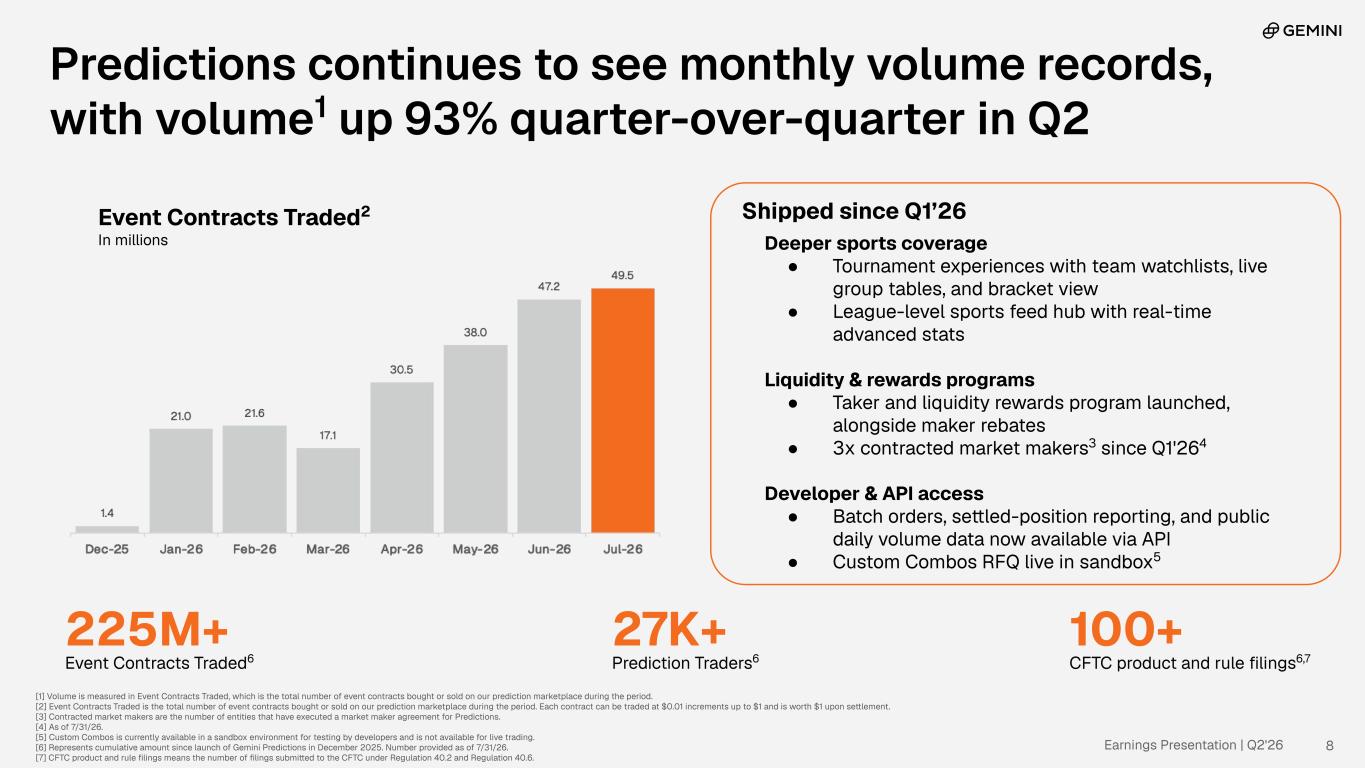
Earnings Presentation | Q2'26 Event Contracts Traded2 In millions Predictions continues to see monthly volume records, with volume1 up 93% quarter-over-quarter in Q2 [1] Volume is measured in Event Contracts Traded, which is the total number of event contracts bought or sold on our prediction marketplace during the period. [2] Event Contracts Traded is the total number of event contracts bought or sold on our prediction marketplace during the period. Each contract can be traded at $0.01 increments up to $1 and is worth $1 upon settlement. [3] Contracted market makers are the number of entities that have executed a market maker agreement for Predictions. [4] As of 7/31/26. [5] Custom Combos is currently available in a sandbox environment for testing by developers and is not available for live trading. [6] Represents cumulative amount since launch of Gemini Predictions in December 2025. Number provided as of 7/31/26. [7] CFTC product and rule filings means the number of filings submitted to the CFTC under Regulation 40.2 and Regulation 40.6. 8 225M+ Event Contracts Traded6 27K+ Prediction Traders6 100+ CFTC product and rule filings6,7 Shipped since Q1’26 Deeper sports coverage ● Tournament experiences with team watchlists, live group tables, and bracket view ● League-level sports feed hub with real-time advanced stats Liquidity & rewards programs ● Taker and liquidity rewards program launched, alongside maker rebates ● 3x contracted market makers3 since Q1'264 Developer & API access ● Batch orders, settled-position reporting, and public daily volume data now available via API ● Custom Combos RFQ live in sandbox5
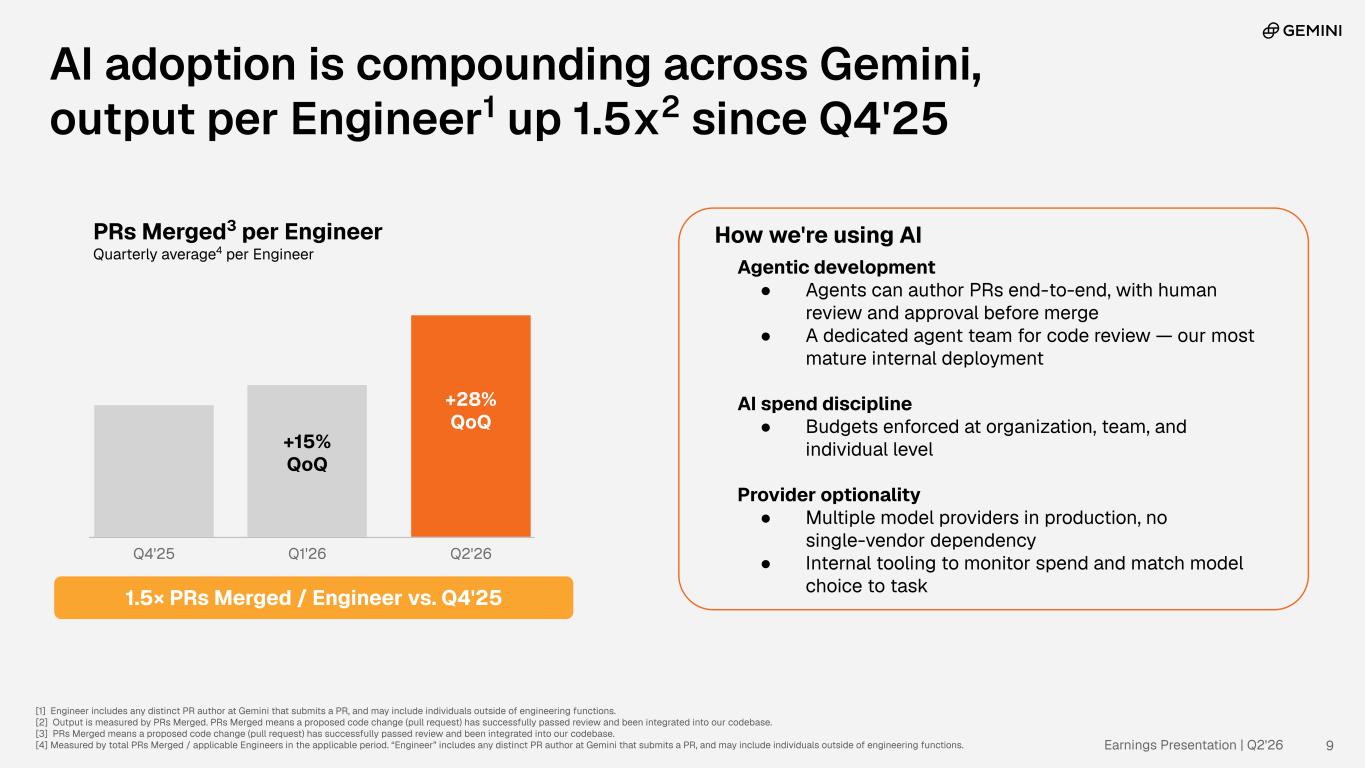
Earnings Presentation | Q2'26 PRs Merged3 per Engineer Quarterly average4 per Engineer AI adoption is compounding across Gemini, output per Engineer1 up 1.5x2 since Q4'25 [1] Engineer includes any distinct PR author at Gemini that submits a PR, and may include individuals outside of engineering functions. [2] Output is measured by PRs Merged. PRs Merged means a proposed code change (pull request) has successfully passed review and been integrated into our codebase. [3] PRs Merged means a proposed code change (pull request) has successfully passed review and been integrated into our codebase. [4] Measured by total PRs Merged / applicable Engineers in the applicable period. “Engineer” includes any distinct PR author at Gemini that submits a PR, and may include individuals outside of engineering functions. 9 How we're using AI Agentic development ● Agents can author PRs end-to-end, with human review and approval before merge ● A dedicated agent team for code review — our most mature internal deployment AI spend discipline ● Budgets enforced at organization, team, and individual level Provider optionality ● Multiple model providers in production, no single-vendor dependency ● Internal tooling to monitor spend and match model choice to task Q4'25 +15% QoQ Q1'26 +28% QoQ Q2'26 1.5× PRs Merged / Engineer vs. Q4'25
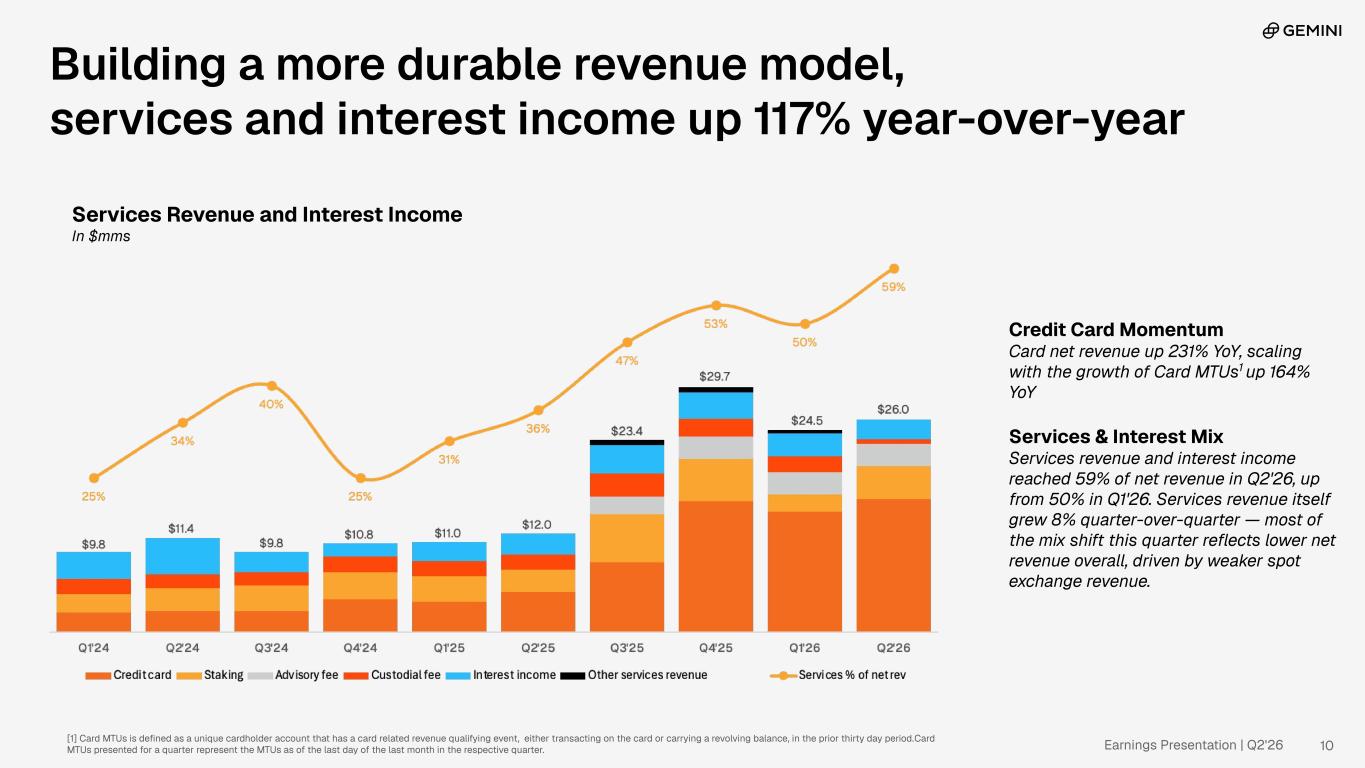
Earnings Presentation | Q2'26 Credit Card Momentum Card net revenue up 231% YoY, scaling with the growth of Card MTUs1 up 164% YoY Services & Interest Mix Services revenue and interest income reached 59% of net revenue in Q2'26, up from 50% in Q1'26. Services revenue itself grew 8% quarter-over-quarter — most of the mix shift this quarter reflects lower net revenue overall, driven by weaker spot exchange revenue. Building a more durable revenue model, services and interest income up 117% year-over-year Services Revenue and Interest Income In $mms [1] Card MTUs is defined as a unique cardholder account that has a card related revenue qualifying event, either transacting on the card or carrying a revolving balance, in the prior thirty day period. Card MTUs presented for a quarter represent the MTUs as of the last day of the last month in the respective quarter. 10

Appendix 11
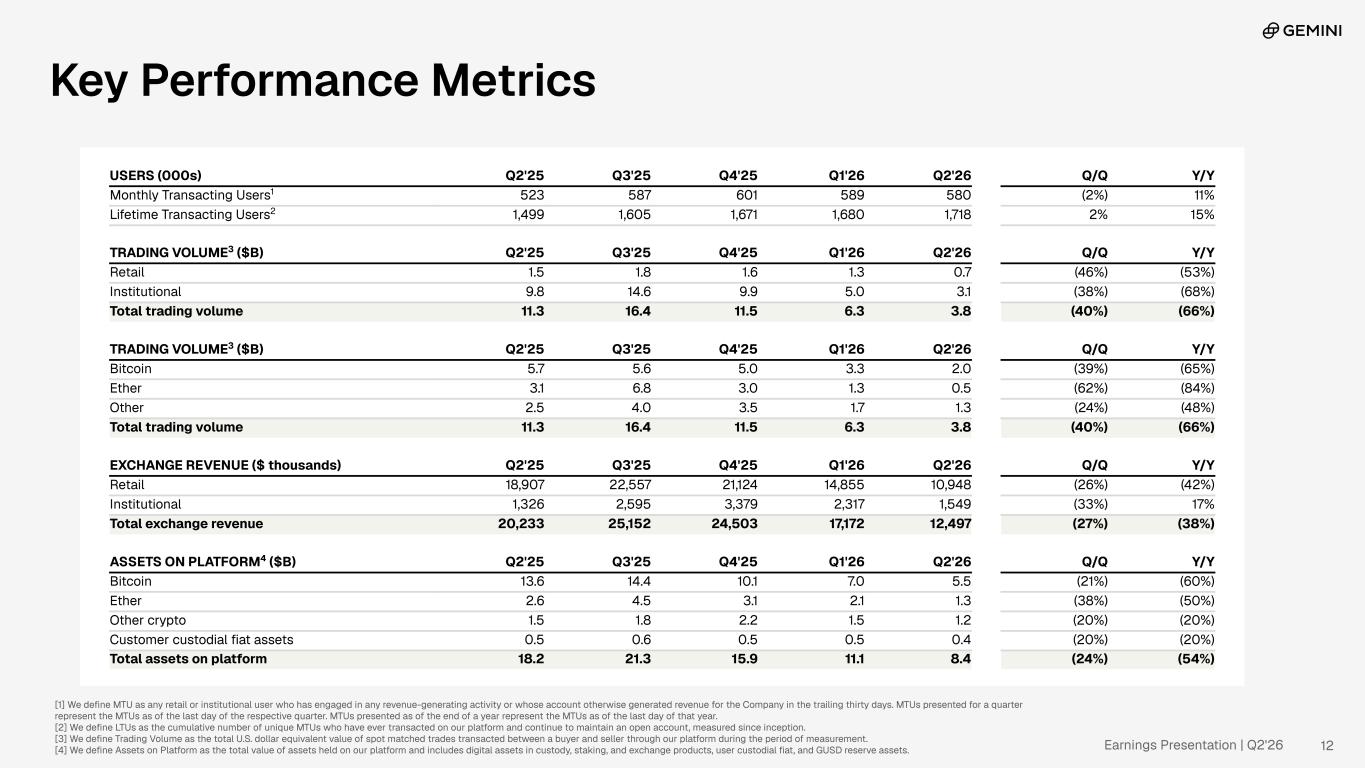
Earnings Presentation | Q2'26 [1] We define MTU as any retail or institutional user who has engaged in any revenue-generating activity or whose account otherwise generated revenue for the Company in the trailing thirty days. MTUs presented for a quarter represent the MTUs as of the last day of the respective quarter. MTUs presented as of the end of a year represent the MTUs as of the last day of that year. [2] We define LTUs as the cumulative number of unique MTUs who have ever transacted on our platform and continue to maintain an open account, measured since inception. [3] We define Trading Volume as the total U.S. dollar equivalent value of spot matched trades transacted between a buyer and seller through our platform during the period of measurement. [4] We define Assets on Platform as the total value of assets held on our platform and includes digital assets in custody, staking, and exchange products, user custodial fiat, and GUSD reserve assets. USERS (000s) Q2'25 Q3'25 Q4'25 Q1'26 Q2'26 Q/Q Y/Y Monthly Transacting Users1 523 587 601 589 580 (2%) 11% Lifetime Transacting Users2 1,499 1,605 1,671 1,680 1,718 2% 15% TRADING VOLUME3 ($B) Q2'25 Q3'25 Q4'25 Q1'26 Q2'26 Q/Q Y/Y Retail 1.5 1.8 1.6 1.3 0.7 (46%) (53%) Institutional 9.8 14.6 9.9 5.0 3.1 (38%) (68%) Total trading volume 11.3 16.4 11.5 6.3 3.8 (40%) (66%) TRADING VOLUME3 ($B) Q2'25 Q3'25 Q4'25 Q1'26 Q2'26 Q/Q Y/Y Bitcoin 5.7 5.6 5.0 3.3 2.0 (39%) (65%) Ether 3.1 6.8 3.0 1.3 0.5 (62%) (84%) Other 2.5 4.0 3.5 1.7 1.3 (24%) (48%) Total trading volume 11.3 16.4 11.5 6.3 3.8 (40%) (66%) EXCHANGE REVENUE ($ thousands) Q2'25 Q3'25 Q4'25 Q1'26 Q2'26 Q/Q Y/Y Retail 18,907 22,557 21,124 14,855 10,948 (26%) (42%) Institutional 1,326 2,595 3,379 2,317 1,549 (33%) 17% Total exchange revenue 20,233 25,152 24,503 17,172 12,497 (27%) (38%) ASSETS ON PLATFORM4 ($B) Q2'25 Q3'25 Q4'25 Q1'26 Q2'26 Q/Q Y/Y Bitcoin 13.6 14.4 10.1 7.0 5.5 (21%) (60%) Ether 2.6 4.5 3.1 2.1 1.3 (38%) (50%) Other crypto 1.5 1.8 2.2 1.5 1.2 (20%) (20%) Customer custodial fiat assets 0.5 0.6 0.5 0.5 0.4 (20%) (20%) Total assets on platform 18.2 21.3 15.9 11.1 8.4 (24%) (54%) 12 Key Performance Metrics
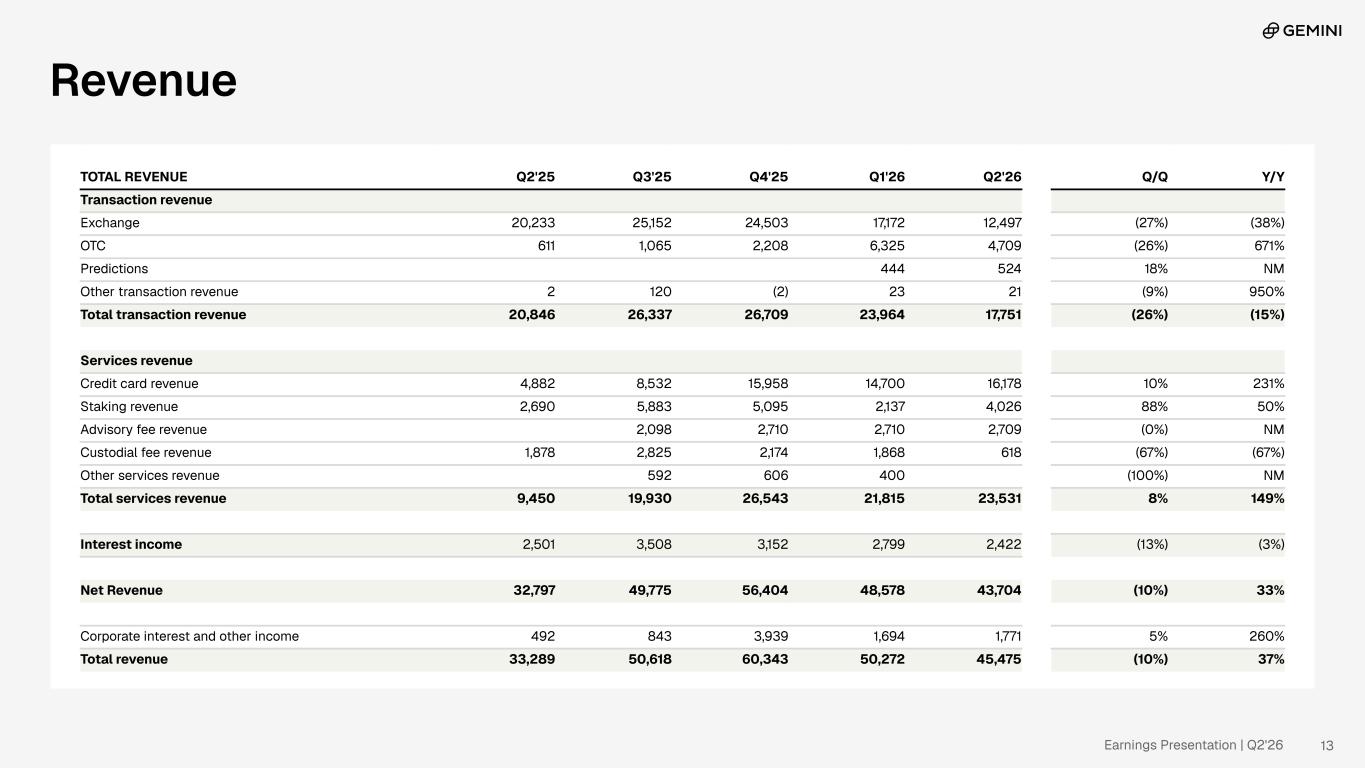
Earnings Presentation | Q2'26 Revenue TOTAL REVENUE Q2'25 Q3'25 Q4'25 Q1'26 Q2'26 Q/Q Y/Y Transaction revenue Exchange 20,233 25,152 24,503 17,172 12,497 (27%) (38%) OTC 611 1,065 2,208 6,325 4,709 (26%) 671% Predictions 444 524 18% NM Other transaction revenue 2 120 (2) 23 21 (9%) 950% Total transaction revenue 20,846 26,337 26,709 23,964 17,751 (26%) (15%) Services revenue Credit card revenue 4,882 8,532 15,958 14,700 16,178 10% 231% Staking revenue 2,690 5,883 5,095 2,137 4,026 88% 50% Advisory fee revenue 2,098 2,710 2,710 2,709 (0%) NM Custodial fee revenue 1,878 2,825 2,174 1,868 618 (67%) (67%) Other services revenue 592 606 400 (100%) NM Total services revenue 9,450 19,930 26,543 21,815 23,531 8% 149% Interest income 2,501 3,508 3,152 2,799 2,422 (13%) (3%) Net Revenue 32,797 49,775 56,404 48,578 43,704 (10%) 33% Corporate interest and other income 492 843 3,939 1,694 1,771 5% 260% Total revenue 33,289 50,618 60,343 50,272 45,475 (10%) 37% 13
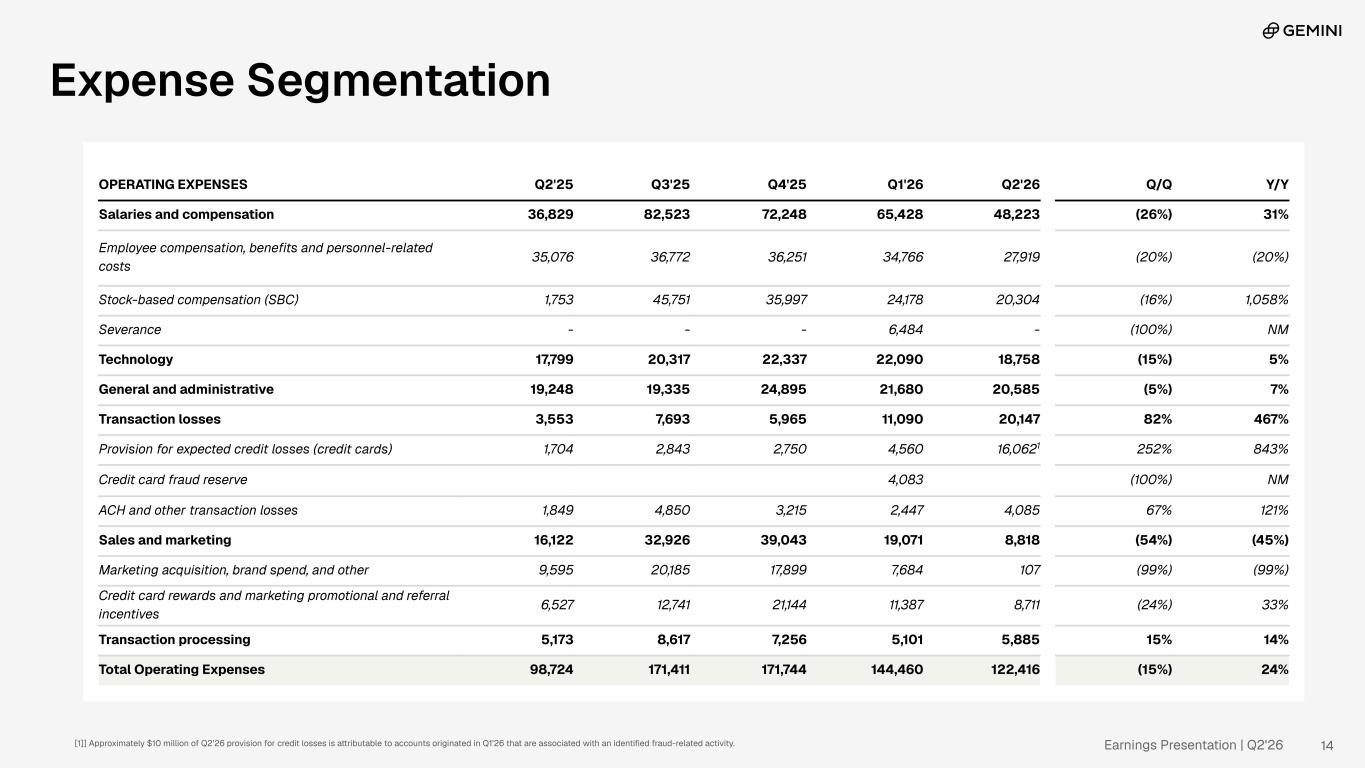
Earnings Presentation | Q2'26 Expense Segmentation OPERATING EXPENSES Q2'25 Q3'25 Q4'25 Q1'26 Q2'26 Q/Q Y/Y Salaries and compensation 36,829 82,523 72,248 65,428 48,223 (26%) 31% Employee compensation, benefits and personnel-related costs 35,076 36,772 36,251 34,766 27,919 (20%) (20%) Stock-based compensation (SBC) 1,753 45,751 35,997 24,178 20,304 (16%) 1,058% Severance - - - 6,484 - (100%) NM Technology 17,799 20,317 22,337 22,090 18,758 (15%) 5% General and administrative 19,248 19,335 24,895 21,680 20,585 (5%) 7% Transaction losses 3,553 7,693 5,965 11,090 20,147 82% 467% Provision for expected credit losses (credit cards) 1,704 2,843 2,750 4,560 16,0621 252% 843% Credit card fraud reserve 4,083 (100%) NM ACH and other transaction losses 1,849 4,850 3,215 2,447 4,085 67% 121% Sales and marketing 16,122 32,926 39,043 19,071 8,818 (54%) (45%) Marketing acquisition, brand spend, and other 9,595 20,185 17,899 7,684 107 (99%) (99%) Credit card rewards and marketing promotional and referral incentives 6,527 12,741 21,144 11,387 8,711 (24%) 33% Transaction processing 5,173 8,617 7,256 5,101 5,885 15% 14% Total Operating Expenses 98,724 171,411 171,744 144,460 122,416 (15%) 24% 14[1]] Approximately $10 million of Q2’26 provision for credit losses is attributable to accounts originated in Q1’26 that are associated with an identified fraud-related activity.
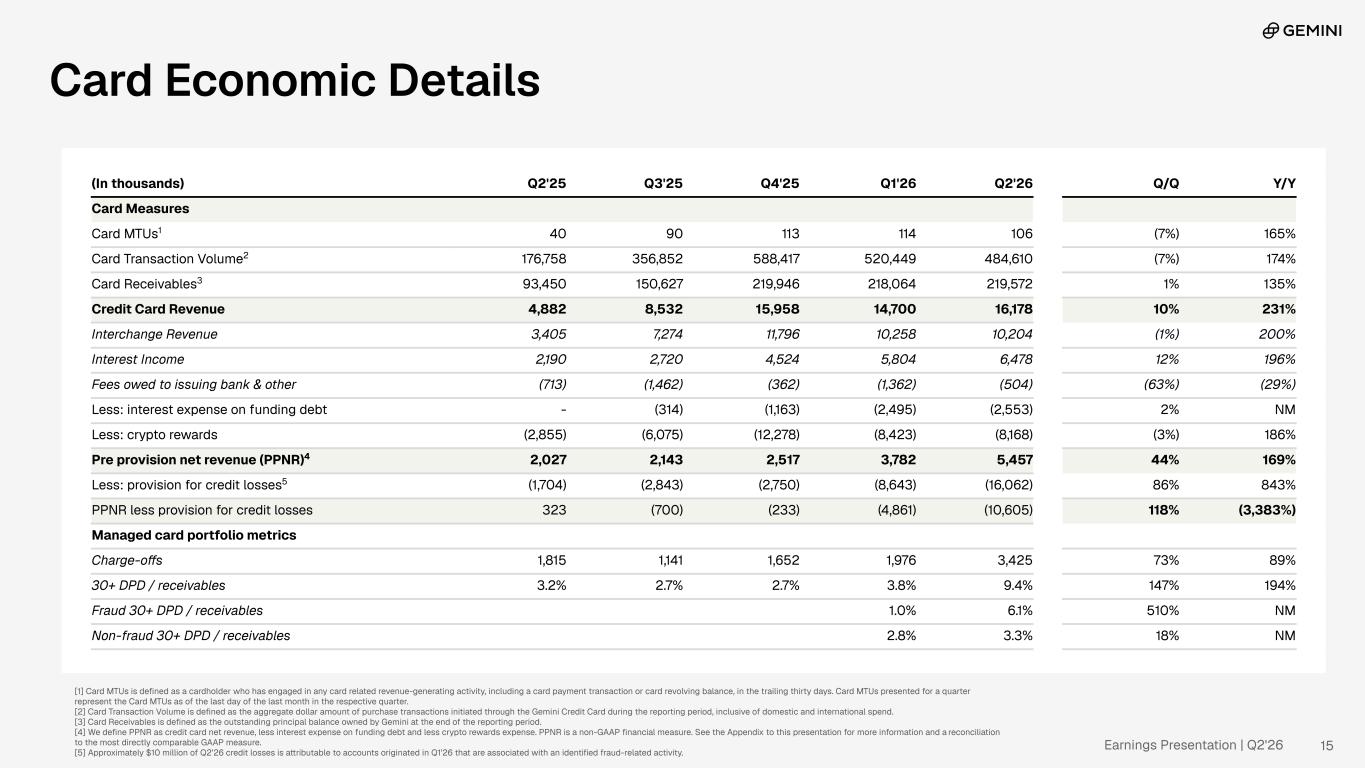
Earnings Presentation | Q2'26 [1] Card MTUs is defined as a cardholder who has engaged in any card related revenue-generating activity, including a card payment transaction or card revolving balance, in the trailing thirty days. Card MTUs presented for a quarter represent the Card MTUs as of the last day of the last month in the respective quarter. [2] Card Transaction Volume is defined as the aggregate dollar amount of purchase transactions initiated through the Gemini Credit Card during the reporting period, inclusive of domestic and international spend. [3] Card Receivables is defined as the outstanding principal balance owned by Gemini at the end of the reporting period. [4] We define PPNR as credit card net revenue, less interest expense on funding debt and less crypto rewards expense. PPNR is a non-GAAP financial measure. See the Appendix to this presentation for more information and a reconciliation to the most directly comparable GAAP measure. [5] Approximately $10 million of Q2’26 credit losses is attributable to accounts originated in Q1’26 that are associated with an identified fraud-related activity. 15 (In thousands) Q2'25 Q3'25 Q4'25 Q1'26 Q2'26 Q/Q Y/Y Card Measures Card MTUs1 40 90 113 114 106 (7%) 165% Card Transaction Volume2 176,758 356,852 588,417 520,449 484,610 (7%) 174% Card Receivables3 93,450 150,627 219,946 218,064 219,572 1% 135% Credit Card Revenue 4,882 8,532 15,958 14,700 16,178 10% 231% Interchange Revenue 3,405 7,274 11,796 10,258 10,204 (1%) 200% Interest Income 2,190 2,720 4,524 5,804 6,478 12% 196% Fees owed to issuing bank & other (713) (1,462) (362) (1,362) (504) (63%) (29%) Less: interest expense on funding debt - (314) (1,163) (2,495) (2,553) 2% NM Less: crypto rewards (2,855) (6,075) (12,278) (8,423) (8,168) (3%) 186% Pre provision net revenue (PPNR)4 2,027 2,143 2,517 3,782 5,457 44% 169% Less: provision for credit losses5 (1,704) (2,843) (2,750) (8,643) (16,062) 86% 843% PPNR less provision for credit losses 323 (700) (233) (4,861) (10,605) 118% (3,383%) Managed card portfolio metrics Charge-offs 1,815 1,141 1,652 1,976 3,425 73% 89% 30+ DPD / receivables 3.2% 2.7% 2.7% 3.8% 9.4% 147% 194% Fraud 30+ DPD / receivables 1.0% 6.1% 510% NM Non-fraud 30+ DPD / receivables 2.8% 3.3% 18% NM Card Economic Details
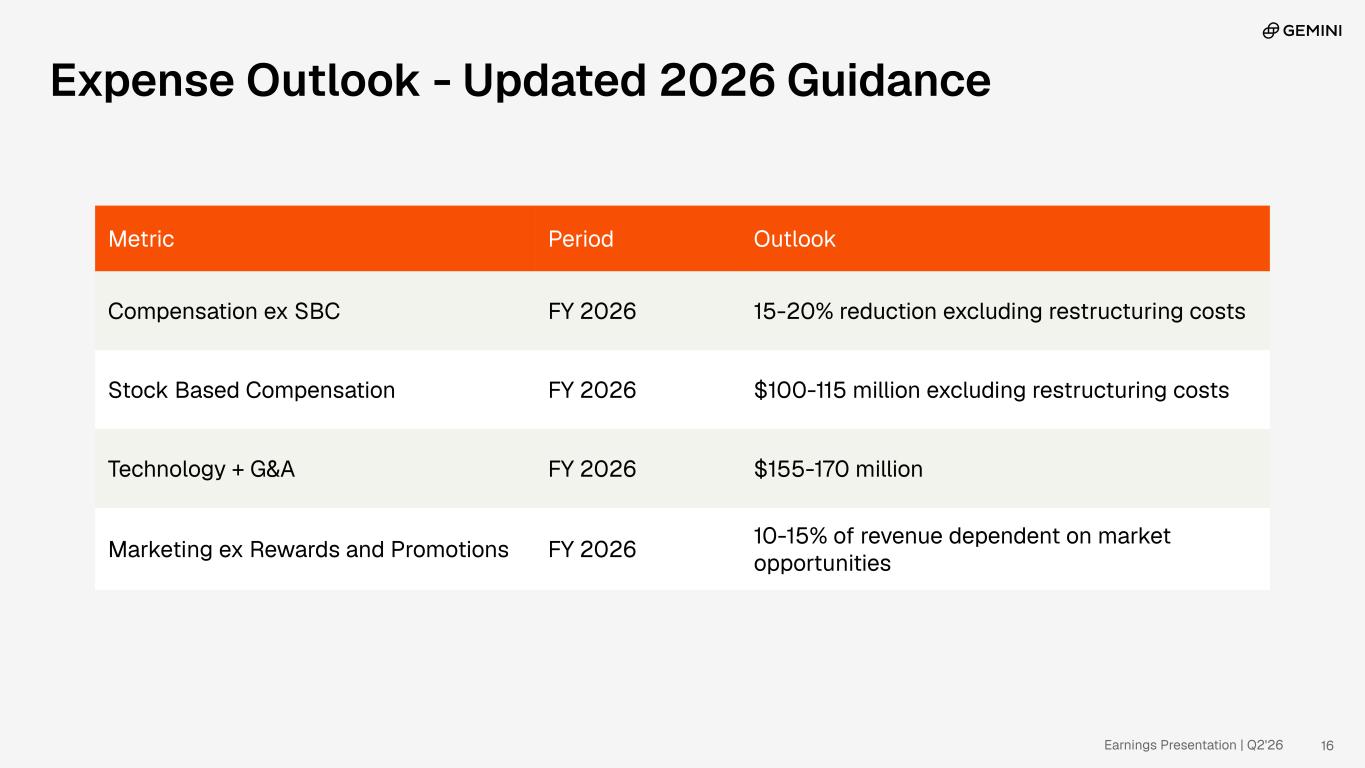
Earnings Presentation | Q2'26 Metric Period Outlook Compensation ex SBC FY 2026 15-20% reduction excluding restructuring costs Stock Based Compensation FY 2026 $100-115 million excluding restructuring costs Technology + G&A FY 2026 $155-170 million Marketing ex Rewards and Promotions FY 2026 10-15% of revenue dependent on market opportunities 16 Expense Outlook - Updated 2026 Guidance
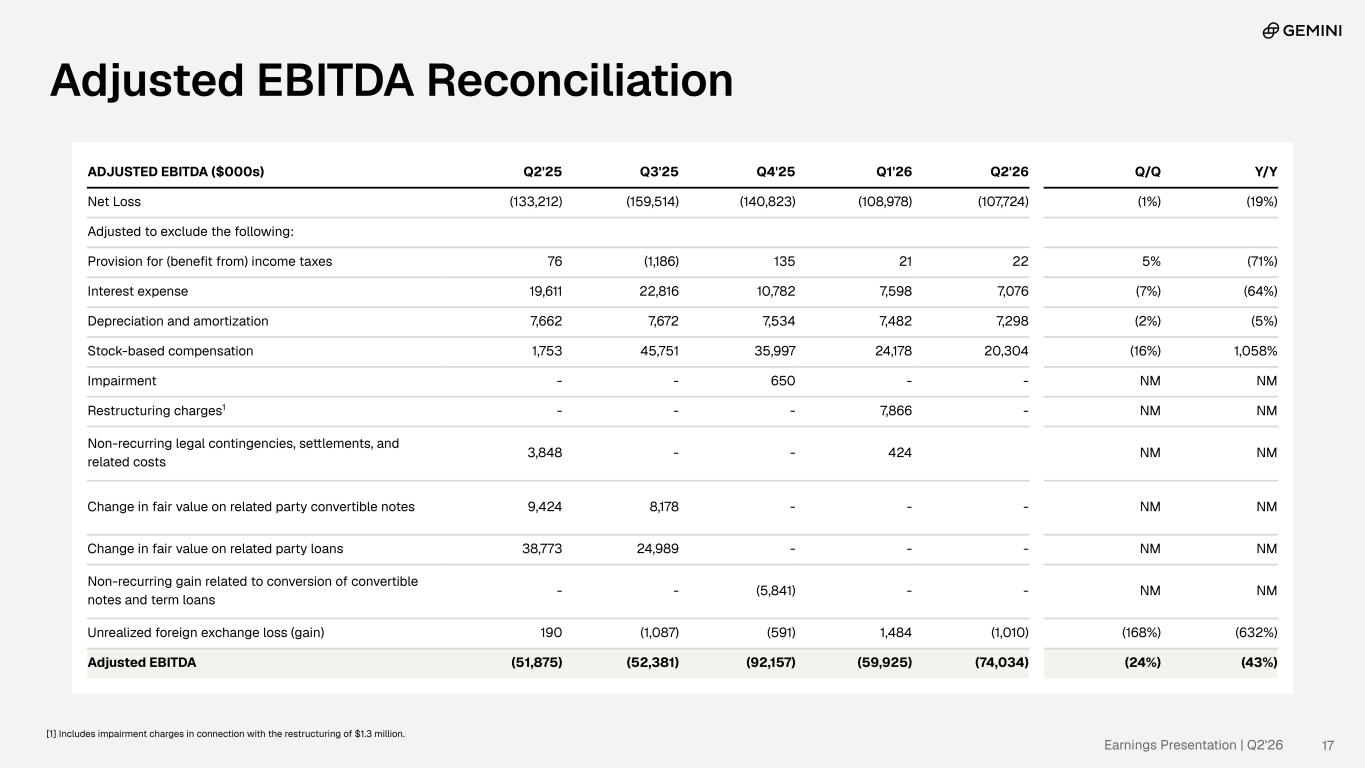
Earnings Presentation | Q2'26 ADJUSTED EBITDA ($000s) Q2'25 Q3'25 Q4'25 Q1'26 Q2'26 Q/Q Y/Y Net Loss (133,212) (159,514) (140,823) (108,978) (107,724) (1%) (19%) Adjusted to exclude the following: Provision for (benefit from) income taxes 76 (1,186) 135 21 22 5% (71%) Interest expense 19,611 22,816 10,782 7,598 7,076 (7%) (64%) Depreciation and amortization 7,662 7,672 7,534 7,482 7,298 (2%) (5%) Stock-based compensation 1,753 45,751 35,997 24,178 20,304 (16%) 1,058% Impairment - - 650 - - NM NM Restructuring charges1 - - - 7,866 - NM NM Non-recurring legal contingencies, settlements, and related costs 3,848 - - 424 NM NM Change in fair value on related party convertible notes 9,424 8,178 - - - NM NM Change in fair value on related party loans 38,773 24,989 - - - NM NM Non-recurring gain related to conversion of convertible notes and term loans - - (5,841) - - NM NM Unrealized foreign exchange loss (gain) 190 (1,087) (591) 1,484 (1,010) (168%) (632%) Adjusted EBITDA (51,875) (52,381) (92,157) (59,925) (74,034) (24%) (43%) 17 Adjusted EBITDA Reconciliation [1] Includes impairment charges in connection with the restructuring of $1.3 million.
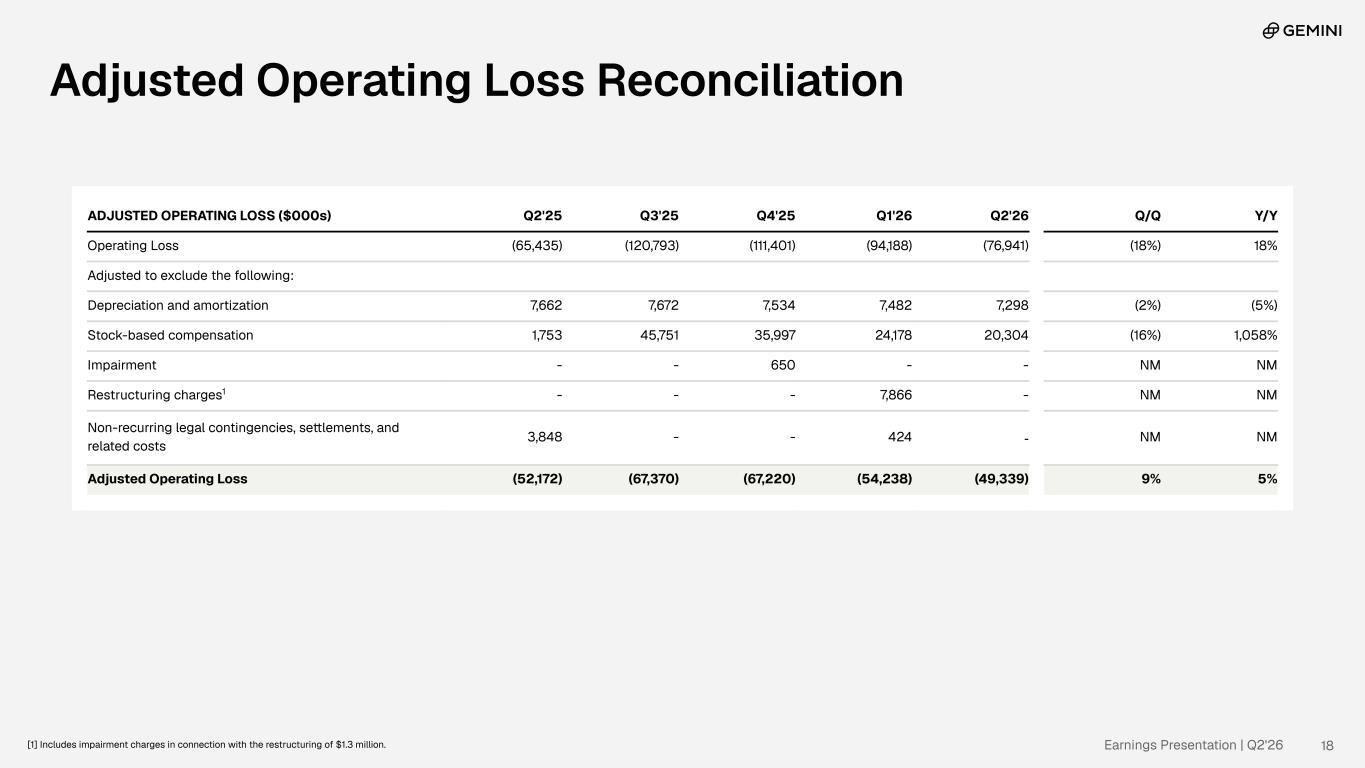
Earnings Presentation | Q2'26 ADJUSTED OPERATING LOSS ($000s) Q2'25 Q3'25 Q4'25 Q1'26 Q2'26 Q/Q Y/Y Operating Loss (65,435) (120,793) (111,401) (94,188) (76,941) (18%) 18% Adjusted to exclude the following: Depreciation and amortization 7,662 7,672 7,534 7,482 7,298 (2%) (5%) Stock-based compensation 1,753 45,751 35,997 24,178 20,304 (16%) 1,058% Impairment - - 650 - - NM NM Restructuring charges1 - - - 7,866 - NM NM Non-recurring legal contingencies, settlements, and related costs 3,848 - - 424 - NM NM Adjusted Operating Loss (52,172) (67,370) (67,220) (54,238) (49,339) 9% 5% 18 Adjusted Operating Loss Reconciliation [1] Includes impairment charges in connection with the restructuring of $1.3 million.
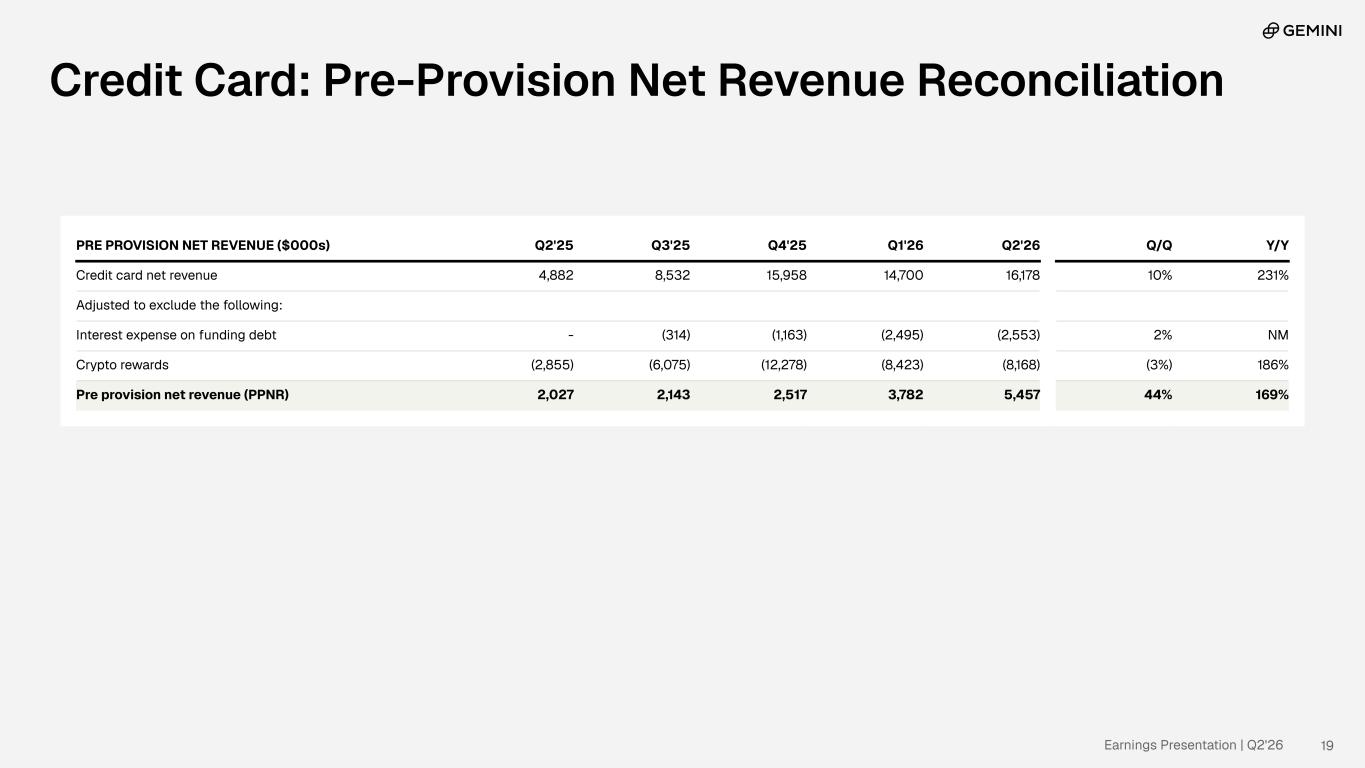
Earnings Presentation | Q2'26 19 PRE PROVISION NET REVENUE ($000s) Q2'25 Q3'25 Q4'25 Q1'26 Q2'26 Q/Q Y/Y Credit card net revenue 4,882 8,532 15,958 14,700 16,178 10% 231% Adjusted to exclude the following: Interest expense on funding debt - (314) (1,163) (2,495) (2,553) 2% NM Crypto rewards (2,855) (6,075) (12,278) (8,423) (8,168) (3%) 186% Pre provision net revenue (PPNR) 2,027 2,143 2,517 3,782 5,457 44% 169% Credit Card: Pre-Provision Net Revenue Reconciliation
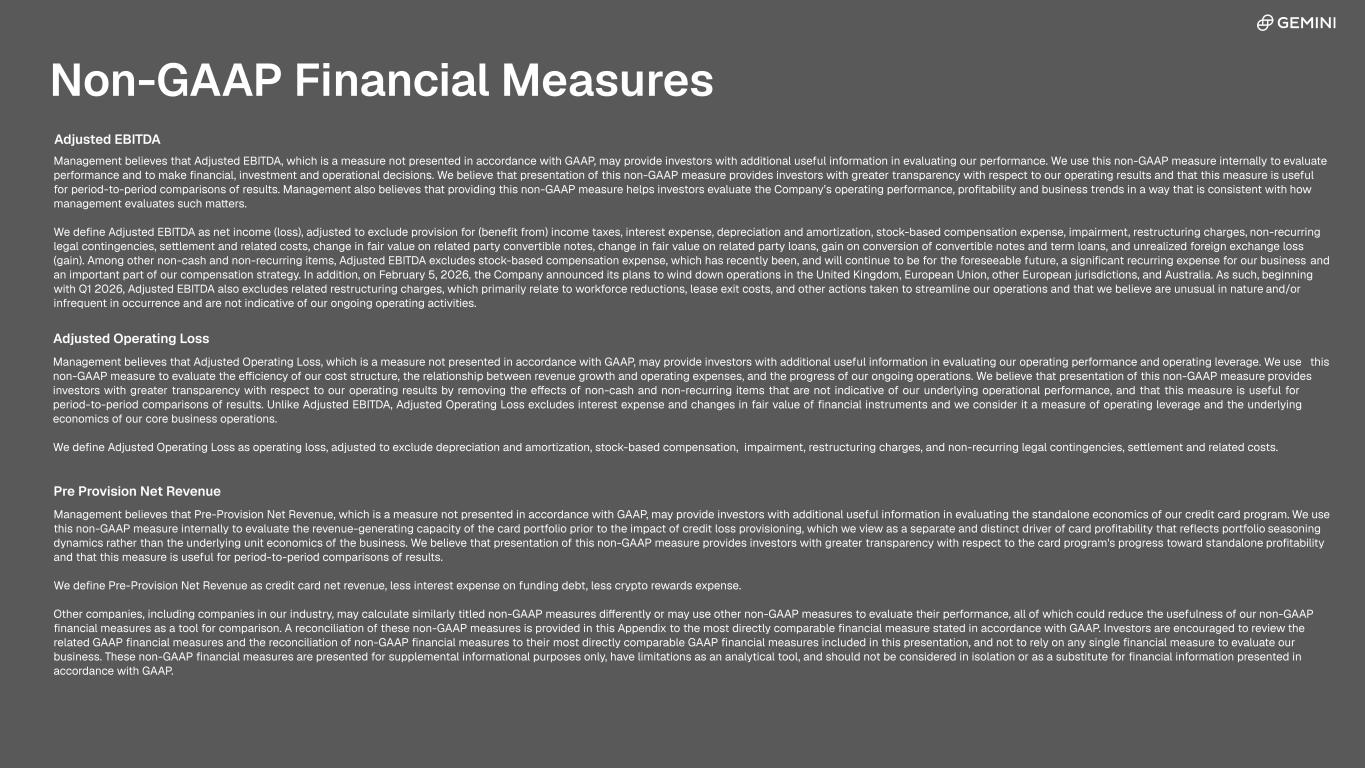
Adjusted EBITDA Management believes that Adjusted EBITDA, which is a measure not presented in accordance with GAAP, may provide investors with additional useful information in evaluating our performance. We use this non-GAAP measure internally to evaluate performance and to make financial, investment and operational decisions. We believe that presentation of this non-GAAP measure provides investors with greater transparency with respect to our operating results and that this measure is useful for period-to-period comparisons of results. Management also believes that providing this non-GAAP measure helps investors evaluate the Company’s operating performance, profitability and business trends in a way that is consistent with how management evaluates such matters. We define Adjusted EBITDA as net income (loss), adjusted to exclude provision for (benefit from) income taxes, interest expense, depreciation and amortization, stock-based compensation expense, impairment, restructuring charges, non-recurring legal contingencies, settlement and related costs, change in fair value on related party convertible notes, change in fair value on related party loans, gain on conversion of convertible notes and term loans, and unrealized foreign exchange loss (gain). Among other non-cash and non-recurring items, Adjusted EBITDA excludes stock-based compensation expense, which has recently been, and will continue to be for the foreseeable future, a significant recurring expense for our business and an important part of our compensation strategy. In addition, on February 5, 2026, the Company announced its plans to wind down operations in the United Kingdom, European Union, other European jurisdictions, and Australia. As such, beginning with Q1 2026, Adjusted EBITDA also excludes related restructuring charges, which primarily relate to workforce reductions, lease exit costs, and other actions taken to streamline our operations and that we believe are unusual in nature and/or infrequent in occurrence and are not indicative of our ongoing operating activities. Adjusted Operating Loss Management believes that Adjusted Operating Loss, which is a measure not presented in accordance with GAAP, may provide investors with additional useful information in evaluating our operating performance and operating leverage. We use this non-GAAP measure to evaluate the efficiency of our cost structure, the relationship between revenue growth and operating expenses, and the progress of our ongoing operations. We believe that presentation of this non-GAAP measure provides investors with greater transparency with respect to our operating results by removing the effects of non-cash and non-recurring items that are not indicative of our underlying operational performance, and that this measure is useful for period-to-period comparisons of results. Unlike Adjusted EBITDA, Adjusted Operating Loss excludes interest expense and changes in fair value of financial instruments and we consider it a measure of operating leverage and the underlying economics of our core business operations. We define Adjusted Operating Loss as operating loss, adjusted to exclude depreciation and amortization, stock-based compensation, impairment, restructuring charges, and non-recurring legal contingencies, settlement and related costs. Pre Provision Net Revenue Management believes that Pre-Provision Net Revenue, which is a measure not presented in accordance with GAAP, may provide investors with additional useful information in evaluating the standalone economics of our credit card program. We use this non-GAAP measure internally to evaluate the revenue-generating capacity of the card portfolio prior to the impact of credit loss provisioning, which we view as a separate and distinct driver of card profitability that reflects portfolio seasoning dynamics rather than the underlying unit economics of the business. We believe that presentation of this non-GAAP measure provides investors with greater transparency with respect to the card program's progress toward standalone profitability and that this measure is useful for period-to-period comparisons of results. We define Pre-Provision Net Revenue as credit card net revenue, less interest expense on funding debt, less crypto rewards expense. Other companies, including companies in our industry, may calculate similarly titled non-GAAP measures differently or may use other non-GAAP measures to evaluate their performance, all of which could reduce the usefulness of our non-GAAP financial measures as a tool for comparison. A reconciliation of these non-GAAP measures are provided in this Appendix to the most directly comparable financial measure stated in accordance with GAAP. Investors are encouraged to review the related GAAP financial measures and the reconciliation of non-GAAP financial measures to their most directly comparable GAAP financial measures included in this presentation, and not to rely on any single financial measure to evaluate our business. These non-GAAP financial measures are presented for supplemental informational purposes only, have limitations as an analytical tool, and should not be considered in isolation or as a substitute for financial information presented in accordance with GAAP. 20 Non-GAAP Financial Measures Adjusted EBITDA Management believes that Adjusted EBITDA, which is a measure not presented in accordance with GAAP, may provide investors with additional useful information in evaluating our performance. We use this non-GAAP measure internally to evaluate performance and to make financial, investment and operational decisions. We believe that presentation of this non-GAAP measure provides investors with greater transparency with respect to our operating results and that this measure is useful for period-to-period comparisons of results. Management also believes that providing this non-GAAP measure helps investors evaluate the Company’s operating performance, profitability and business trends in a way that is consistent with how management evaluates such matters. We define Adjusted EBITDA as net income (loss), adjusted to exclude provision for (benefit from) income taxes, interest expense, depreciation and amortization, stock-based compensation expense, impairment, restructuring charges, non-recurring legal contingencies, settlement and related costs, change in fair value on related party convertible notes, change in fair value on related party loans, gain on conversion of convertible notes and term loans, and unrealized foreign exchange loss (gain). Among other non-cash and non-recurring items, Adjusted EBITDA excludes stock-based compensation expense, which has recently been, and will continue to be for the foreseeable future, a significant recurring expense for our business and an important part of our compensation strategy. In addition, on February 5, 2026, the Company announced its plans to wind down operations in the United Kingdom, European Union, other European jurisdictions, and Australia. As such, beginning with Q1 2026, Adjusted EBITDA also excludes related restructuring charges, which primarily relate to workforce reductions, lease exit costs, and other actions taken to streamline our operations and that we believe are unusual in nature and/or infrequent in occurrence and are not indicative of our ongoing operating activities. Adjusted Operating Loss Management believes that Adjusted Operating Loss, which is a measure not presented in accordance with GAAP, may provide investors with additional useful information in evaluating our operating performance and operating leverage. We use this non-GAAP measure to evaluate the efficiency of our cost structure, the relationship between revenue growth and operating expenses, and the progress of our ongoing operations. We believe that presentation of this non-GAAP measure provides investors with greater transparency with respect to our operating results by removing the effects of non-cash and non-recurring items that are not indicative of our underlying operational performance, and that this measure is useful for period-to-period comparisons of results. Unlike Adjusted EBITDA, Adjusted Operating Loss excludes interest expense and changes in fair value of financial instruments and we consider it a measure of operating leverage and the underlying economics of our core business operations. We define Adjusted Operating Loss as operating loss, adjusted to exclude depreciation and amortization, stock-based compensation, impairment, restructuring charges, and non-recurring legal contingencies, settlement and related costs. Management believes that Pre-Provision Net Revenue, which is a measure not presented in accordance with GAAP, may provide investors with additional useful information in evaluating the standalone economics of our credit card program. We use this non-GAAP measure internally to evaluate the revenue-generating capacity of the card portfolio prior to the impact of credit loss provisioning, which we view as a separate and distinct driver of card profitability that reflects portfolio seasoning dynamics rather than the underlying unit economics of the business. We believe that presentation of this non-GAAP measure provides investors with greater transparency with respect to the card program's progress toward standalone profitability and that this measure is useful for period-to-period comparisons of results. We define Pre-Provision Net Revenue as credit card net revenue, less interest expense on funding debt, less crypto rewards expense. Other companies, including companies in our industry, may calculate similarly titled non-GAAP measures differently or may use other non-GAAP measures to evaluate their performance, all of which could reduce the usefulness of our non-GAAP financial measures as a tool for comparison. A reconciliation of these non-GAAP measures is provided in this Appendix to the most directly comparable financial measure stated in accordance with GAAP. Investors are encouraged to review the related GAAP financial measures and the reconciliation of non-GAAP financial measures to their most directly comparable GAAP financial measures included in this presentation, and not to rely on any single financial measure to evaluate our business. These non-GAAP financial measures are presented for supplemental informational purposes only, have limitations as an analytical tool, and should not be considered in isolation or as a substitute for financial information presented in accordance with GAAP. Pre Provision Net Revenue


Earnings Presentation | Q2'26 22