$ in Thousands
Pay Versus Performance
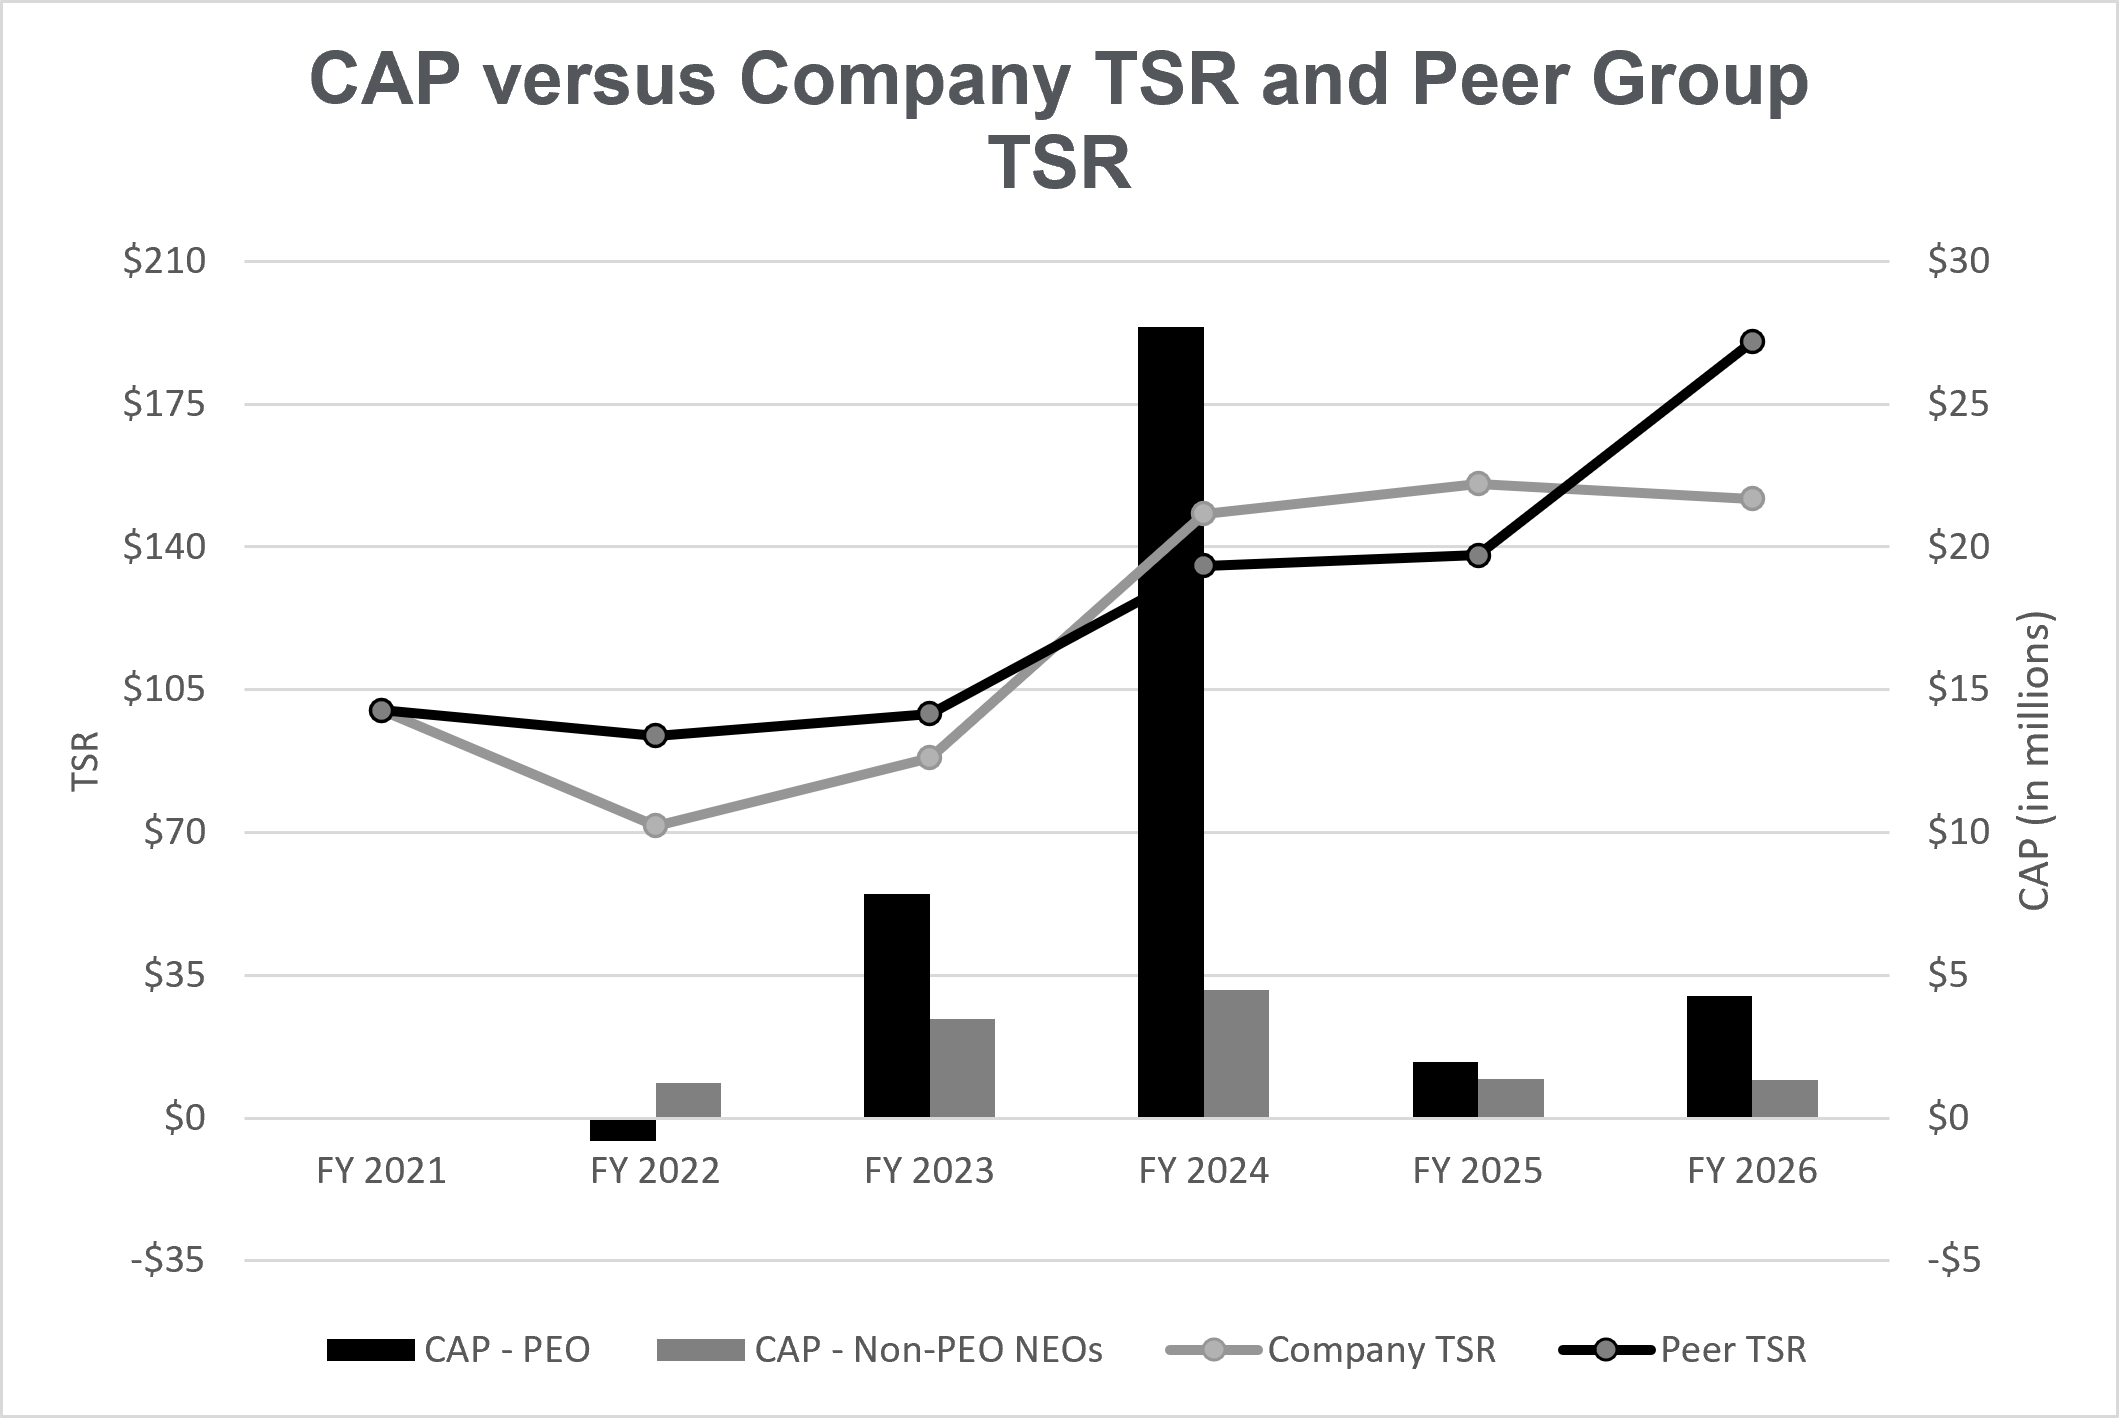
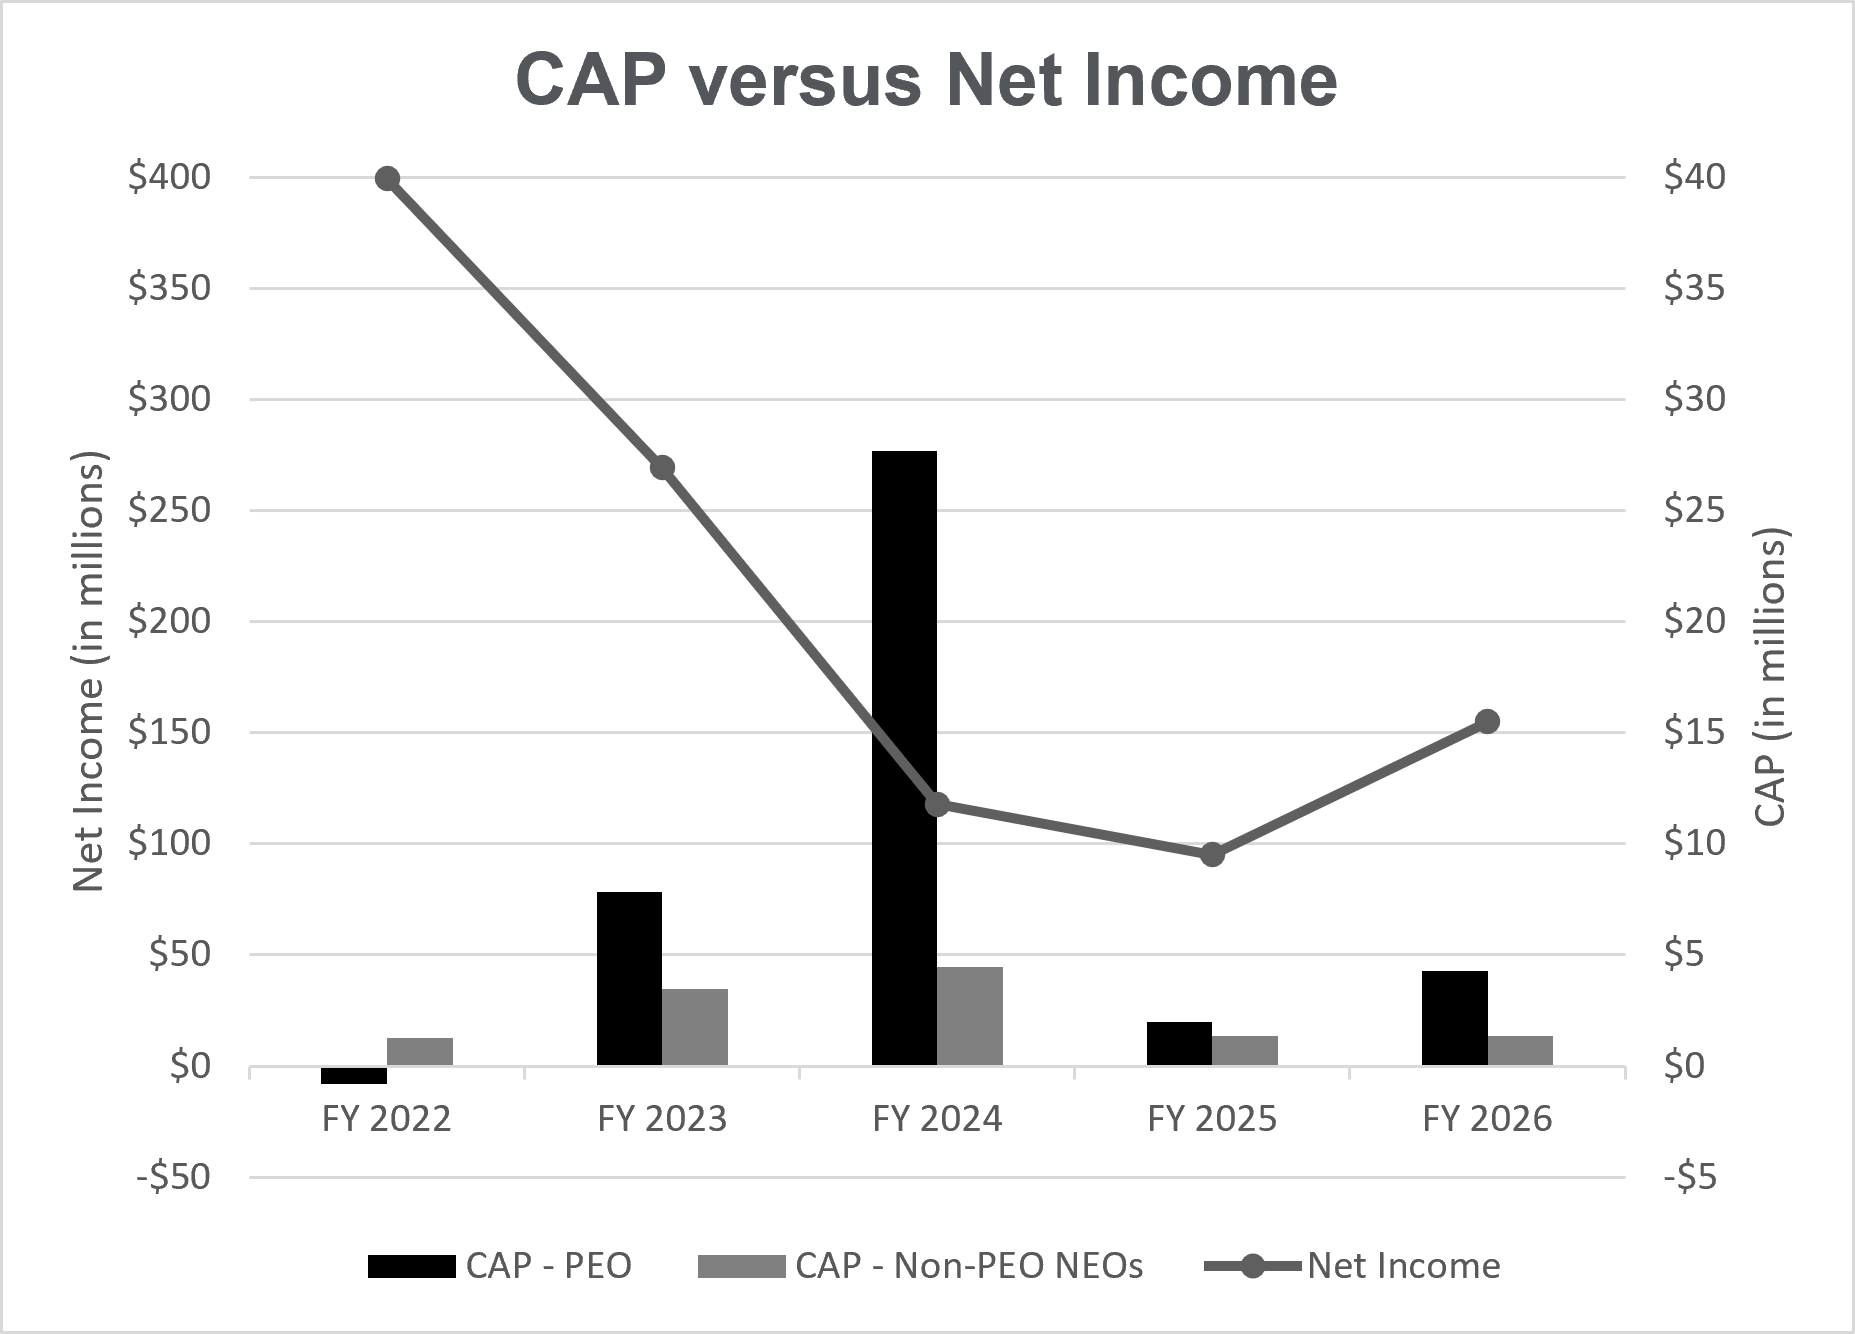
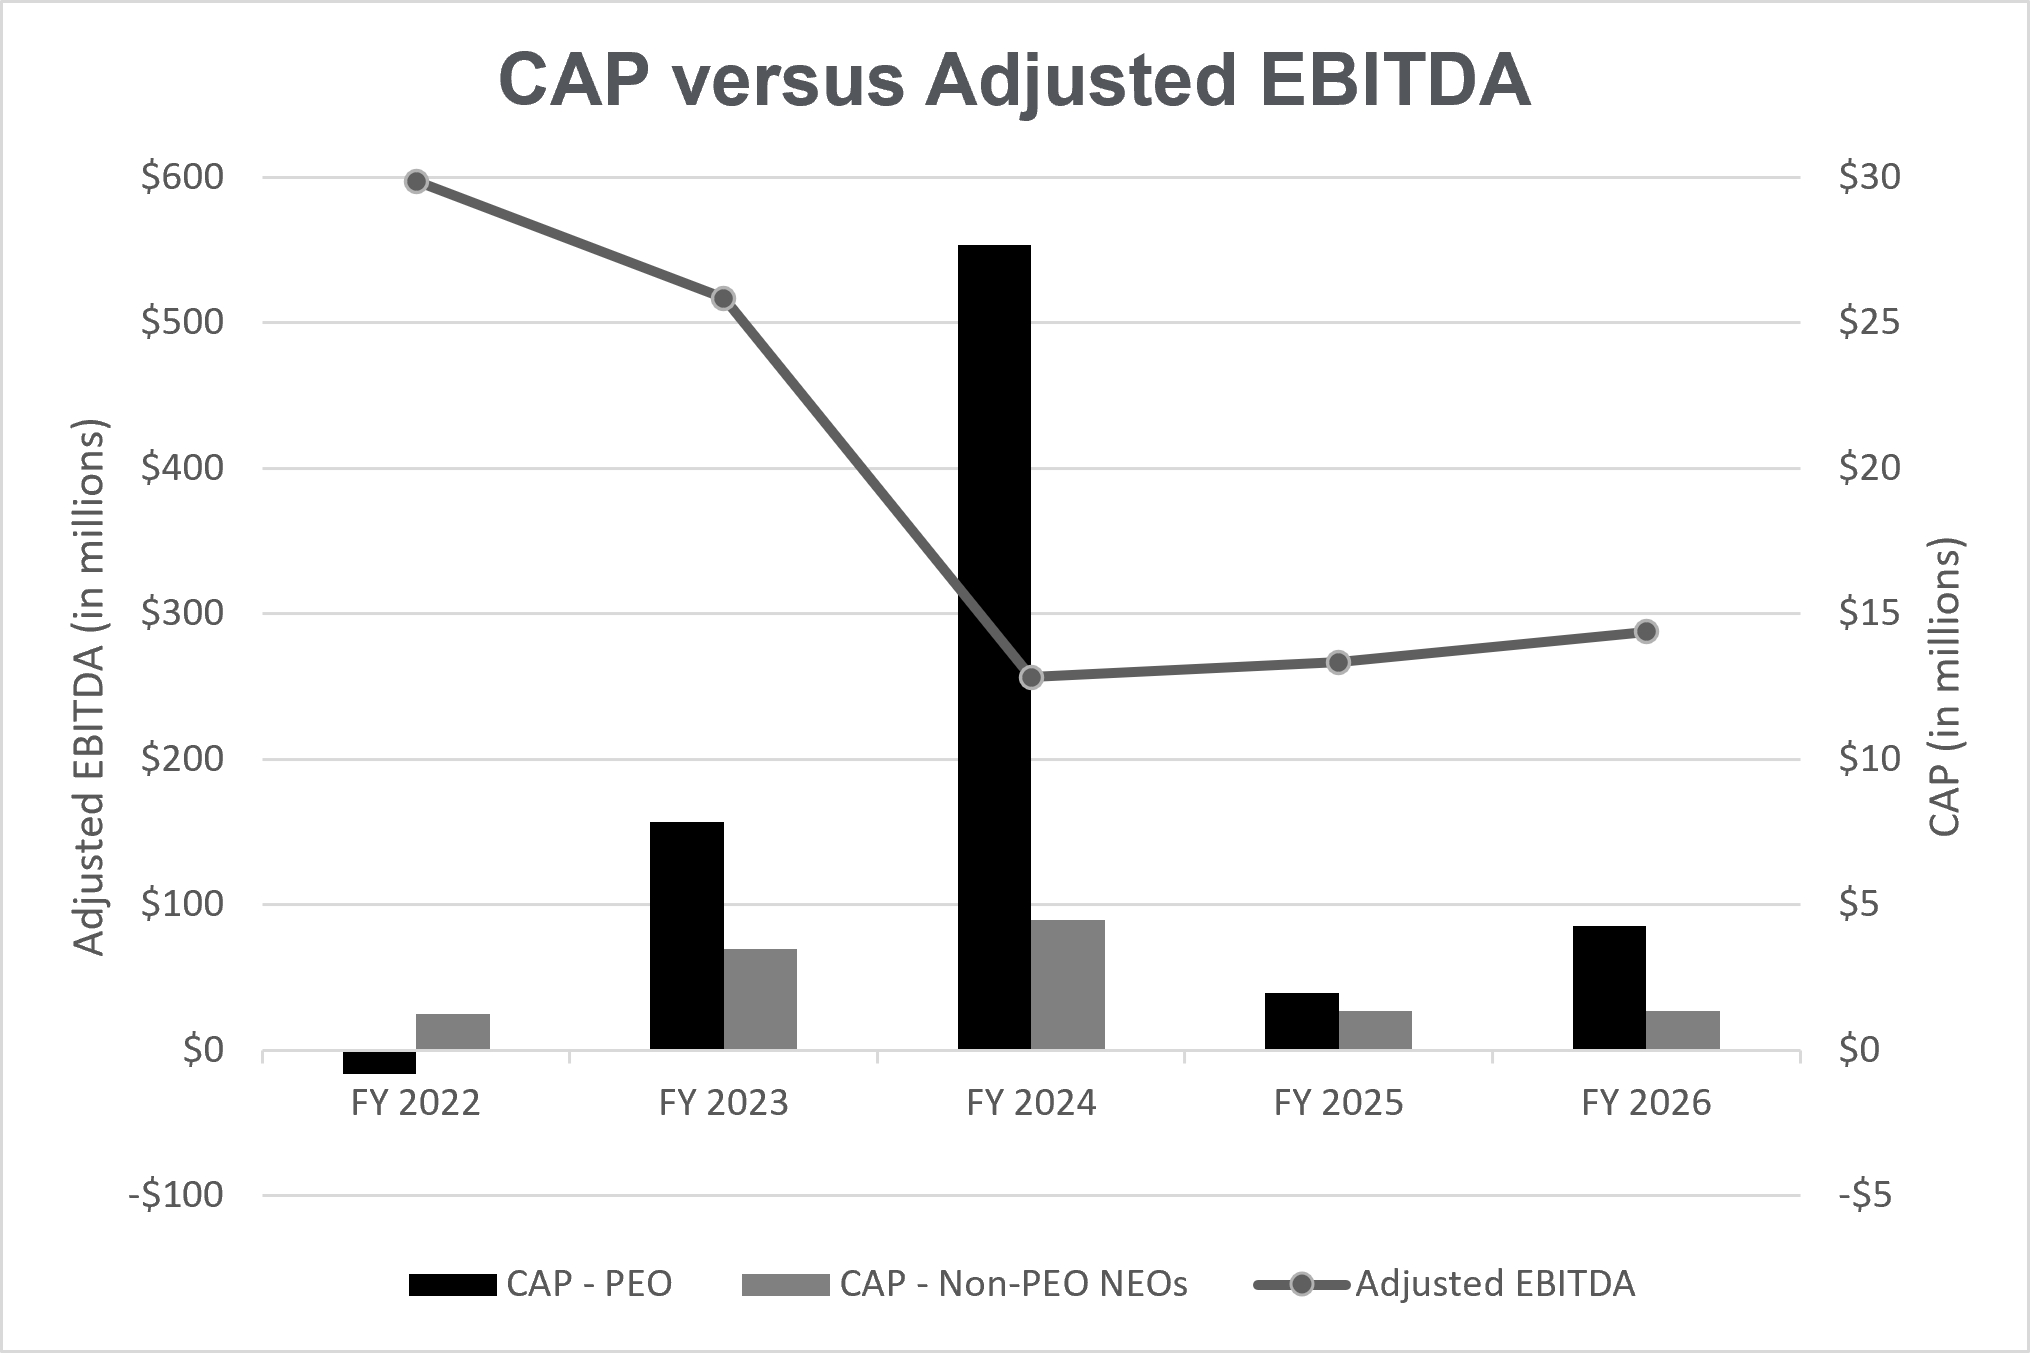
As required by SEC Rules, we are providing the following information about the relationship between the CAP to our NEOs and certain financial performance measures. The CAP for the NEOs as reported in this section of this Proxy Statement does not reflect the actual amount of compensation earned by, or paid to, the NEOs, but is a calculation derived from the total compensation reported for each NEO in the SCT, as adjusted pursuant to the requirements of SEC Rules. See the CD&A section of this Proxy Statement for a discussion of our pay-for-performance philosophy.
|
Summary Compensation Table Total for PEOs (1) ($) |
Compensation Actually Paid to PEOs (2) ($) |
|
|
Value of Initial Fixed $100 Investment Based On: |
|
|
|||
Fiscal Year |
Mr. Hayek |
Mr. Rose |
Mr. Hayek |
Mr. Rose |
Average Summary Compensation Table Total for Non-PEO NEOs(3) ($) |
Average Compensation Actually Paid to Non-PEO NEOs(4) ($) |
Total Shareholder Return |
Peer Total Shareholder Return |
Net Income (millions) (7) ($) |
Adjusted EBITDA |
(a) |
(b) |
(b) |
(c ) |
(c ) |
(d) |
(e) |
(f) |
(g) |
(h) |
(i) |
2026 |
5,192,043 |
Not PEO |
4,257,324 |
Not PEO |
1,849,114 |
1,345,730 |
152 |
190 |
155 |
288 |
2025 |
4,338,066 |
4,267,443 |
2,875,157 |
(899,157) |
1,329,859 |
1,351,352 |
155 |
138 |
95 |
267 |
2024 |
Not PEO |
10,110,968 |
Not PEO |
27,685,961 |
2,928,340 |
4,467,672 |
148 |
135 |
118 |
256 |
2023 |
Not PEO |
7,279,786 |
Not PEO |
7,845,434 |
2,769,306 |
3,481,422 |
88 |
99 |
269 |
517 |
2022 |
Not PEO |
7,537,924 |
Not PEO |
(804,417) |
3,498,233 |
1,237,527 |
72 |
94 |
399 |
597 |
(1) The dollar amounts in columns (b) reflect the amounts reported in the “Total” column of the SCT for our PEO, who is our President and CEO, for each applicable year. Mr. Hayek has served as our PEO since November 1, 2024 and B. Andrew Rose served as our PEO from September 1, 2020 to November 1, 2024 (i.e., each executive served in such role for a portion of fiscal 2025).
(2) The dollar amounts in columns (c) reflect the CAP for our PEO for each applicable year. In accordance with SEC Rules, the determination of CAP requires the following adjustments to the amounts reported for Mr. Hayek and Mr. Rose in the “Total” column of the SCT:
Required Adjustments from SCT Total to CAP for Mr. Hayek |
||||
Fiscal Year |
Reported Total in SCT For PEO ($) |
Reported Grant Date Fair Value of Equity Awards (i) ($) |
Equity Award Adjustments (ii) ($) |
Calculated CAP for |
2026 |
5,192,043 |
(2,482,435) |
1,547,716 |
4,257,324 |
2025 |
4,338,066 |
(1,905,474) |
442,565 |
2,875,157 |
Required Adjustments from SCT Total to CAP for Mr. Rose |
||||
Fiscal Year |
Reported Total in SCT For PEO ($) |
Reported Grant Date Fair Value of Equity Awards (i) ($) |
Equity Award Adjustments (ii) ($) |
Calculated CAP for |
2025 |
4,267,443 |
(1,442,120) |
(3,724,480) |
(899,157) |
2024 |
10,110,968 |
(4,392,175) |
21,967,168 |
27,685,961 |
2023 |
7,279,786 |
(2,662,604) |
3,228,252 |
7,845,434 |
2022 |
7,537,924 |
(2,867,943) |
(5,474,398) |
(804,417) |
(i) The grant date fair value of equity awards represents the total of the amounts reported in the “Stock Awards” and “Option Awards” columns in the SCT. As required by SEC Rules, this amount is deducted from the amount reported in the “Total” column of the SCT for the PEO in order to calculate the CAP.
(ii) As also prescribed by SEC Rules, we have made equity award adjustments for each year presented, which require the addition or subtraction, as applicable, of the following: (A) the year-end fair value of any equity awards granted in the applicable year that are outstanding and unvested as of the end of the applicable year; (B) the amount of change as of the end of the applicable year (from the end of the prior fiscal year) in fair value of any equity awards granted in prior years that are outstanding and unvested as of the end of the applicable year; (C) for equity awards that are granted and vest in the same applicable year, the fair value as of the vesting date; (D) for equity awards granted in prior years that vest in the applicable year, the amount equal to the change as of the vesting date (from the end of the prior fiscal year) in fair value; (E) for equity awards granted in prior years that are determined to fail to meet the applicable vesting conditions during the applicable year, a deduction for the amount equal to the fair value at the end of the
prior fiscal year; and (F) the dollar value of any dividends or other earnings paid on stock or option awards in the applicable year prior to the vesting date that are not otherwise reflected in the fair value of such award or included in any other component of total compensation for the applicable year. The valuation assumptions used to calculate fair values did not materially differ from those disclosed at the time of grant. The amounts added or subtracted in calculating the required equity award adjustments for our PEOs are as follows:
Fiscal Year |
Year-End Fair Value of Equity Awards Granted in the Year and Outstanding and Unvested at Year End (A) ($) |
Year Over Year Change in Fair Value of Outstanding and Unvested Equity Awards (B) ($) |
Fair Value as of Vesting Date of Equity Awards Granted and Vested in the Year (C) ($) |
Year Over Year Change in Fair Value of Equity Awards Granted in Prior Years that Vested in the Year (D) ($) |
Fair Value at the End of the Prior Year of Equity Awards that Failed to Meet Vesting Conditions in the Year (E) ($) |
Value of Dividends or Other Earnings Paid on Stock or Option Awards not Otherwise Reflected in Fair Value or Total Compensation (F) ($) |
Total Equity Awards Adjustments ($) |
2026 (Hayek) |
2,234,467 |
(834,083) |
0 |
94,730 |
0 |
52,602 |
1,547,716 |
2025 (Hayek) |
2,497,502 |
(173,780) |
0 |
(1,955,071) |
0 |
73,914 |
442,565 |
2025 (Rose) |
0 |
(2,332,567) |
1,357,490 |
(2,749,403) |
0 |
0 |
(3,724,480) |
2024 (Rose) |
5,003,445 |
4,245,134 |
0 |
12,357,334 |
0 |
361,255 |
21,967,168 |
2023 (Rose) |
3,407,374 |
(416,433) |
0 |
(69,886) |
0 |
307,198 |
3,228,252 |
2022 (Rose) |
2,343,172 |
(7,852,083) |
0 |
(230,815) |
0 |
265,328 |
(5,474,398) |
(3) The dollar amounts in column (d) reflect the average of the amounts reported in the “Total” column of the SCT for the Non-PEO NEOs as a group for each applicable year. For fiscal 2022, the Non-PEO NEOs consisted of Mr. Hayek, Mr. Gilmore, John P. McConnell and Catherine M. Lyttle. For fiscal 2023, the Non-PEO NEOs consisted of Mr. Hayek, Mr. Gilmore, Mr. McConnell and Mr. Caravati. For fiscal 2024, the Non-PEO NEOs consisted of Mr. Hayek, Mr. Kennedy, Ms. Higginbotham, Mr. Caravati, Mr. Gilmore and Mr. McConnell. For fiscal 2025 and fiscal 2026, the Non-PEO NEOs consisted of Mr. Souza, Mr. Kennedy, Mr. Caravati, and Mr. Bowes.
(4) The dollar amounts in column (e) reflect the average amount of CAP for the Non-PEO NEOs as a group. In accordance with SEC Rules, the determination of CAP requires the following adjustments to the average of the amounts reported in the “Total” column of the SCT for the Non-PEO NEOs as a group:
Fiscal Year |
Average Reported Total in SCT for Non-PEO NEOs ($) |
Average Reported Grant Date Fair Value of Equity Awards (i) ($) |
Average Equity Award Adjustments (ii) ($) |
Calculated Average CAP For Non-PEO NEOs ($) |
2026 |
1,849,114 |
(778,237) |
274,853 |
1,345,730 |
2025 |
1,329,859 |
(381,448) |
402,941 |
1,351,352 |
2024 |
2,928,340 |
(1,185,555) |
2,724,887 |
4,467,672 |
2023 |
2,769,306 |
(768,787) |
1,480,902 |
3,481,422 |
2022 |
3,498,233 |
(565,211) |
(1,695,495) |
1,237,527 |
(i) The grant date fair value of equity awards represents the average of the total of the amounts reported in the “Stock Awards” and “Option Awards” columns in the SCT. As required by SEC Rules, this amount is deducted from the average of the amount reported in the “Total” column of the SCT for the Non-PEO NEOs in order to calculate the CAP.
(ii) As also prescribed by SEC Rules, we have made equity award adjustments using the same methodology described above in footnote (2)(ii). The valuation assumptions used to calculate fair values did not materially differ from those disclosed at the time of grant. The amounts added or subtracted in calculating the required equity award adjustments for the Non-PEO NEOs are as follows:
Fiscal Year |
Average Year-End Fair Value of Equity Awards Granted in the Year and Outstanding and Unvested at Year End (A) ($) |
Year Over Year Average Change in Fair Value of Outstanding and Unvested Equity Awards (B) ($) |
Average Fair Value as of Vesting Date of Equity Awards Granted and Vested in the Year (C) ($) |
Year Over Year Average Change in Fair Value of Equity Awards Granted in Prior Years that Vested in the Year (D) ($) |
Average Fair Value at the End of the Prior Year of Equity Awards that Failed to Meet Vesting Conditions in the Year (E) ($) |
Average Value of Dividends or Other Earnings Paid on Stock or Option Awards not Otherwise Reflected in Fair Value or Total Compensation (F) ($) |
Total Average Equity Award Adjustments ($) |
2026 |
563,540 |
(291,605) |
n/a |
(8,382) |
0 |
11,301 |
274,853 |
2025 |
489,279 |
(58,295) |
n/a |
(42,989) |
0 |
14,947 |
402,941 |
2024 |
1,028,997 |
1,113,314 |
n/a |
477,856 |
0 |
104,720 |
2,724,887 |
2023 |
983,827 |
440,250 |
n/a |
(27,714) |
0 |
84,540 |
1,480,902 |
2022 |
430,048 |
(1,955,171) |
n/a |
(260,988) |
0 |
90,615 |
(1,695,495) |
(5) TSR is calculated by dividing the sum of the cumulative amount of dividends for the measurement period, assuming dividend reinvestment, and the difference between the price of our common shares at the end and the beginning of the measurement period by the price of our common shares at the beginning of the measurement period. Assumes an initial investment of $100 on May 29, 2021, the last trading day of fiscal 2021. The historical prices presented in this column have been adjusted to reflect the impact of the Separation. The data in this column is not indicative of, nor intended to forecast, the future performance of our common shares.
(6) Represents the weighted peer group TSR, weighted according to the respective companies’ stock market capitalization at the beginning of each period for which a return is indicated. The peer group used for this purpose is the Industrials Index, which is the same published industry index used by us for purposes of compliance with Item 201(e)(1)(ii) of SEC Regulation S-K. In addition, peer group TSR is calculated using the same method we use for purposes of compliance with Item 201(e) of SEC Regulation S-K. Assumes an initial investment of $100 on May 29, 2021, the last trading day of fiscal 2021.
(7) The dollar amounts reported represent the amount of net income reflected in our audited consolidated financial statements for the applicable year, each as calculated in accordance with GAAP. The amounts shown are inclusive of WS for all periods prior to the effective date of the Separation.
(8) The CSM is Adjusted EBITDA. Adjusted EBITDA is a non-GAAP financial measure, and may differ from the adjusted earnings that we report in connection with our operating results, primarily due to the exclusion of the impact of acquisitions, divestitures, restructuring, and/or inventory holding gains or losses. We believe this and other non-GAAP financial measures provide relevant and meaningful information to investors about our core operating results. While we use several financial and non-financial performance measures for the purpose of evaluating our executive compensation program, we have determined that Adjusted EBITDA is the financial performance measure that represents the most important performance measure used by us to link CAP for the NEOs, for the most recently completed year, to our performance. The amounts shown are inclusive of WS for all periods prior to the Separation.
(1) The dollar amounts in columns (b) reflect the amounts reported in the “Total” column of the SCT for our PEO, who is our President and CEO, for each applicable year. Mr. Hayek has served as our PEO since November 1, 2024 and B. Andrew Rose served as our PEO from September 1, 2020 to November 1, 2024 (i.e., each executive served in such role for a portion of fiscal 2025).
The dollar amounts in column (d) reflect the average of the amounts reported in the “Total” column of the SCT for the Non-PEO NEOs as a group for each applicable year. For fiscal 2022, the Non-PEO NEOs consisted of Mr. Hayek, Mr. Gilmore, John P. McConnell and Catherine M. Lyttle. For fiscal 2023, the Non-PEO NEOs consisted of Mr. Hayek, Mr. Gilmore, Mr. McConnell and Mr. Caravati. For fiscal 2024, the Non-PEO NEOs consisted of Mr. Hayek, Mr. Kennedy, Ms. Higginbotham, Mr. Caravati, Mr. Gilmore and Mr. McConnell. For fiscal 2025 and fiscal 2026, the Non-PEO NEOs consisted of Mr. Souza, Mr. Kennedy, Mr. Caravati, and Mr. Bowes.(2) The dollar amounts in columns (c) reflect the CAP for our PEO for each applicable year. In accordance with SEC Rules, the determination of CAP requires the following adjustments to the amounts reported for Mr. Hayek and Mr. Rose in the “Total” column of the SCT:
Required Adjustments from SCT Total to CAP for Mr. Hayek |
||||
Fiscal Year |
Reported Total in SCT For PEO ($) |
Reported Grant Date Fair Value of Equity Awards (i) ($) |
Equity Award Adjustments (ii) ($) |
Calculated CAP for |
2026 |
5,192,043 |
(2,482,435) |
1,547,716 |
4,257,324 |
2025 |
4,338,066 |
(1,905,474) |
442,565 |
2,875,157 |
Required Adjustments from SCT Total to CAP for Mr. Rose |
||||
Fiscal Year |
Reported Total in SCT For PEO ($) |
Reported Grant Date Fair Value of Equity Awards (i) ($) |
Equity Award Adjustments (ii) ($) |
Calculated CAP for |
2025 |
4,267,443 |
(1,442,120) |
(3,724,480) |
(899,157) |
2024 |
10,110,968 |
(4,392,175) |
21,967,168 |
27,685,961 |
2023 |
7,279,786 |
(2,662,604) |
3,228,252 |
7,845,434 |
2022 |
7,537,924 |
(2,867,943) |
(5,474,398) |
(804,417) |
(i) The grant date fair value of equity awards represents the total of the amounts reported in the “Stock Awards” and “Option Awards” columns in the SCT. As required by SEC Rules, this amount is deducted from the amount reported in the “Total” column of the SCT for the PEO in order to calculate the CAP.
(ii) As also prescribed by SEC Rules, we have made equity award adjustments for each year presented, which require the addition or subtraction, as applicable, of the following: (A) the year-end fair value of any equity awards granted in the applicable year that are outstanding and unvested as of the end of the applicable year; (B) the amount of change as of the end of the applicable year (from the end of the prior fiscal year) in fair value of any equity awards granted in prior years that are outstanding and unvested as of the end of the applicable year; (C) for equity awards that are granted and vest in the same applicable year, the fair value as of the vesting date; (D) for equity awards granted in prior years that vest in the applicable year, the amount equal to the change as of the vesting date (from the end of the prior fiscal year) in fair value; (E) for equity awards granted in prior years that are determined to fail to meet the applicable vesting conditions during the applicable year, a deduction for the amount equal to the fair value at the end of the
prior fiscal year; and (F) the dollar value of any dividends or other earnings paid on stock or option awards in the applicable year prior to the vesting date that are not otherwise reflected in the fair value of such award or included in any other component of total compensation for the applicable year. The valuation assumptions used to calculate fair values did not materially differ from those disclosed at the time of grant. The amounts added or subtracted in calculating the required equity award adjustments for our PEOs are as follows:
Fiscal Year |
Year-End Fair Value of Equity Awards Granted in the Year and Outstanding and Unvested at Year End (A) ($) |
Year Over Year Change in Fair Value of Outstanding and Unvested Equity Awards (B) ($) |
Fair Value as of Vesting Date of Equity Awards Granted and Vested in the Year (C) ($) |
Year Over Year Change in Fair Value of Equity Awards Granted in Prior Years that Vested in the Year (D) ($) |
Fair Value at the End of the Prior Year of Equity Awards that Failed to Meet Vesting Conditions in the Year (E) ($) |
Value of Dividends or Other Earnings Paid on Stock or Option Awards not Otherwise Reflected in Fair Value or Total Compensation (F) ($) |
Total Equity Awards Adjustments ($) |
2026 (Hayek) |
2,234,467 |
(834,083) |
0 |
94,730 |
0 |
52,602 |
1,547,716 |
2025 (Hayek) |
2,497,502 |
(173,780) |
0 |
(1,955,071) |
0 |
73,914 |
442,565 |
2025 (Rose) |
0 |
(2,332,567) |
1,357,490 |
(2,749,403) |
0 |
0 |
(3,724,480) |
2024 (Rose) |
5,003,445 |
4,245,134 |
0 |
12,357,334 |
0 |
361,255 |
21,967,168 |
2023 (Rose) |
3,407,374 |
(416,433) |
0 |
(69,886) |
0 |
307,198 |
3,228,252 |
2022 (Rose) |
2,343,172 |
(7,852,083) |
0 |
(230,815) |
0 |
265,328 |
(5,474,398) |
(4) The dollar amounts in column (e) reflect the average amount of CAP for the Non-PEO NEOs as a group. In accordance with SEC Rules, the determination of CAP requires the following adjustments to the average of the amounts reported in the “Total” column of the SCT for the Non-PEO NEOs as a group:
Fiscal Year |
Average Reported Total in SCT for Non-PEO NEOs ($) |
Average Reported Grant Date Fair Value of Equity Awards (i) ($) |
Average Equity Award Adjustments (ii) ($) |
Calculated Average CAP For Non-PEO NEOs ($) |
2026 |
1,849,114 |
(778,237) |
274,853 |
1,345,730 |
2025 |
1,329,859 |
(381,448) |
402,941 |
1,351,352 |
2024 |
2,928,340 |
(1,185,555) |
2,724,887 |
4,467,672 |
2023 |
2,769,306 |
(768,787) |
1,480,902 |
3,481,422 |
2022 |
3,498,233 |
(565,211) |
(1,695,495) |
1,237,527 |
(i) The grant date fair value of equity awards represents the average of the total of the amounts reported in the “Stock Awards” and “Option Awards” columns in the SCT. As required by SEC Rules, this amount is deducted from the average of the amount reported in the “Total” column of the SCT for the Non-PEO NEOs in order to calculate the CAP.
(ii) As also prescribed by SEC Rules, we have made equity award adjustments using the same methodology described above in footnote (2)(ii). The valuation assumptions used to calculate fair values did not materially differ from those disclosed at the time of grant. The amounts added or subtracted in calculating the required equity award adjustments for the Non-PEO NEOs are as follows:
Fiscal Year |
Average Year-End Fair Value of Equity Awards Granted in the Year and Outstanding and Unvested at Year End (A) ($) |
Year Over Year Average Change in Fair Value of Outstanding and Unvested Equity Awards (B) ($) |
Average Fair Value as of Vesting Date of Equity Awards Granted and Vested in the Year (C) ($) |
Year Over Year Average Change in Fair Value of Equity Awards Granted in Prior Years that Vested in the Year (D) ($) |
Average Fair Value at the End of the Prior Year of Equity Awards that Failed to Meet Vesting Conditions in the Year (E) ($) |
Average Value of Dividends or Other Earnings Paid on Stock or Option Awards not Otherwise Reflected in Fair Value or Total Compensation (F) ($) |
Total Average Equity Award Adjustments ($) |
2026 |
563,540 |
(291,605) |
n/a |
(8,382) |
0 |
11,301 |
274,853 |
2025 |
489,279 |
(58,295) |
n/a |
(42,989) |
0 |
14,947 |
402,941 |
2024 |
1,028,997 |
1,113,314 |
n/a |
477,856 |
0 |
104,720 |
2,724,887 |
2023 |
983,827 |
440,250 |
n/a |
(27,714) |
0 |
84,540 |
1,480,902 |
2022 |
430,048 |
(1,955,171) |
n/a |
(260,988) |
0 |
90,615 |
(1,695,495) |
Important Financial Performance Measures
As described in greater detail in the CD&A, our executive compensation program is driven by a strong pay-for-performance philosophy. The metrics that we use for both our long-term and short-term incentive compensation are designed to align the interests of the NEOs with our top corporate goal of earning money for our shareholders and increasing the value of their investment. In our assessment, the following financial performance measures represent the most important financial performance measures used by us to link CAP for the NEOs, for fiscal 2026, to our performance: