Exhibit 99.1
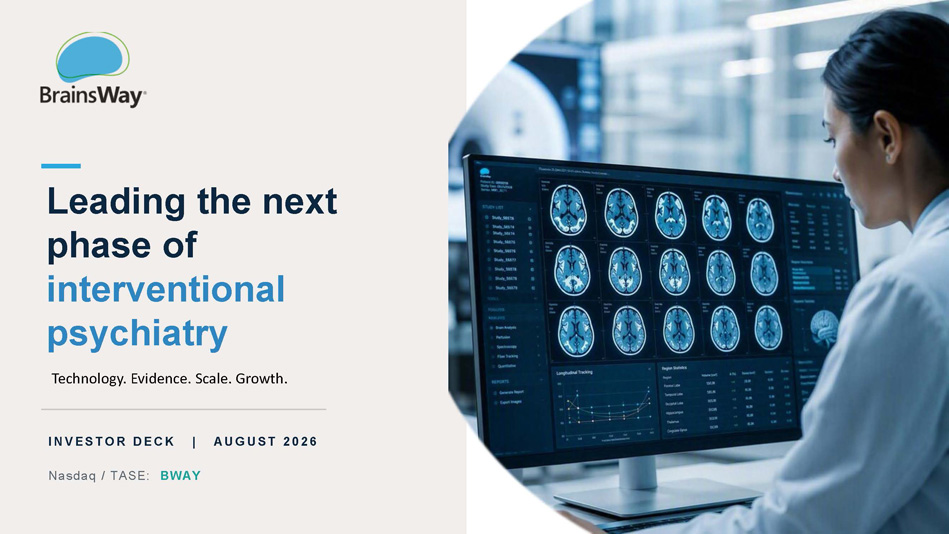
Leading the next phase of interventional psychiatry Technology. Evidence. Scale. Growth. AUG US T 2026 I NV E S T O R DE CK | Nasdaq / TASE: BWAY
D I S C LA I M E R 2 Investor Deck | August 2026 Safe Harbor and Non - GAAP/IFRS Financial Measures T h i s p r es e n t a t i o n do e s n o t c on s t i tut e a n o ff e r o r i n v i t a t i o n t o se l l o r iss u e , o r a n y s o li c i t a t i o n o f a n o ff e r t o s ub s c ri b e f o r o r a c q u ir e , a n y s e c u r i t ie s o f th e C o m p a n y , n o r t o p ar t i c i p a t e i n a n y i n v e s t me n t . T h i s p r es e n t a t i o n s h a l l n o t c on s t i tu t e a d v er t is i n g o r b e c on s t r u e d a s c o mm er c i a l o r p r o m o t i o n a l i n n a tu r e . N o re p r es e n t a t i o n o r w a r r a n t y i s m a d e a s t o t h e a cc u r a c y o r c o m p l e t e n es s o f th i s p r es e n t a t i o n . Y o u m u s t m a k e y o u r o w n i n v e s t i ga t i o n a n d assessme n t o f t h e m a t t e r s c o n t ai n e d h er e i n . I n p a r t i c u l a r , n o r e s p o n s i b il i t y i s ass u m e d a s t o th e a c h ie v em e n t o r re as o n a b l e n es s o f a ny f o r e c a s t s , e s t im a t es , o r s t a t eme nt s a s t o p r o s p e c t s c o nt ai n e d o r re f er r e d t o i n th i s p r ese n t a t i o n . This presentation contains information that includes or is based on forward - looking statements within the meaning of the federal securities laws . Such statements are not guarantees of future p er f o rm a n c e . T h e y r e f l e c t cu rre n t e x p e c t a t i o n s a n d ar e s u b je c t t o r is k s a n d u n c e r t a i n t i e s t h a t c ou l d c a u s e a ctu a l r es u l t s t o d i f f e r m a t e ria l l y f r o m t ho s e e x p r esse d o r i m p l i e d . F a ct o r s i n c l u d e , bu t ar e n ot lim i t e d t o : c o n t i nu e d b u s i n es s im p a c t f r o m CO V I D - 19 ; a d v e r s e e c o no mi c c o n d i t i o n s ; ch a n g e s i n d em a n d a n d p ri c i n g ; ma nu f a ctu r i n g d i f f i c u l t ie s o r d el a y s ; l egisl a t i v e a n d r e g u la t o r y a c t i o n s ; ch a n g e s in re i m b u r sem e n t ; t h i r d - p ar t y p a y o r d e c isi on s ; p r o d u c t li a b i l i t y c l a ims ; U . S . h e a l t h c ar e r ef o rm ; f i n a n c i a l m a r k e t c o n d i t i o n s ; c o m p e t i t i v e d y n a mi cs ; f ai l u r e t o a c h i e v e s u f f i c ie n t m a r k e t a d o p t i o n ; r e g u la t ory a c t i o n s o r d el a y s ; a n d o u r a b i l i t y t o r eal i z e e x p e c t e d o p e ra t i o n a l a n d m a nu f a c t u ri n g ef f i c i e n c ie s . A dd i t i o n a l i n f o rm a t i o n a b o u t t h es e a n d o t h e r r is k s i s c o n t a i n e d i n o u r f il i n g s w i t h t h e U . S . Se c u r i t i e s a n d E x c h a n g e C o mmissi on . I f o n e o r m or e o f t h es e f a c t o r s m a t e r i al i z e , o r i f und e rl y i n g ass u m p t i o n s p r o v e i n c o r r e c t , a ct u a l r e s u l t s m a y d i ff e r m a t e r i all y . T h i s p r es e n t a t i o n als o i n c l u d e s m a r k e t a n d i nd u s t r y d a t a f r o m g o v e r n me n t a n d p r i v a t e pub li c a t i o n s a n d i nt e r n a l e s t im a t e s a n d p r o je ct i on s b as e d o n a n u m b e r o f ass u m p t i o n s . W e un d er t a k e n o o b l i ga t i o n t o up d a t e a n y f o r w a r d - l oo k i n g s t a t e me n t a s a r es u l t o f n e w i n f o rm a t i o n , fut u r e e v e n t s , o r oth e r w ise . Certain non - GAAP/IFRS financial measures are included in this presentation . These measures are presented to complement the financial information prepared in accordance with IFRS because management believes they are useful to investors . For example, Adjusted EBITDA, a non - IFRS measure, is widely used by investors and securities analysts to evaluate a company’s operating performance without regard to one - time items (such as restructuring and litigation expenses) that can vary substantially from company to company . Management also uses Adjusted EBITDA with IFRS measures for planning purposes, including preparation of annual operating budgets, as a measure of operating performance . These non - GAAP/IFRS measures should be considered only as supplements to, and not superior to, financial measures prepared in accordance with IFRS . Other companies may calculate similarly titled non - GAAP/IFRS measures differently than the Company .
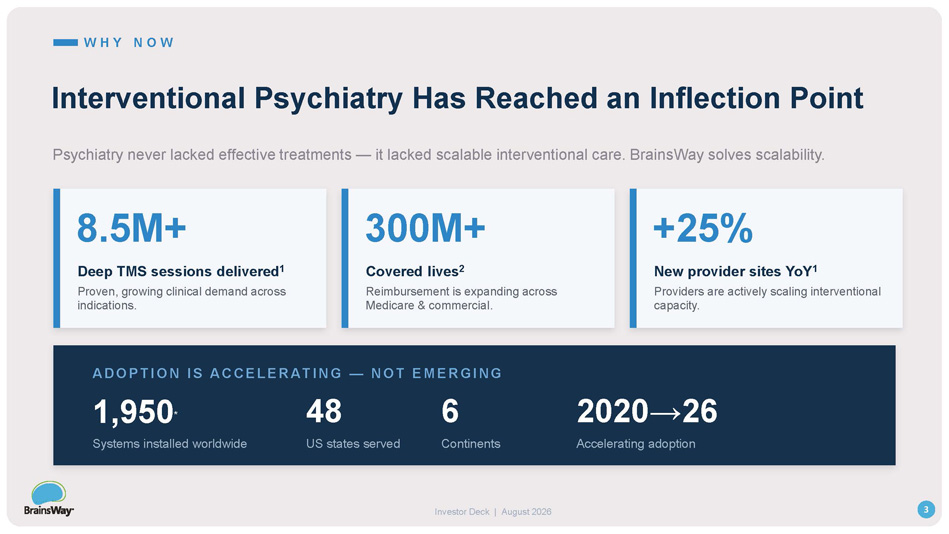
W H Y N O W Interventional Psychiatry Has Reached an Inflection Point Psychiatry never lacked effective treatments — it lacked scalable interventional care. BrainsWay solves scalability. 8.5M+ Deep TMS sessions delivered 1 Proven, growing clinical demand across indications. 300M+ Covered lives 2 Reimbursement is expanding across Medicare & commercial. +25% New provider sites YoY 1 Providers are actively scaling interventional capacity. ADO P TI O N I S ACCE LE RATI NG — NO T E M E RG ING 3 Investor Deck | August 2026 1,950 * Systems installed worldwide 48 US states served 6 Continents 2020→26 Accelerating adoption
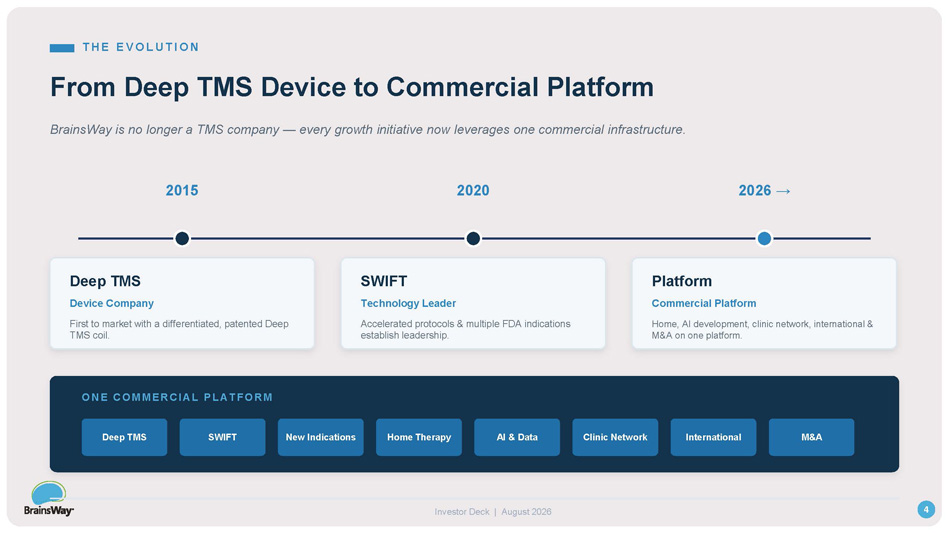
T H E E V O LU T I O N From Deep TMS Device to Commercial Platform BrainsWay is no longer a TMS company — every growth initiative now leverages one commercial infrastructure. 2015 Deep TMS Device Company First to market with a differentiated, patented Deep TMS coil. 2020 SWIFT Technology Leader Accelerated protocols & multiple FDA indications establish leadership. 2026 → Platform Commercial Platform Home, AI development, clinic network, international & M&A on one platform. O N E C O M M E R C I AL PL AT F O R M Deep TMS SWIFT New Indications Home Therapy AI & Data Clinic Network International M&A 4 Investor Deck | August 2026
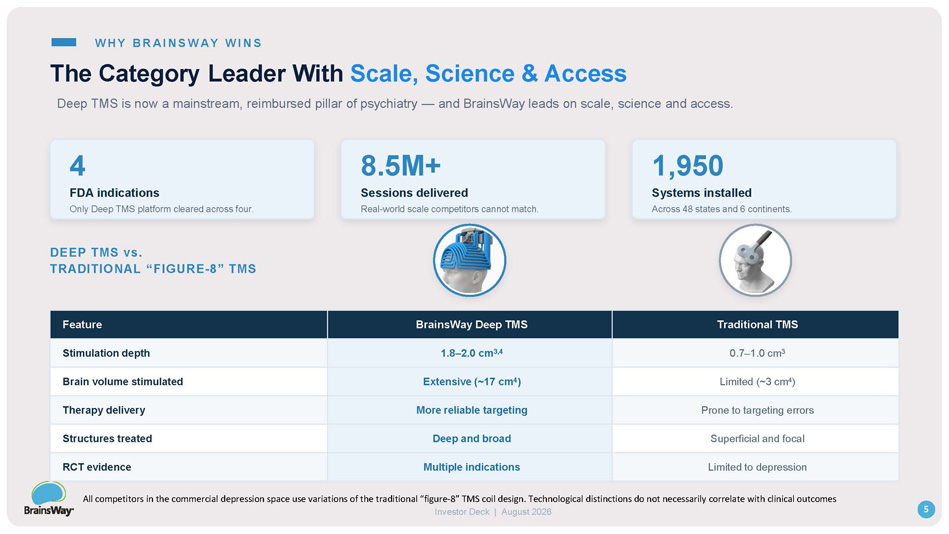
W HY BRA I NS W A Y W I NS The Category Leader With Scale, Science & Access 4 FDA indications Only Deep TMS platform cleared across four. 8.5M+ Sessions delivered Real - world scale competitors cannot match. 1,950 Systems installed Across 48 states and 6 continents. DEEP TMS vs. TRADITIONAL “FIGURE - 8” TMS 5 Investor Deck | August 2026 Traditional TMS BrainsWay Deep TMS Feature 0.7 – 1.0 cm 3 1.8 – 2.0 cm 3,4 Stimulation depth Limited (~3 cm 4 ) Extensive (~17 cm 4 ) Brain volume stimulated Prone to targeting errors More reliable targeting Therapy delivery Superficial and focal Deep and broad Structures treated Limited to depression Multiple indications RCT evidence Deep TMS is now a mainstream, reimbursed pillar of psychiatry — and BrainsWay leads on scale, science and access. All competitors in the commercial depression space use variations of the traditional “figure - 8” TMS coil design. Technological distinctions do not necessarily correlate with clinical outcomes
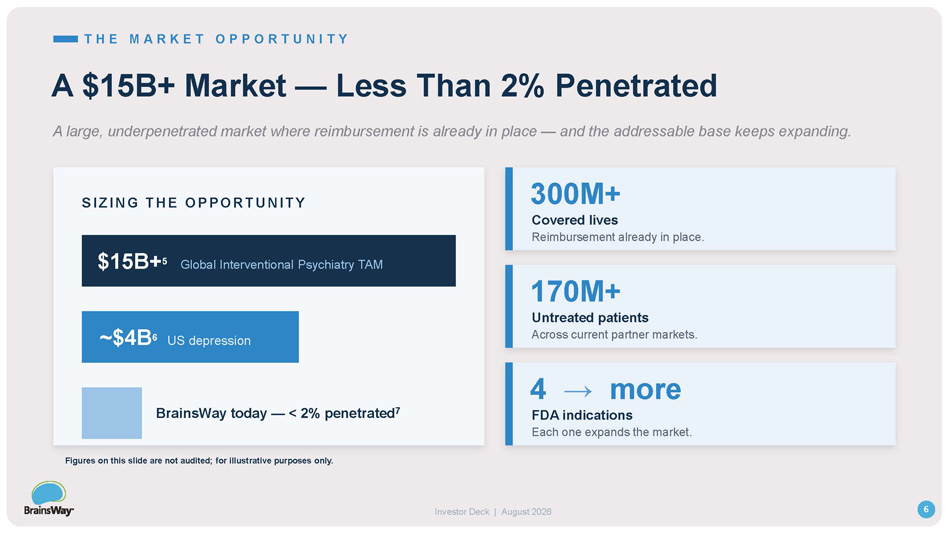
T H E M A R K E T O P P O R T U N I T Y A $15B+ Market — Less Than 2% Penetrated A large, underpenetrated market where reimbursement is already in place — and the addressable base keeps expanding. $15B+ 5 Global Interventional Psychiatry TAM ~$4B 6 US depression S I ZI NG THE O P P O RTUNI T Y BrainsWay today — < 2% penetrated 7 300M+ Covered lives Reimbursement already in place. 170M+ Untreated patients Across current partner markets. 4 → more FDA indications Each one expands the market. 6 Investor Deck | August 2026 Figures on this slide are not audited; for illustrative purposes only.
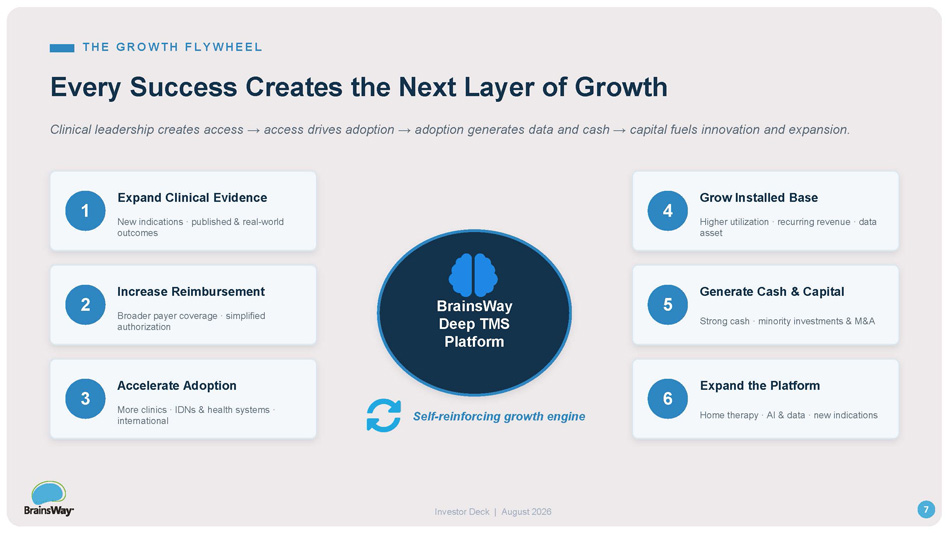
T H E G R O WT H FLY WH E E L Every Success Creates the Next Layer of Growth Clinical leadership creates access → access drives adoption → adoption generates data and cash → capital fuels innovation and expansion. BrainsWay Deep TMS Platform 1 Expand Clinical Evidence New indications · published & real - world outcomes 2 Increase Reimbursement Broader payer coverage · simplified authorization 3 Accelerate Adoption More clinics · IDNs & health systems · international 4 Grow Installed Base Higher utilization · recurring revenue · data asset 5 Generate Cash & Capital Strong cash · minority investments & M&A 6 Expand the Platform Home therapy · AI & data · new indications Self - reinforcing growth engine 7 Investor Deck | August 2026
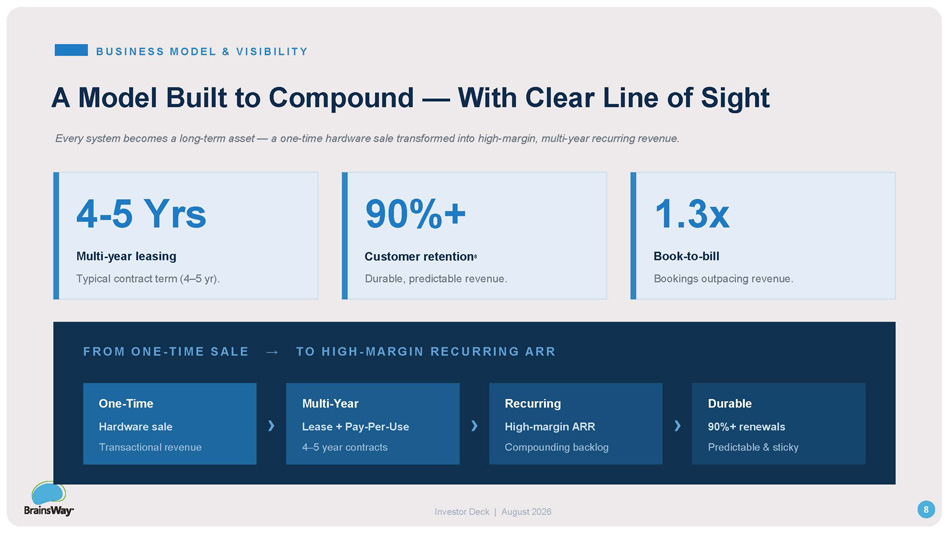
B U S I N ESS M O D EL & V I S I B I L I T Y A Model Built to Compound — With Clear Line of Sight Every system becomes a long - term asset — a one - time hardware sale transformed into high - margin, multi - year recurring revenue. 4 - 5 Yrs Multi - year leasing Typical contract term (4 – 5 yr). 90%+ Customer retention 8 Durable, predictable revenue. 1.3x Book - to - bill Bookings outpacing revenue. F RO M O NE - T I M E SA L E → T O H IGH - M A RG I N RE CURRI N G A RR 8 Investor Deck | August 2026 Durable 90%+ renewals › Recurring High - margin ARR › Multi - Year Lease + Pay - Per - Use › One - Time Hardware sale Predictable & sticky Compounding backlog 4 – 5 year contracts Transactional revenue
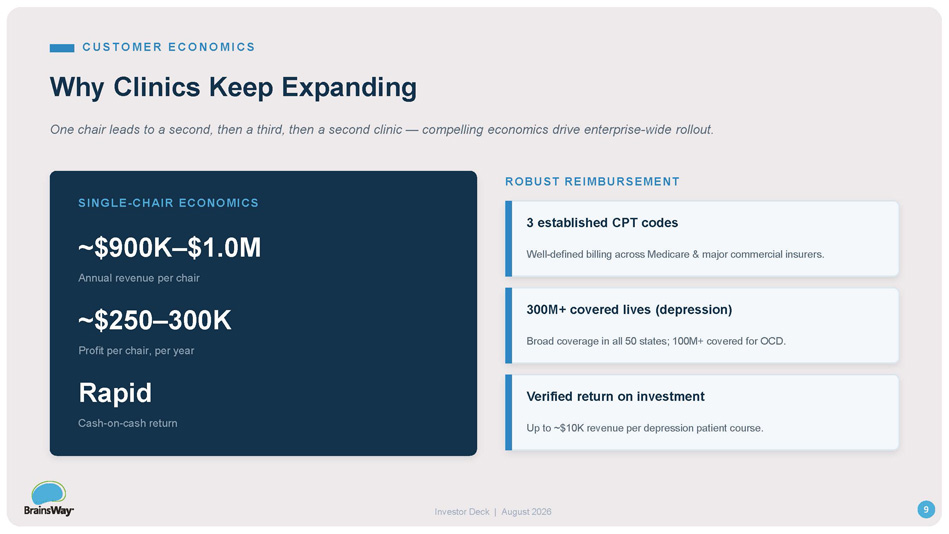
CUS T O M E R E CO NO M I CS Why Clinics Keep Expanding One chair leads to a second, then a third, then a second clinic — compelling economics drive enterprise - wide rollout. SINGLE - CHAIR ECONOMICS ~$900K – $1.0M Annual revenue per chair ~$250 – 300K Profit per chair, per year Rapid Cash - on - cash return ROBUST REIMBURSEMENT 3 established CPT codes Well - defined billing across Medicare & major commercial insurers. 300M+ covered lives (depression) Broad coverage in all 50 states; 100M+ covered for OCD. Verified return on investment 9 Investor Deck | August 2026 Up to ~$10K revenue per depression patient course.
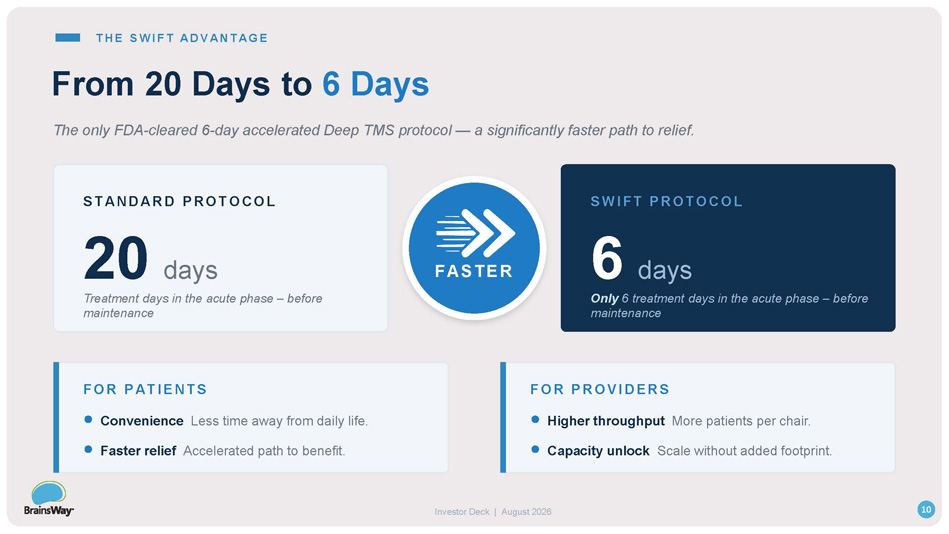
T H E S WI FT A D V A N T A G E From 20 Days to 6 Days The only FDA - cleared 6 - day accelerated Deep TMS protocol — a significantly faster path to relief. S TANDAR D P RO TO CO L 20 days Treatment days in the acute phase – before maintenance S WI FT P RO TO CO L 6 days Only 6 treatment days in the acute phase – before maintenance FASTER FO R P ATI E NTS Convenience Less time away from daily life. Faster relief Accelerated path to benefit. FO R P RO V I DE RS Higher throughput More patients per chair. Capacity unlock Scale without added footprint. 10 Investor Deck | August 2026
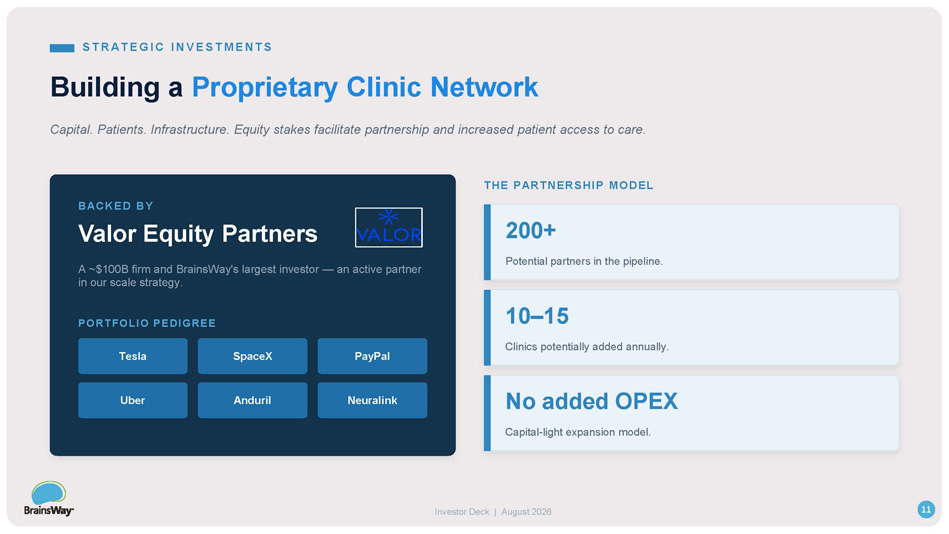
ST R A T EG I C I N VEST M EN T S Building a Proprietary Clinic Network Capital. Patients. Infrastructure. Equity stakes facilitate partnership and increased patient access to care. BACKED BY Valor Equity Partners A ~$100B firm and BrainsWay's largest investor — an active partner in our scale strategy. PORTFOLIO PEDIGREE Tesla SpaceX PayPal Uber Anduril Neuralink THE PARTNERSHIP MODEL 200+ Potential partners in the pipeline. 10 – 15 Clinics potentially added annually. No added OPEX Capital - light expansion model. 11 Investor Deck | August 2026
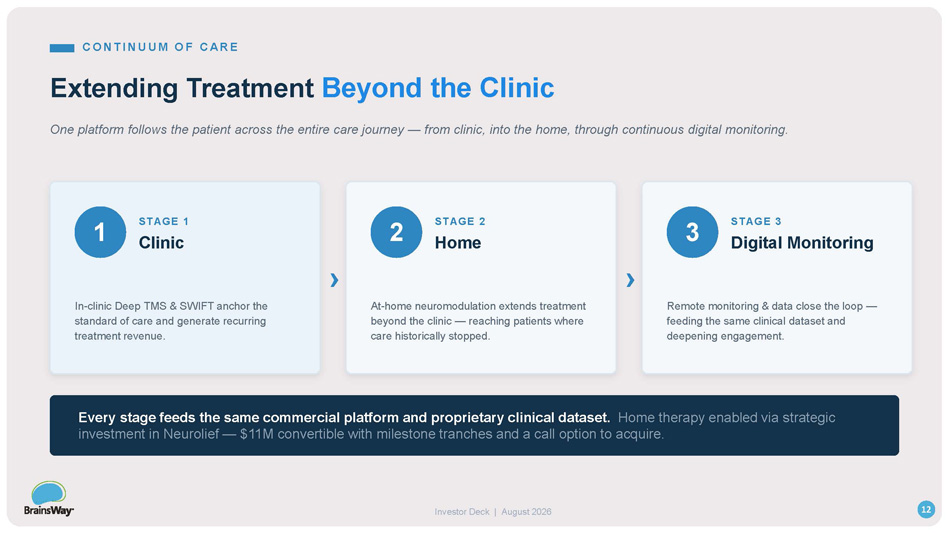
CO NT I NUUM O F CA RE Extending Treatment Beyond the Clinic One platform follows the patient across the entire care journey — from clinic, into the home, through continuous digital monitoring. 1 STAGE 1 Clinic In - clinic Deep TMS & SWIFT anchor the standard of care and generate recurring treatment revenue . › 2 STAGE 2 Home At - home neuromodulation extends treatment beyond the clinic — reaching patients where care historically stopped . › 3 STAGE 3 Digital Monitoring Remote monitoring & data close the loop — feeding the same clinical dataset and deepening engagement. Every stage feeds the same commercial platform and proprietary clinical dataset. Home therapy enabled via strategic investment in Neurolief — $11M convertible with milestone tranches and a call option to acquire. 12 Investor Deck | August 2026
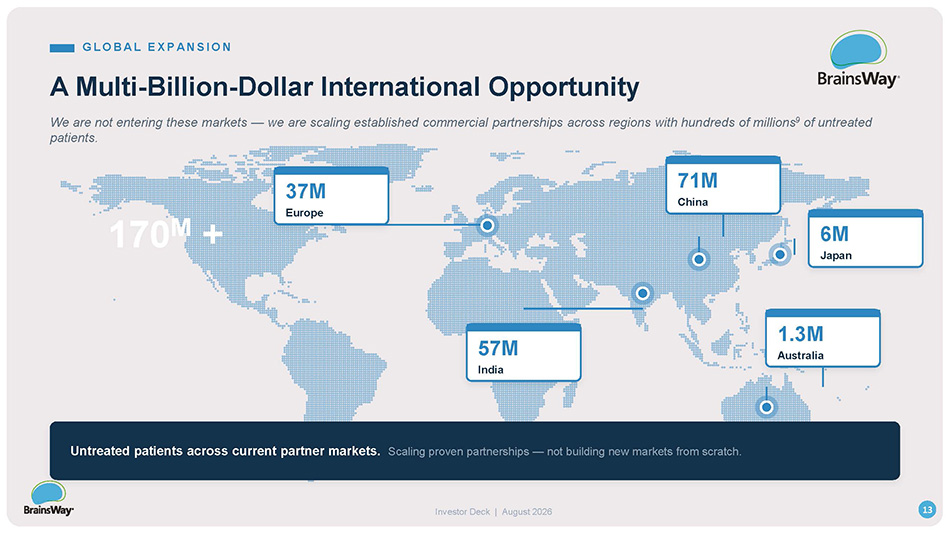
G LO B A L E X P A N S I O N A Multi - Billion - Dollar International Opportunity We are not entering these markets — we are scaling established commercial partnerships across regions with hundreds of millions 9 of untreated patients. 37M Europe 71M China 6M Japan 57M India 1.3M Australia 170 M + 13 Investor Deck | August 2026 Untreated patients across current partner markets. Scaling proven partnerships — not building new markets from scratch.
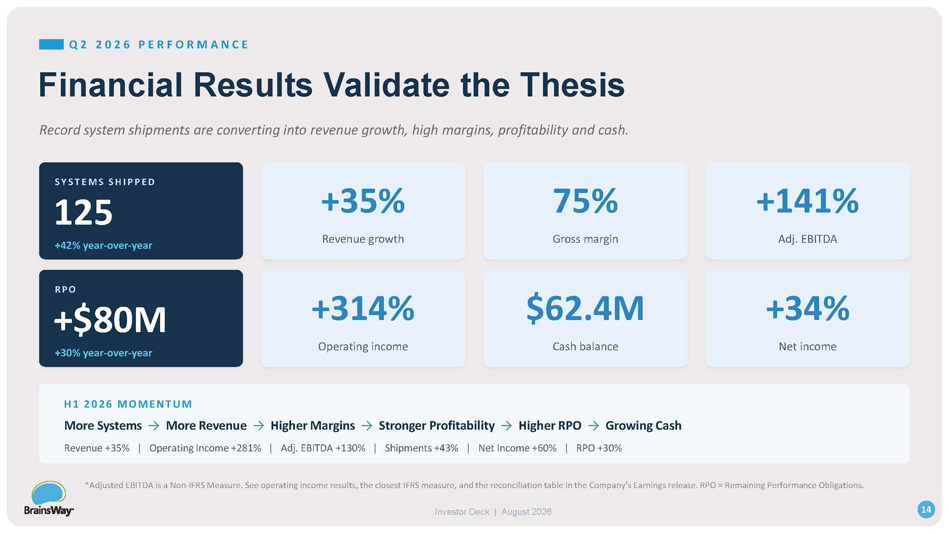
Q 2 2 0 2 6 P E R F O R M A N C E Financial Results Validate the Thesis Record system shipments are converting into revenue growth, high margins, profitability and cash. S Y S T EMS S H I P P ED 125 +42% year - over - year +35% Revenue growth 75% Gross margin +141% Adj. EBITDA RPO +$80M +30% year - over - year +314% Operating income $62.4M Cash balance +34% Net income H 1 2026 MOME N T U M More Systems → More Revenue → Higher Margins → Stronger Profitability → Higher RPO → Growing Cash Revenue +35% | Operating Income +281% | Adj. EBITDA +130% | Shipments +43% | Net Income +60% | RPO +30% *Adjusted EBITDA is a Non - IFRS Measure. See operating income results, the closest IFRS measure, and the reconciliation table in the Company’s Earnings release. RPO = Remaining Performance Obligations. 14 Investor Deck | August 2026
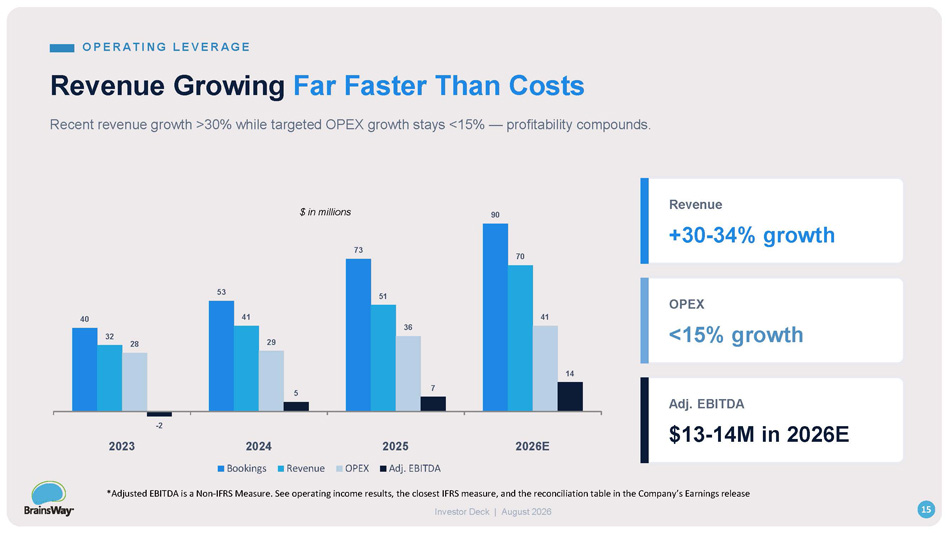
Revenue Growing Far Faster Than Costs Recent revenue growth >30% while targeted OPEX growth stays <15% — profitability compounds. 40 53 73 90 32 41 51 70 28 29 36 41 - 2 5 7 14 2023 2026E 2024 Bookings Revenue OPEX 2025 Adj. EBITDA Revenue +30 - 34% growth OPEX <15% growth Adj. EBITDA $13 - 14M in 2026E $ in millions O PER A T I N G L EVER A G E *Adjusted EBITDA is a Non - IFRS Measure. See operating income results, the closest IFRS measure, and the reconciliation table in the Company’s Earnings release 15 Investor Deck | August 2026
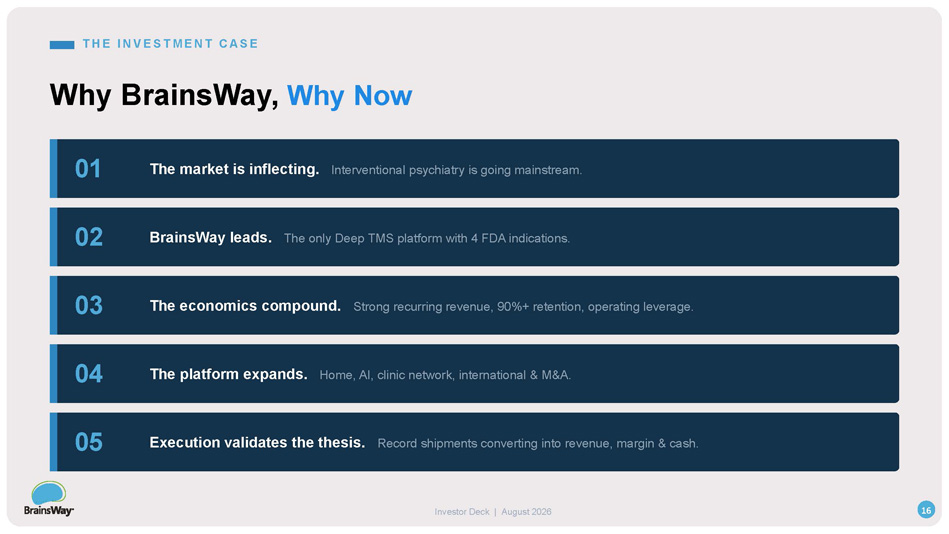
T H E I N VEST M EN T C A SE Why BrainsWay, Why Now 01 The market is inflecting. Interventional psychiatry is going mainstream. 02 BrainsWay leads. The only Deep TMS platform with 4 FDA indications. 03 The economics compound. Strong recurring revenue, 90%+ retention, operating leverage. 04 The platform expands. Home, AI, clinic network, international & M&A. 05 16 Investor Deck | August 2026 Execution validates the thesis. Record shipments converting into revenue, margin & cash.
Building the Global Platform for Interventional Psychiatry. One Platform Millions of Patients Decades of Growth N AS D AQ / T AS E : B W AY 17
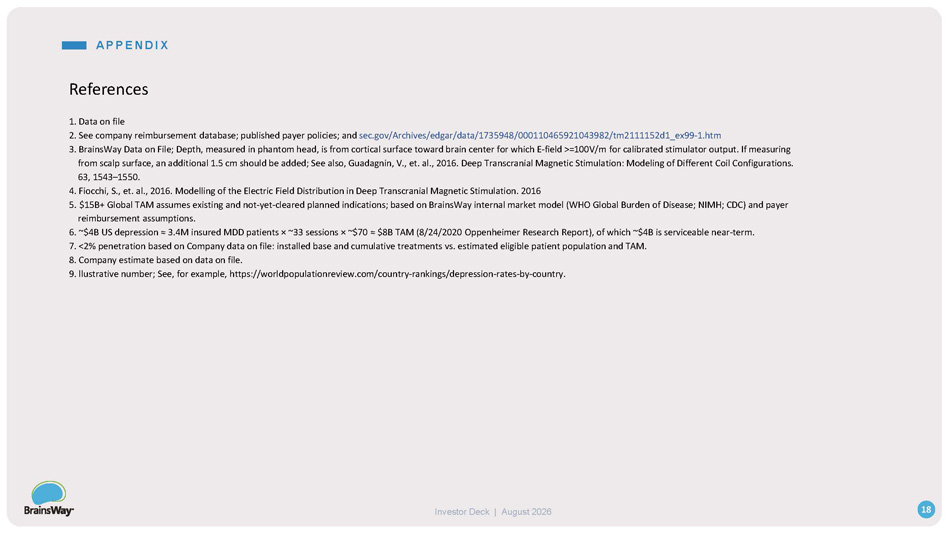
Investor Deck | August 2026 References 1. Data on file 2. See company reimbursement database; published payer policies; and sec.gov/Archives/edgar/data/1735948/000110465921043982/tm2111152d1_ex99 - 1.htm 3. BrainsWay Data on File; Depth, measured in phantom head, is from cortical surface toward brain center for which E - field >=100V/m for calibrated stimulator output. If measuring from scalp surface, an additional 1.5 cm should be added; See also, Guadagnin, V., et. al., 2016. Deep Transcranial Magnetic Stimulation: Modeling of Different Coil Configurations. 63, 1543 – 1550. 4. Fiocchi, S., et. al., 2016. Modelling of the Electric Field Distribution in Deep Transcranial Magnetic Stimulation. 2016 5. $15B+ Global TAM assumes existing and not - yet - cleared planned indications; based on BrainsWay internal market model (WHO Global Burden of Disease; NIMH; CDC) and payer reimbursement assumptions. 6. ~$4B US depression ≈ 3.4M insured MDD patients п ~33 sessions п ~$70 ≈ $8B TAM (8/24/2020 Oppenheimer Research Report), of which ~$4B is serviceable near - term. 7. <2% penetration based on Company data on file: installed base and cumulative treatments vs. estimated eligible patient population and TAM. 8. Company estimate based on data on file. 9. llustrative number; See, for example, https://worldpopulationreview.com/country - rankings/depression - rates - by - country. 18 A PPEN D I X