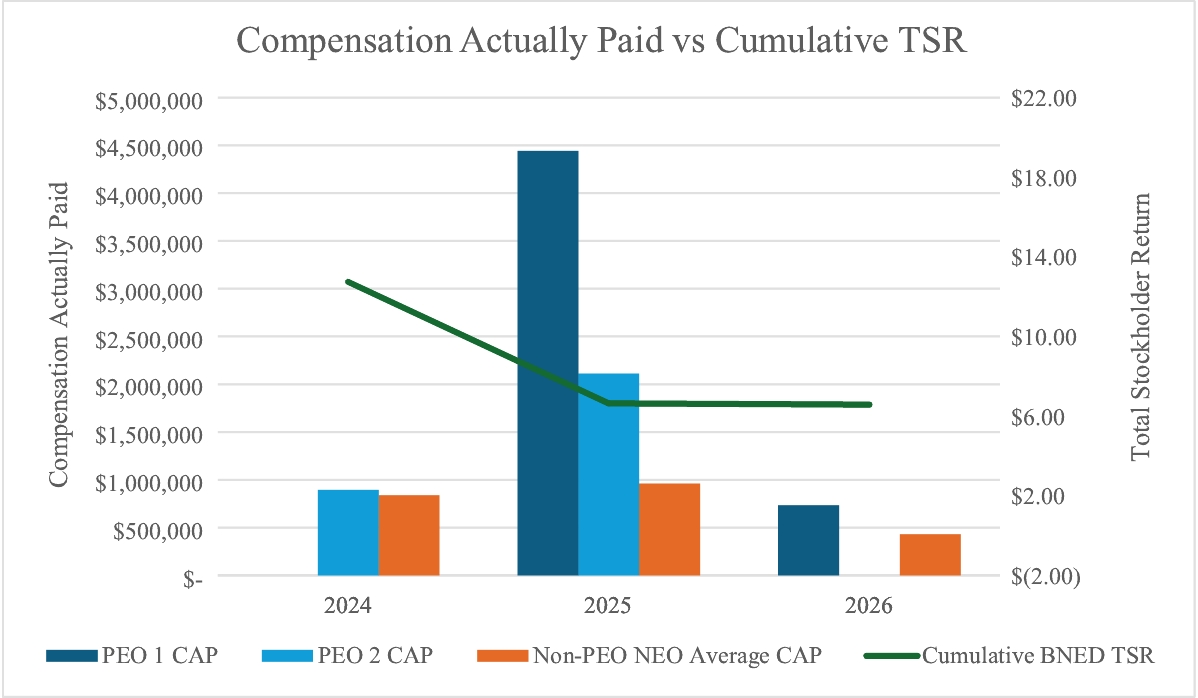
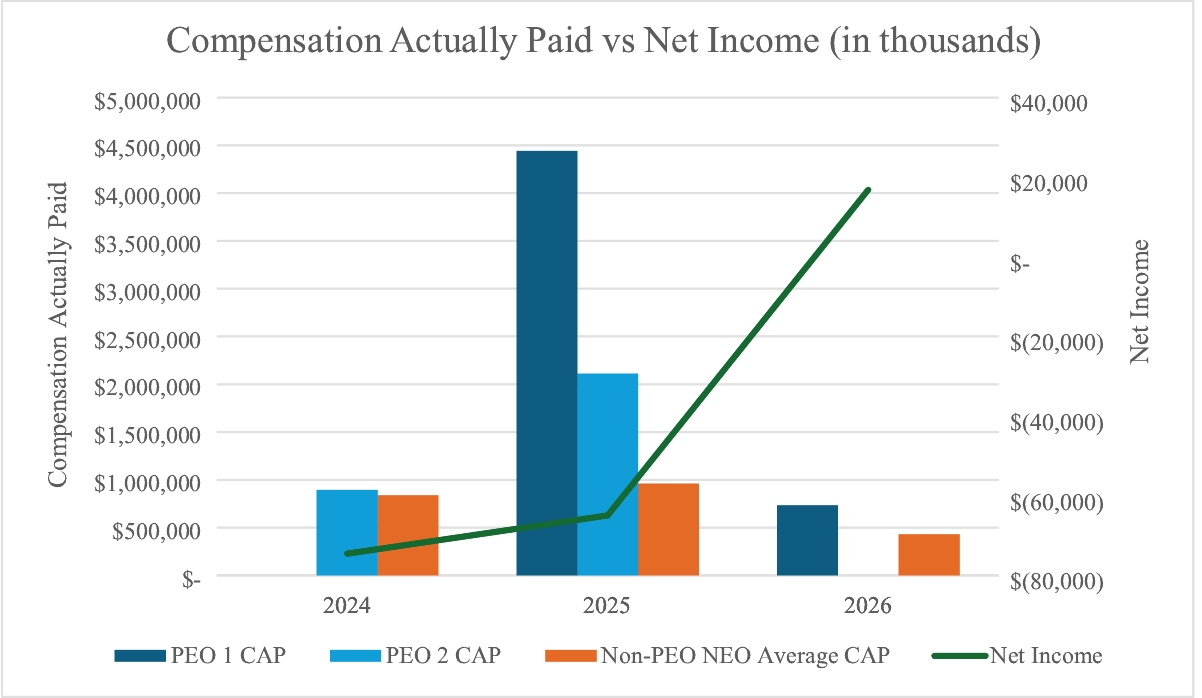
Pay vs Performance Disclosure - USD ($)
Jun. 10, 2024
May 03, 2025
May 02, 2026
May 03, 2025
Apr. 27, 2024
Pay versus Performance
As required by Section 953(a) of the Dodd-Frank Wall Street Reform and Consumer Protection Act and Item 402(v) of Regulation S-K, we are providing the following information about the relationship between executive compensation actually paid and certain financial performance of the Company.
Fiscal Year | Summary Compensation Table Total for CEO 1 ($)(1) | Summary Compensation Table Total for CEO 2 ($)(2) | Compensation Actually Paid to CEO 1 ($)(1)(3) | Compensation Actually Paid to CEO 2 ($)(2)(3) | Average Summary Compensation Table Total for Non-CEO Named Executive Officers (“NEOs”) ($)(4) | Average Compensation Actually Paid to Non-CEO NEOs ($)(3)(4) | Value of Initial Fixed $100 Investment Based on Total Stockholder Return ($)(5) | Net Income ($ thousands) | ||||||||||||||||
2026 | 795,540 | — | 733,545 | — | 441,310 | 429,283 | $6.58 | 16,872 | ||||||||||||||||
2025 | 4,231,272 | 2,162,225 | 4,441,154 | 2,111,019 | 907,928 | 960,830 | $6.64 | (65,825) | ||||||||||||||||
2024 | — | 1,787,099 | — | 895,431 | 985,254 | 838,305 | $12.75 | (75,749) | ||||||||||||||||
(1) | Mr. Shar was appointed CEO on June 10, 2024 |
(2) | Michael Huseby served as CEO in Fiscal 2024 and Fiscal 2025 through June 10, 2024 |
(3) | SEC rules require certain adjustments be made to the Summary Compensation Table totals to determine Compensation Actually Paid as reported in the Pay versus Performance Table. Compensation Actually Paid does not necessarily represent cash and/or equity value transferred to the applicable NEO without restriction, but rather is a value calculated under applicable SEC rules. In general, Compensation Actually Paid is calculated as Summary Compensation Table total compensation adjusted to include the fair market value of equity awards as of the end of the applicable fiscal year or, if earlier, the vesting date (rather than the grant date). NEOs do not participate in a defined benefit plan so no adjustment for pension benefits is included in the table below. Similarly, no adjustment is made for dividends as dividends are factored into the fair value of the award. |
(4) | The non-CEO named executive officers include the following individuals in each year: |
2026: Messrs. Snagusky and Neumann
2025: Messrs. Shar, Miller, Snagusky, and Neumann, in each case for the portion of the year in which each such person served as an NEO (and in the case of Mr. Shar for the period in which he was an NEO, but not CEO)
2024: Messrs. Watson, Miller, Shar and Henderson and Ms. Paul
(5) | Total Stockholder Return is determined based on the value of an initial fixed investment of $100 on April 29, 2023. |
The following table outlines the adjustments made to the compensation earned by our CEO and non-CEO NEOs, as presented in the Summary Compensation Table, to derive the Compensation Actually Paid to our CEO and non-CEO NEOs.
Item and Value Added (Deducted) | 2026 ($) | 2025 ($) | 2024 ($) | ||||||
For CEO 1 (Shar): | |||||||||
Summary Compensation Table Total | 795,540 | 4,231,272 | — | ||||||
- Summary Compensation Table “Option Awards” column value | — | (3,458,400) | — | ||||||
- Summary Compensation Table “Stock Awards” column value | — | — | — | ||||||
+ Year End fair value of outstanding and unvested equity awards granted in the fiscal year | — | 3,669,662 | — | ||||||
+/ - change in fair value of outstanding and unvested equity awards granted in prior years | (62,192) | 233 | — | ||||||
+ vest date fair value of equity awards granted in the covered year | — | — | — | ||||||
+/ - change in fair value of prior-year equity awards vested in the fiscal year | 197 | (1,613) | — | ||||||
- Fair value of awards granted during prior year forfeited during year determined as of prior year end | — | — | — | ||||||
Compensation Actually Paid | 733,545 | 4,441,154 | — | ||||||
For CEO 2 (Huseby): | |||||||||
Summary Compensation Table Total | — | 2,162,225 | 1,787,099 | ||||||
- Summary Compensation Table “Option Awards” column value | — | — | — | ||||||
- Summary Compensation Table “Stock Awards” column value | — | — | — | ||||||
Item and Value Added (Deducted) | 2026 ($) | 2025 ($) | 2024 ($) | ||||||
+ Year End fair value of outstanding and unvested equity awards granted in the fiscal year | — | — | — | ||||||
+/- change in fair value of outstanding and unvested equity awards granted in prior years | — | — | (660,563) | ||||||
+ vest date fair value of equity awards granted in the covered year | — | — | — | ||||||
+/- change in fair value of prior-year equity awards vested in the fiscal year | — | — | (231,105) | ||||||
- fair value of awards granted during prior year forfeited during year determined as of prior year end | — | (51,206) | — | ||||||
Compensation Actually Paid | — | 2,111,019 | 895,431 | ||||||
For Non-CEO NEOs (Average) | |||||||||
Summary Compensation Table Total | 441,310 | 907,928 | 985,254 | ||||||
- Summary Compensation Table “Option Awards” column value | — | — | — | ||||||
- Summary Compensation Table “Stock Awards” column value | — | (487,822) | — | ||||||
+ Year End fair value of outstanding and unvested equity awards granted in the fiscal year | — | 543,596 | — | ||||||
+/- change in fair value of outstanding and unvested equity awards granted in prior years | (12,045) | (99) | (86,179) | ||||||
+ vest date fair value of equity awards granted in the covered year | — | — | — | ||||||
+/- change in fair value of prior-year equity awards vested in the fiscal year | 18 | (806) | (32,382) | ||||||
- fair value of awards granted during prior year forfeited during year determined as of prior year end | — | (1,967) | (28,388) | ||||||
Compensation Actually Paid | 429,283 | 960,830 | 838,305 | ||||||
(1) | Mr. Shar was appointed CEO on June 10, 2024 |
(2) | Michael Huseby served as CEO in Fiscal 2024 and Fiscal 2025 through June 10, 2024 |
(4) | The non-CEO named executive officers include the following individuals in each year: |
2026: Messrs. Snagusky and Neumann
2025: Messrs. Shar, Miller, Snagusky, and Neumann, in each case for the portion of the year in which each such person served as an NEO (and in the case of Mr. Shar for the period in which he was an NEO, but not CEO)
2024: Messrs. Watson, Miller, Shar and Henderson and Ms. Paul
The following table outlines the adjustments made to the compensation earned by our CEO and non-CEO NEOs, as presented in the Summary Compensation Table, to derive the Compensation Actually Paid to our CEO and non-CEO NEOs.
Item and Value Added (Deducted) | 2026 ($) | 2025 ($) | 2024 ($) | ||||||
For CEO 1 (Shar): | |||||||||
Summary Compensation Table Total | 795,540 | 4,231,272 | — | ||||||
- Summary Compensation Table “Option Awards” column value | — | (3,458,400) | — | ||||||
- Summary Compensation Table “Stock Awards” column value | — | — | — | ||||||
+ Year End fair value of outstanding and unvested equity awards granted in the fiscal year | — | 3,669,662 | — | ||||||
+/ - change in fair value of outstanding and unvested equity awards granted in prior years | (62,192) | 233 | — | ||||||
+ vest date fair value of equity awards granted in the covered year | — | — | — | ||||||
+/ - change in fair value of prior-year equity awards vested in the fiscal year | 197 | (1,613) | — | ||||||
- Fair value of awards granted during prior year forfeited during year determined as of prior year end | — | — | — | ||||||
Compensation Actually Paid | 733,545 | 4,441,154 | — | ||||||
For CEO 2 (Huseby): | |||||||||
Summary Compensation Table Total | — | 2,162,225 | 1,787,099 | ||||||
- Summary Compensation Table “Option Awards” column value | — | — | — | ||||||
- Summary Compensation Table “Stock Awards” column value | — | — | — | ||||||
Item and Value Added (Deducted) | 2026 ($) | 2025 ($) | 2024 ($) | ||||||
+ Year End fair value of outstanding and unvested equity awards granted in the fiscal year | — | — | — | ||||||
+/- change in fair value of outstanding and unvested equity awards granted in prior years | — | — | (660,563) | ||||||
+ vest date fair value of equity awards granted in the covered year | — | — | — | ||||||
+/- change in fair value of prior-year equity awards vested in the fiscal year | — | — | (231,105) | ||||||
- fair value of awards granted during prior year forfeited during year determined as of prior year end | — | (51,206) | — | ||||||
Compensation Actually Paid | — | 2,111,019 | 895,431 | ||||||
For Non-CEO NEOs (Average) | |||||||||
Summary Compensation Table Total | 441,310 | 907,928 | 985,254 | ||||||
- Summary Compensation Table “Option Awards” column value | — | — | — | ||||||
- Summary Compensation Table “Stock Awards” column value | — | (487,822) | — | ||||||
+ Year End fair value of outstanding and unvested equity awards granted in the fiscal year | — | 543,596 | — | ||||||
+/- change in fair value of outstanding and unvested equity awards granted in prior years | (12,045) | (99) | (86,179) | ||||||
+ vest date fair value of equity awards granted in the covered year | — | — | — | ||||||
+/- change in fair value of prior-year equity awards vested in the fiscal year | 18 | (806) | (32,382) | ||||||
- fair value of awards granted during prior year forfeited during year determined as of prior year end | — | (1,967) | (28,388) | ||||||
Compensation Actually Paid | 429,283 | 960,830 | 838,305 | ||||||
The following table outlines the adjustments made to the compensation earned by our CEO and non-CEO NEOs, as presented in the Summary Compensation Table, to derive the Compensation Actually Paid to our CEO and non-CEO NEOs.
Item and Value Added (Deducted) | 2026 ($) | 2025 ($) | 2024 ($) | ||||||
For CEO 1 (Shar): | |||||||||
Summary Compensation Table Total | 795,540 | 4,231,272 | — | ||||||
- Summary Compensation Table “Option Awards” column value | — | (3,458,400) | — | ||||||
- Summary Compensation Table “Stock Awards” column value | — | — | — | ||||||
+ Year End fair value of outstanding and unvested equity awards granted in the fiscal year | — | 3,669,662 | — | ||||||
+/ - change in fair value of outstanding and unvested equity awards granted in prior years | (62,192) | 233 | — | ||||||
+ vest date fair value of equity awards granted in the covered year | — | — | — | ||||||
+/ - change in fair value of prior-year equity awards vested in the fiscal year | 197 | (1,613) | — | ||||||
- Fair value of awards granted during prior year forfeited during year determined as of prior year end | — | — | — | ||||||
Compensation Actually Paid | 733,545 | 4,441,154 | — | ||||||
For CEO 2 (Huseby): | |||||||||
Summary Compensation Table Total | — | 2,162,225 | 1,787,099 | ||||||
- Summary Compensation Table “Option Awards” column value | — | — | — | ||||||
- Summary Compensation Table “Stock Awards” column value | — | — | — | ||||||
Item and Value Added (Deducted) | 2026 ($) | 2025 ($) | 2024 ($) | ||||||
+ Year End fair value of outstanding and unvested equity awards granted in the fiscal year | — | — | — | ||||||
+/- change in fair value of outstanding and unvested equity awards granted in prior years | — | — | (660,563) | ||||||
+ vest date fair value of equity awards granted in the covered year | — | — | — | ||||||
+/- change in fair value of prior-year equity awards vested in the fiscal year | — | — | (231,105) | ||||||
- fair value of awards granted during prior year forfeited during year determined as of prior year end | — | (51,206) | — | ||||||
Compensation Actually Paid | — | 2,111,019 | 895,431 | ||||||
For Non-CEO NEOs (Average) | |||||||||
Summary Compensation Table Total | 441,310 | 907,928 | 985,254 | ||||||
- Summary Compensation Table “Option Awards” column value | — | — | — | ||||||
- Summary Compensation Table “Stock Awards” column value | — | (487,822) | — | ||||||
+ Year End fair value of outstanding and unvested equity awards granted in the fiscal year | — | 543,596 | — | ||||||
+/- change in fair value of outstanding and unvested equity awards granted in prior years | (12,045) | (99) | (86,179) | ||||||
+ vest date fair value of equity awards granted in the covered year | — | — | — | ||||||
+/- change in fair value of prior-year equity awards vested in the fiscal year | 18 | (806) | (32,382) | ||||||
- fair value of awards granted during prior year forfeited during year determined as of prior year end | — | (1,967) | (28,388) | ||||||
Compensation Actually Paid | 429,283 | 960,830 | 838,305 | ||||||