
flyExclusive, Inc. Q2 2026 Earnings Review August 12, 2026
FORWARD-LOOKING INFORMATION. This Presentation contains certain forward-looking statements within the meaning of the U.S. federal securities laws with respect to flyExclusive the products and services offered by flyExclusive and the markets in which it operates and flyExclusive’s expectations, intentions, strategies, assumptions or beliefs about future events, results of operations or performance or that do not solely relate to historical or current facts. These forward-looking statements generally are identified by the words “believe,” “project,” “expect,” “anticipate,” “estimate,” “intend,” “strategy,” “future,” “scales,” “representative of,” “valuation,” “potential,” “opportunity,” “plan,” “may,” “should,” “will,” “would,” “will be,” “will continue,” “will likely result,” and similar expressions. Forward-looking statements are predictions, projections and other statements about future events that are based on current expectations and assumptions and, as a result, are subject to risks and uncertainties. Many factors could cause actual future events to differ materially from the forward-looking statements in this Presentation, including but not limited to: (i) the occurrence of any event, change or other circumstance that could give rise to a change in flyExclusive’s business or results of operations, (ii) the ability to maintain the listing of flyExclusive’s securities on a national securities exchange, (iii) changes in the capital structure of flyExclusive, (iv) changes in the competitive industries and markets in which flyExclusive operates or plans to operate, (v) changes in laws and regulations affecting flyExclusive’s business, (vi) the ability to implement business plans, forecasts, and other expectations, and identify and realize additional opportunities, (vii) risks related to flyExclusive’s potential inability to achieve or maintain profitability and generate cash, (viii) current and future conditions in the global economy and their impact on flyExclusive, its business and markets in which it operates, (ix) the potential inability of flyExclusive to manage growth effectively, (x) flyExclusive’s customer concentration, and (xi) the ability to recruit, train and retain qualified personnel. The foregoing list of risk factors is not exhaustive. You should carefully consider the foregoing factors and the other risks and uncertainties described in flyExclusive’s Form 10-K filed on March 5, 2026 and other documents filed or to be filed with the U.S. Securities and Exchange Commission (the “SEC”). Disclaimers & Other Important Information
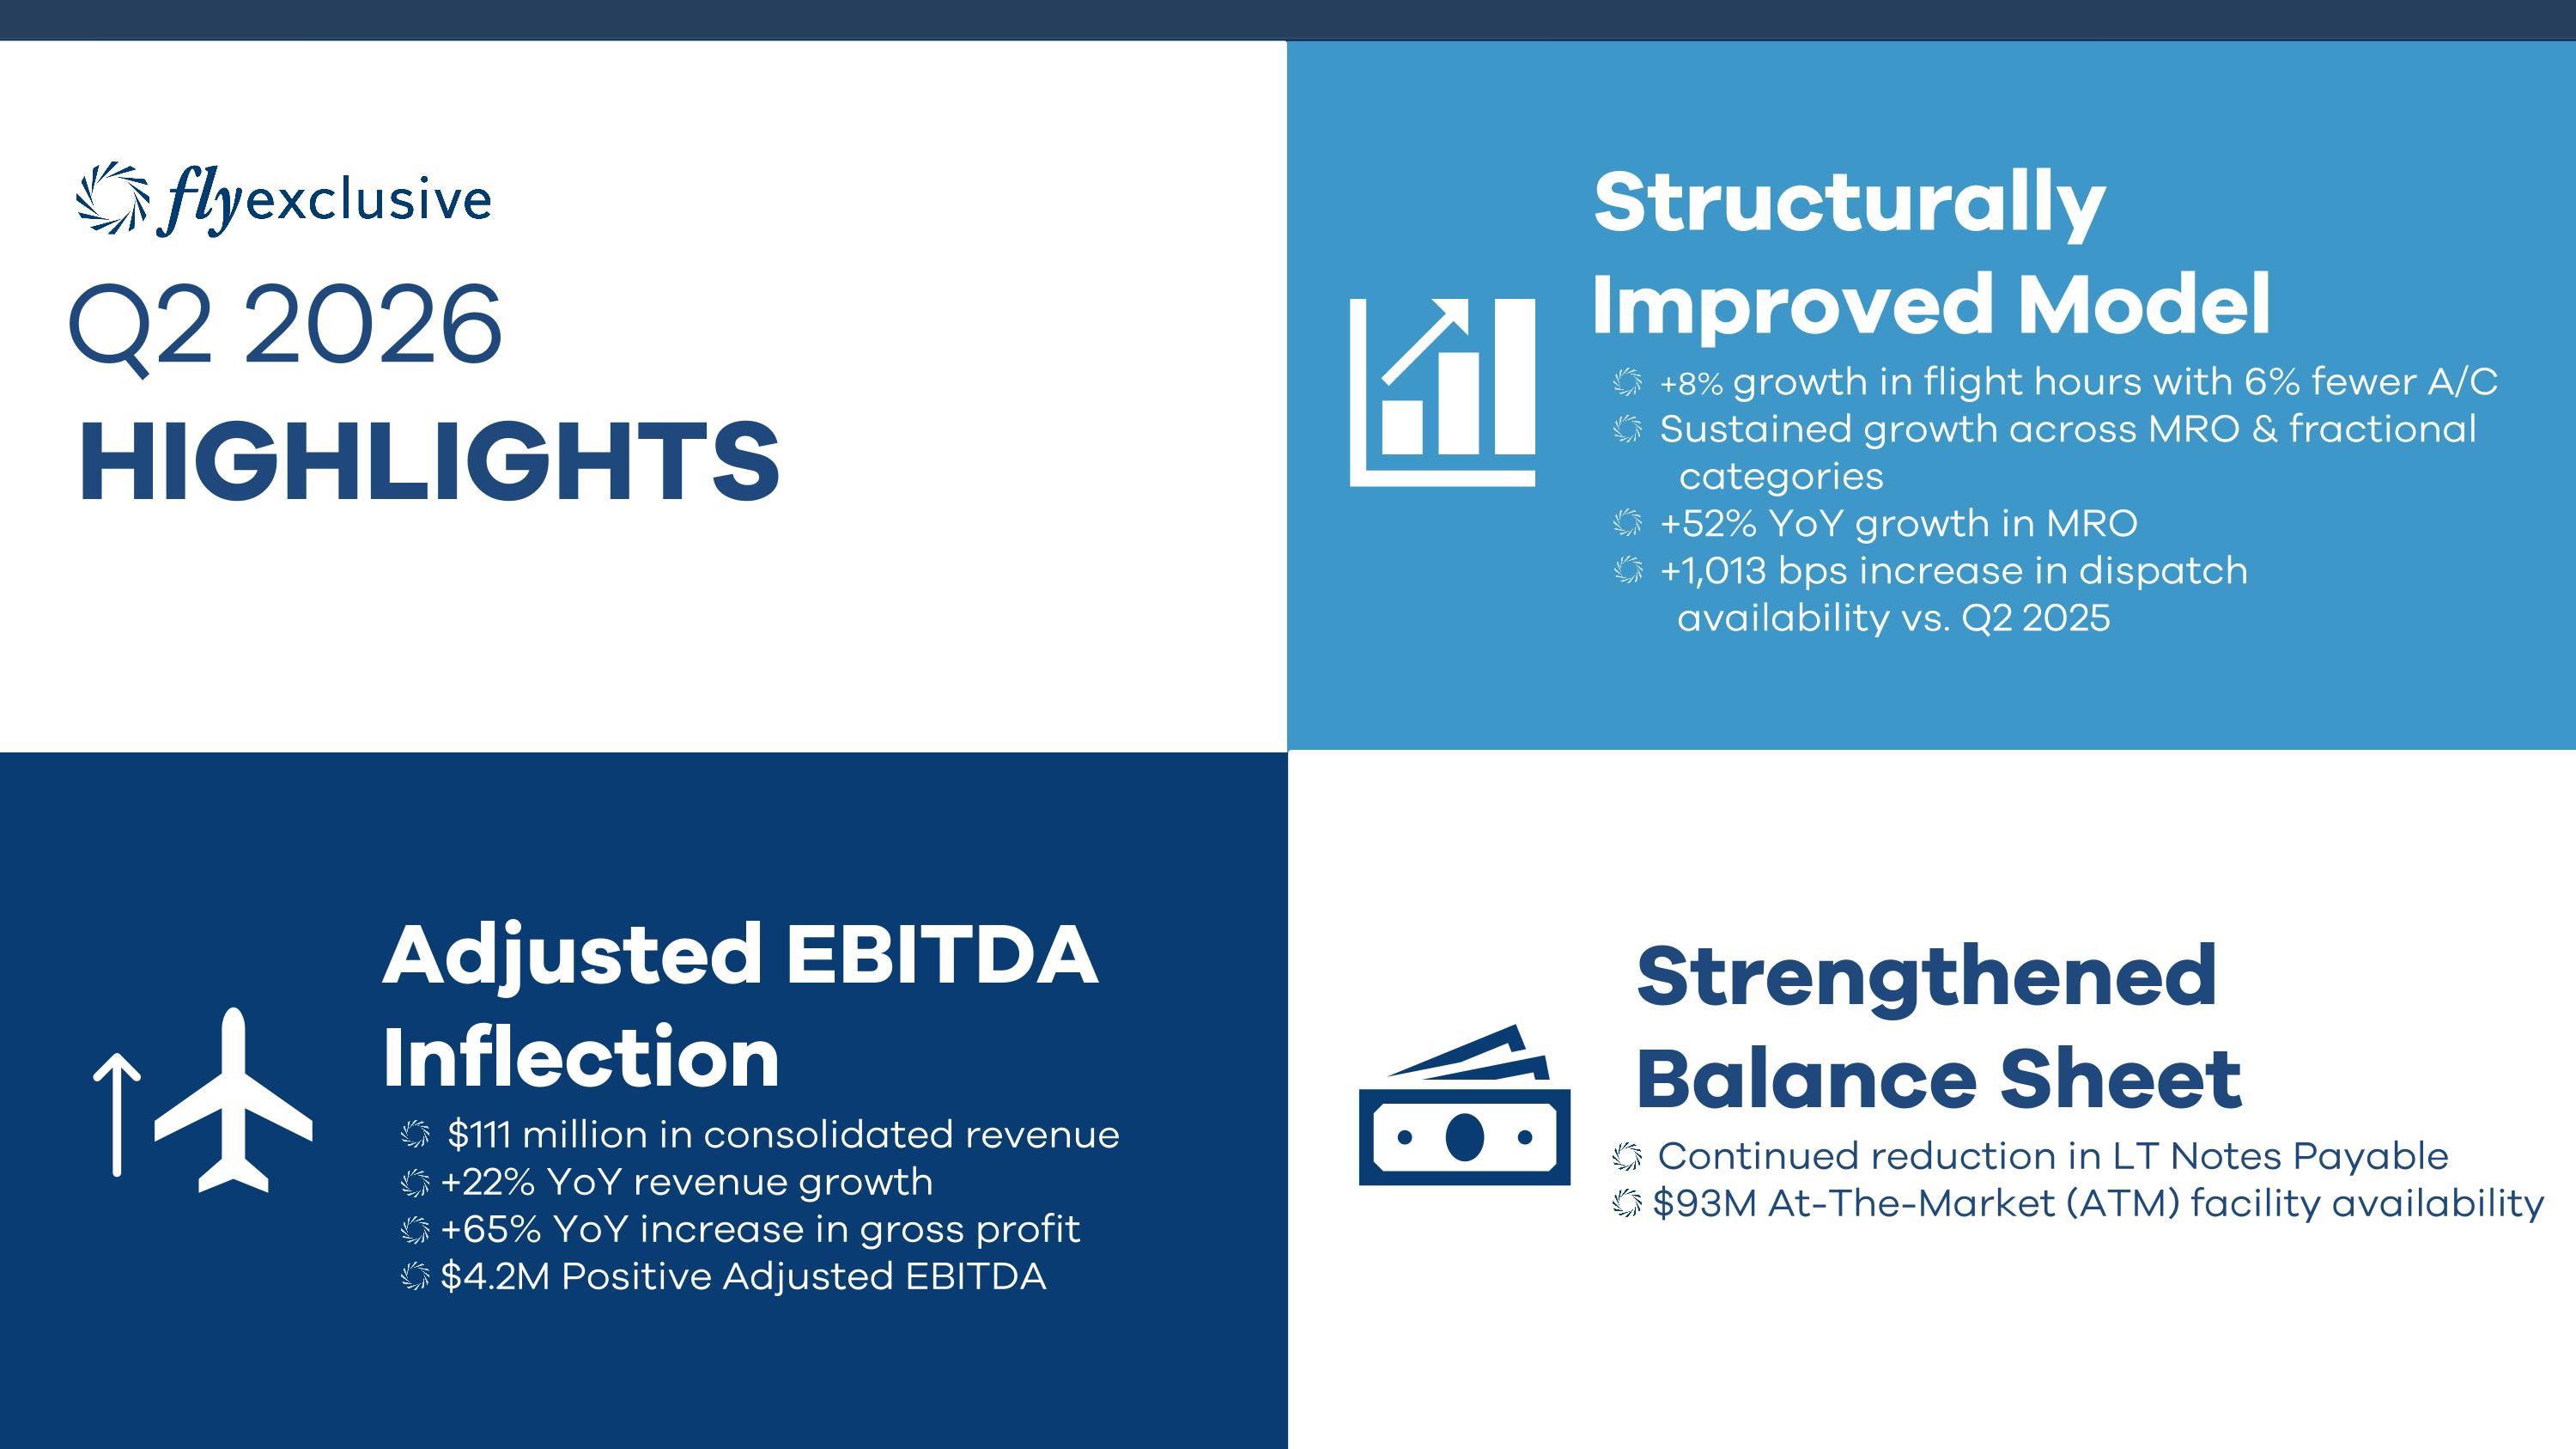
I. EXECUTIVE SUMMARY Q2 2026 HIGHLIGHTS Structurally Improved Model +8% growth in flight hours with 6% fewer A/C Sustained growth across MRO & fractional categories +52% YoY growth in MRO +1,013 bps increase in dispatch availability vs. Q2 2025 Adjusted EBITDA Inflection $111 million in consolidated revenue +22% YoY revenue growth +65% YoY increase in gross profit $4.2M Positive Adjusted EBITDA Strengthened Balance Sheet Continued reduction in LT Notes Payable $93M At-The-Market (ATM) facility availability

Who We are Trusted partner in private jet travel, providing our clients with curated jet experiences that anticipate their needs for flexibility, comfort, and style World-class private aviation company providing a reliable travel experience and exclusive customer benefits Product suite serves range of client needs while diversifying revenue streams, with ~50% of revenue contracted on an annual basis Industry-leading fleet with 80+ light to super-mid jets on certificate and 100% operational control Fastest growing operator since 2019 and the 5th largest private operator by flight hours in the U.S. Fleet modernization and in-house 24/7 maintenance, paint, avionics, and interior refurbishment to maintain highest quality fleet
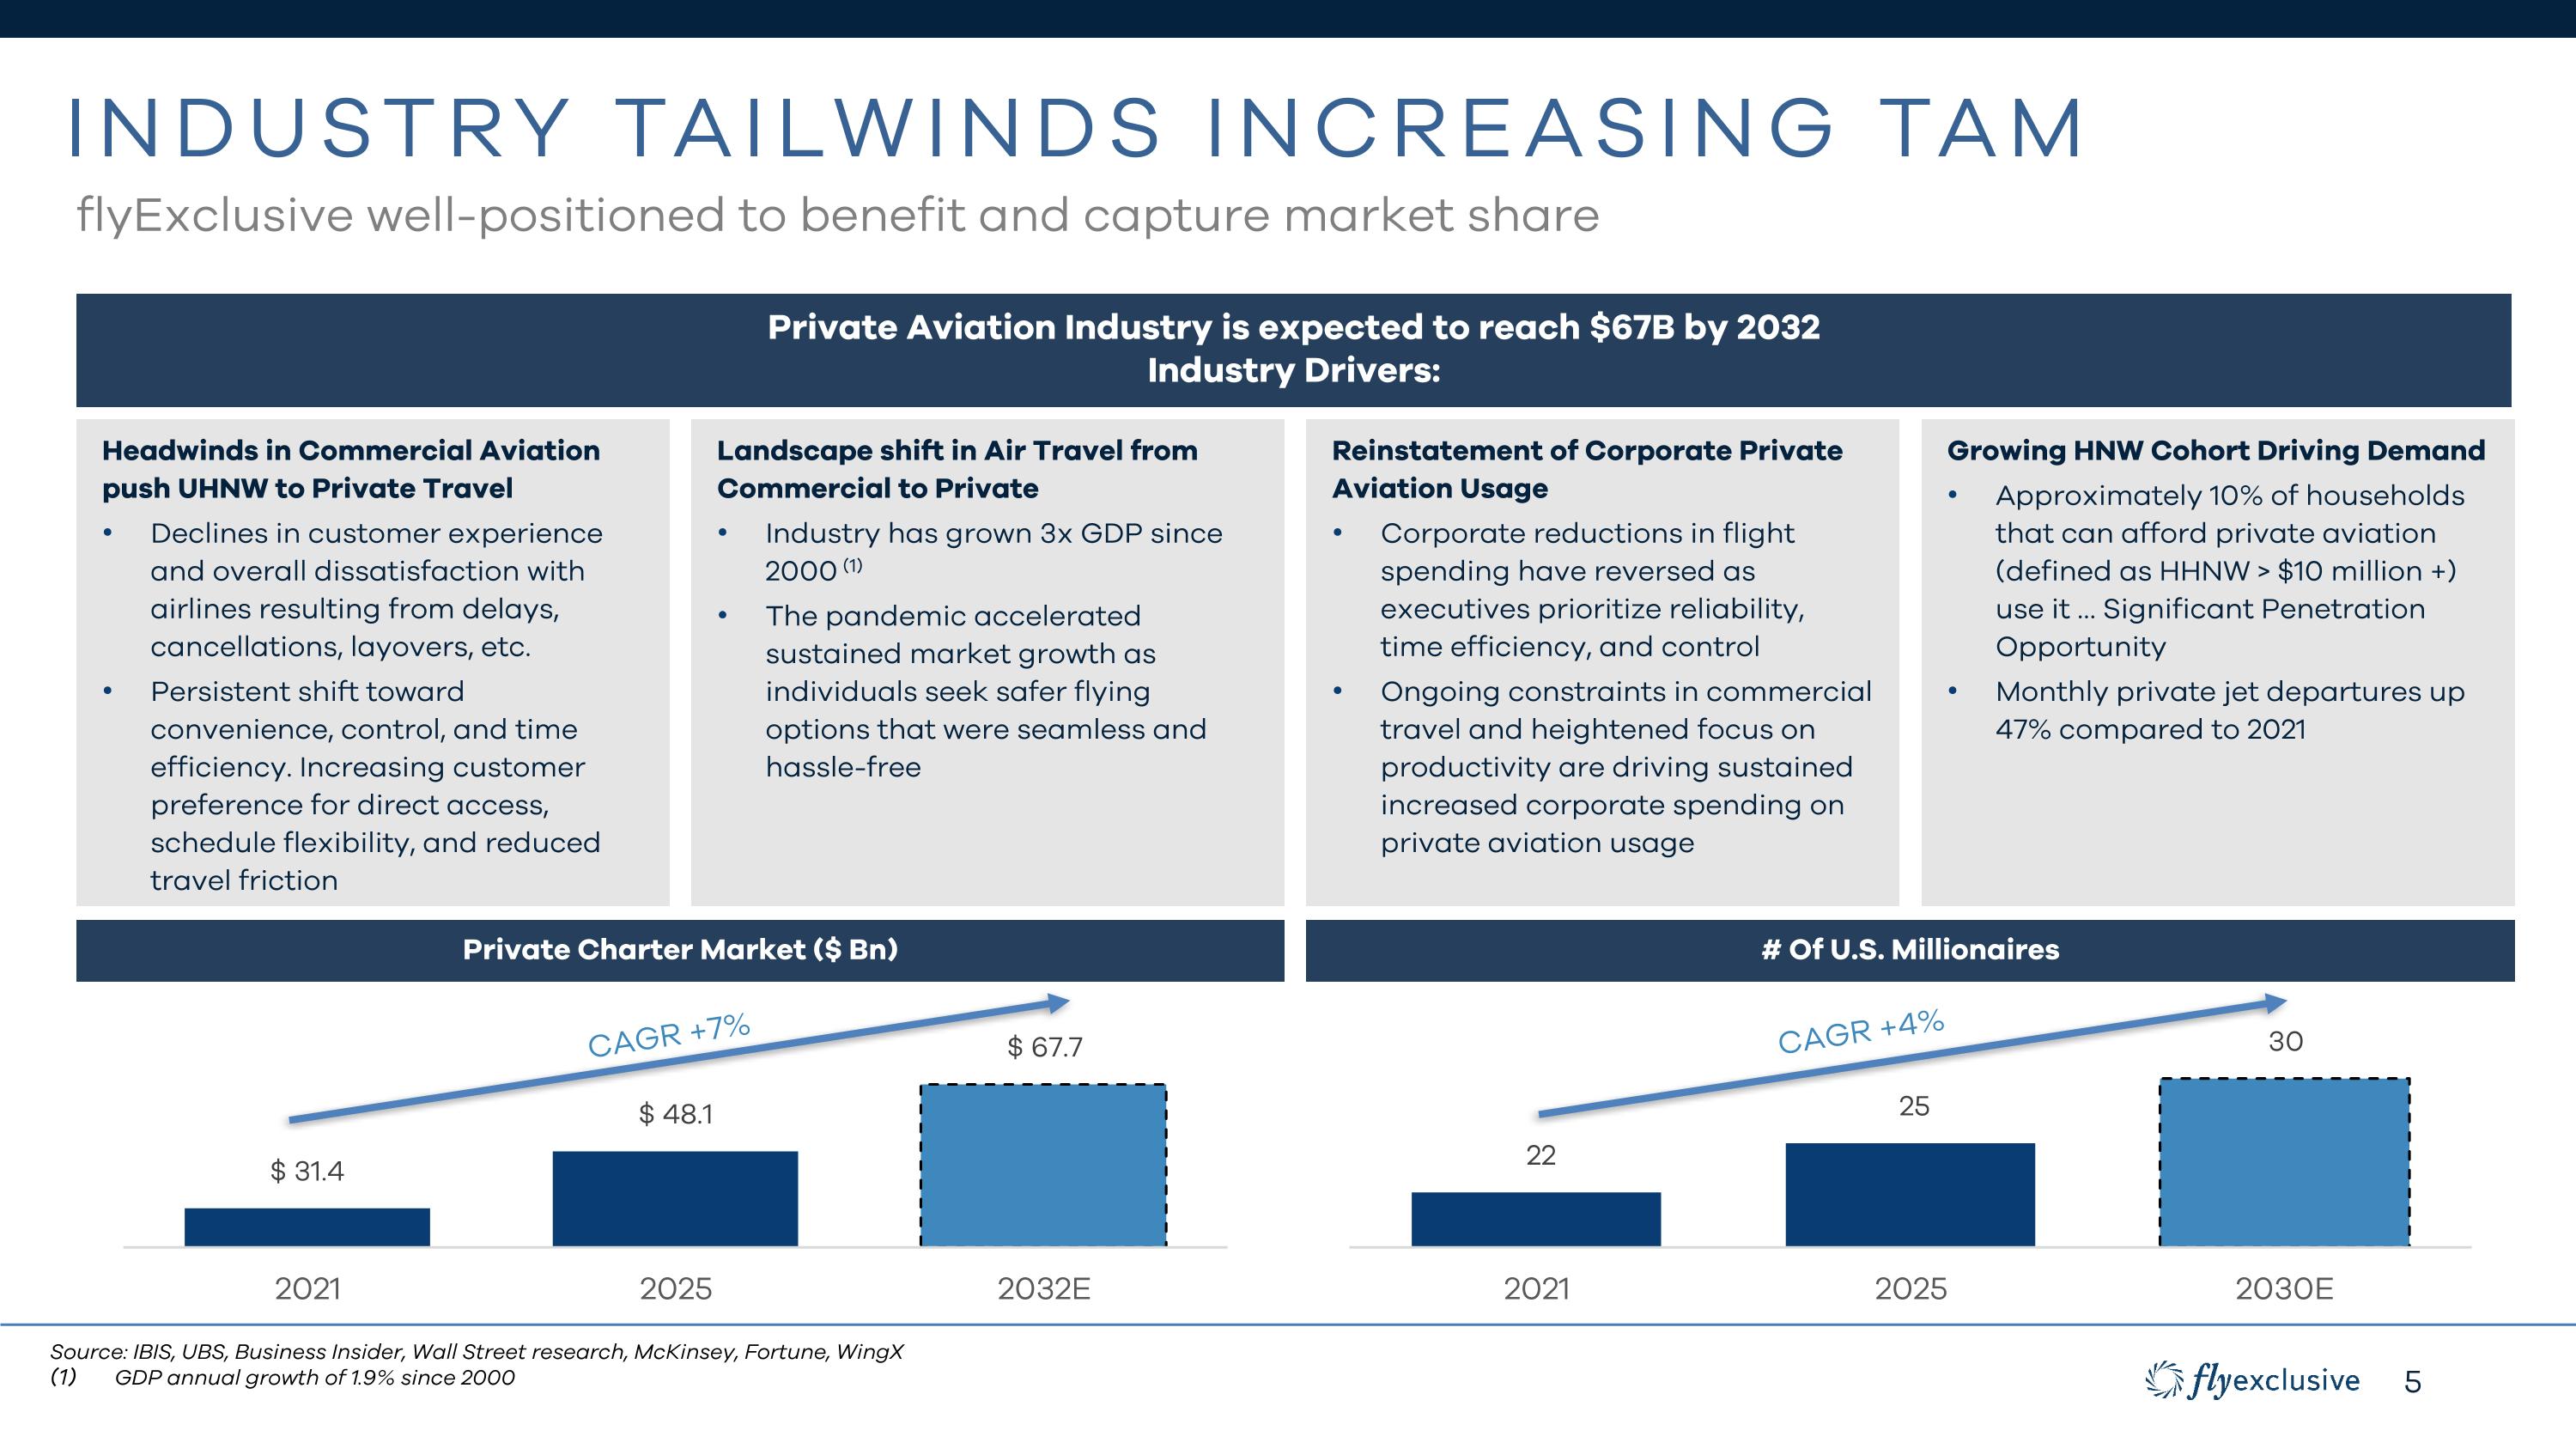
flyExclusive well-positioned to benefit and capture market share INDUSTRY TAILWINDS Increasing TAM Private Aviation Industry is expected to reach $67B by 2032 Industry Drivers: Growing HNW Cohort Driving Demand Approximately 10% of households that can afford private aviation (defined as HHNW > $10 million +) use it … Significant Penetration Opportunity Monthly private jet departures up 47% compared to 2021 Reinstatement of Corporate Private Aviation Usage Corporate reductions in flight spending have reversed as executives prioritize reliability, time efficiency, and control Ongoing constraints in commercial travel and heightened focus on productivity are driving sustained increased corporate spending on private aviation usage Headwinds in Commercial Aviation push UHNW to Private Travel Declines in customer experience and overall dissatisfaction with airlines resulting from delays, cancellations, layovers, etc. Persistent shift toward convenience, control, and time efficiency. Increasing customer preference for direct access, schedule flexibility, and reduced travel friction Landscape shift in Air Travel from Commercial to Private Industry has grown 3x GDP since 2000 (1) The pandemic accelerated sustained market growth as individuals seek safer flying options that were seamless and hassle-free Private Charter Market ($ Bn) # Of U.S. Millionaires Source: IBIS, UBS, Business Insider, Wall Street research, McKinsey, Fortune, WingX GDP annual growth of 1.9% since 2000 CAGR +7% CAGR +4%
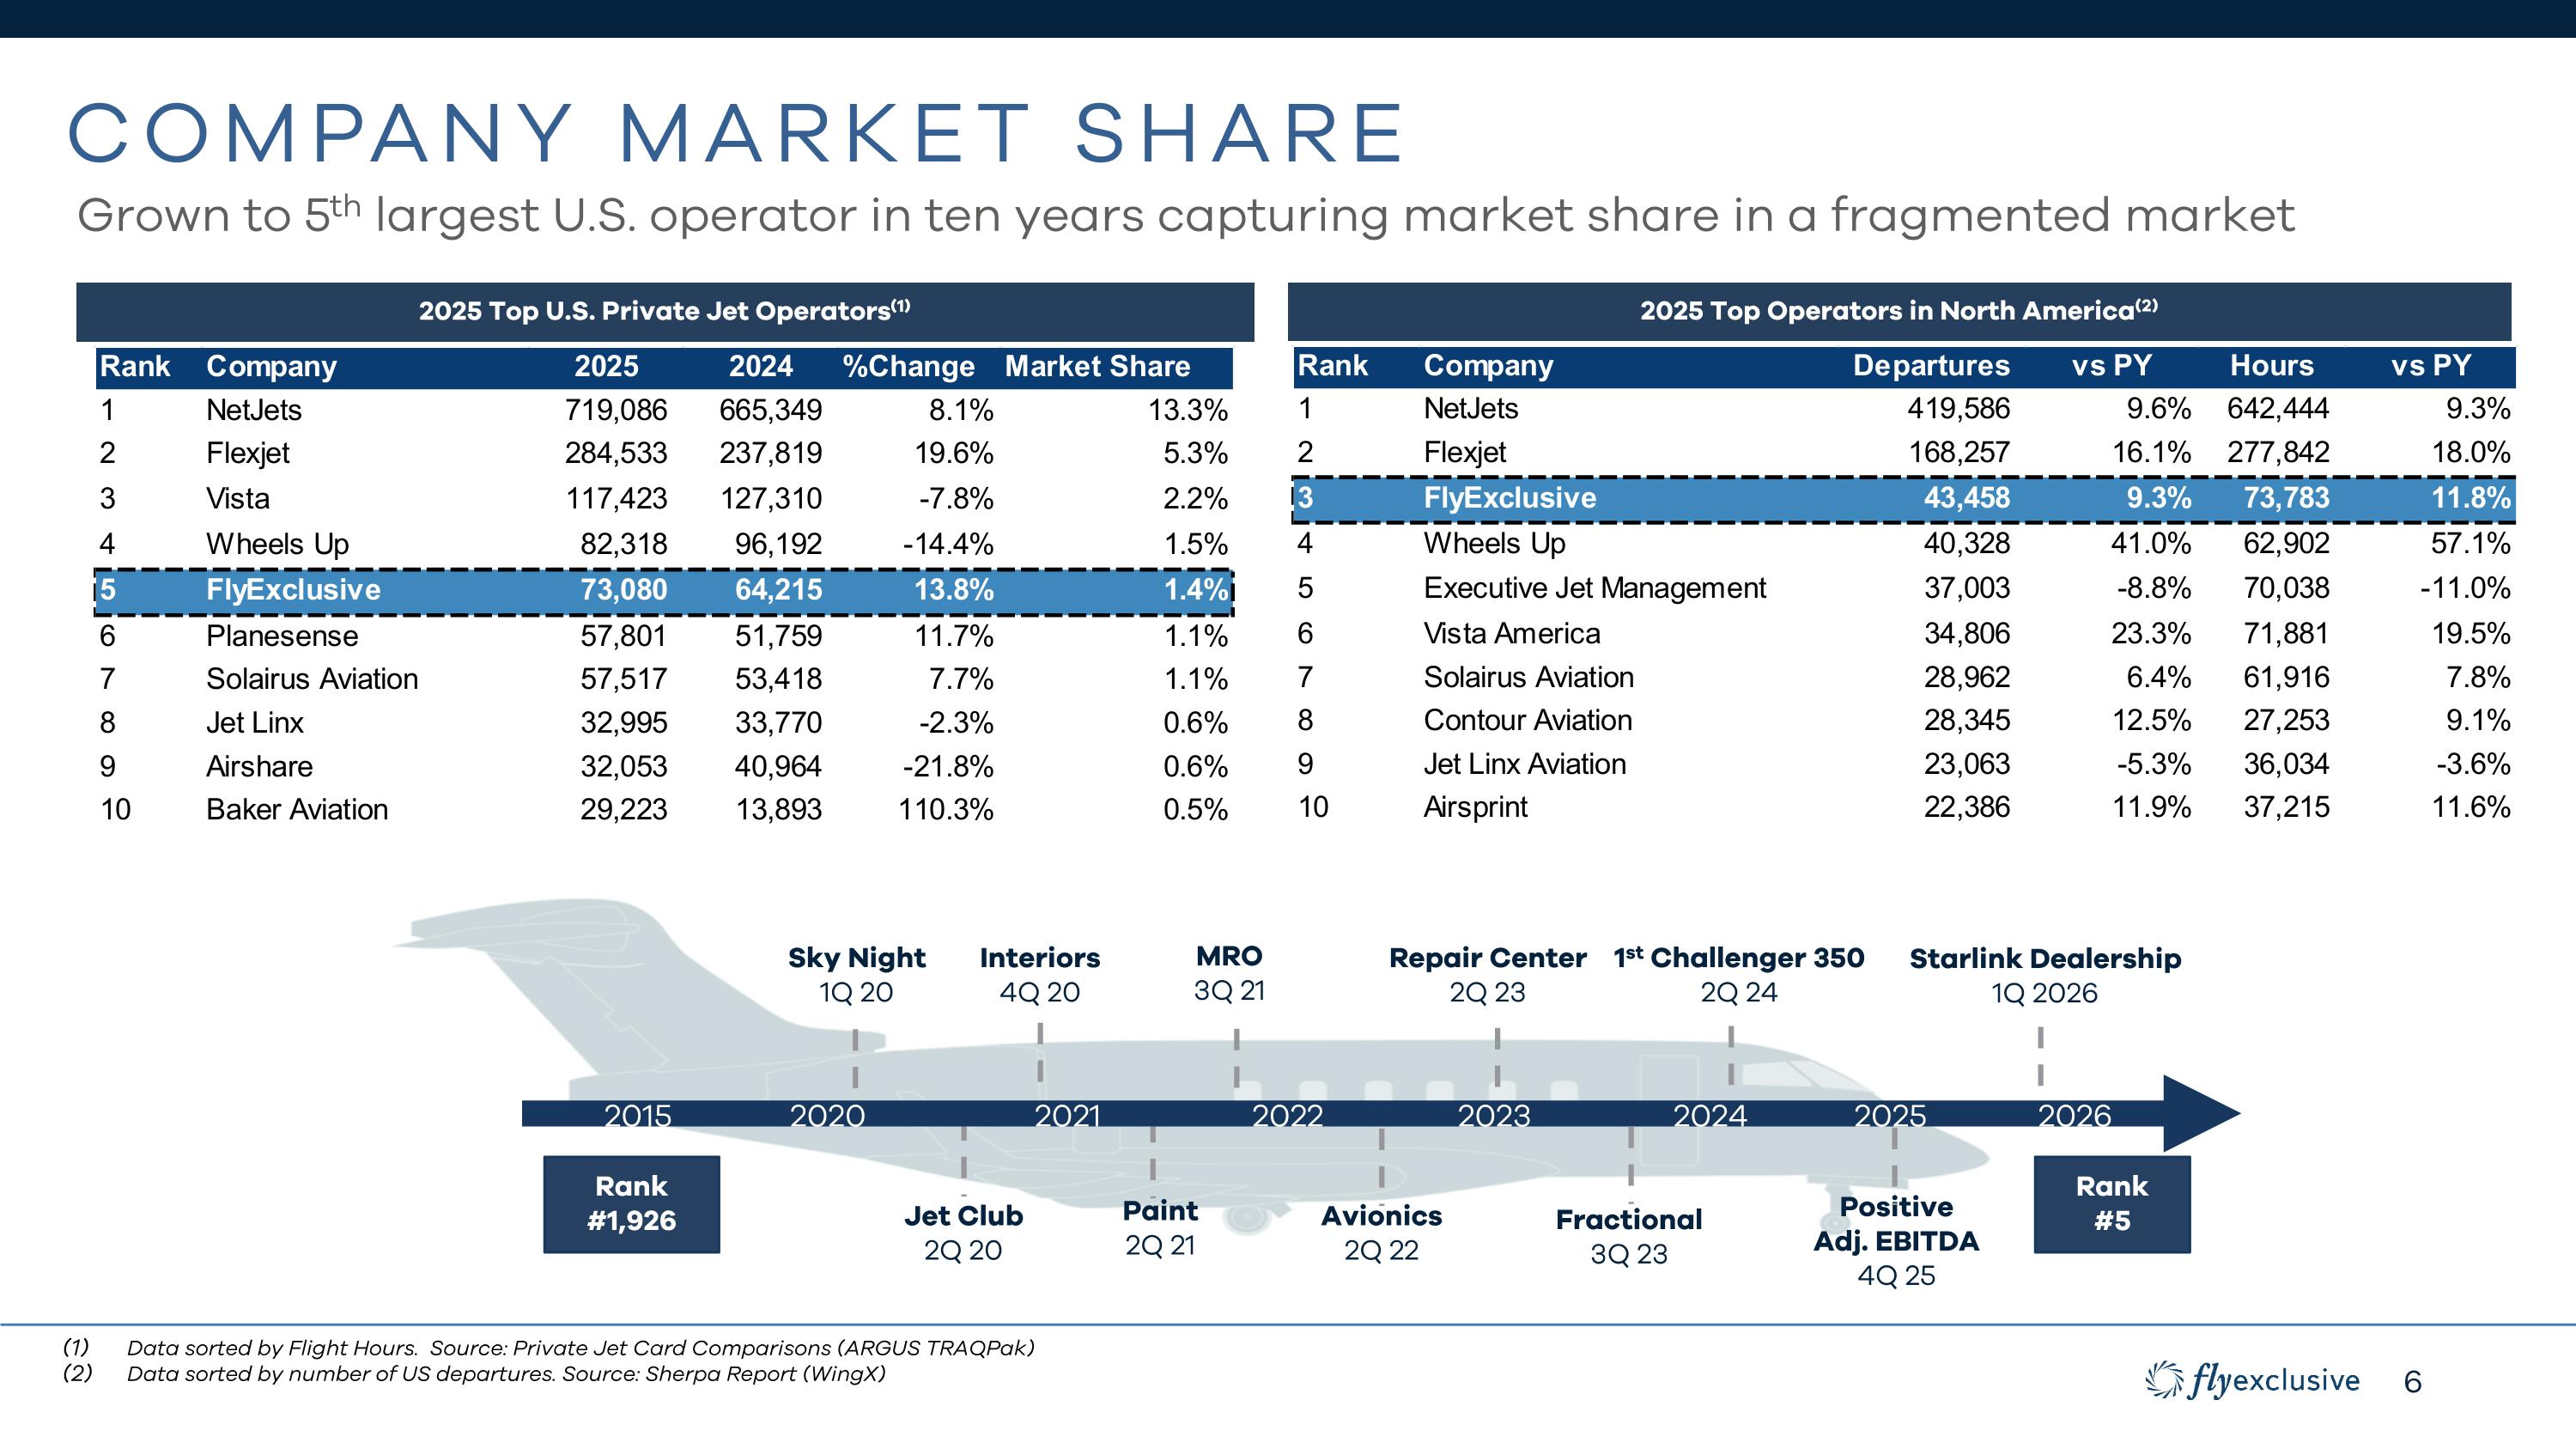
Company Market Share Grown to 5th largest U.S. operator in ten years capturing market share in a fragmented market Avionics 2Q 22 2025 Top U.S. Private Jet Operators(1) Paint 2Q 21 Sky Night 1Q 20 Interiors 4Q 20 Jet Club 2Q 20 Rank #1,926 Rank #5 MRO 3Q 21 Repair Center 2Q 23 2024 1st Challenger 350 2Q 24 Fractional 3Q 23 2021 2015 2023 2022 2020 2025 Top Operators in North America(2) 2025 Positive Adj. EBITDA 4Q 25 Data sorted by Flight Hours. Source: Private Jet Card Comparisons (ARGUS TRAQPak) Data sorted by number of US departures. Source: Sherpa Report (WingX) Starlink Dealership 1Q 2026 2026
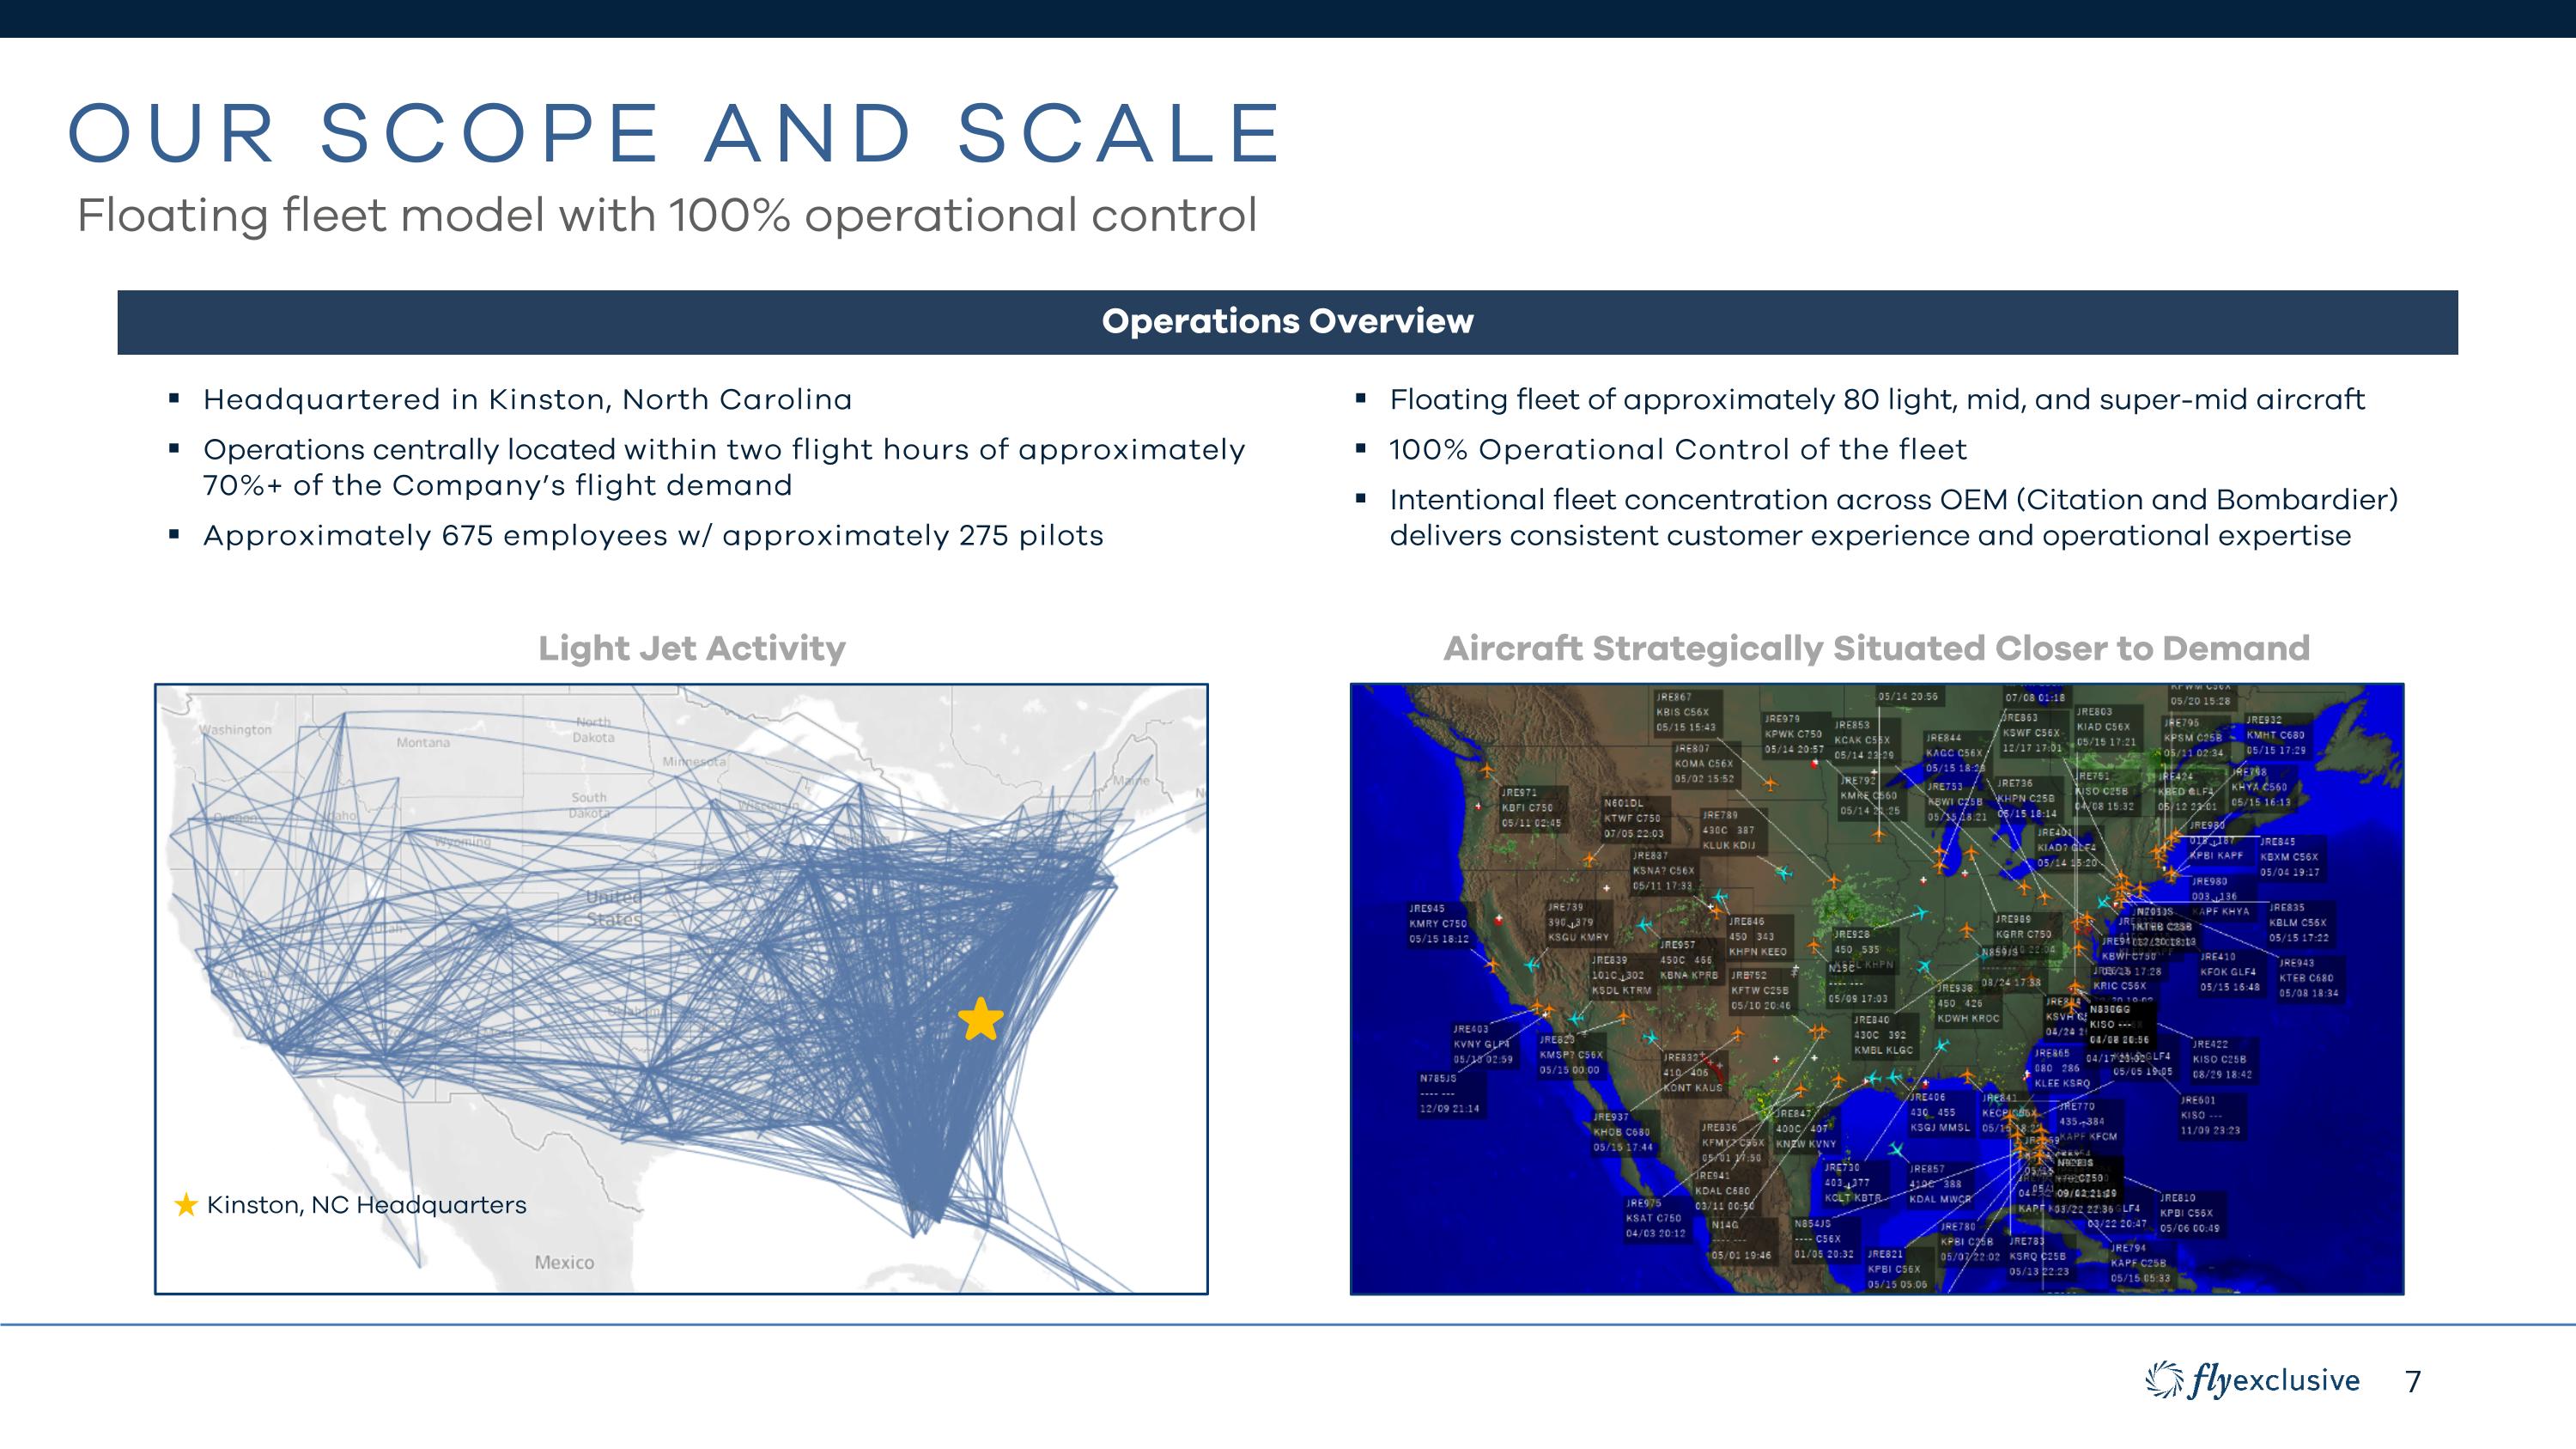
Our scope and Scale Floating fleet model with 100% operational control Headquartered in Kinston, North Carolina Operations centrally located within two flight hours of approximately 70%+ of the Company’s flight demand Approximately 675 employees w/ approximately 275 pilots Operations Overview Light Jet Activity Floating fleet of approximately 80 light, mid, and super-mid aircraft 100% Operational Control of the fleet Intentional fleet concentration across OEM (Citation and Bombardier) delivers consistent customer experience and operational expertise Aircraft Strategically Situated Closer to Demand Kinston, NC Headquarters
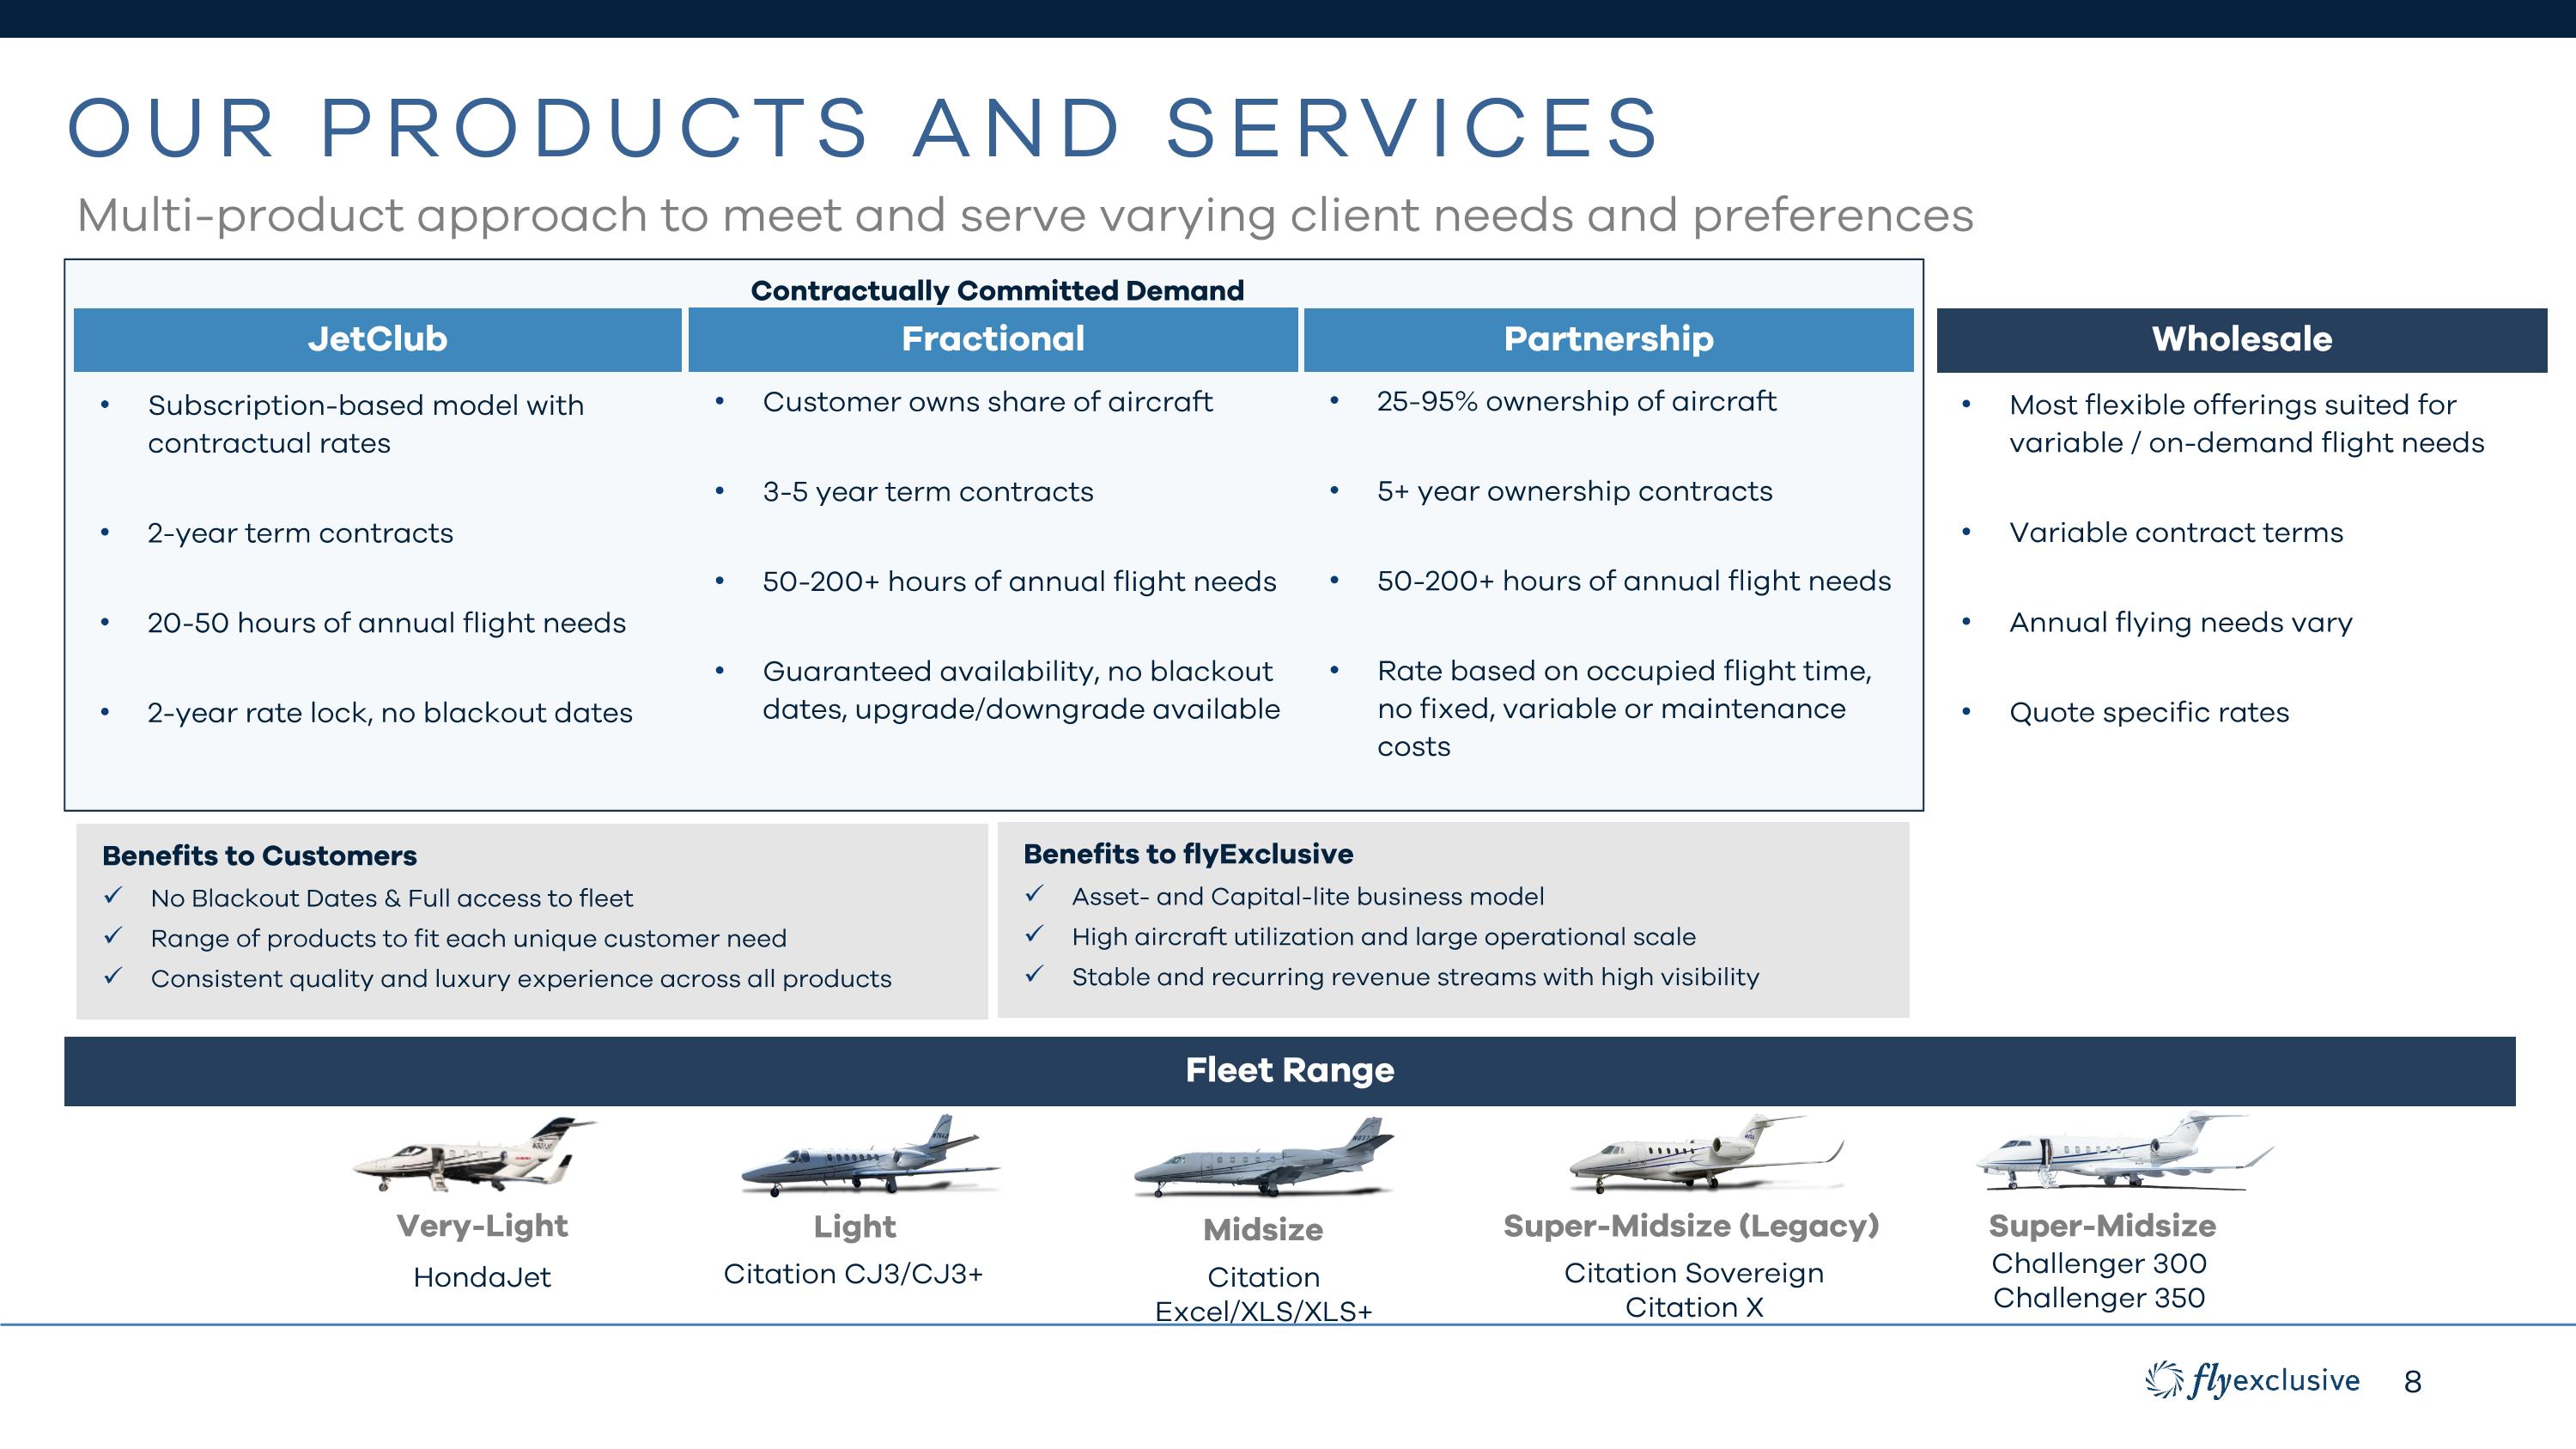
Multi-product approach to meet and serve varying client needs and preferences OUR PRODUCTS AND SERVICES Fleet Range Light Citation CJ3/CJ3+ Midsize Citation Excel/XLS/XLS+ Super-Midsize (Legacy) Citation Sovereign Citation X Super-Midsize Challenger 300 Challenger 350 Very-Light HondaJet Benefits to Customers No Blackout Dates & Full access to fleet Range of products to fit each unique customer need Consistent quality and luxury experience across all products Benefits to flyExclusive Asset- and Capital-lite business model High aircraft utilization and large operational scale Stable and recurring revenue streams with high visibility Wholesale Most flexible offerings suited for variable / on-demand flight needs Variable contract terms Annual flying needs vary Quote specific rates JetClub Fractional Partnership Subscription-based model with contractual rates 2-year term contracts 20-50 hours of annual flight needs 2-year rate lock, no blackout dates Customer owns share of aircraft 3-5 year term contracts 50-200+ hours of annual flight needs Guaranteed availability, no blackout dates, upgrade/downgrade available 25-95% ownership of aircraft 5+ year ownership contracts 50-200+ hours of annual flight needs Rate based on occupied flight time, no fixed, variable or maintenance costs Contractually Committed Demand
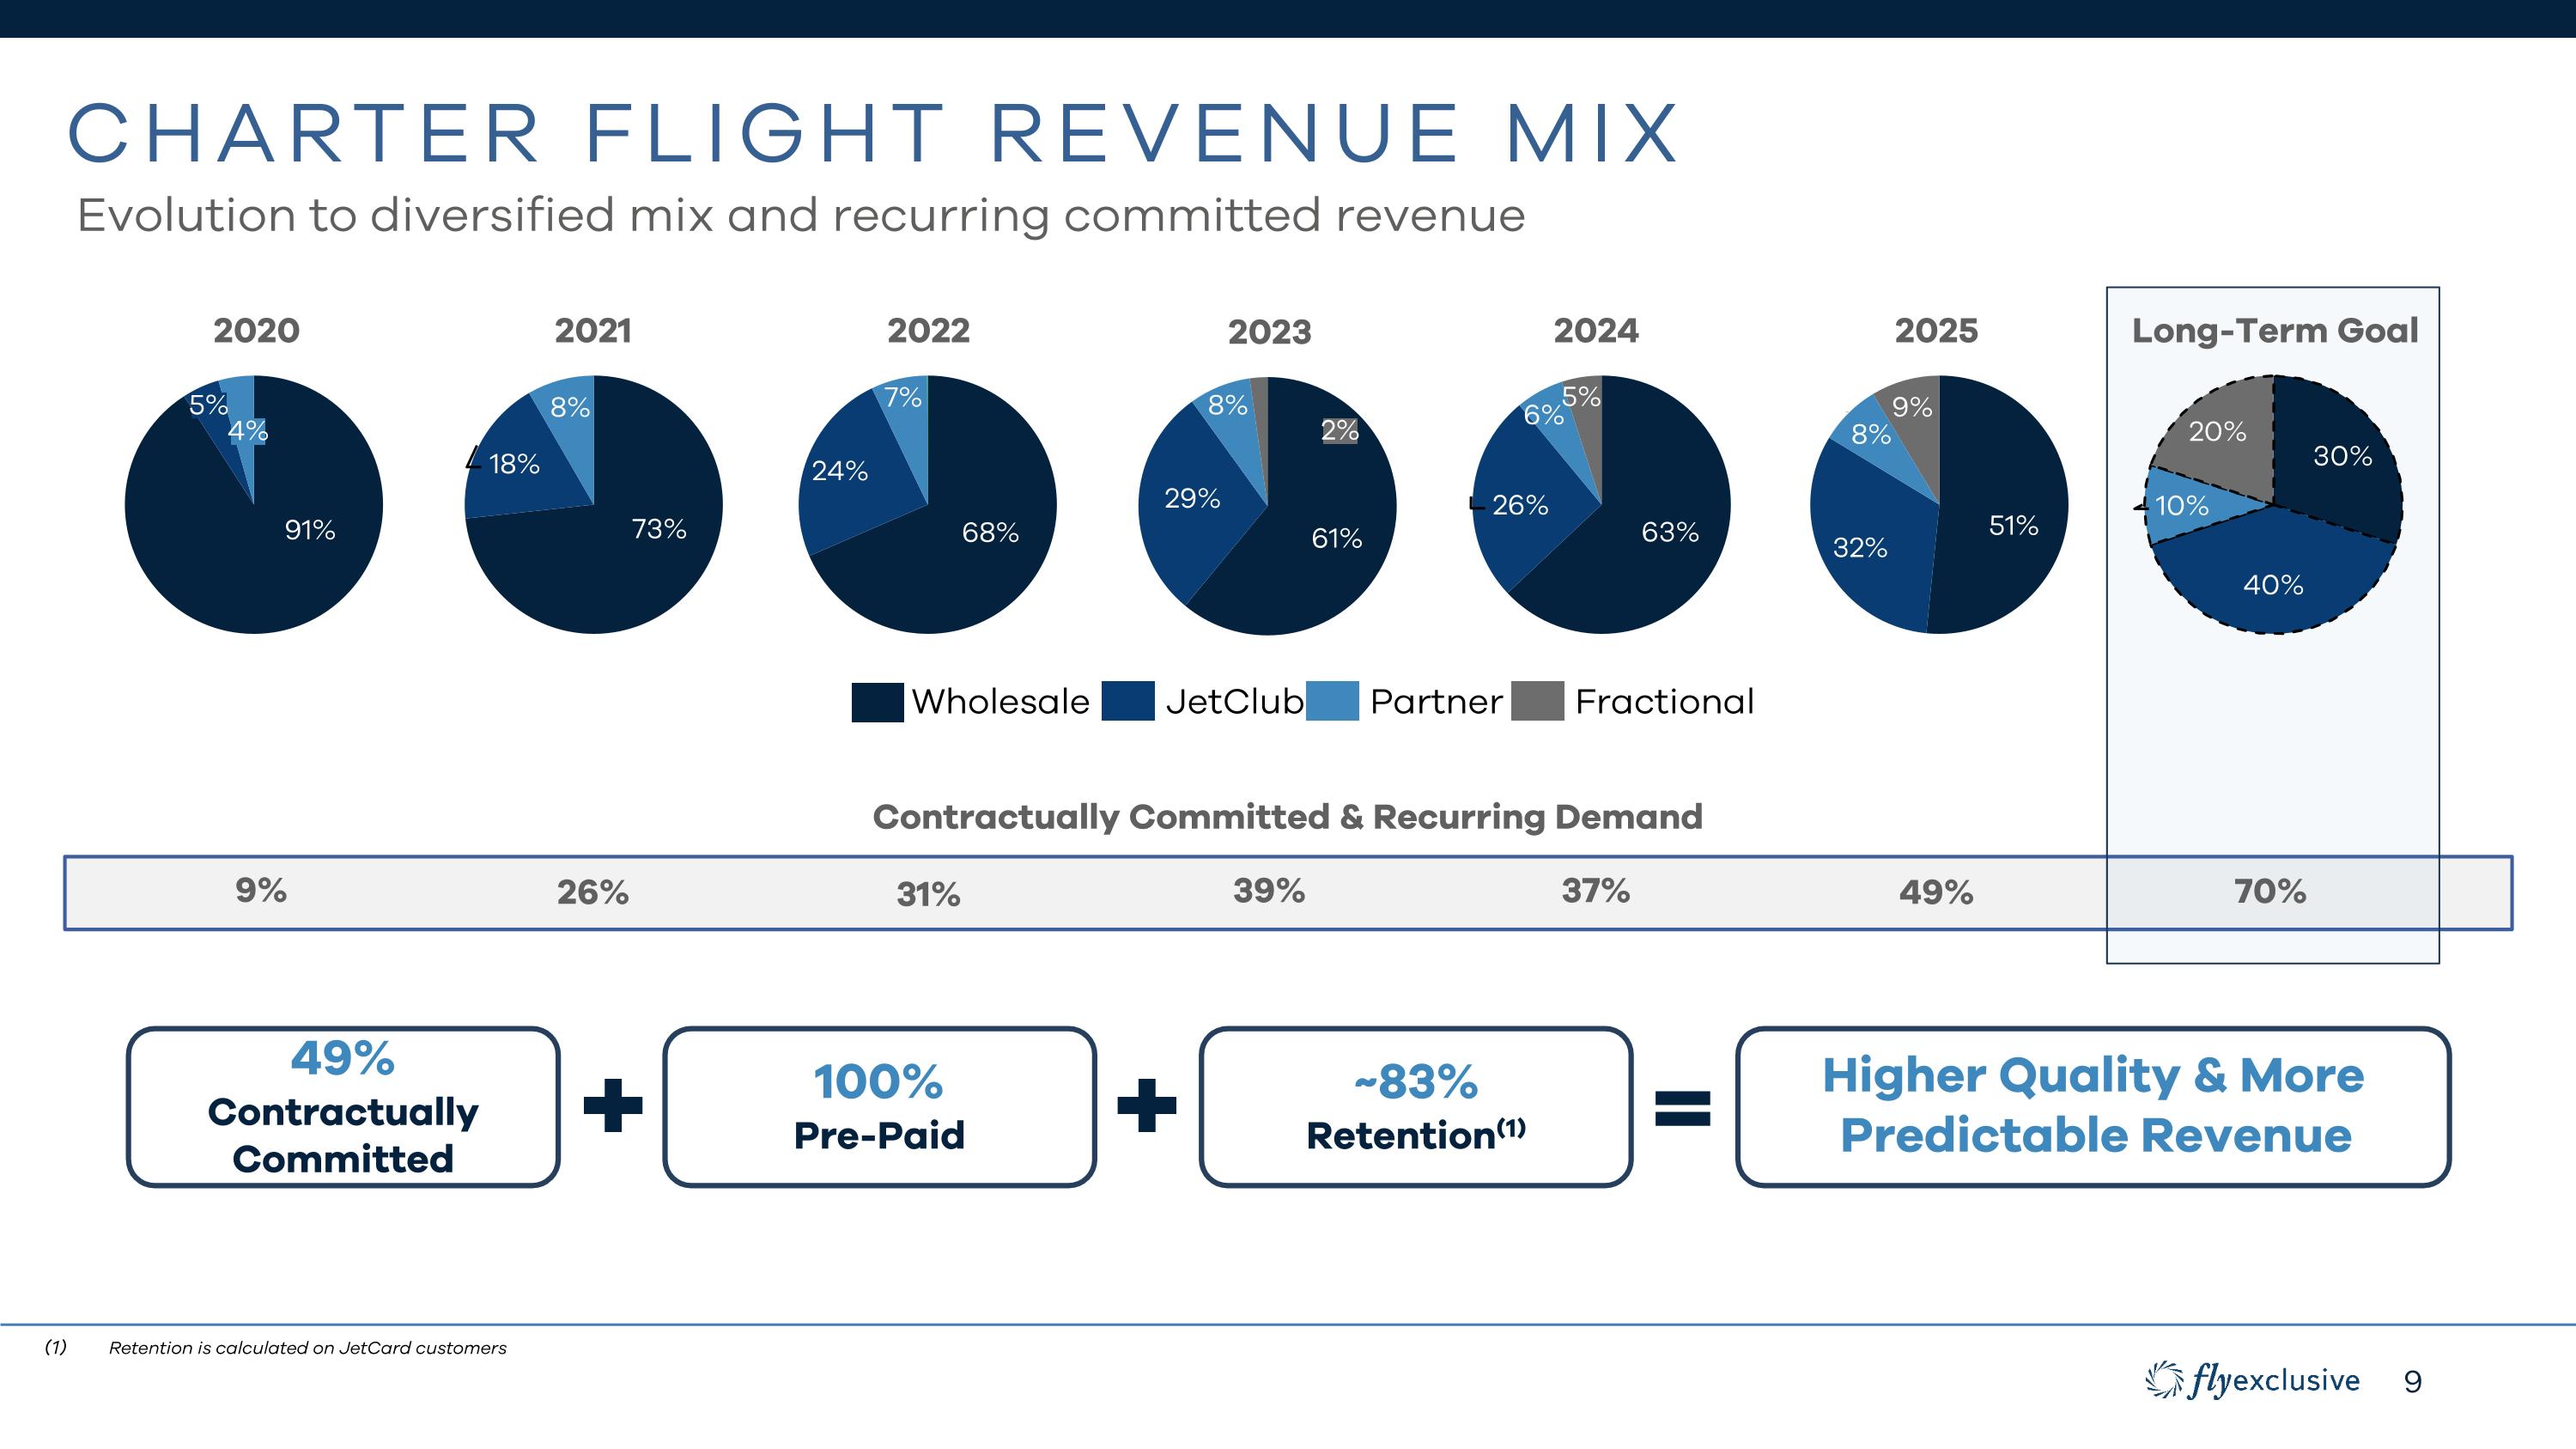
Charter FLIGHT Revenue Mix Evolution to diversified mix and recurring committed revenue 5% 4% Contractually Committed & Recurring Demand 9% 26% 31% 39% 37% Wholesale JetClub Partner Fractional 2% 49% 2021 2022 2023 2020 2024 2025 Long-Term Goal 70% 49% Contractually Committed 100% Pre-Paid ~83% Retention(1) Retention is calculated on JetCard customers Higher Quality & More Predictable Revenue
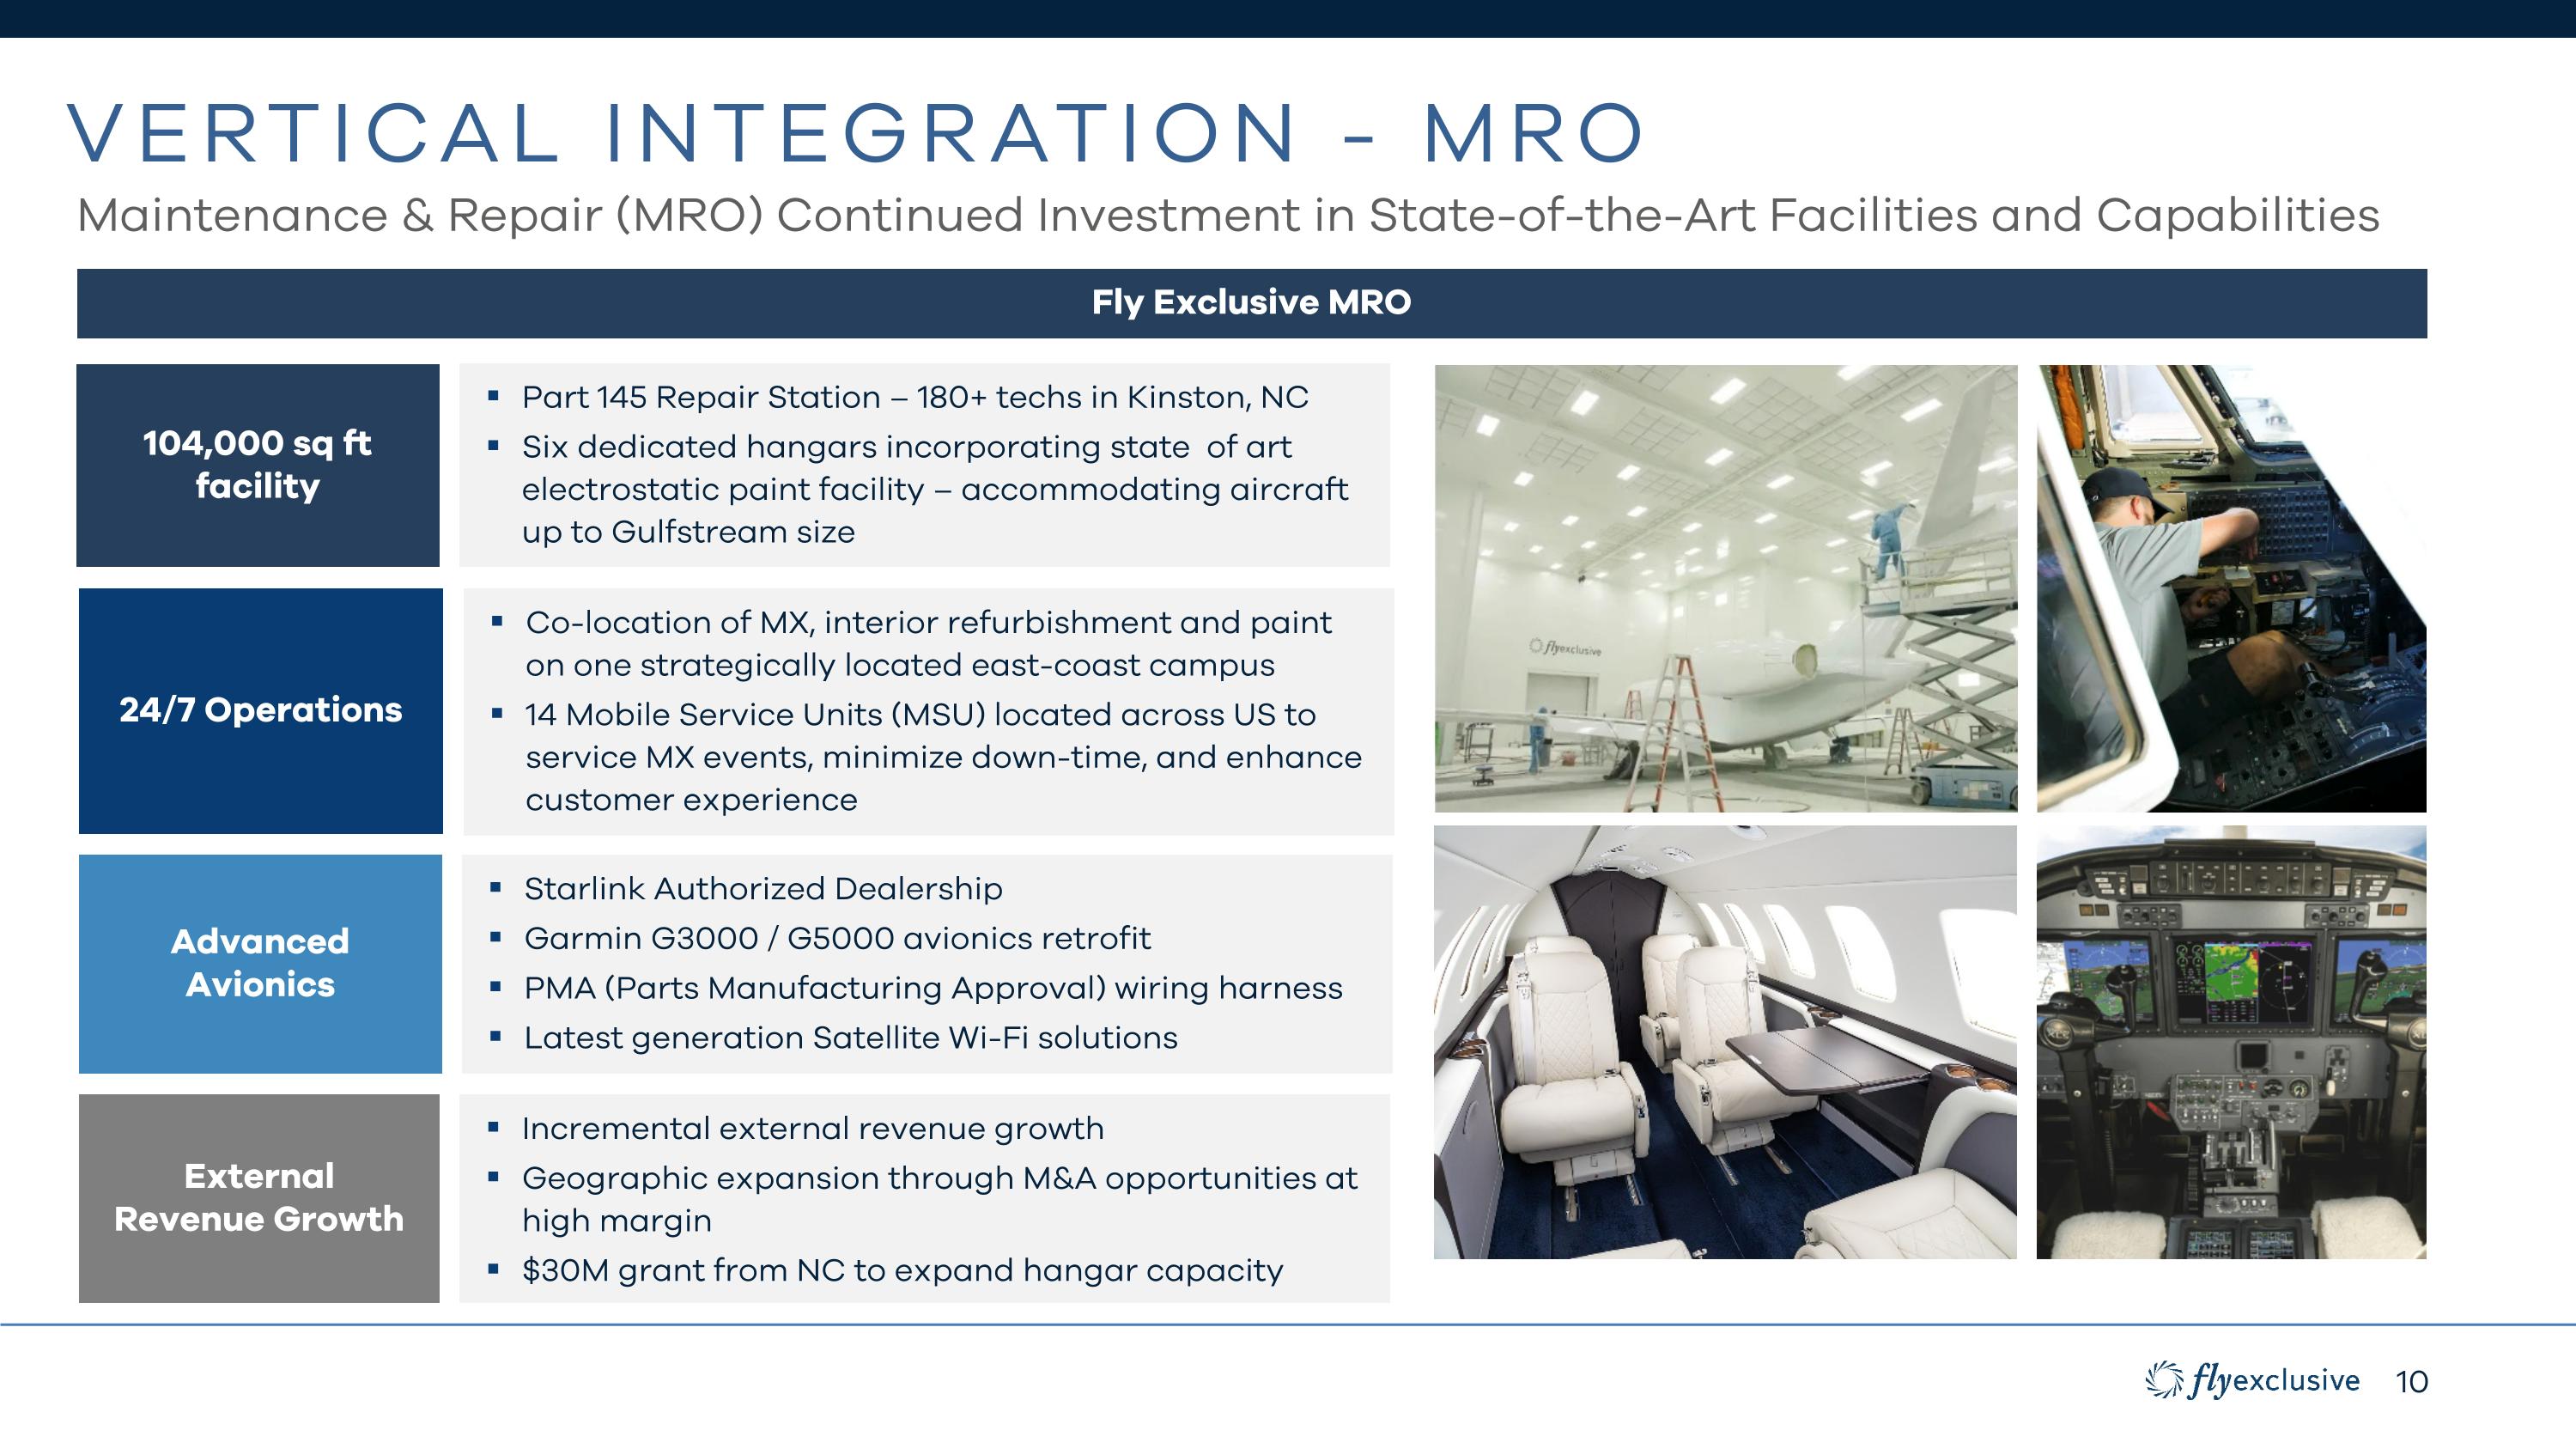
Vertical Integration - MRO Maintenance & Repair (MRO) Continued Investment in State-of-the-Art Facilities and Capabilities Part 145 Repair Station – 180+ techs in Kinston, NC Six dedicated hangars incorporating state of art electrostatic paint facility – accommodating aircraft up to Gulfstream size Co-location of MX, interior refurbishment and paint on one strategically located east-coast campus 14 Mobile Service Units (MSU) located across US to service MX events, minimize down-time, and enhance customer experience Incremental external revenue growth Geographic expansion through M&A opportunities at high margin $30M grant from NC to expand hangar capacity Starlink Authorized Dealership Garmin G3000 / G5000 avionics retrofit PMA (Parts Manufacturing Approval) wiring harness Latest generation Satellite Wi-Fi solutions Fly Exclusive MRO 104,000 sq ft facility 24/7 Operations Advanced Avionics External Revenue Growth
I. EXECUTIVE SUMMARY Q2 2026 PERFORMANCE
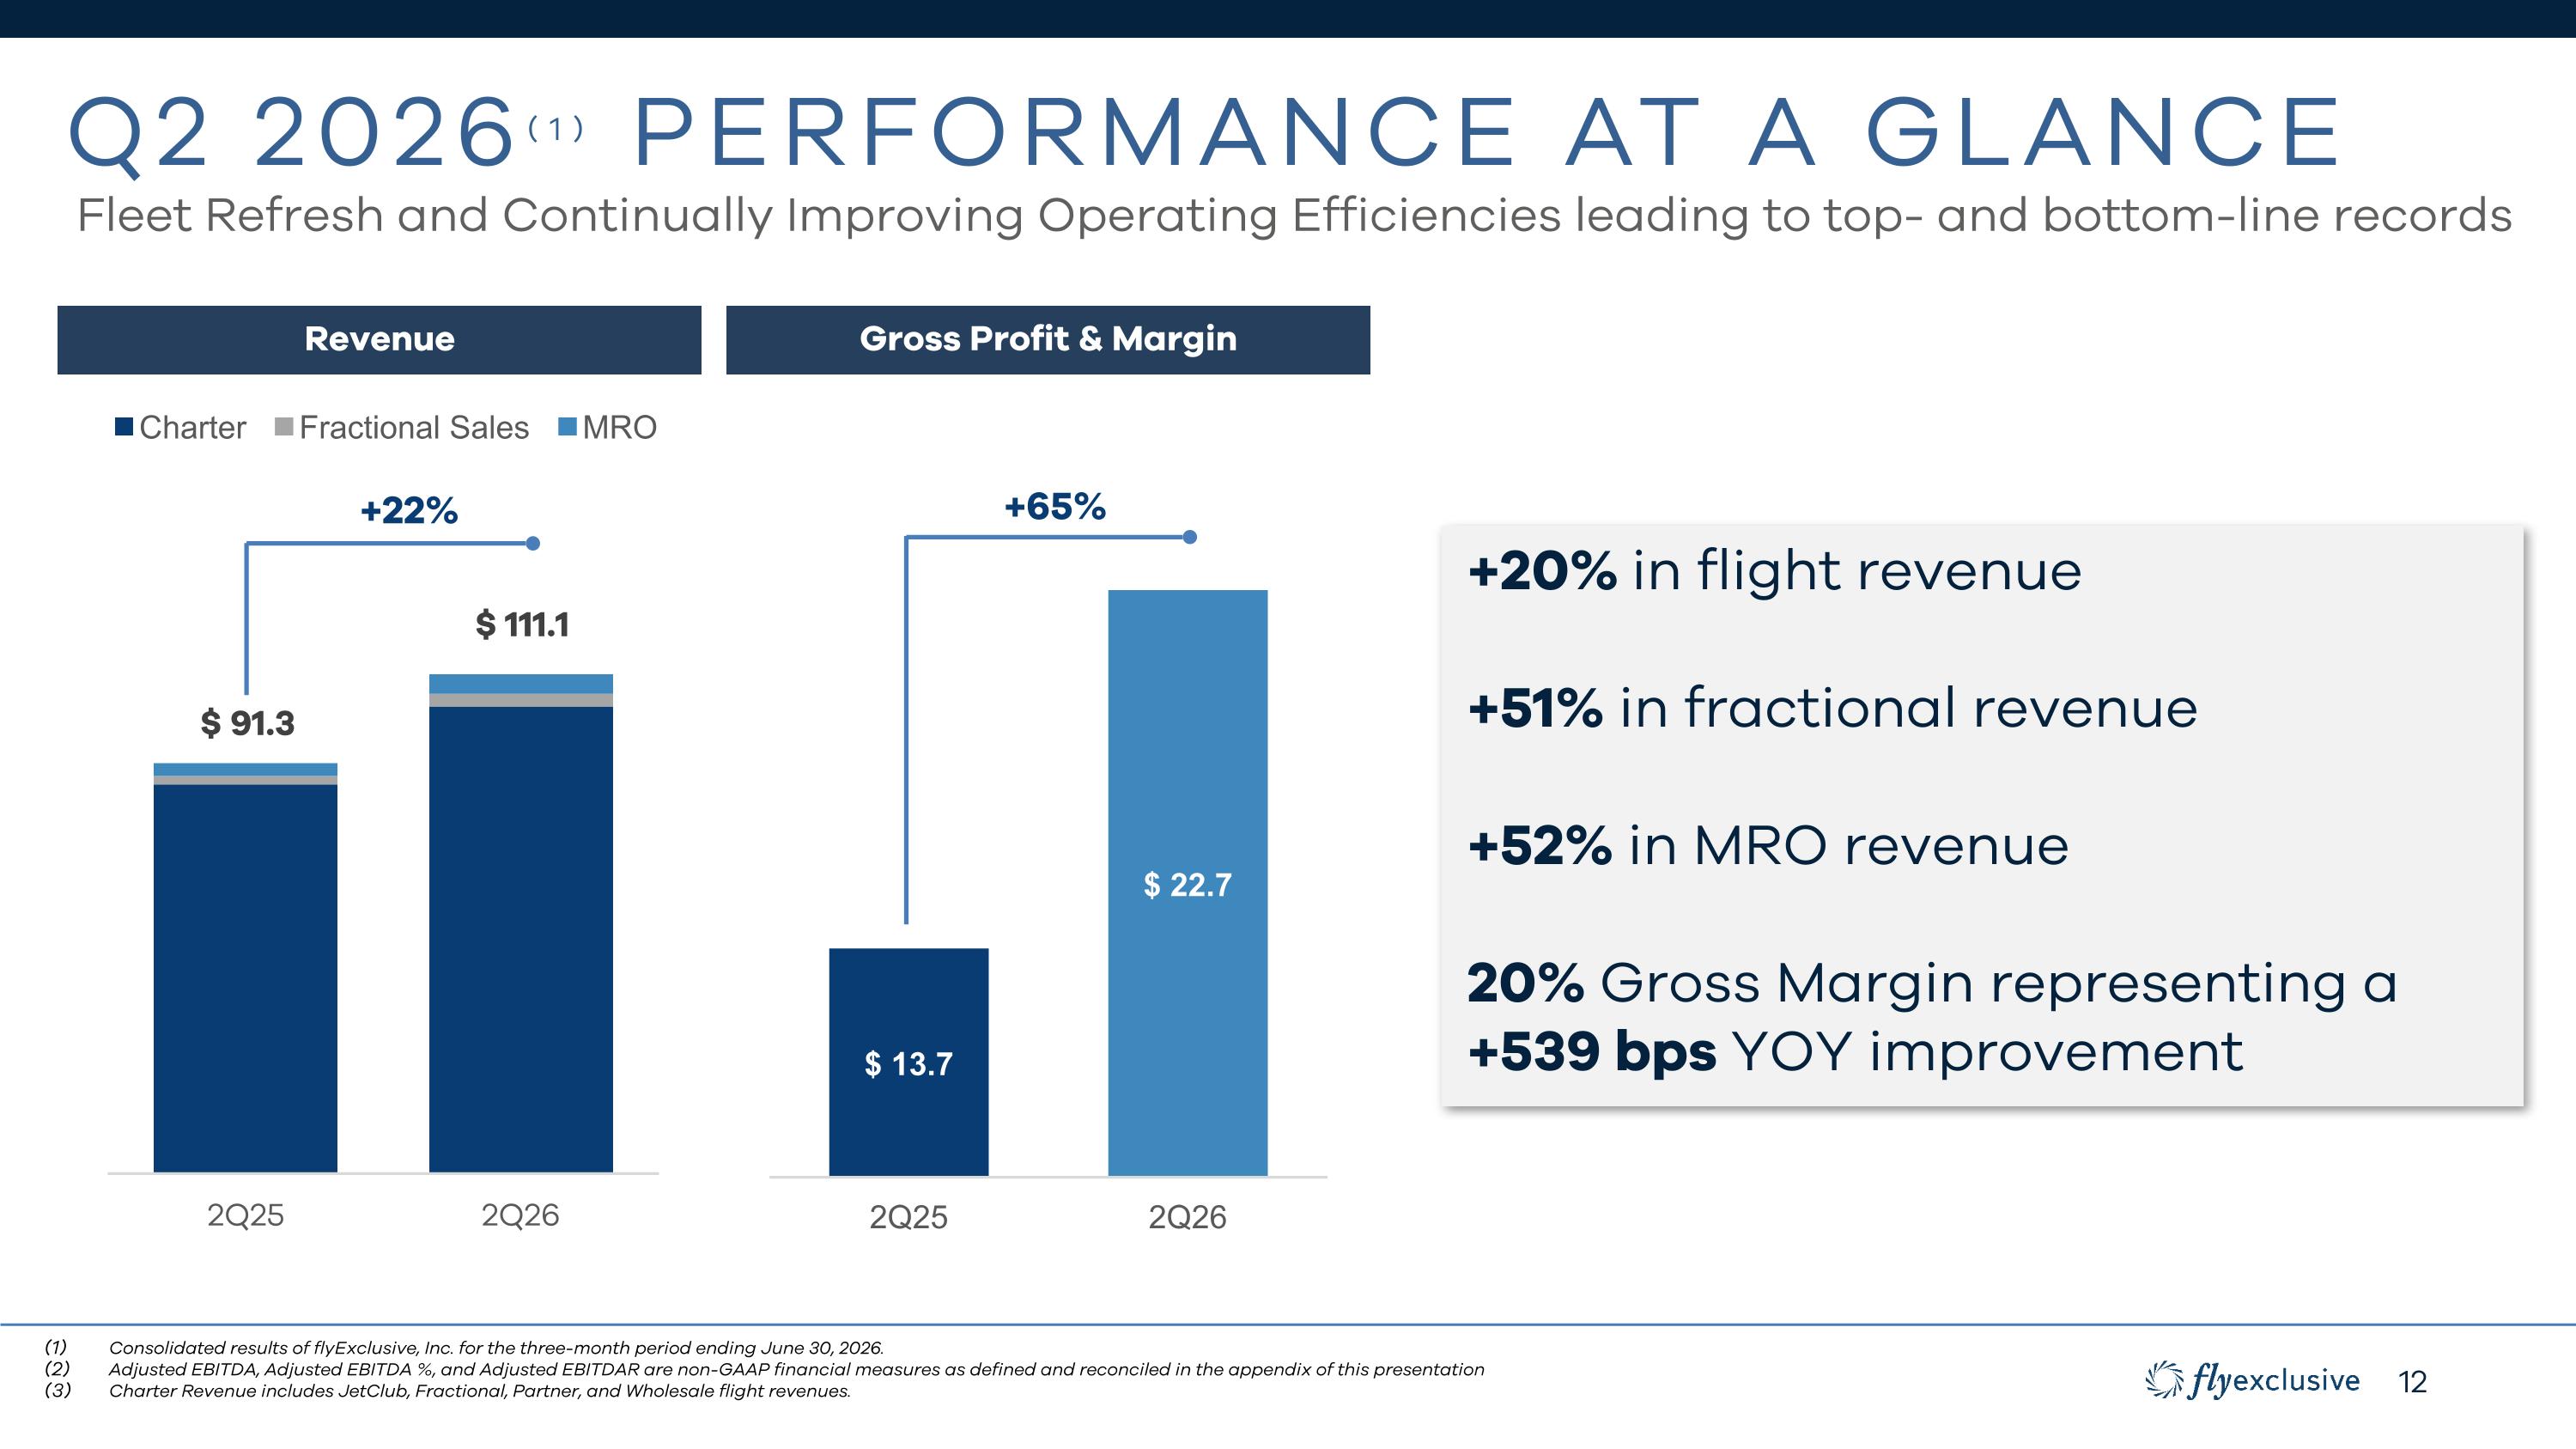
Q2 2026(1) Performance at a glance Fleet Refresh and Continually Improving Operating Efficiencies leading to top- and bottom-line records Revenue Consolidated results of flyExclusive, Inc. for the three-month period ending June 30, 2026. Adjusted EBITDA, Adjusted EBITDA %, and Adjusted EBITDAR are non-GAAP financial measures as defined and reconciled in the appendix of this presentation Charter Revenue includes JetClub, Fractional, Partner, and Wholesale flight revenues. +22% Gross Profit & Margin +65% +20% in flight revenue +51% in fractional revenue +52% in MRO revenue 20% Gross Margin representing a +539 bps YOY improvement
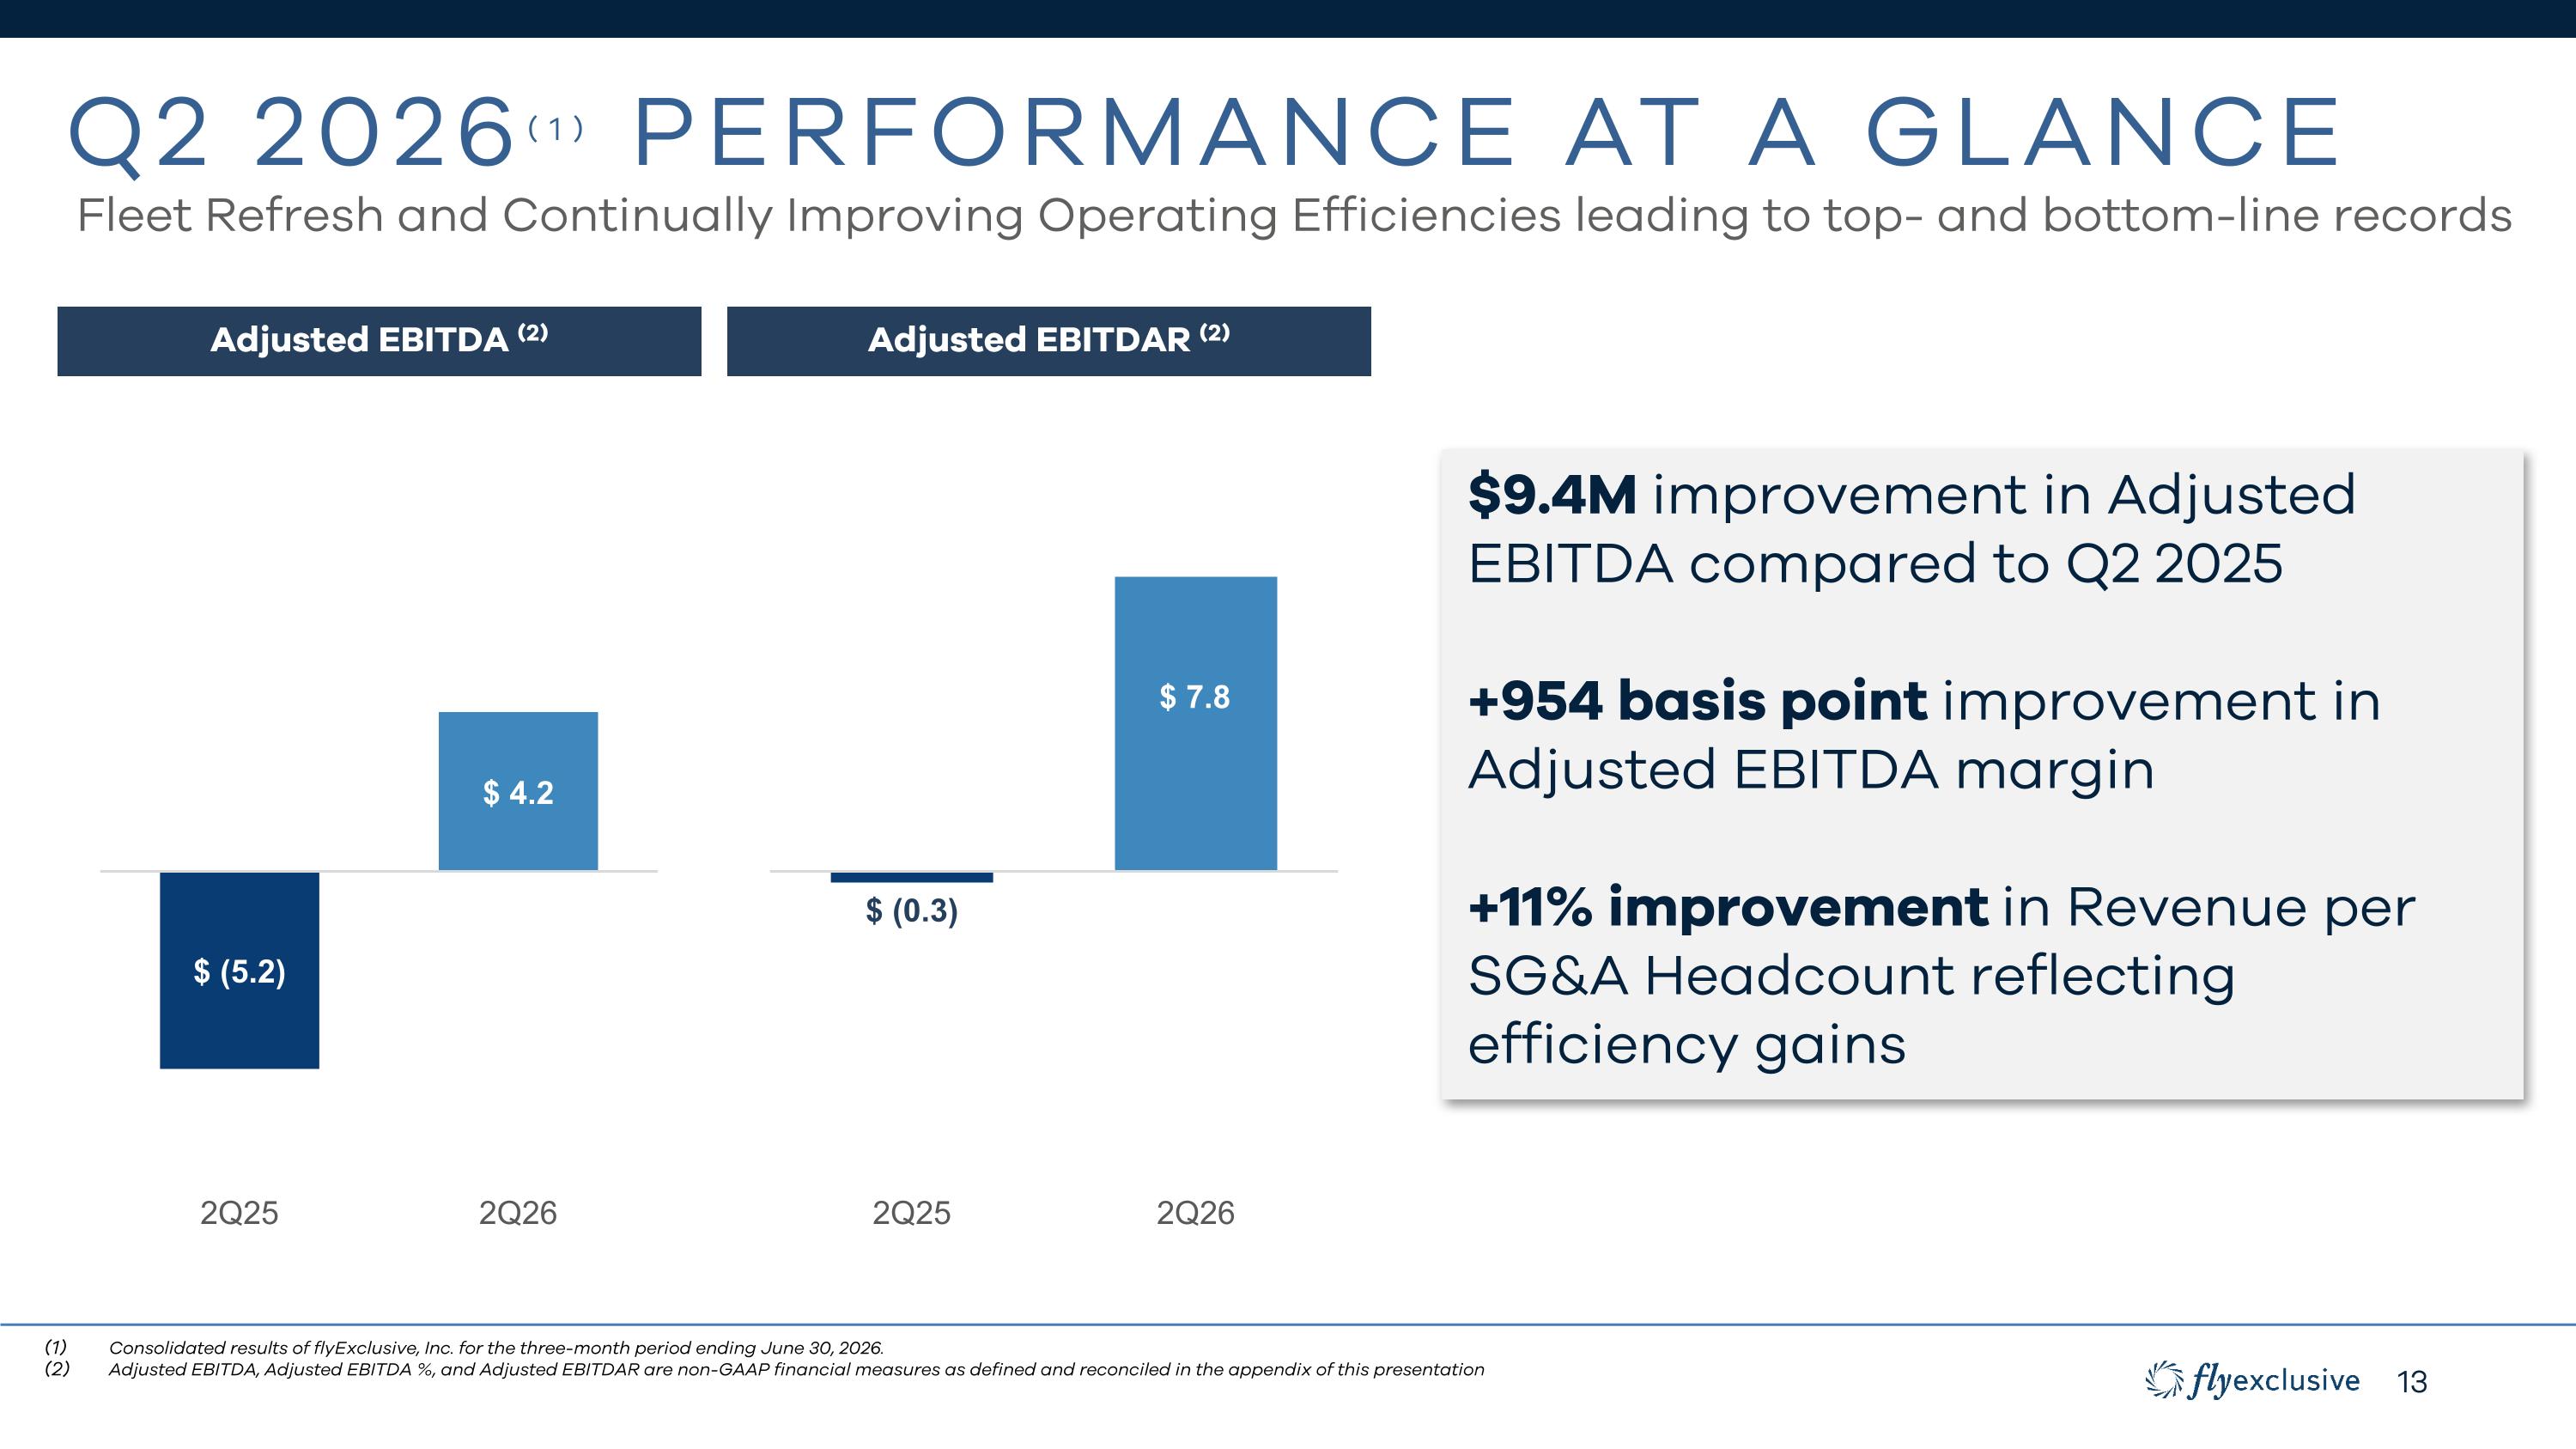
Q2 2026(1) Performance at a glance Adjusted EBITDA (2) Adjusted EBITDAR (2) $9.4M improvement in Adjusted EBITDA compared to Q2 2025 +954 basis point improvement in Adjusted EBITDA margin +11% improvement in Revenue per SG&A Headcount reflecting efficiency gains Fleet Refresh and Continually Improving Operating Efficiencies leading to top- and bottom-line records Consolidated results of flyExclusive, Inc. for the three-month period ending June 30, 2026. Adjusted EBITDA, Adjusted EBITDA %, and Adjusted EBITDAR are non-GAAP financial measures as defined and reconciled in the appendix of this presentation
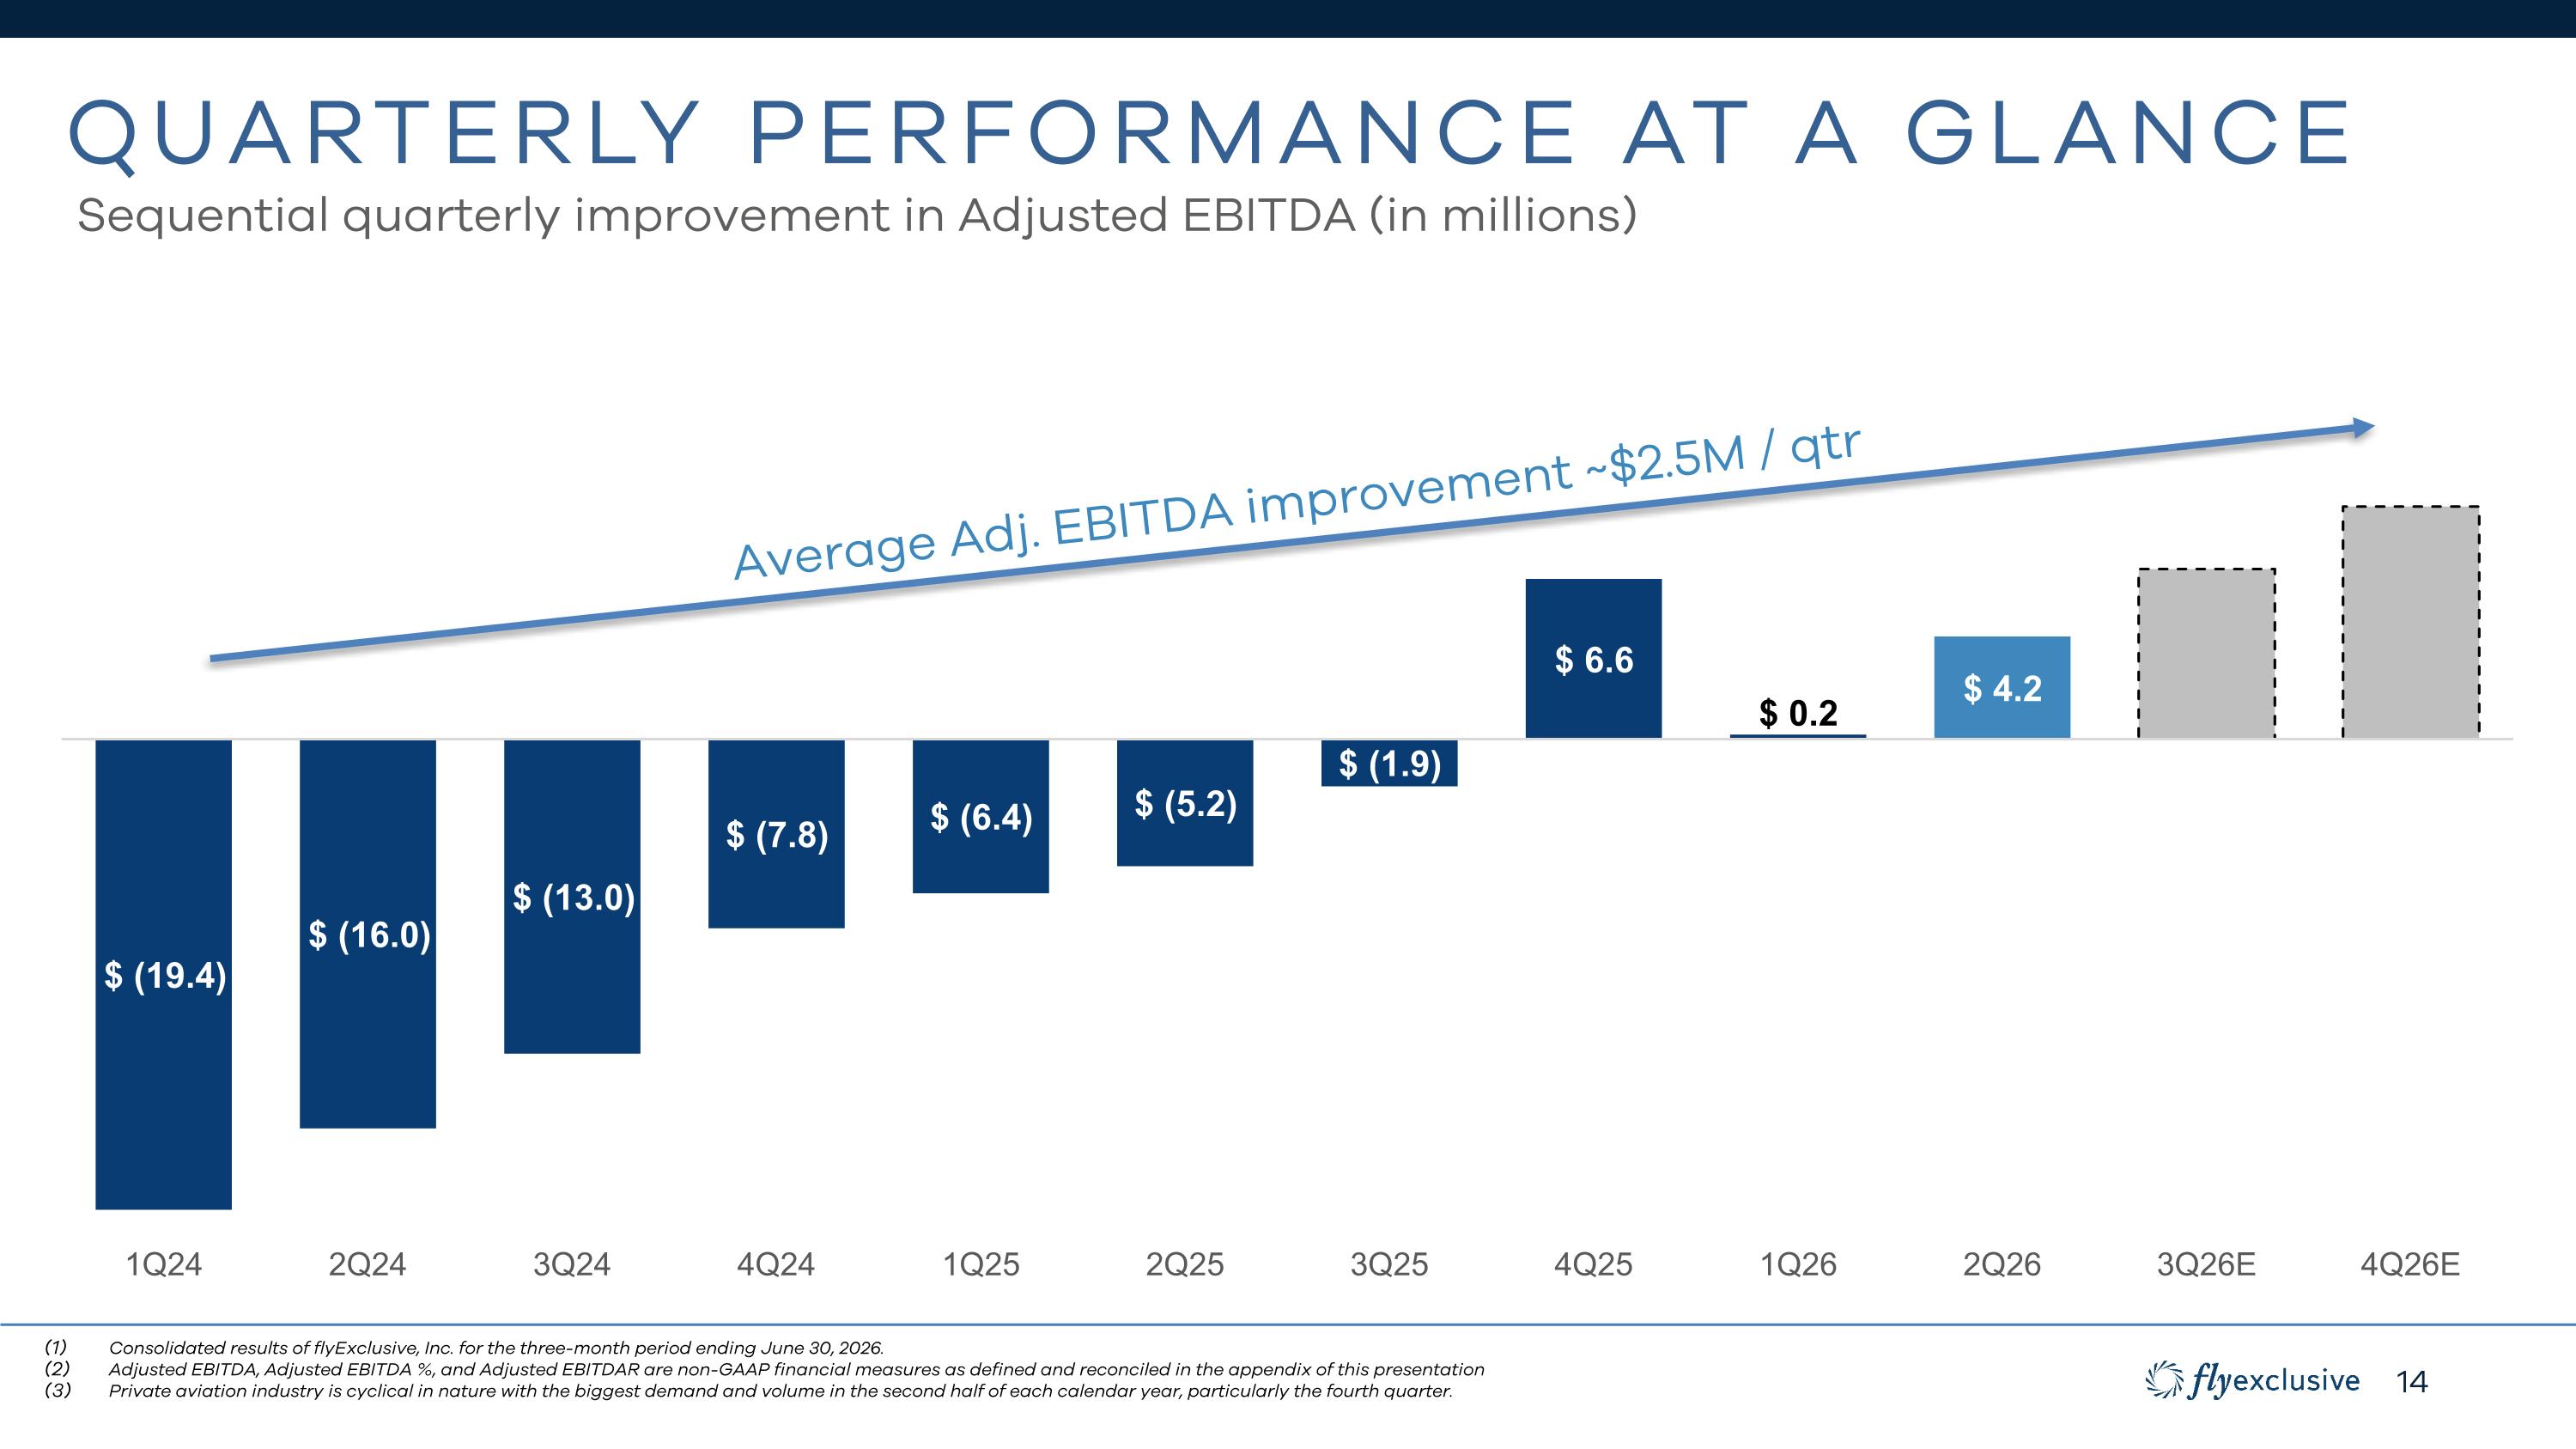
Quarterly Performance at a glance Sequential quarterly improvement in Adjusted EBITDA (in millions) Consolidated results of flyExclusive, Inc. for the three-month period ending June 30, 2026. Adjusted EBITDA, Adjusted EBITDA %, and Adjusted EBITDAR are non-GAAP financial measures as defined and reconciled in the appendix of this presentation Private aviation industry is cyclical in nature with the biggest demand and volume in the second half of each calendar year, particularly the fourth quarter. Average Adj. EBITDA improvement ~$2.5M / qtr
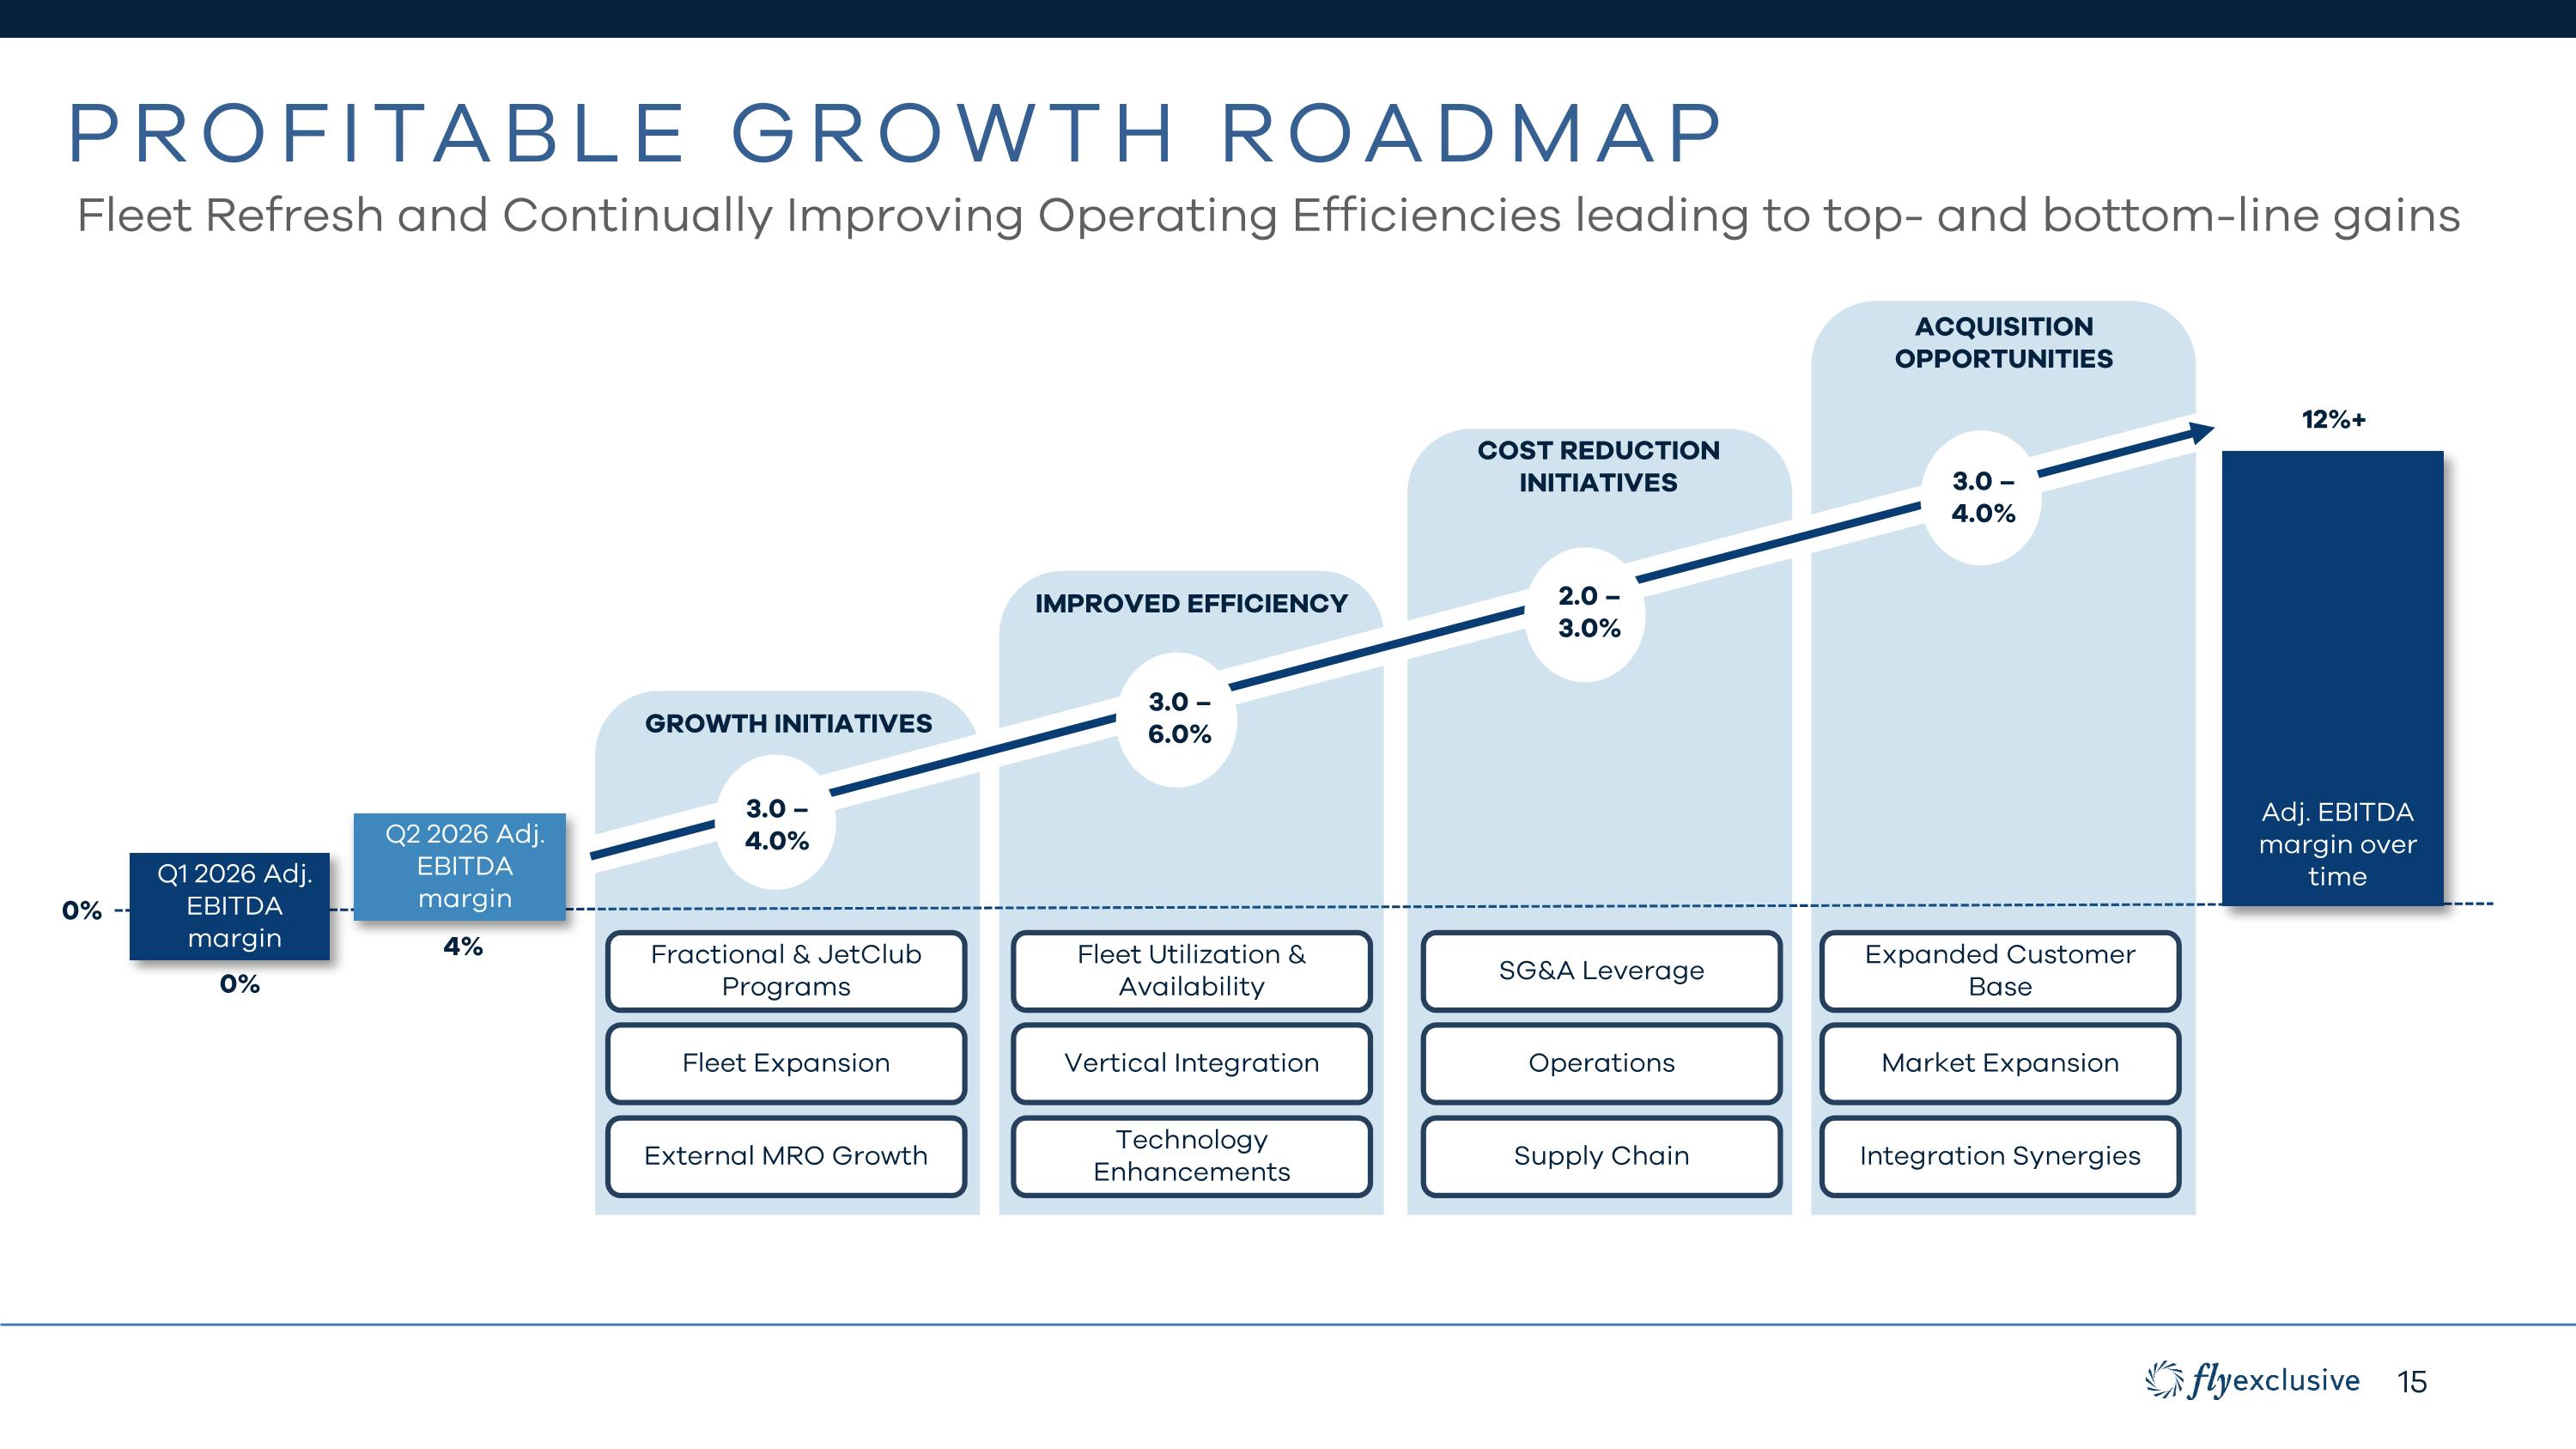
Profitable Growth roadmap Fractional & JetClub Programs Fleet Expansion External MRO Growth Fleet Utilization & Availability Vertical Integration Technology Enhancements SG&A Leverage Operations Supply Chain 0% 12%+ GROWTH INITIATIVES IMPROVED EFFICIENCY COST REDUCTION INITIATIVES 3.0 – 4.0% 3.0 – 6.0% 2.0 – 3.0% 3.0 – 4.0% Expanded Customer Base Market Expansion Integration Synergies Acquisition Opportunities Q1 2026 Adj. EBITDA margin Adj. EBITDA margin over time 0% Fleet Refresh and Continually Improving Operating Efficiencies leading to top- and bottom-line gains Q2 2026 Adj. EBITDA margin 4%
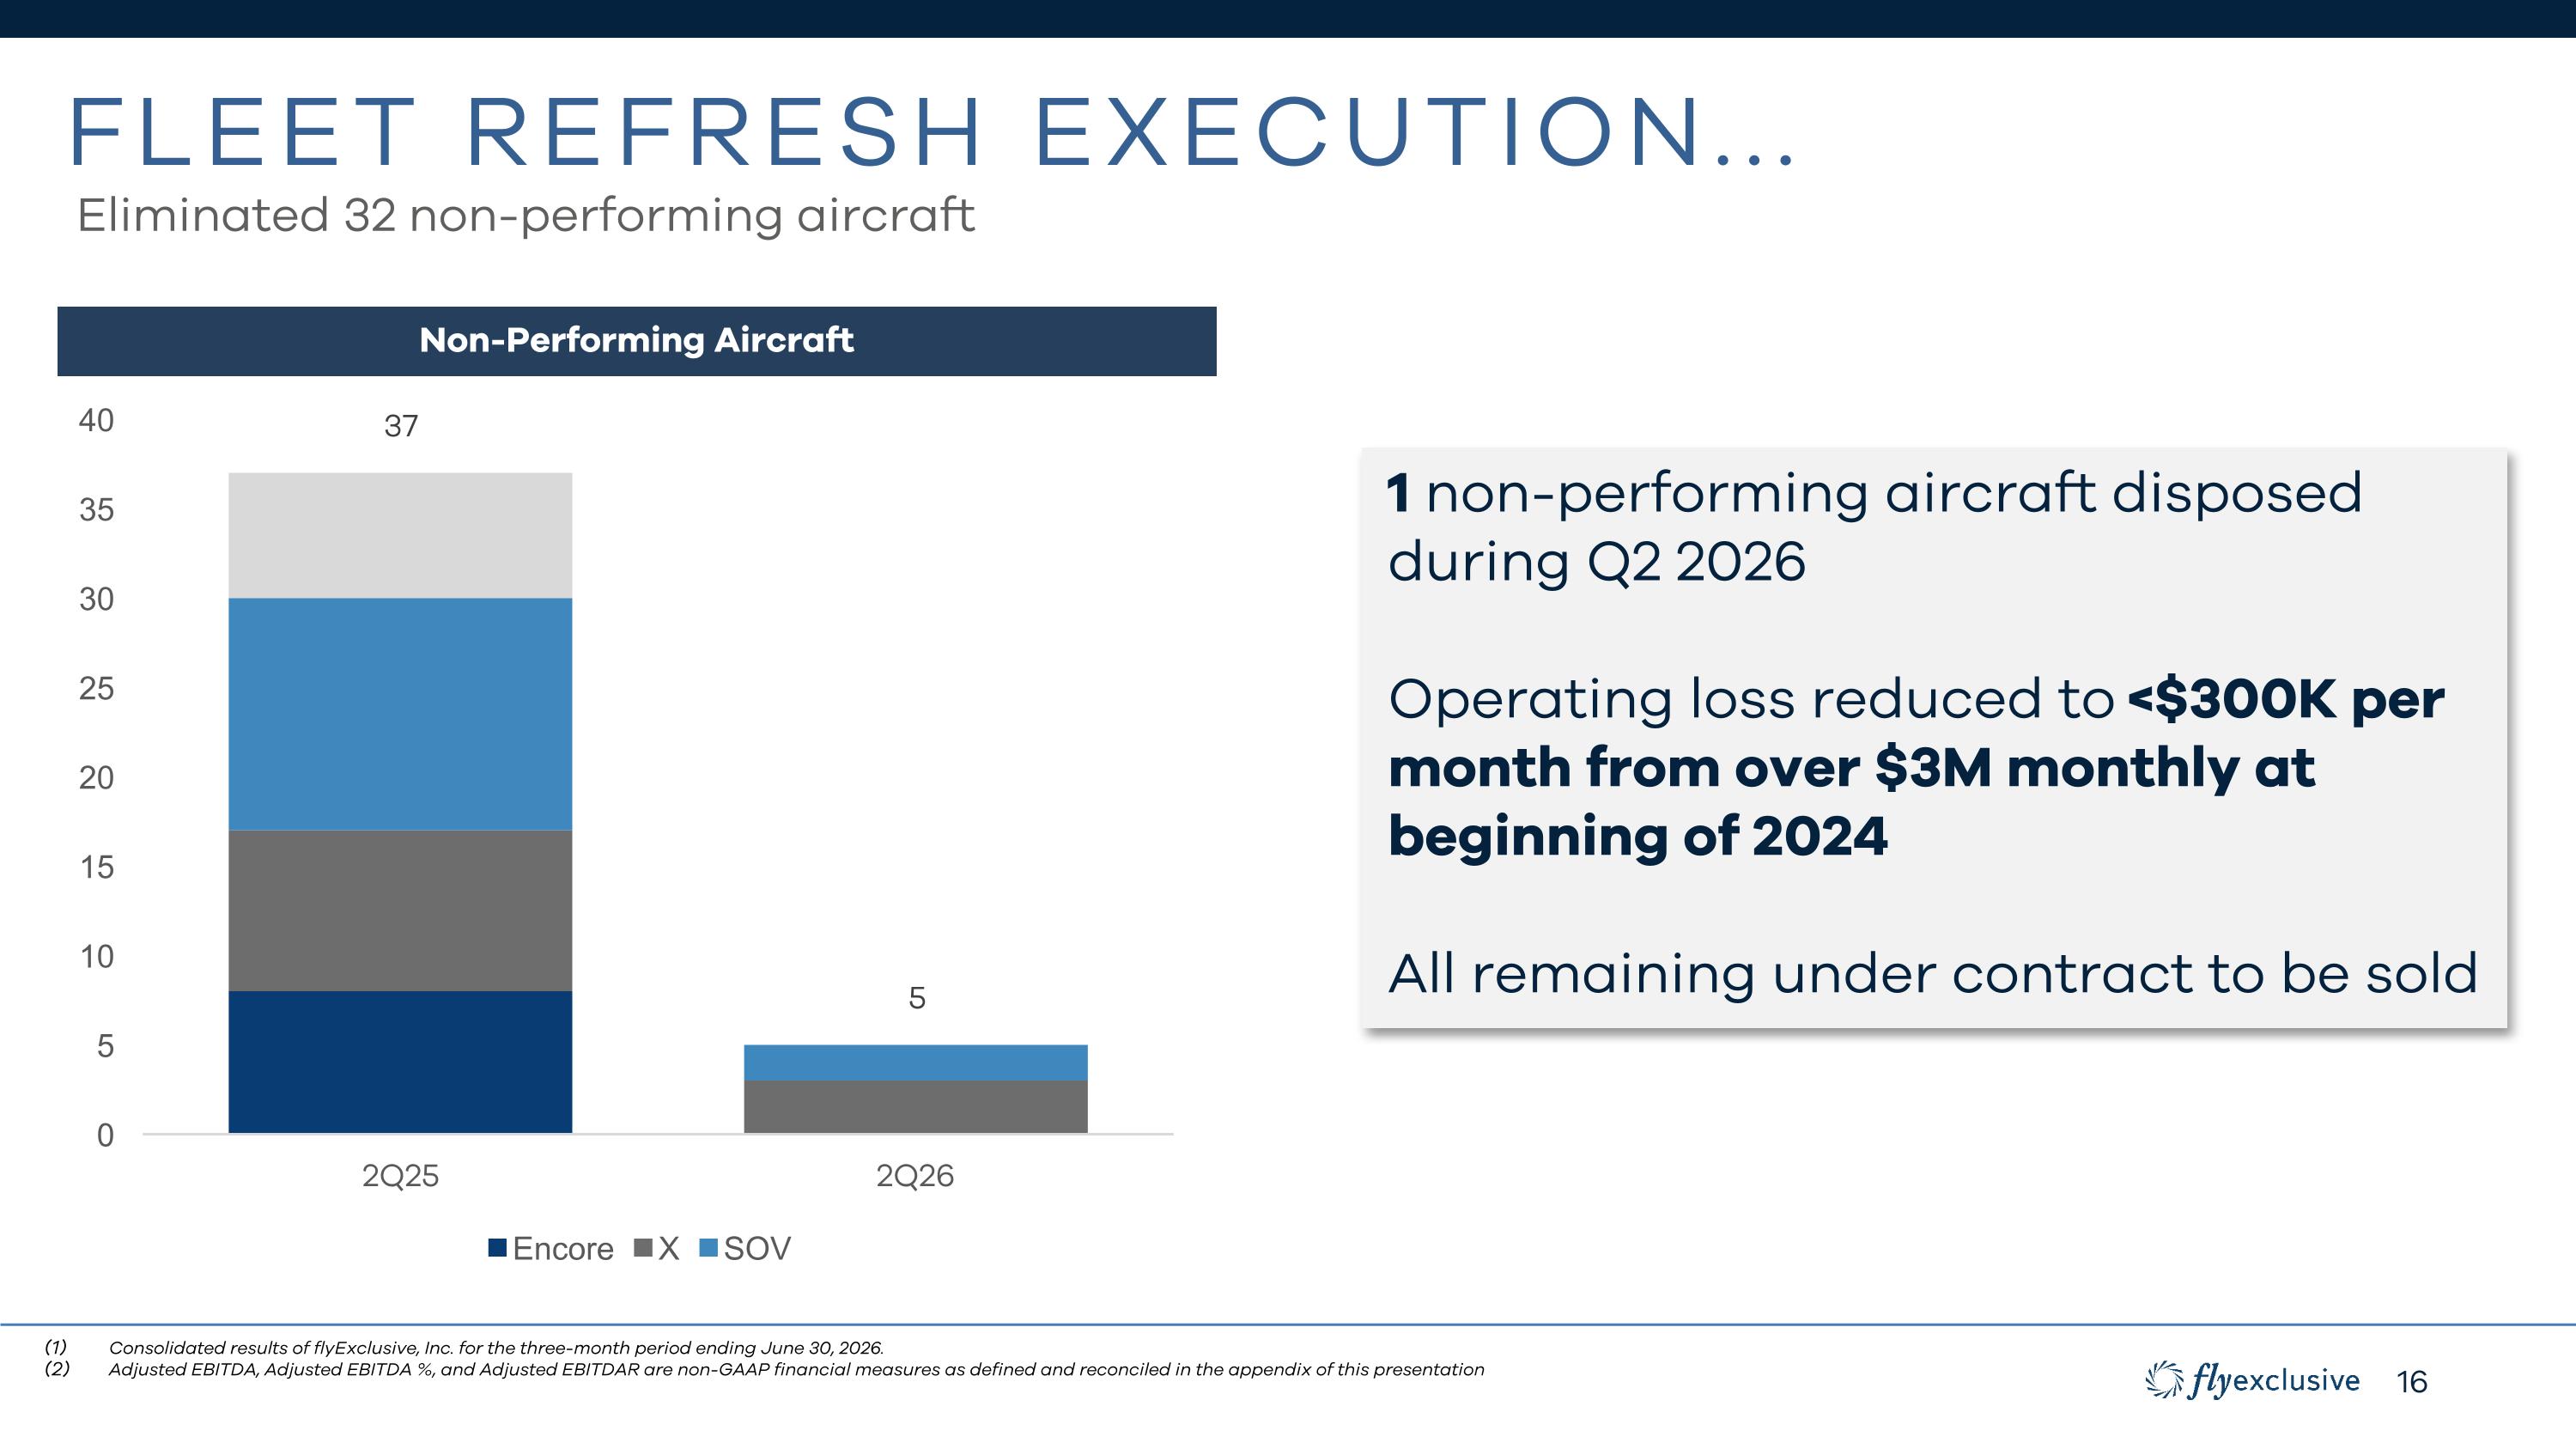
Fleet refresh execution... Eliminated 32 non-performing aircraft Non-Performing Aircraft 1 non-performing aircraft disposed during Q2 2026 Operating loss reduced to <$300K per month from over $3M monthly at beginning of 2024 All remaining under contract to be sold Consolidated results of flyExclusive, Inc. for the three-month period ending June 30, 2026. Adjusted EBITDA, Adjusted EBITDA %, and Adjusted EBITDAR are non-GAAP financial measures as defined and reconciled in the appendix of this presentation
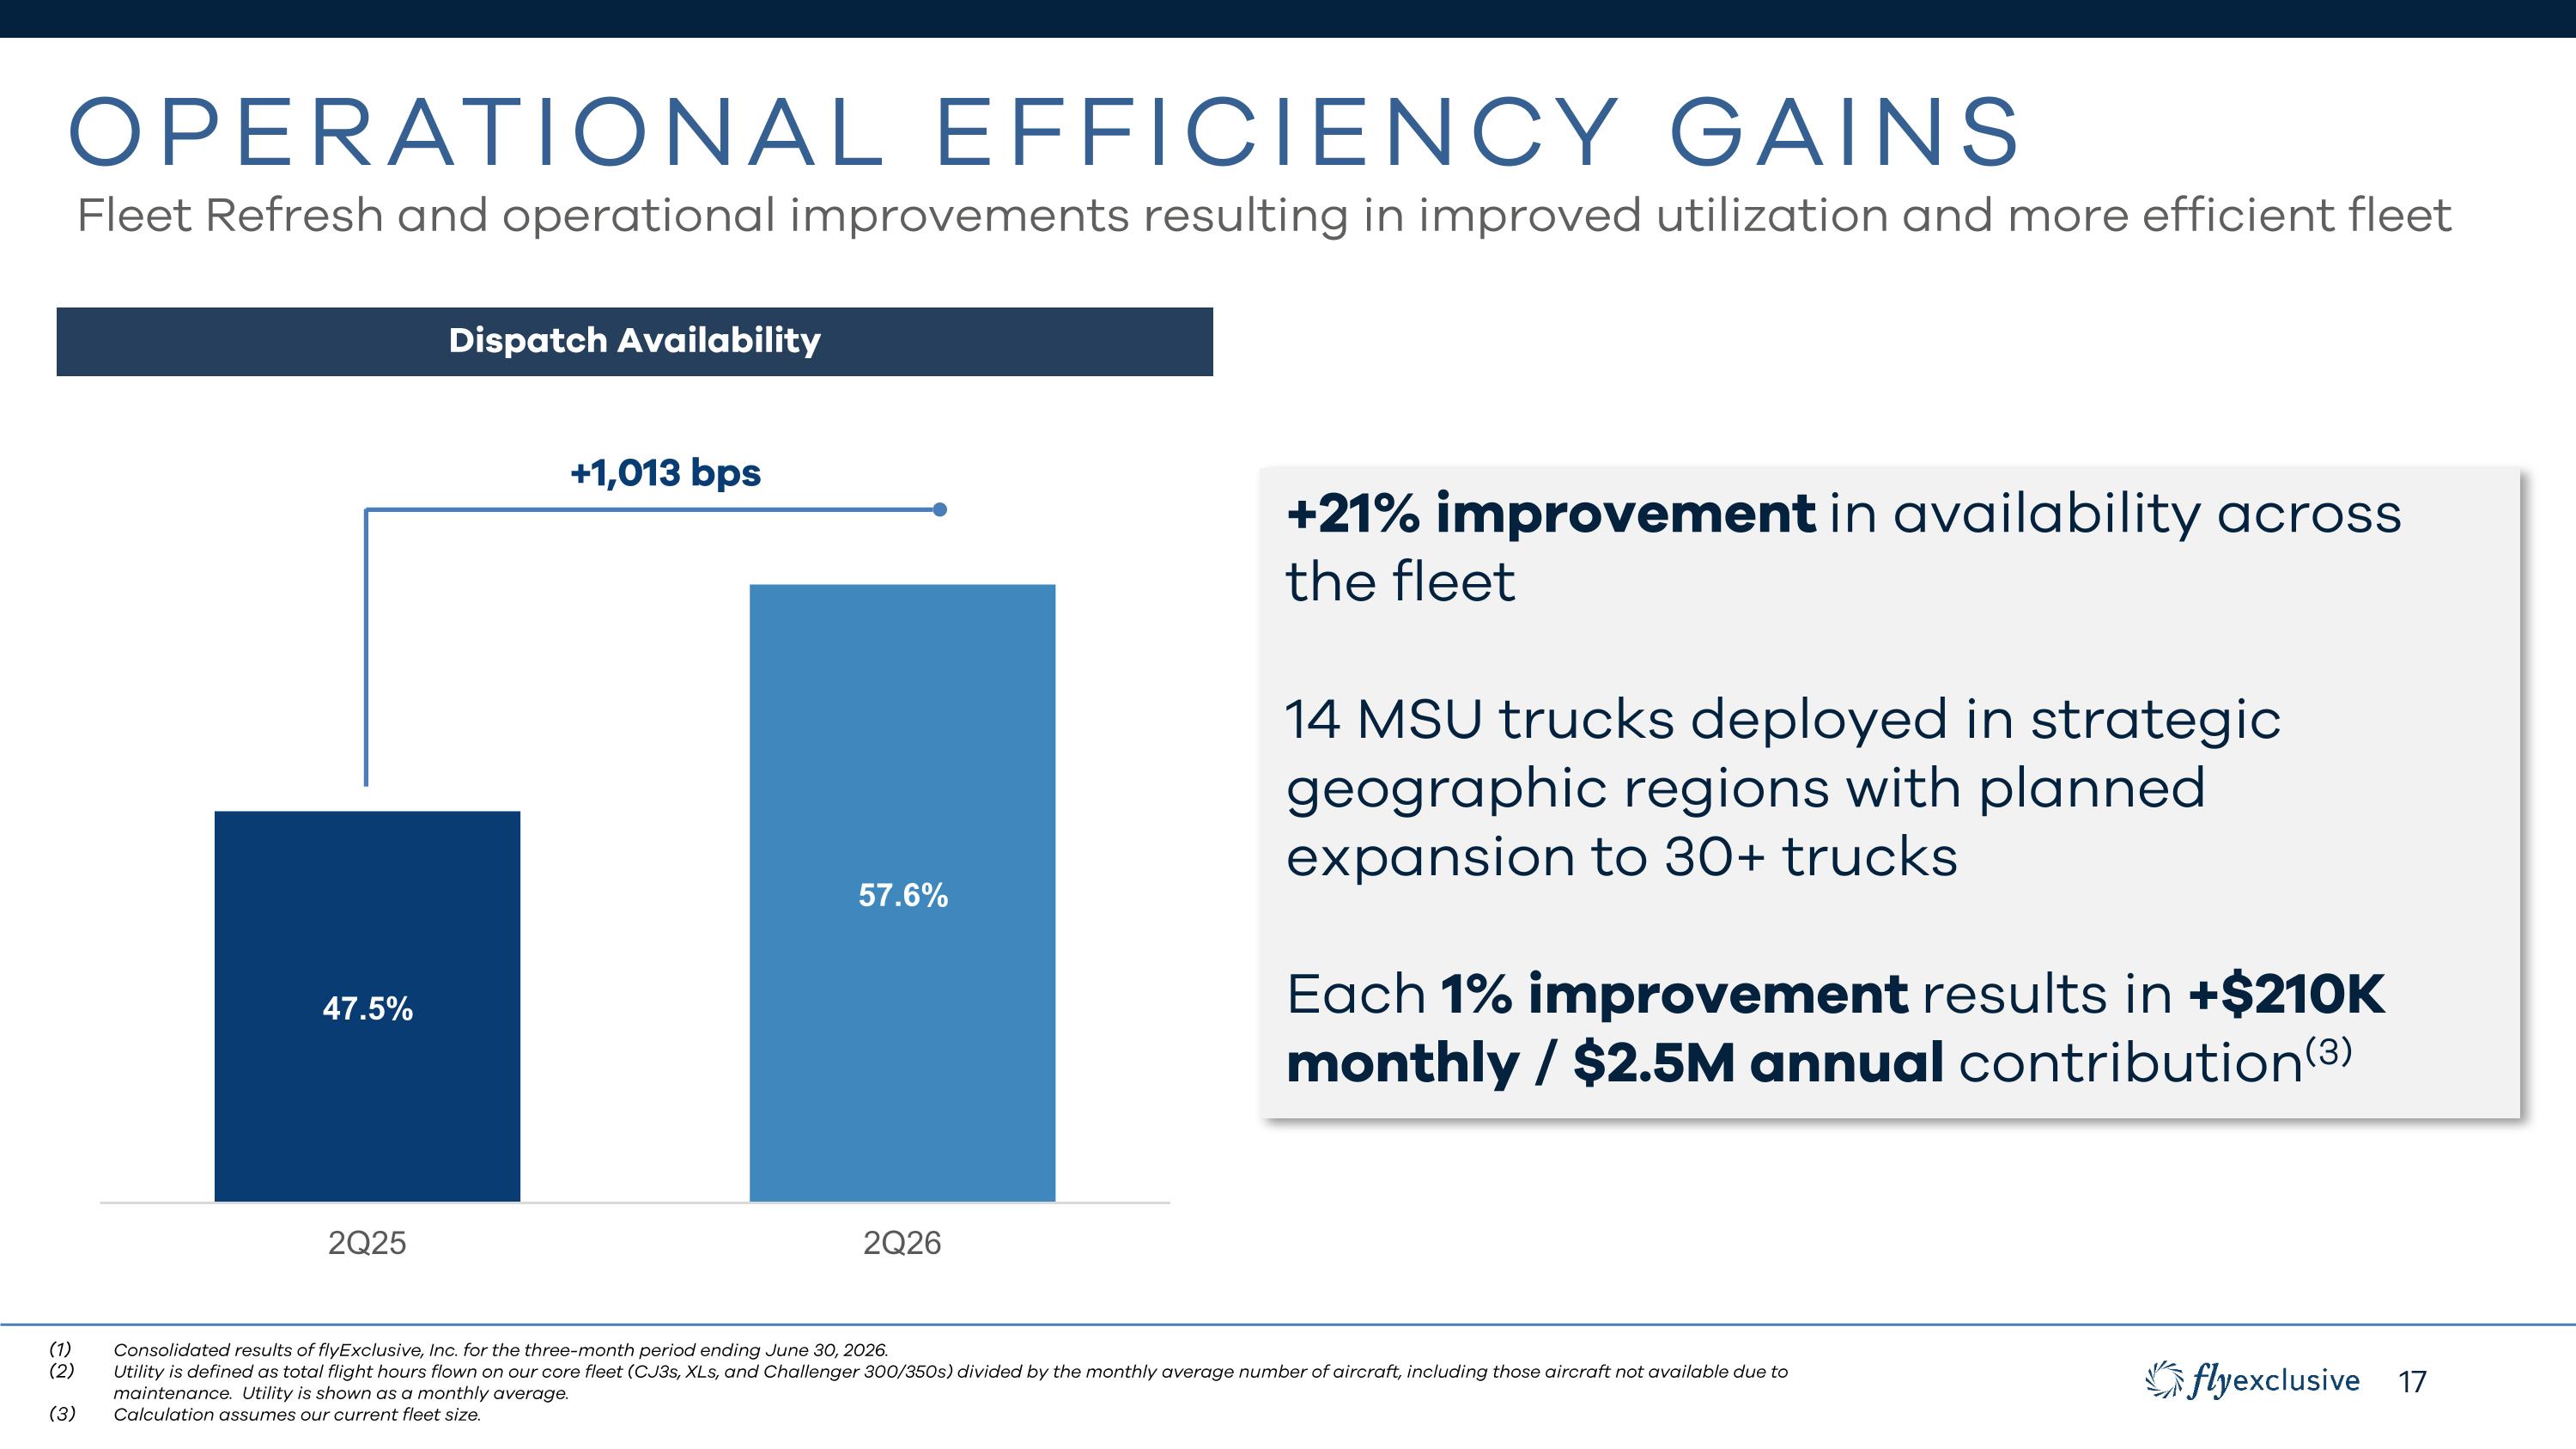
OPERATIONAL EFFICIENCY GAINS Fleet Refresh and operational improvements resulting in improved utilization and more efficient fleet Dispatch Availability +21% improvement in availability across the fleet 14 MSU trucks deployed in strategic geographic regions with planned expansion to 30+ trucks Each 1% improvement results in +$210K monthly / $2.5M annual contribution(3) Consolidated results of flyExclusive, Inc. for the three-month period ending June 30, 2026. Utility is defined as total flight hours flown on our core fleet (CJ3s, XLs, and Challenger 300/350s) divided by the monthly average number of aircraft, including those aircraft not available due to maintenance. Utility is shown as a monthly average. Calculation assumes our current fleet size. +1,013 bps
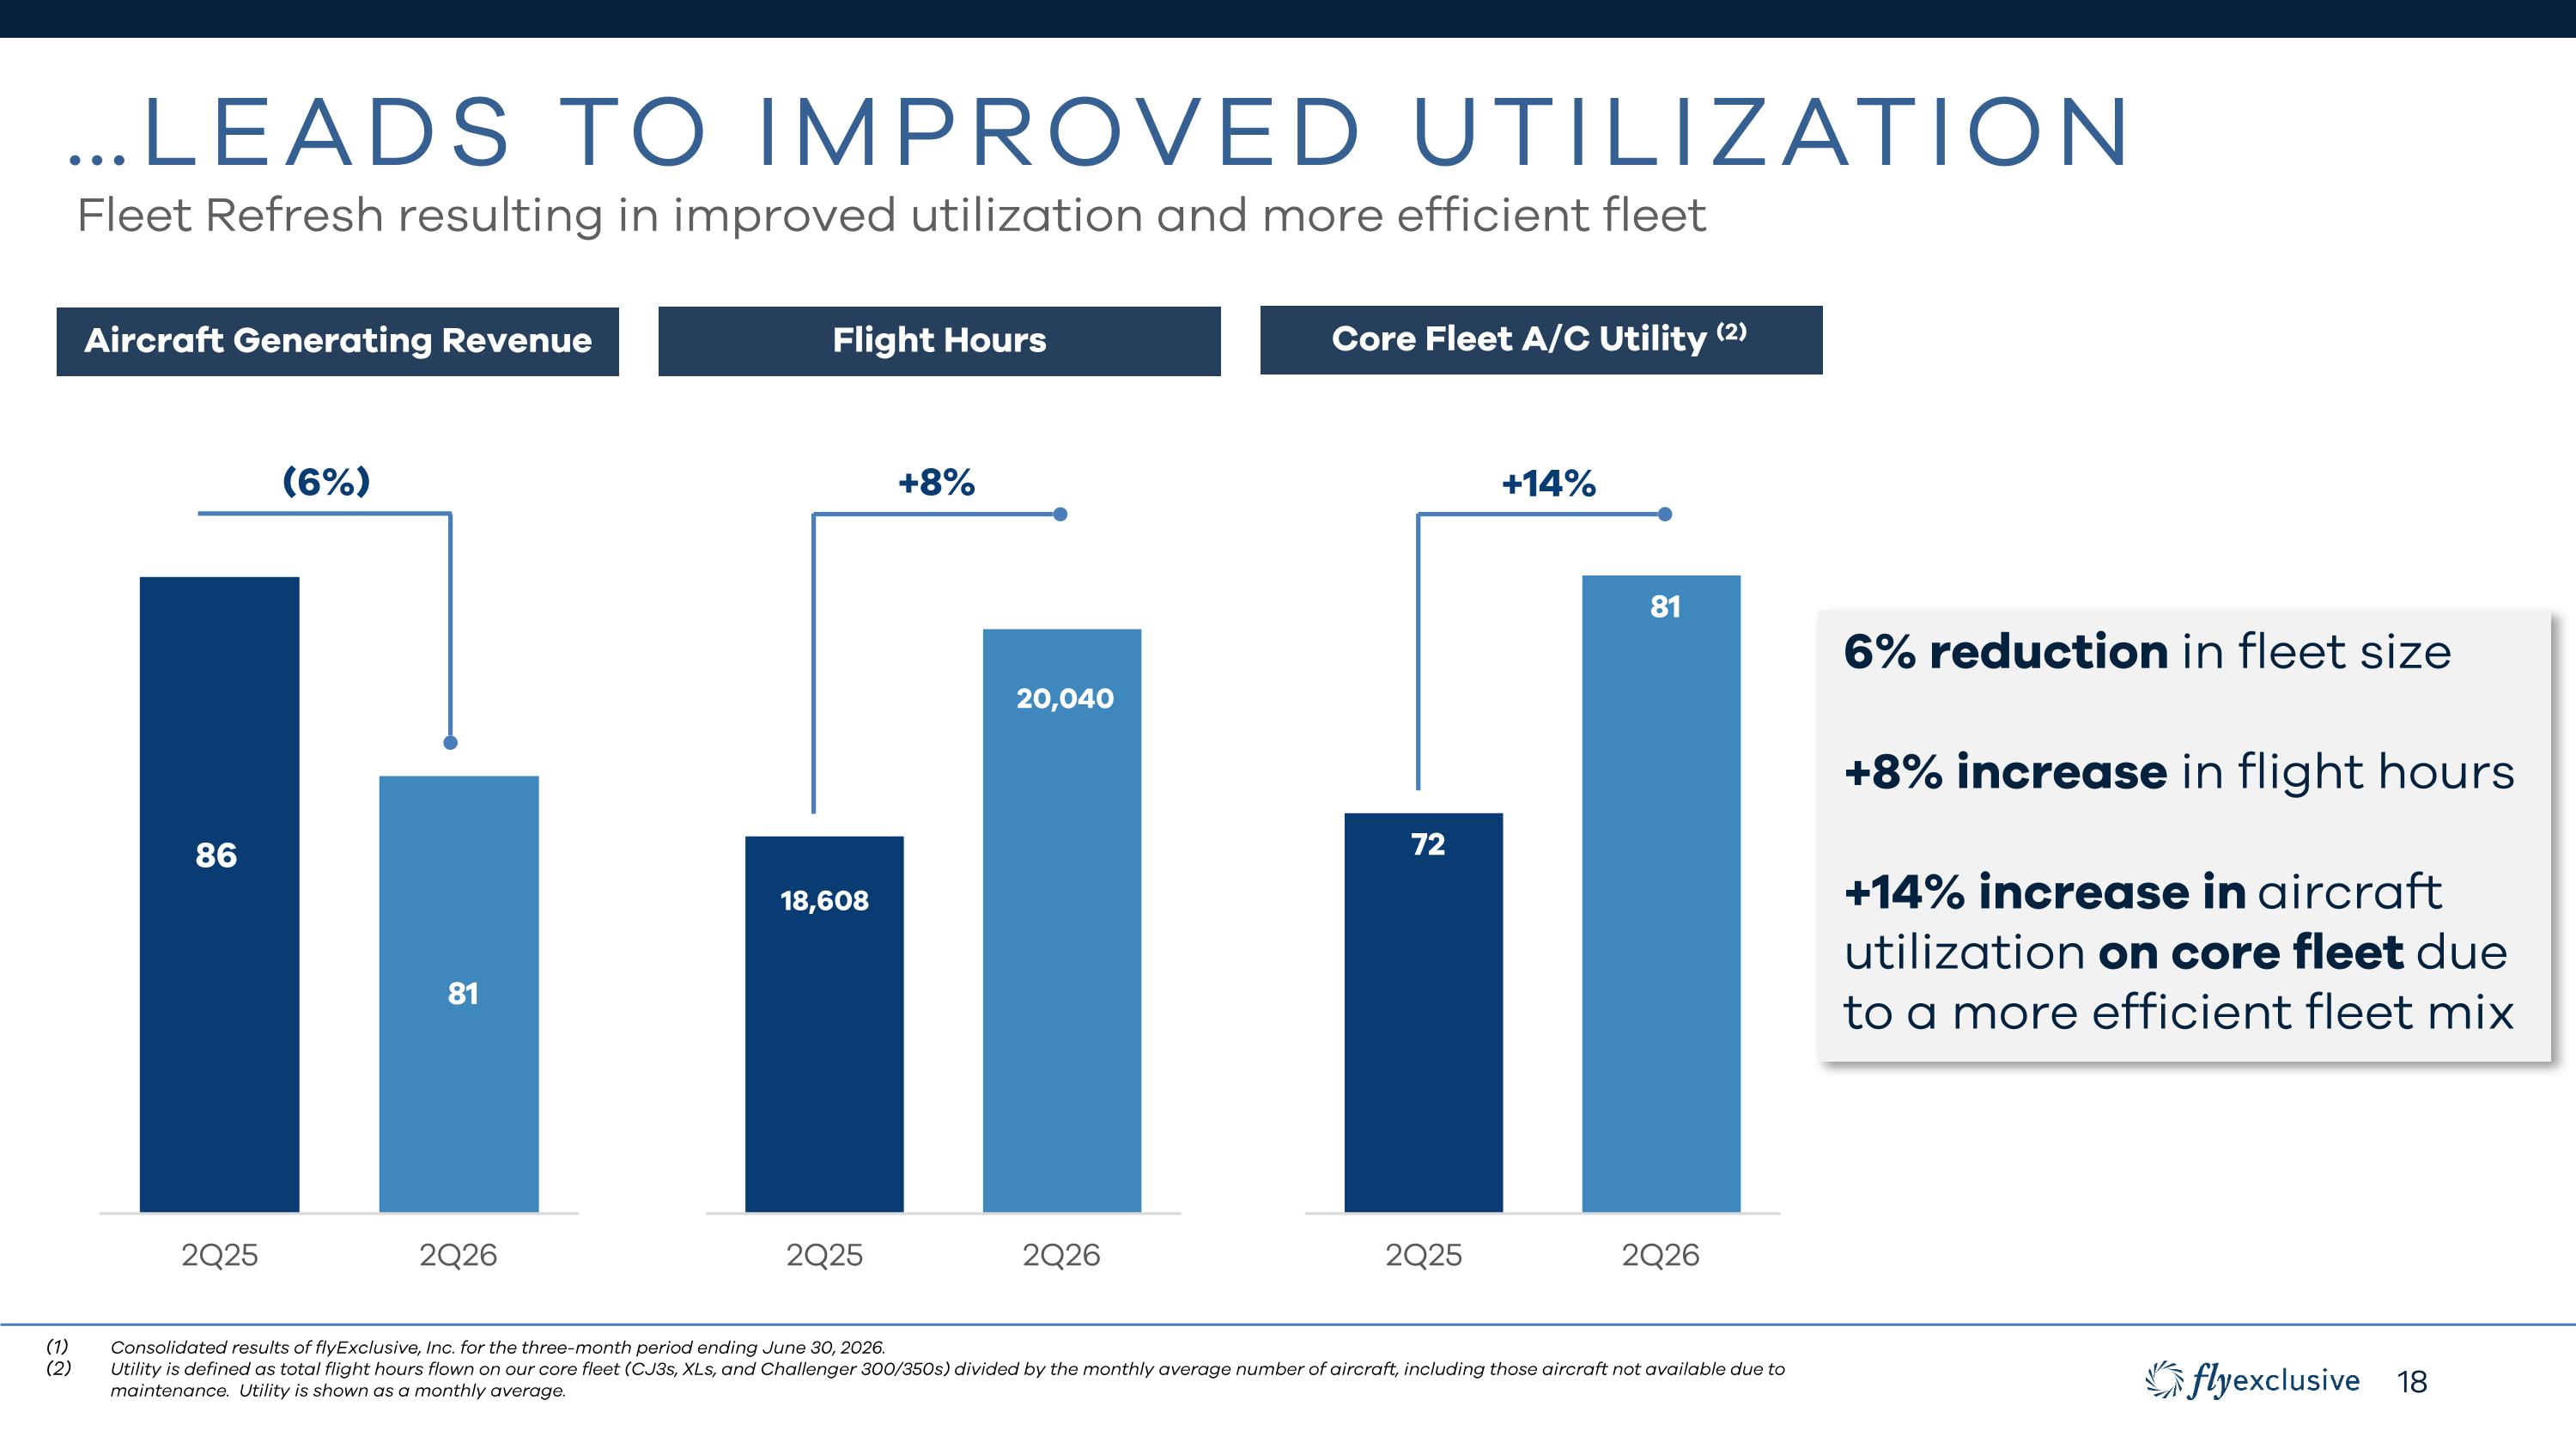
…Leads to Improved utilization Fleet Refresh resulting in improved utilization and more efficient fleet Aircraft Generating Revenue Flight Hours 6% reduction in fleet size +8% increase in flight hours +14% increase in aircraft utilization on core fleet due to a more efficient fleet mix Consolidated results of flyExclusive, Inc. for the three-month period ending June 30, 2026. Utility is defined as total flight hours flown on our core fleet (CJ3s, XLs, and Challenger 300/350s) divided by the monthly average number of aircraft, including those aircraft not available due to maintenance. Utility is shown as a monthly average. (6%) +8% Core Fleet A/C Utility +14% Core Fleet A/C Utility (2)
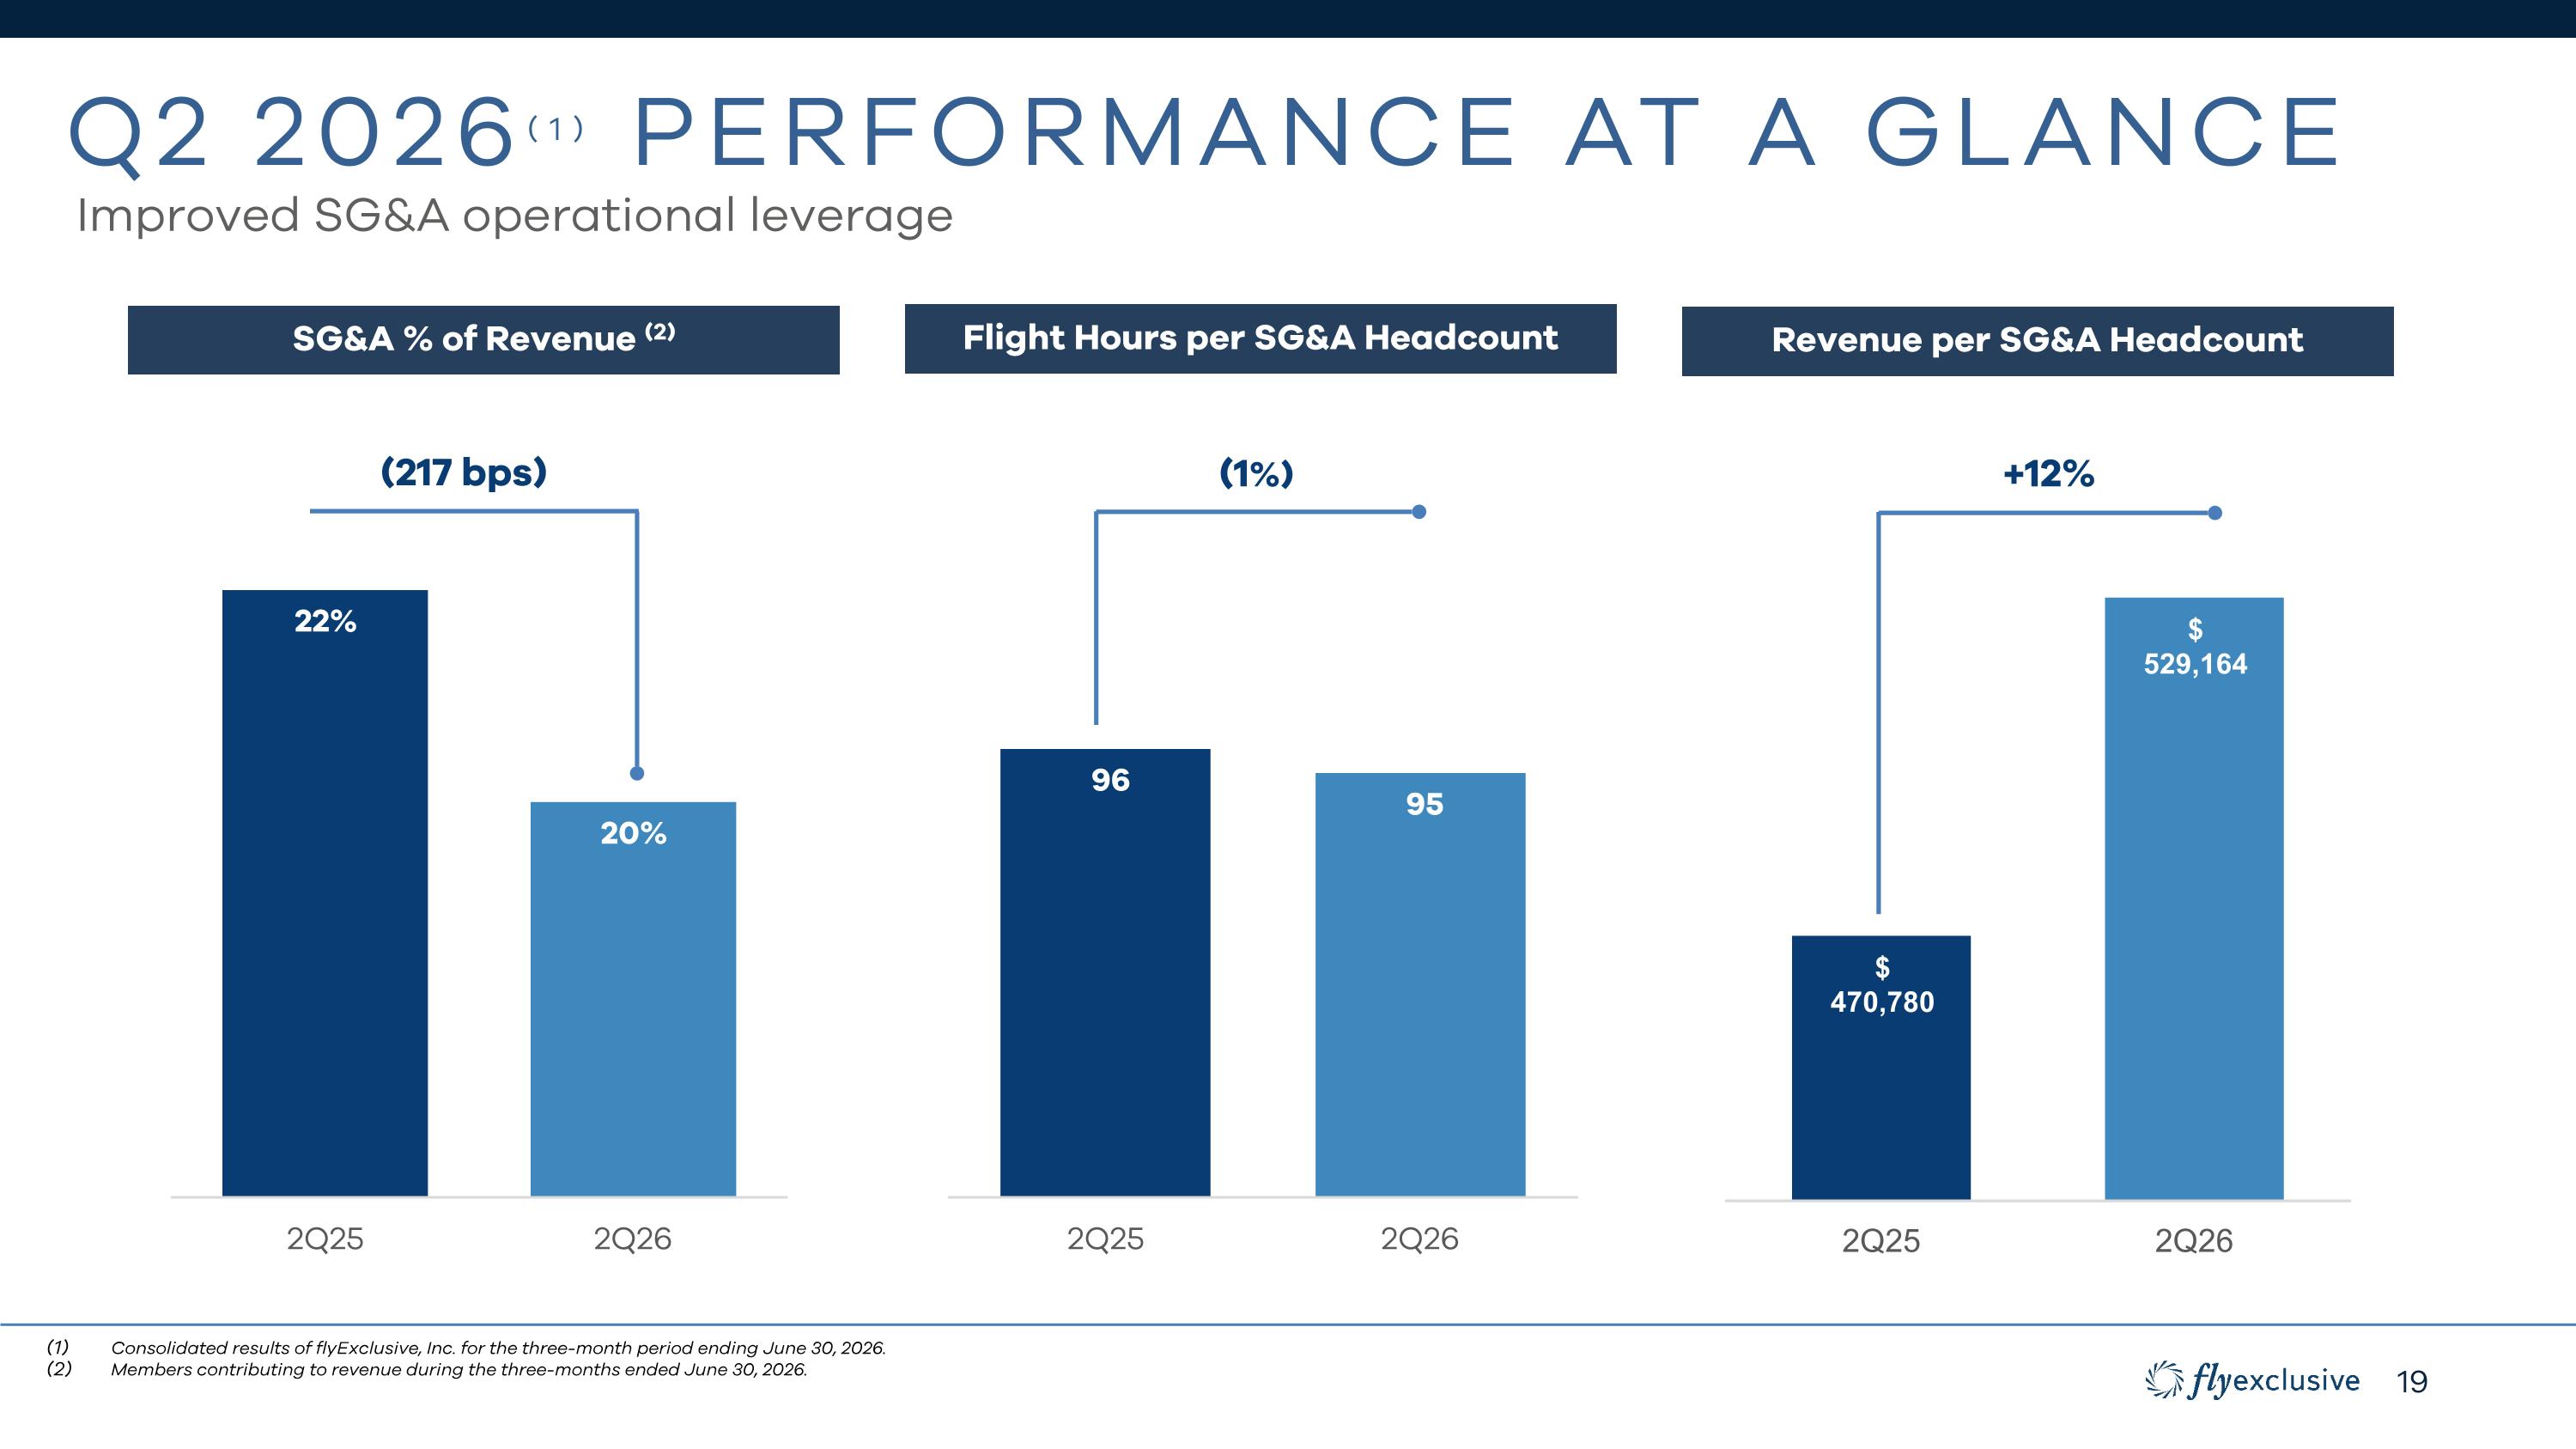
Q2 2026(1) Performance at a glance Improved SG&A operational leverage SG&A % of Revenue (2) Flight Hours per SG&A Headcount Revenue per SG&A Headcount Consolidated results of flyExclusive, Inc. for the three-month period ending June 30, 2026. Members contributing to revenue during the three-months ended June 30, 2026. (217 bps) (1%) +12%
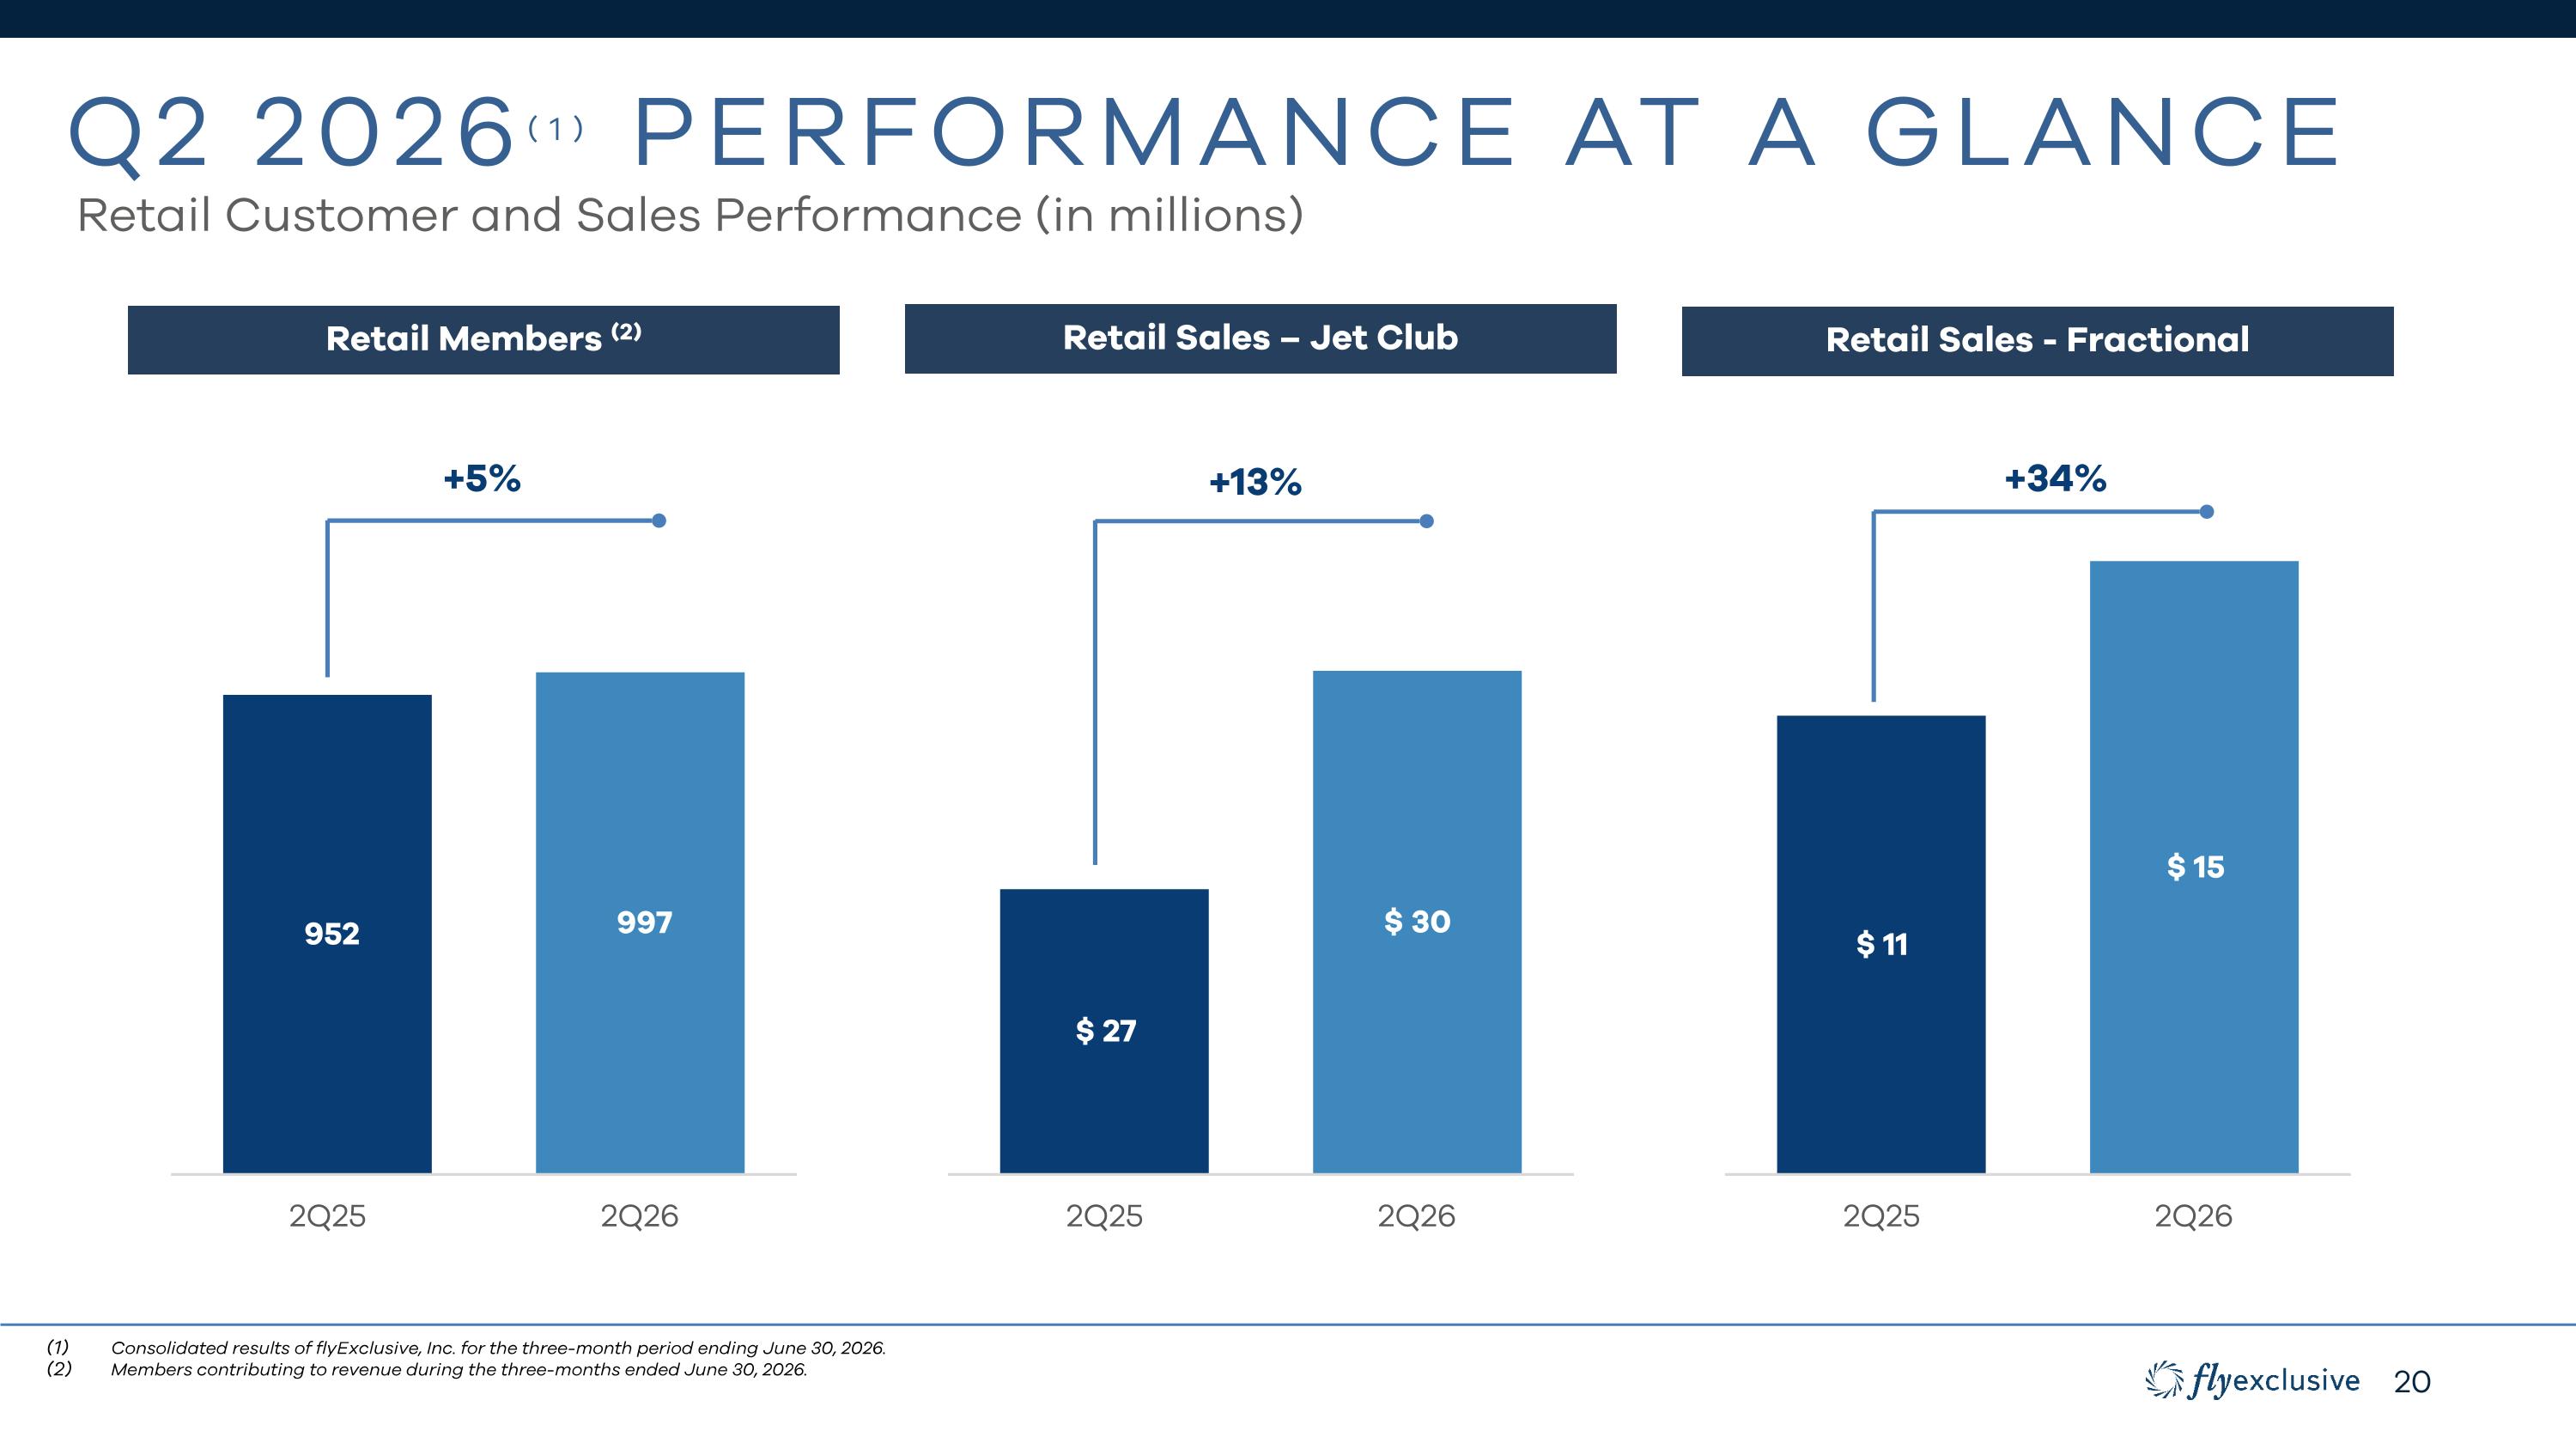
Q2 2026(1) Performance at a glance Retail Customer and Sales Performance (in millions) Retail Members (2) Retail Sales – Jet Club Retail Sales - Fractional +5% +13% +34% Consolidated results of flyExclusive, Inc. for the three-month period ending June 30, 2026. Members contributing to revenue during the three-months ended June 30, 2026.
I. EXECUTIVE SUMMARY 1H 2026 PERFORMANCE
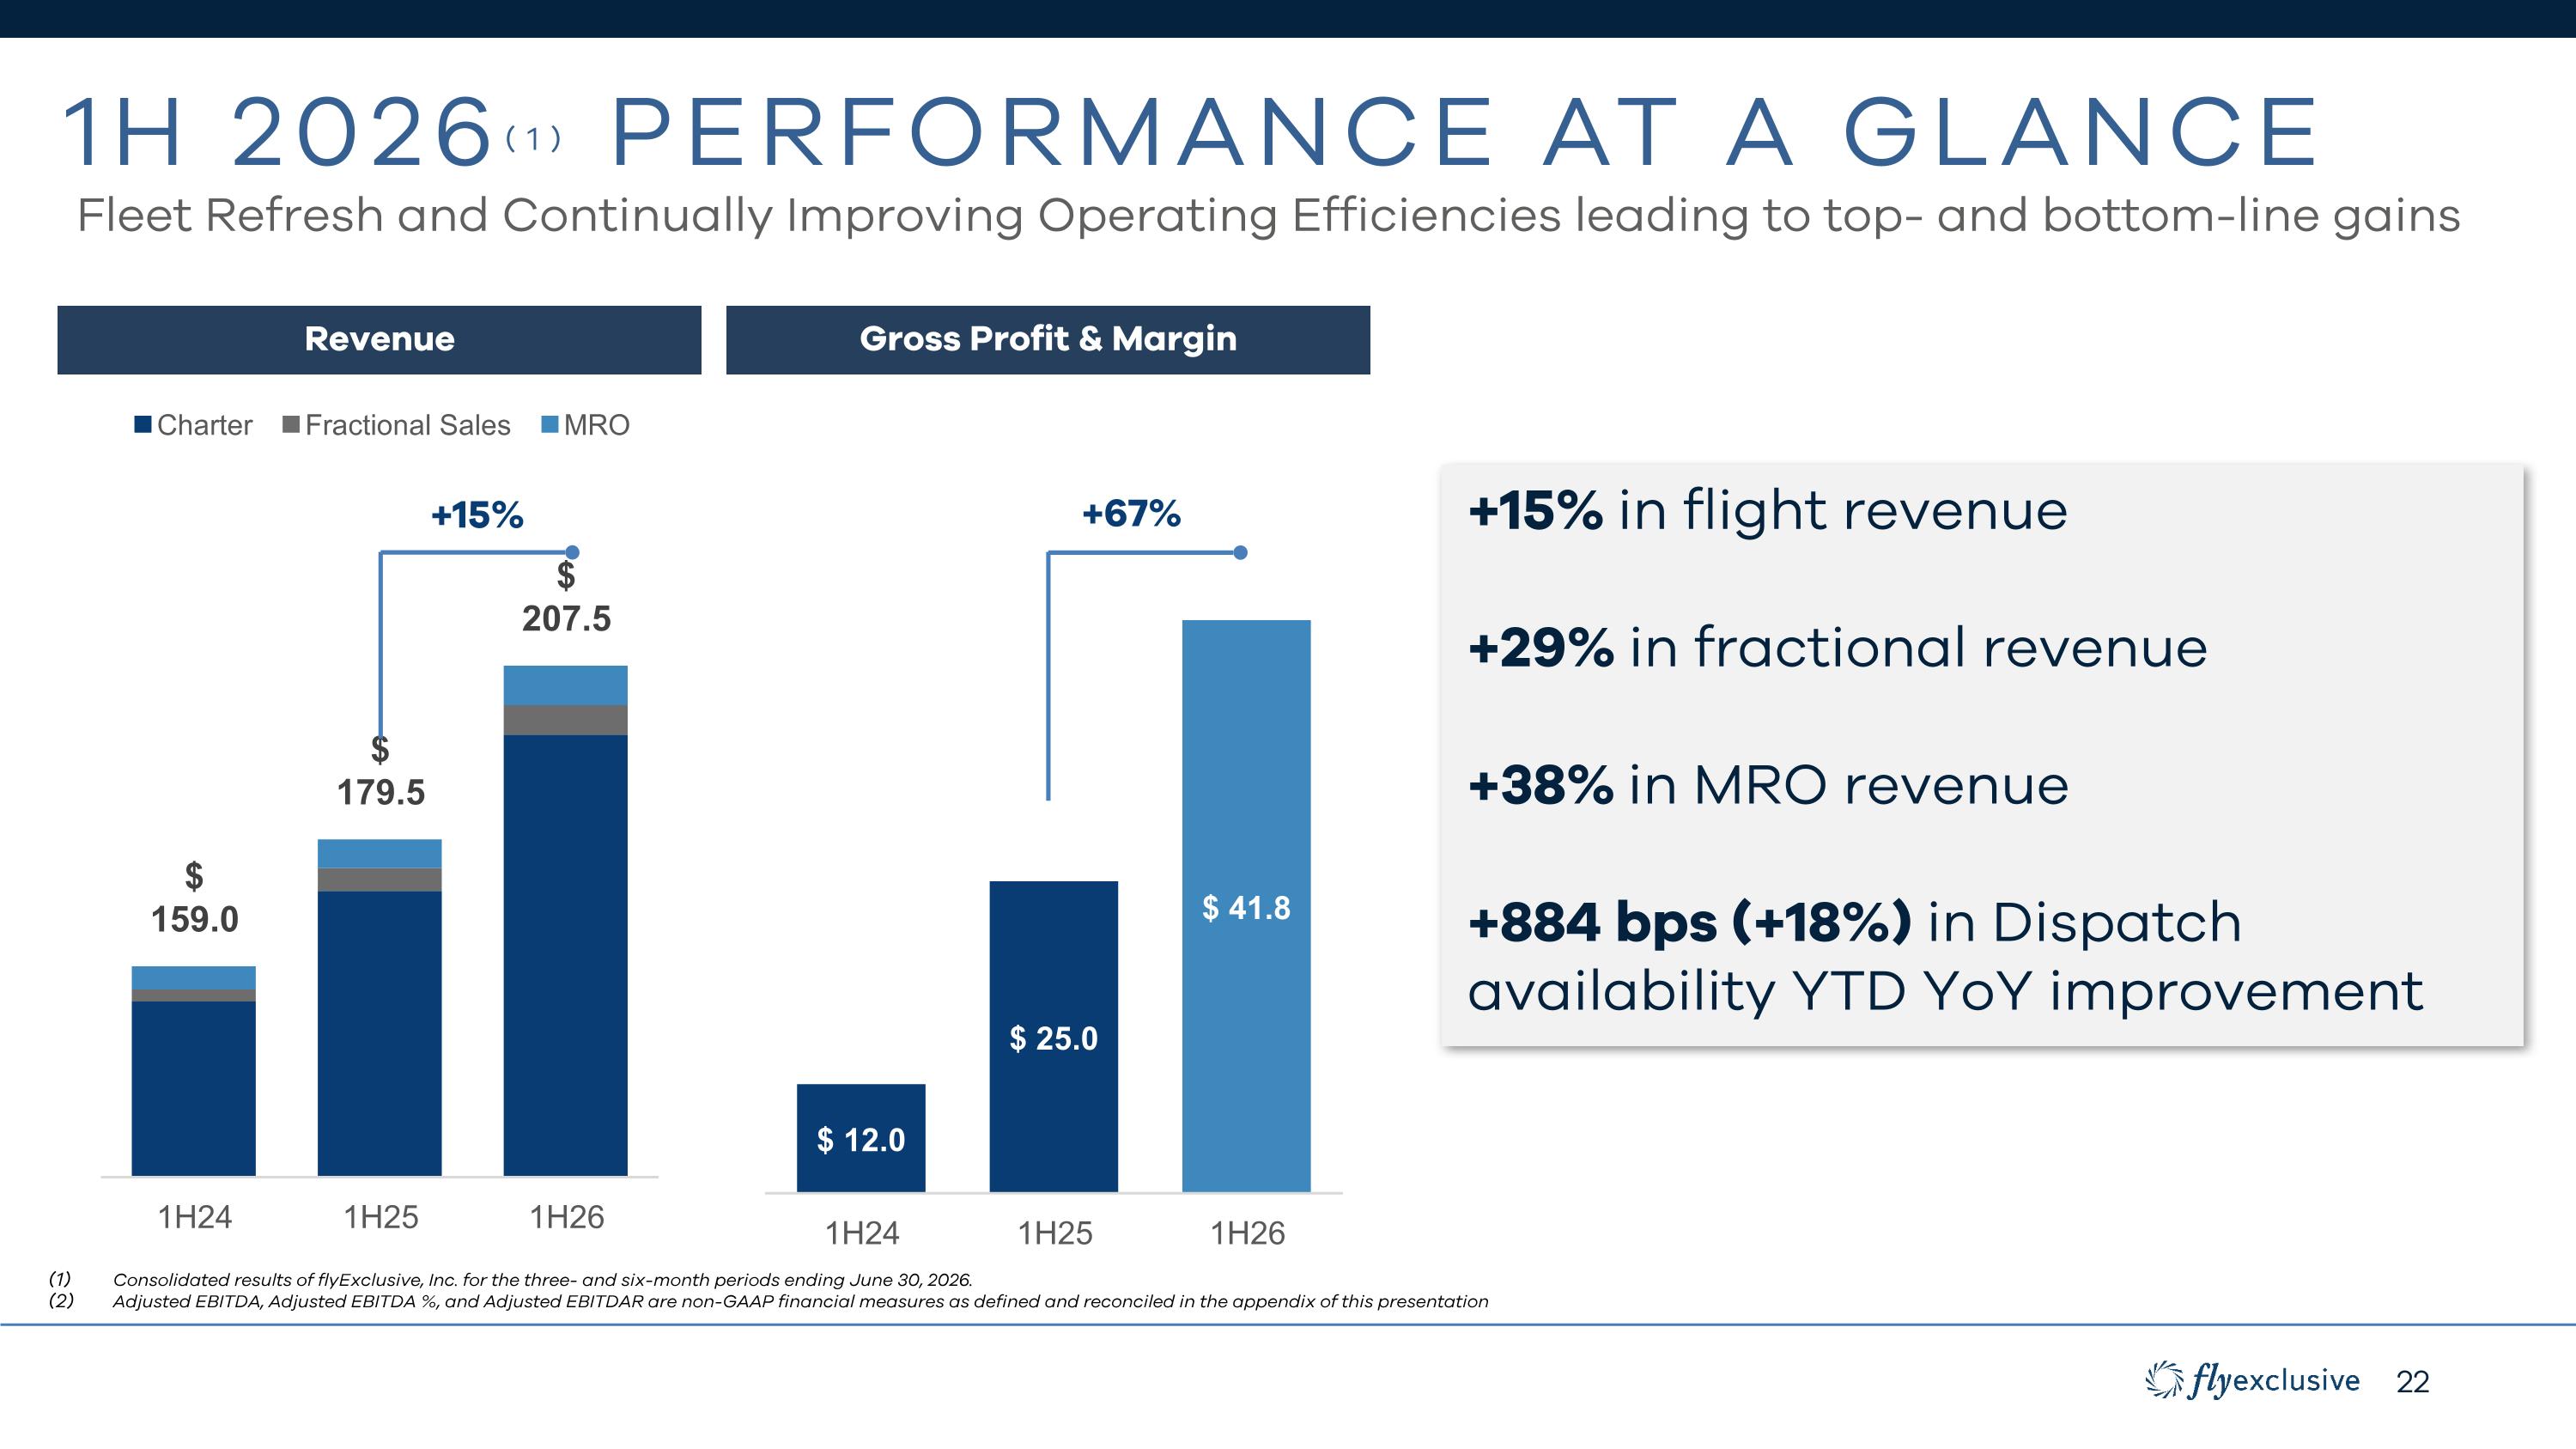
1H 2026(1) Performance at a glance Revenue Consolidated results of flyExclusive, Inc. for the three- and six-month periods ending June 30, 2026. Adjusted EBITDA, Adjusted EBITDA %, and Adjusted EBITDAR are non-GAAP financial measures as defined and reconciled in the appendix of this presentation +15% Gross Profit & Margin +67% +15% in flight revenue +29% in fractional revenue +38% in MRO revenue +884 bps (+18%) in Dispatch availability YTD YoY improvement Fleet Refresh and Continually Improving Operating Efficiencies leading to top- and bottom-line gains
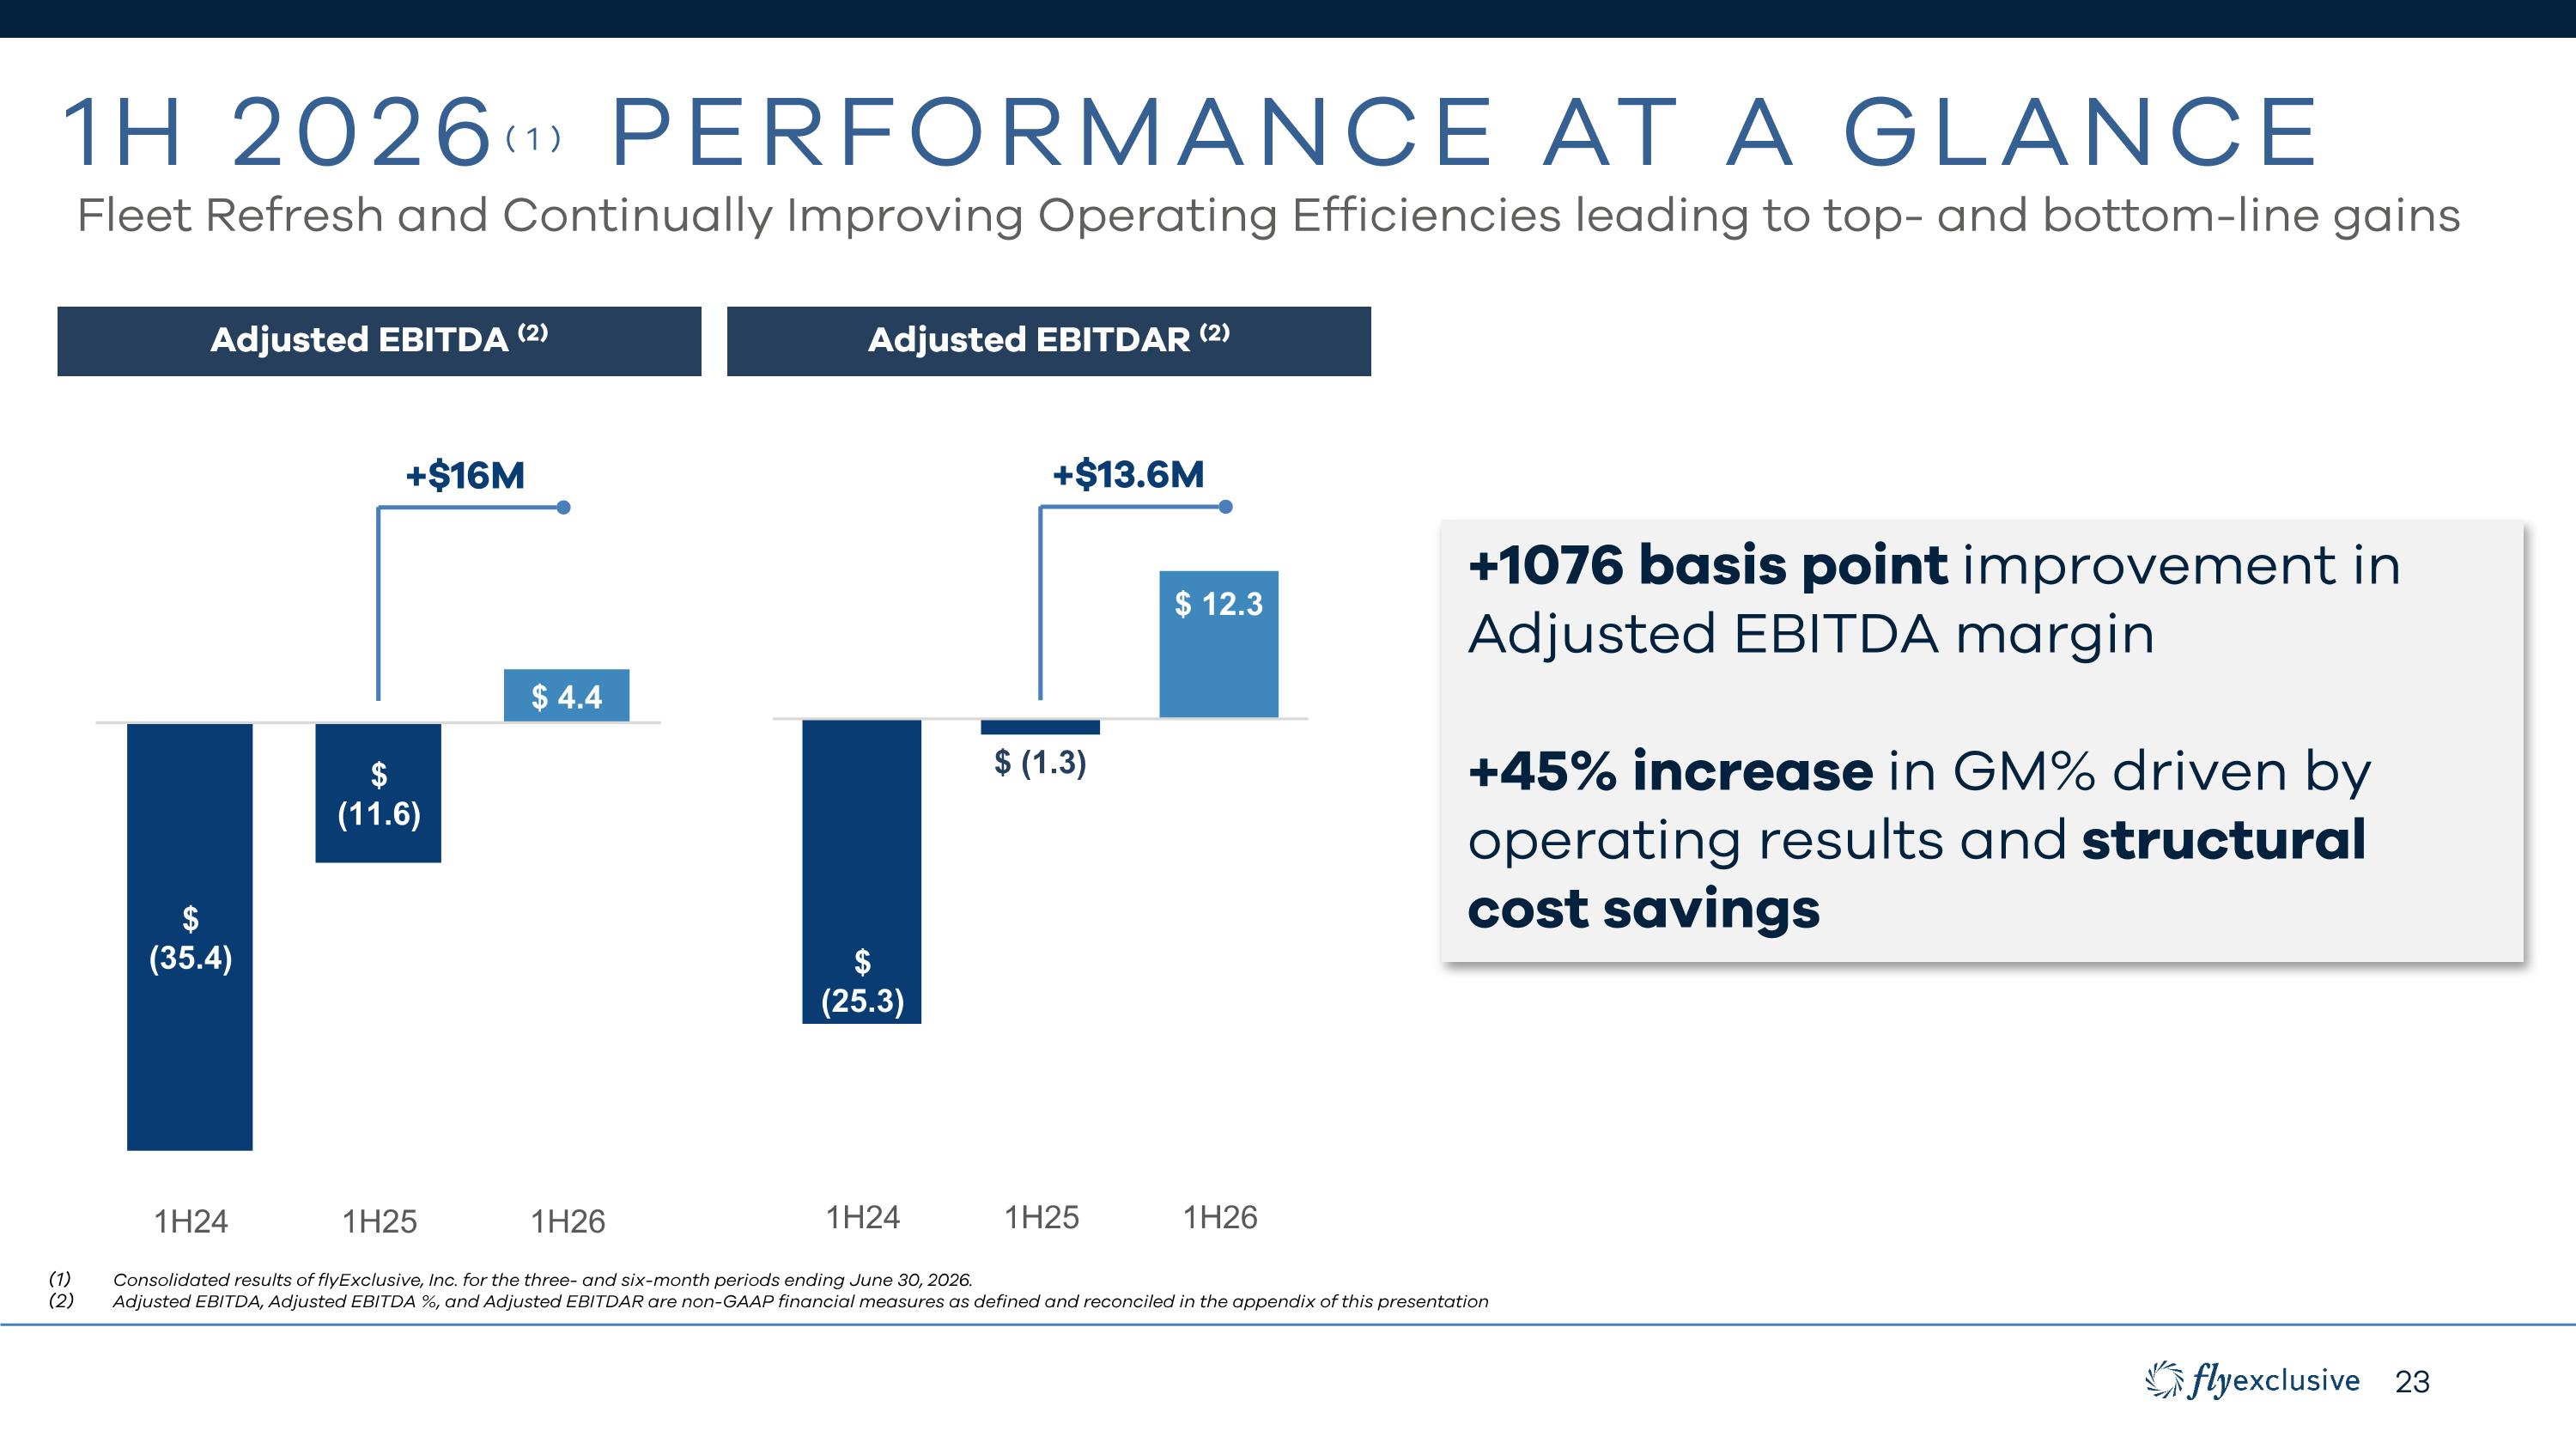
1H 2026(1) Performance at a glance Consolidated results of flyExclusive, Inc. for the three- and six-month periods ending June 30, 2026. Adjusted EBITDA, Adjusted EBITDA %, and Adjusted EBITDAR are non-GAAP financial measures as defined and reconciled in the appendix of this presentation Adjusted EBITDA (2) Adjusted EBITDAR (2) +1076 basis point improvement in Adjusted EBITDA margin +45% increase in GM% driven by operating results and structural cost savings +$16M +$13.6M Fleet Refresh and Continually Improving Operating Efficiencies leading to top- and bottom-line gains
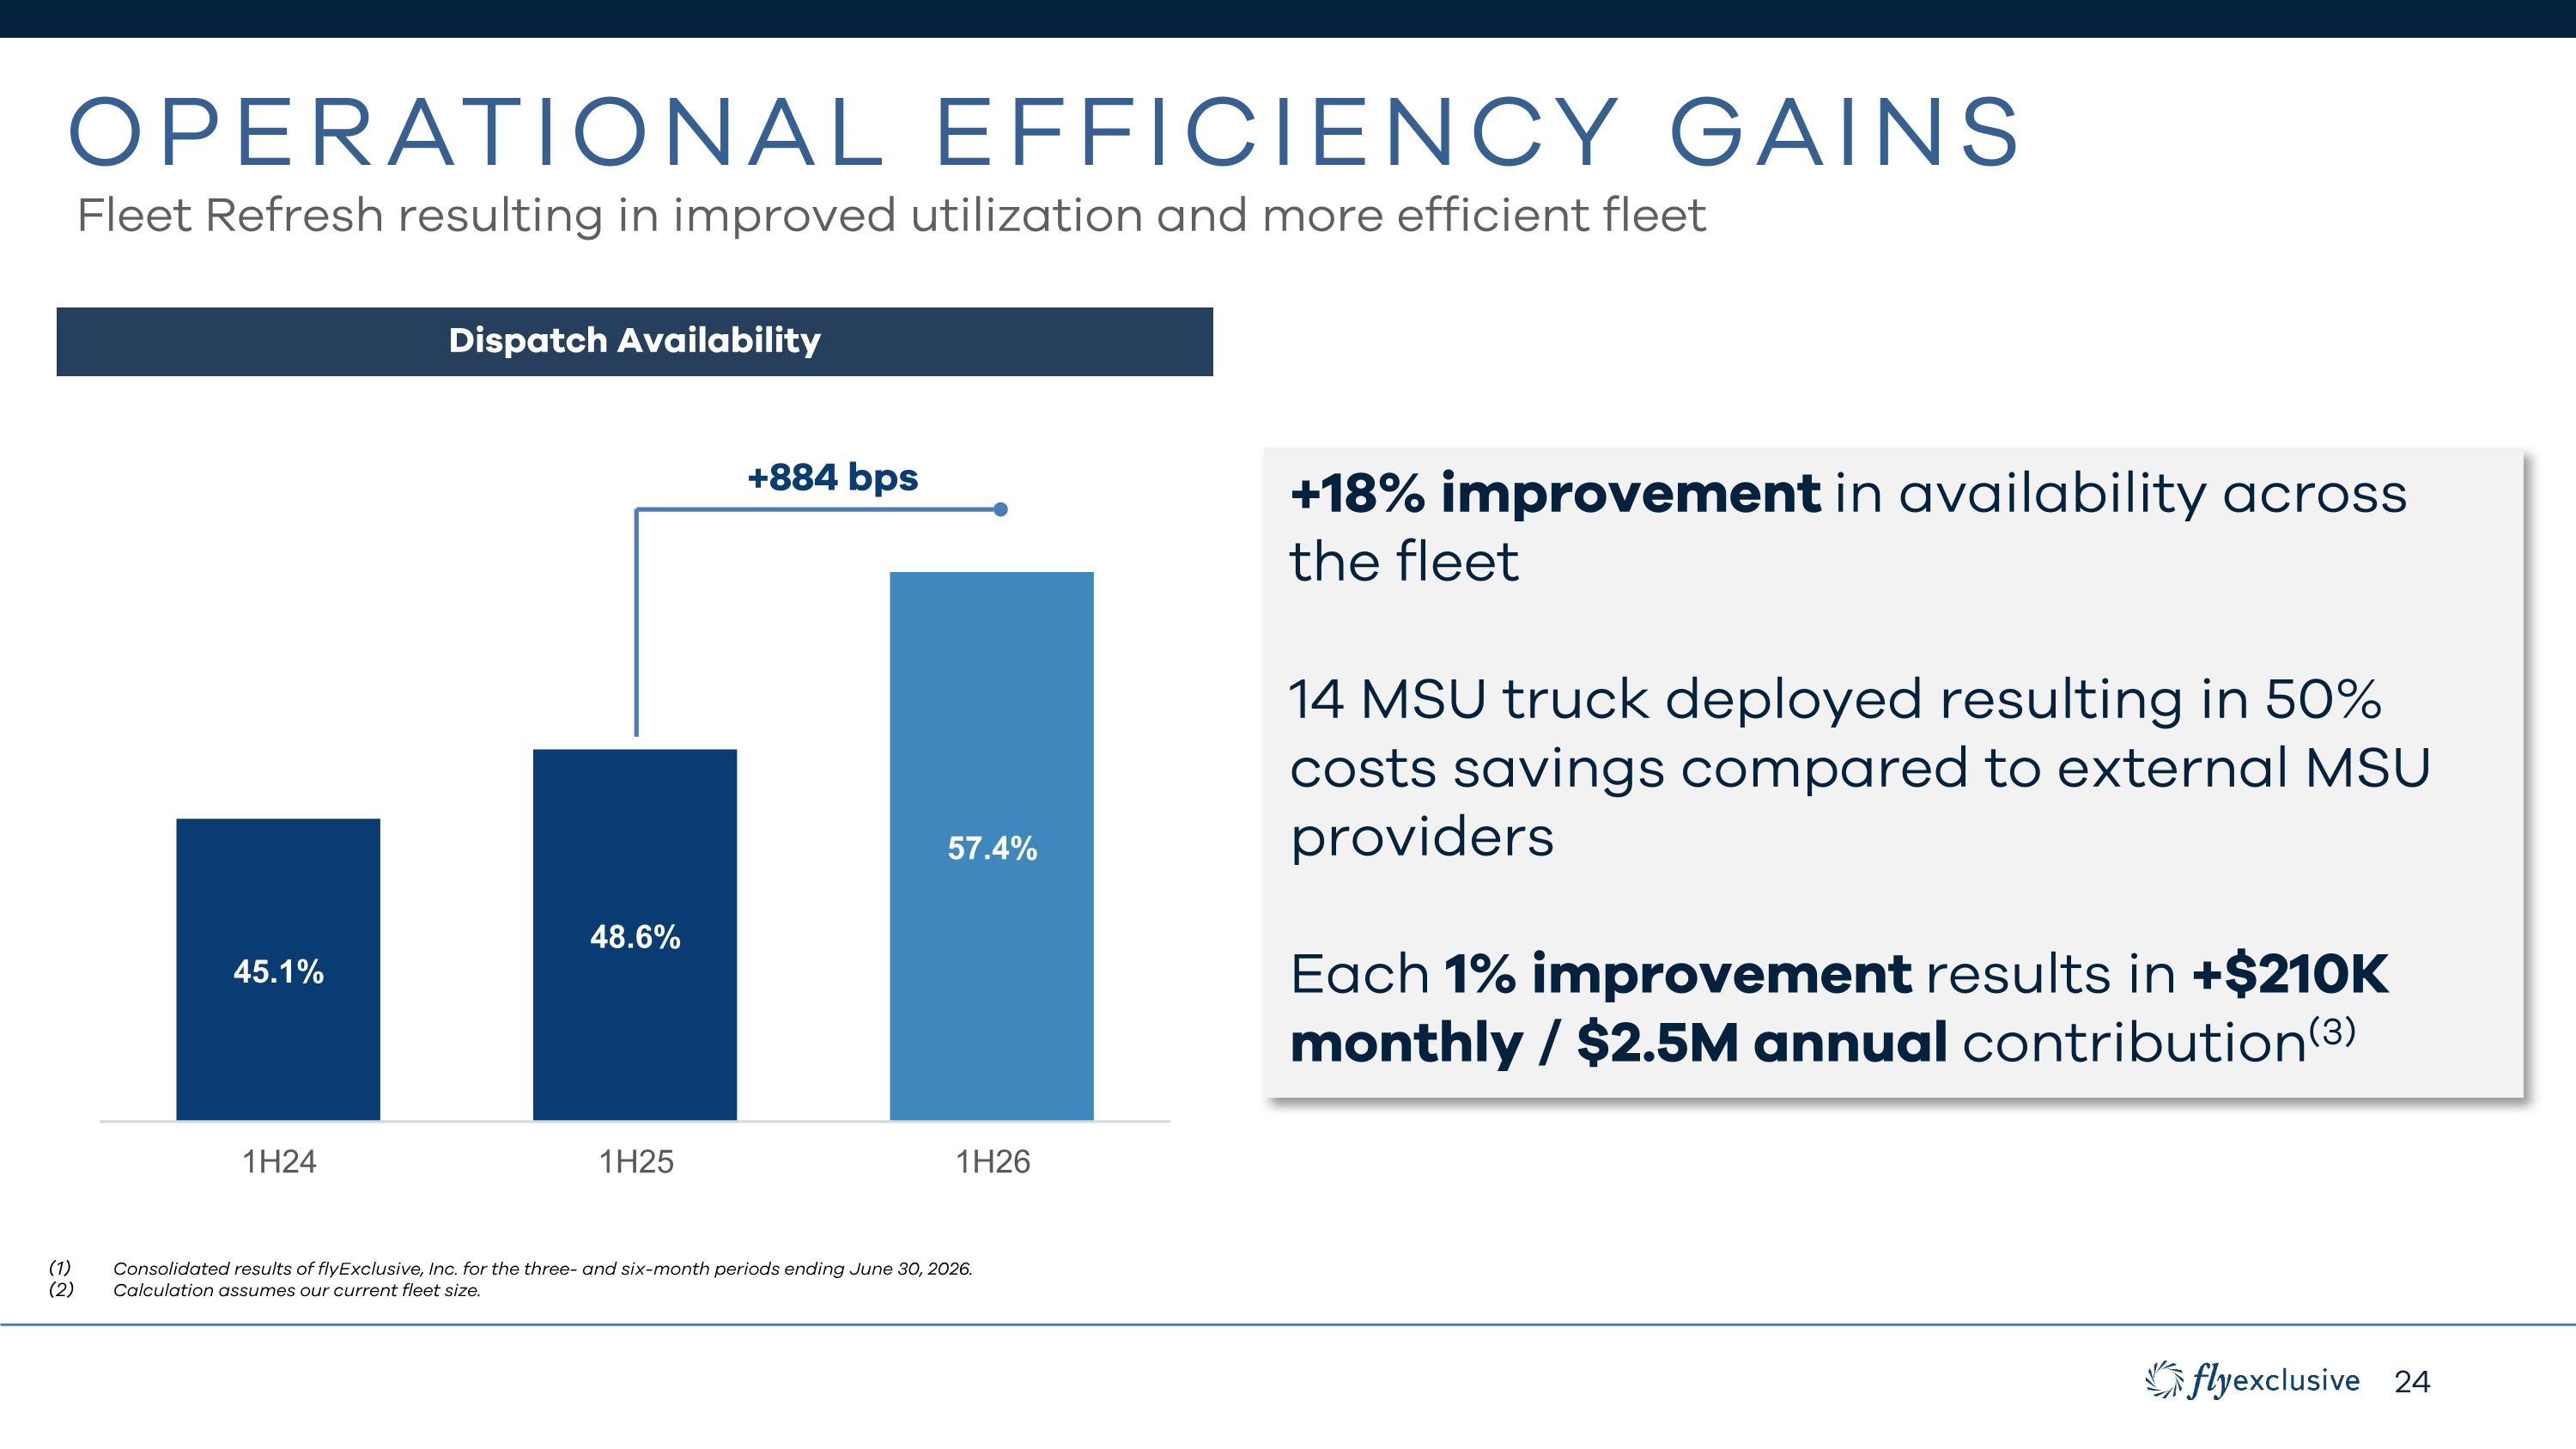
OPERATIONAL EFFICIENCY GAINS Fleet Refresh resulting in improved utilization and more efficient fleet Dispatch Availability +18% improvement in availability across the fleet 14 MSU truck deployed resulting in 50% costs savings compared to external MSU providers Each 1% improvement results in +$210K monthly / $2.5M annual contribution(3) Consolidated results of flyExclusive, Inc. for the three- and six-month periods ending June 30, 2026. Calculation assumes our current fleet size. +884 bps
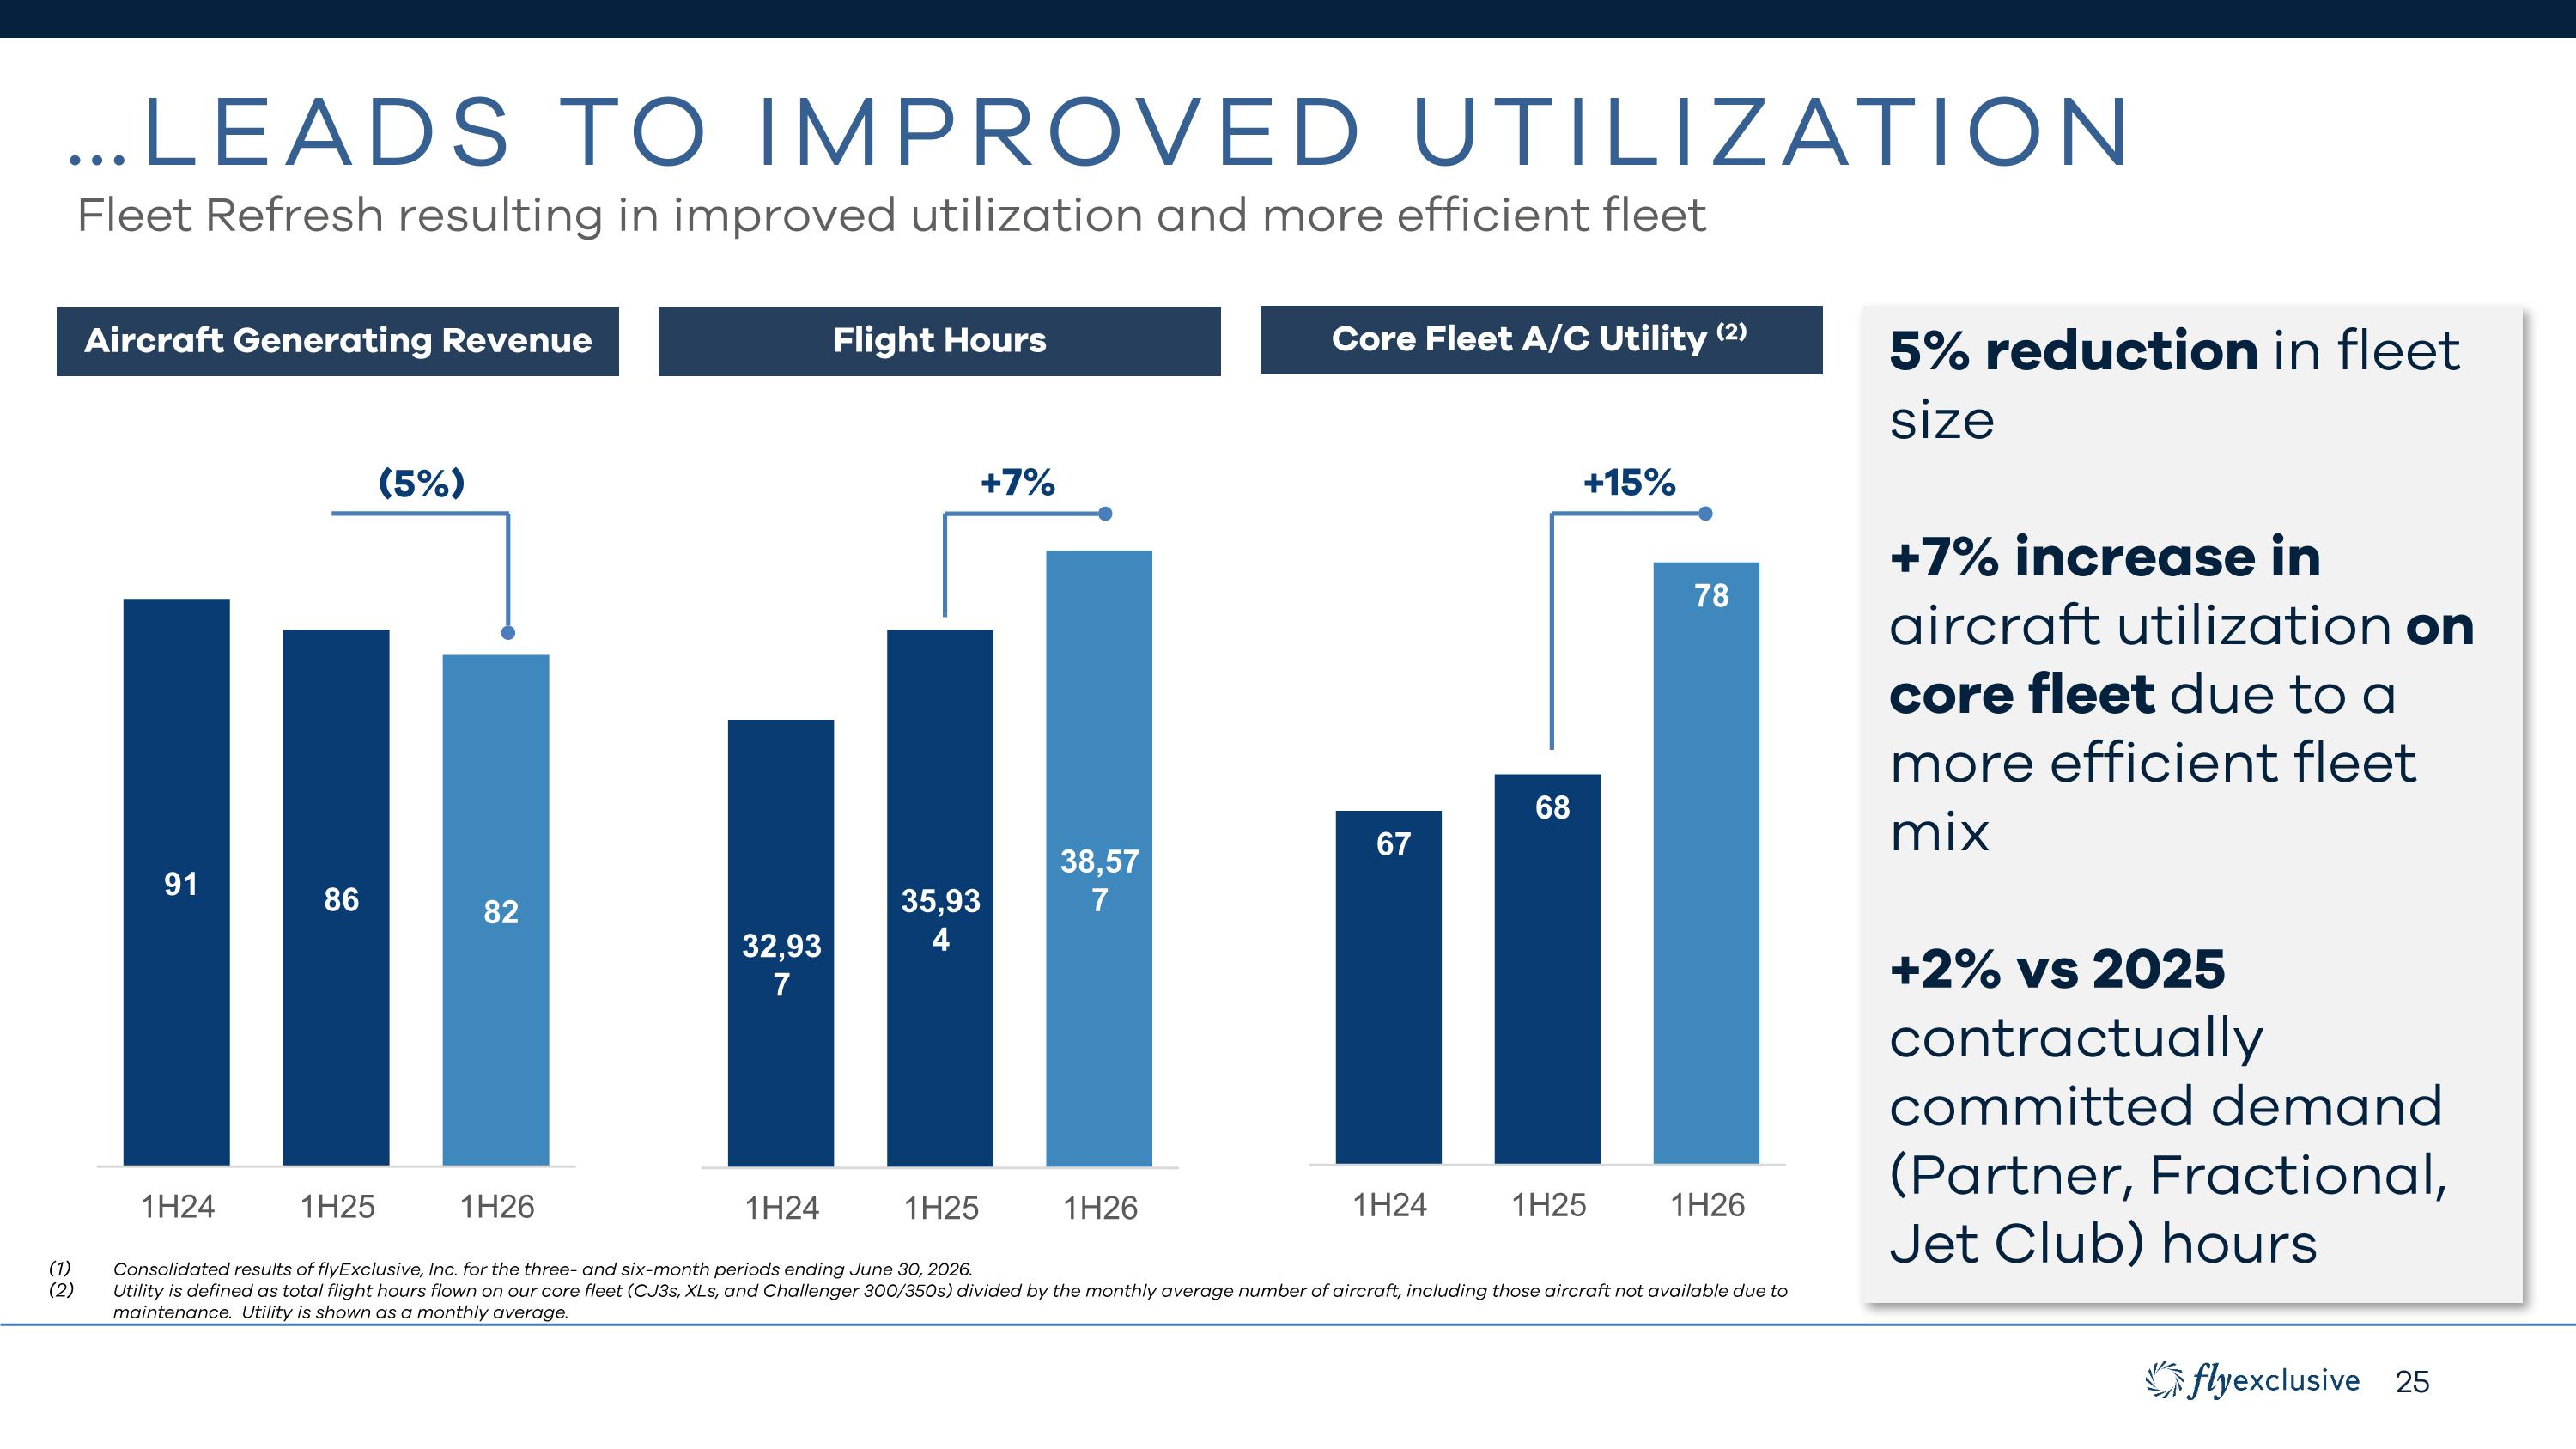
…Leads to Improved utilization Fleet Refresh resulting in improved utilization and more efficient fleet Aircraft Generating Revenue Flight Hours 5% reduction in fleet size +7% increase in aircraft utilization on core fleet due to a more efficient fleet mix +2% vs 2025 contractually committed demand (Partner, Fractional, Jet Club) hours Consolidated results of flyExclusive, Inc. for the three- and six-month periods ending June 30, 2026. Utility is defined as total flight hours flown on our core fleet (CJ3s, XLs, and Challenger 300/350s) divided by the monthly average number of aircraft, including those aircraft not available due to maintenance. Utility is shown as a monthly average. (5%) +7% Core Fleet A/C Utility +15% Core Fleet A/C Utility (2)
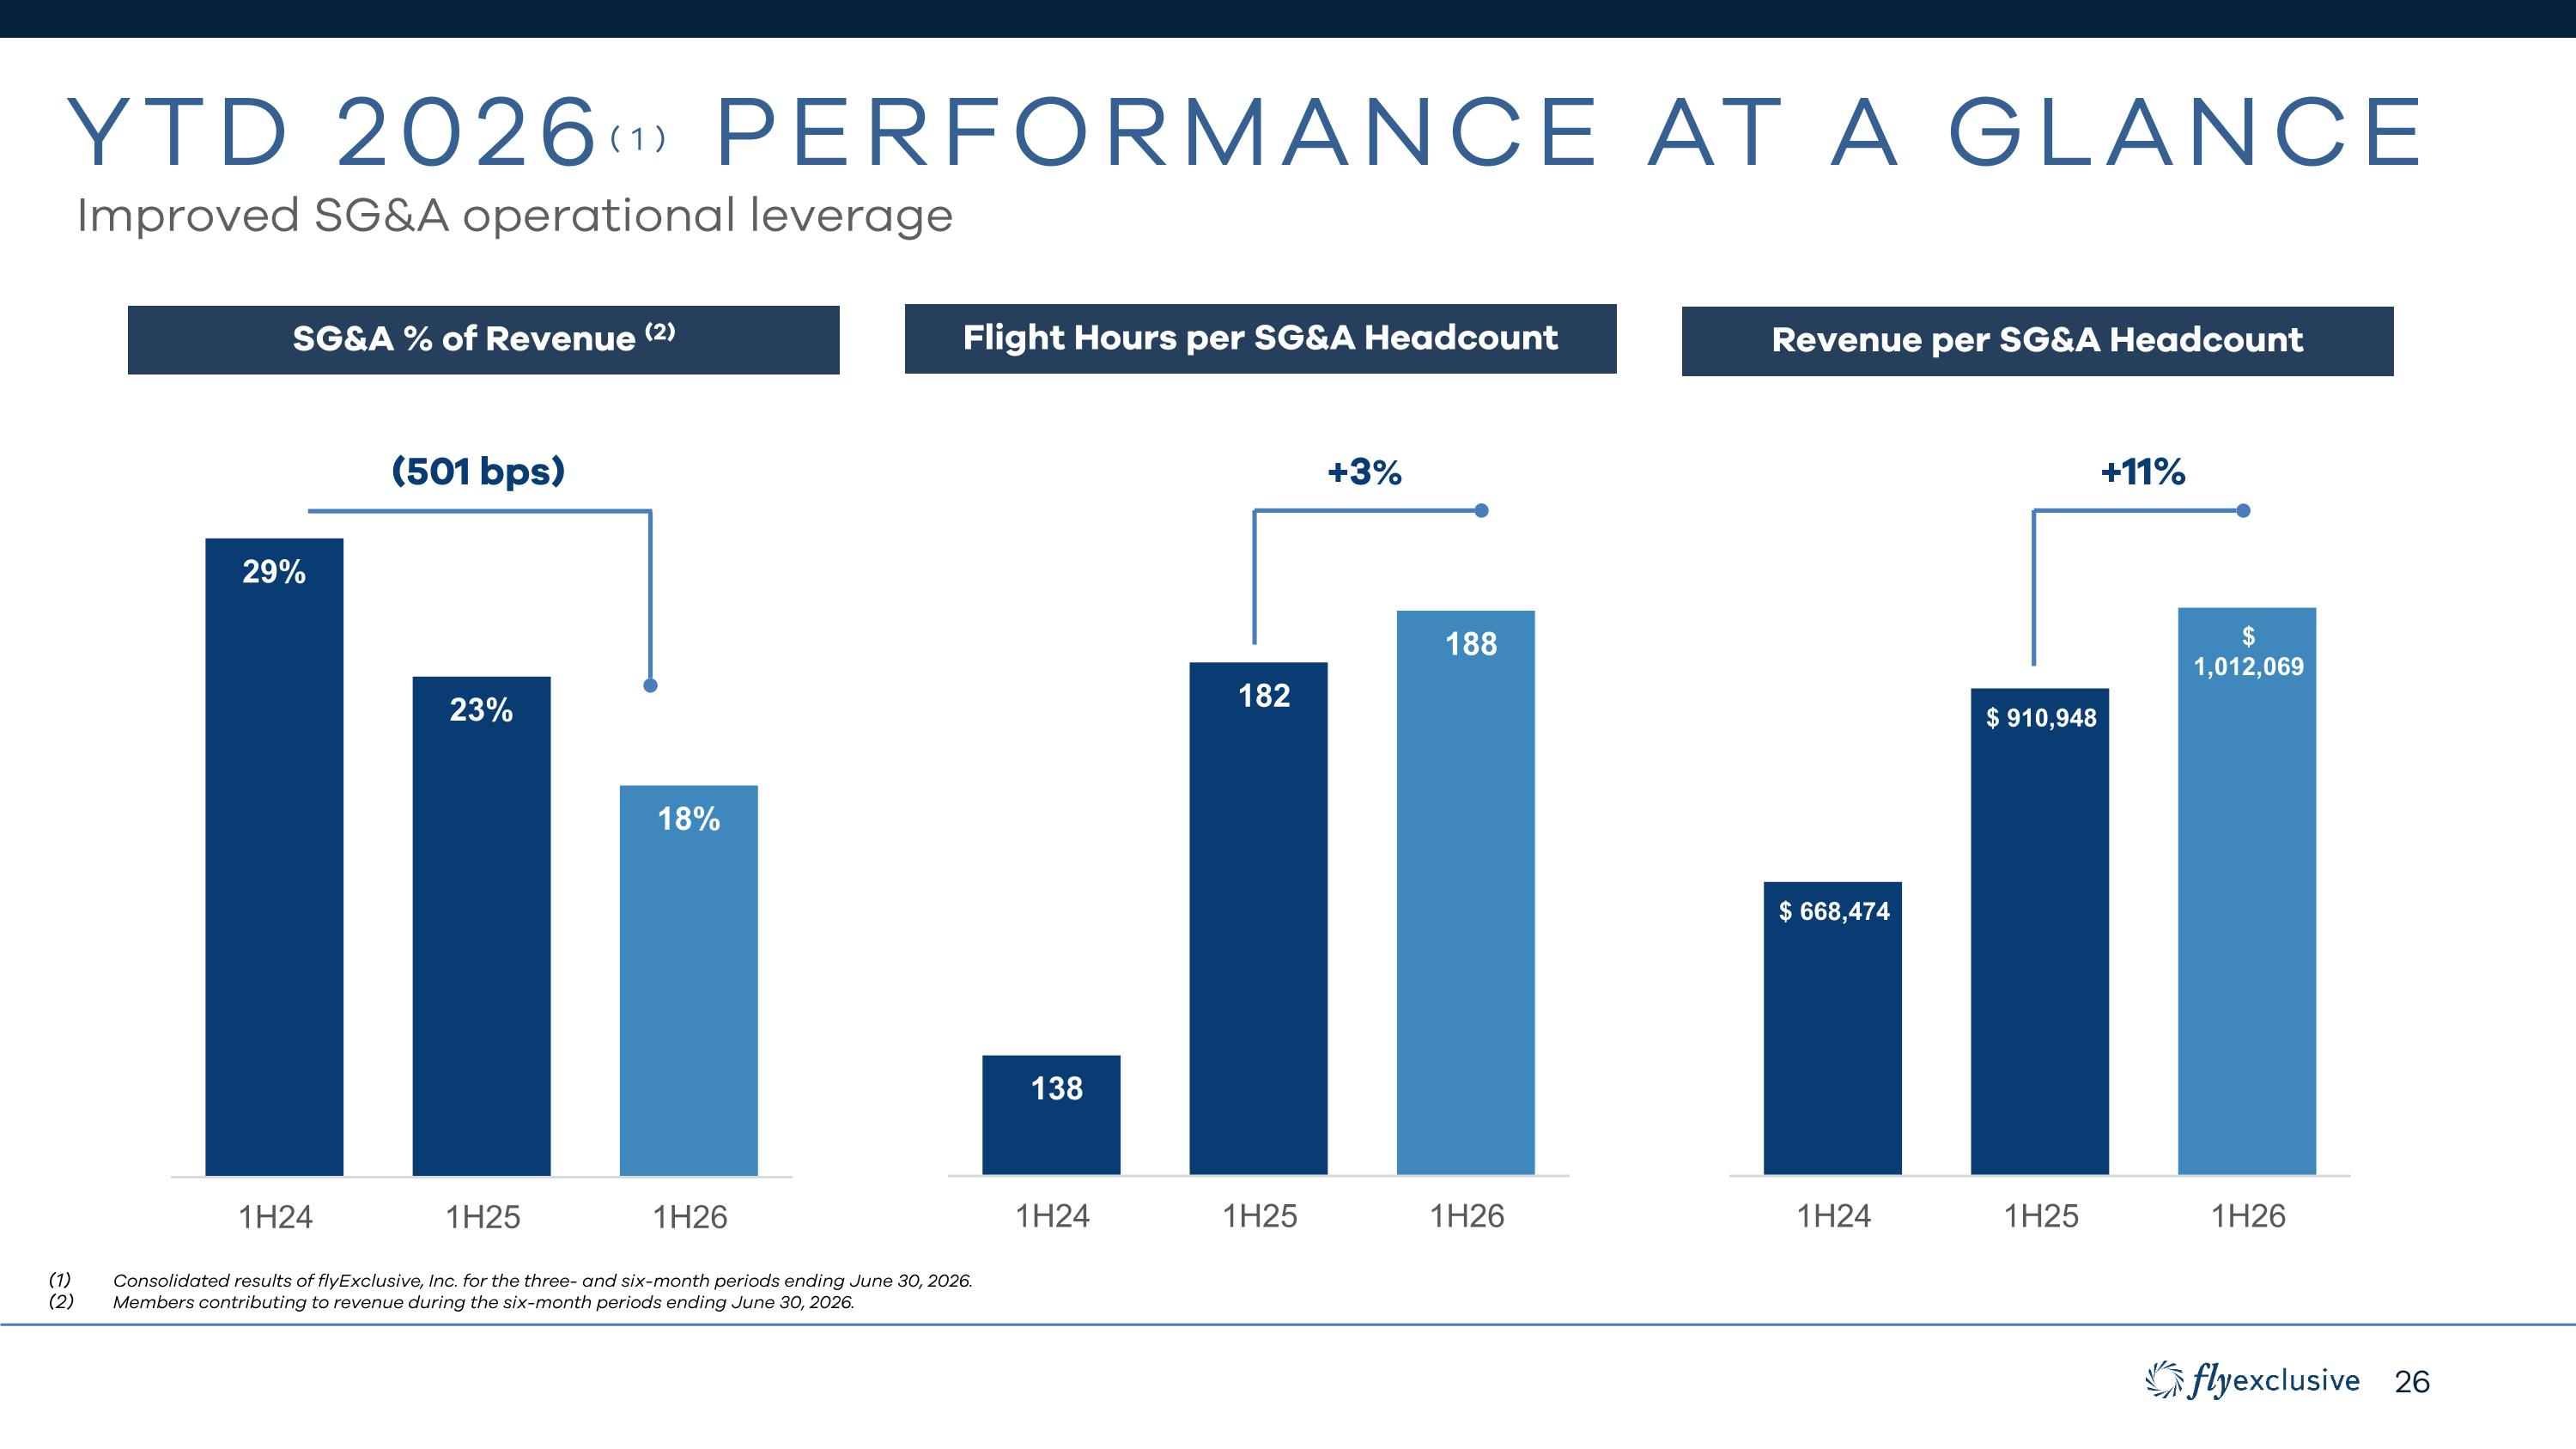
YTD 2026(1) Performance at a glance Improved SG&A operational leverage SG&A % of Revenue (2) Flight Hours per SG&A Headcount Revenue per SG&A Headcount Consolidated results of flyExclusive, Inc. for the three- and six-month periods ending June 30, 2026. Members contributing to revenue during the six-month periods ending June 30, 2026. (501 bps) +3% +11%
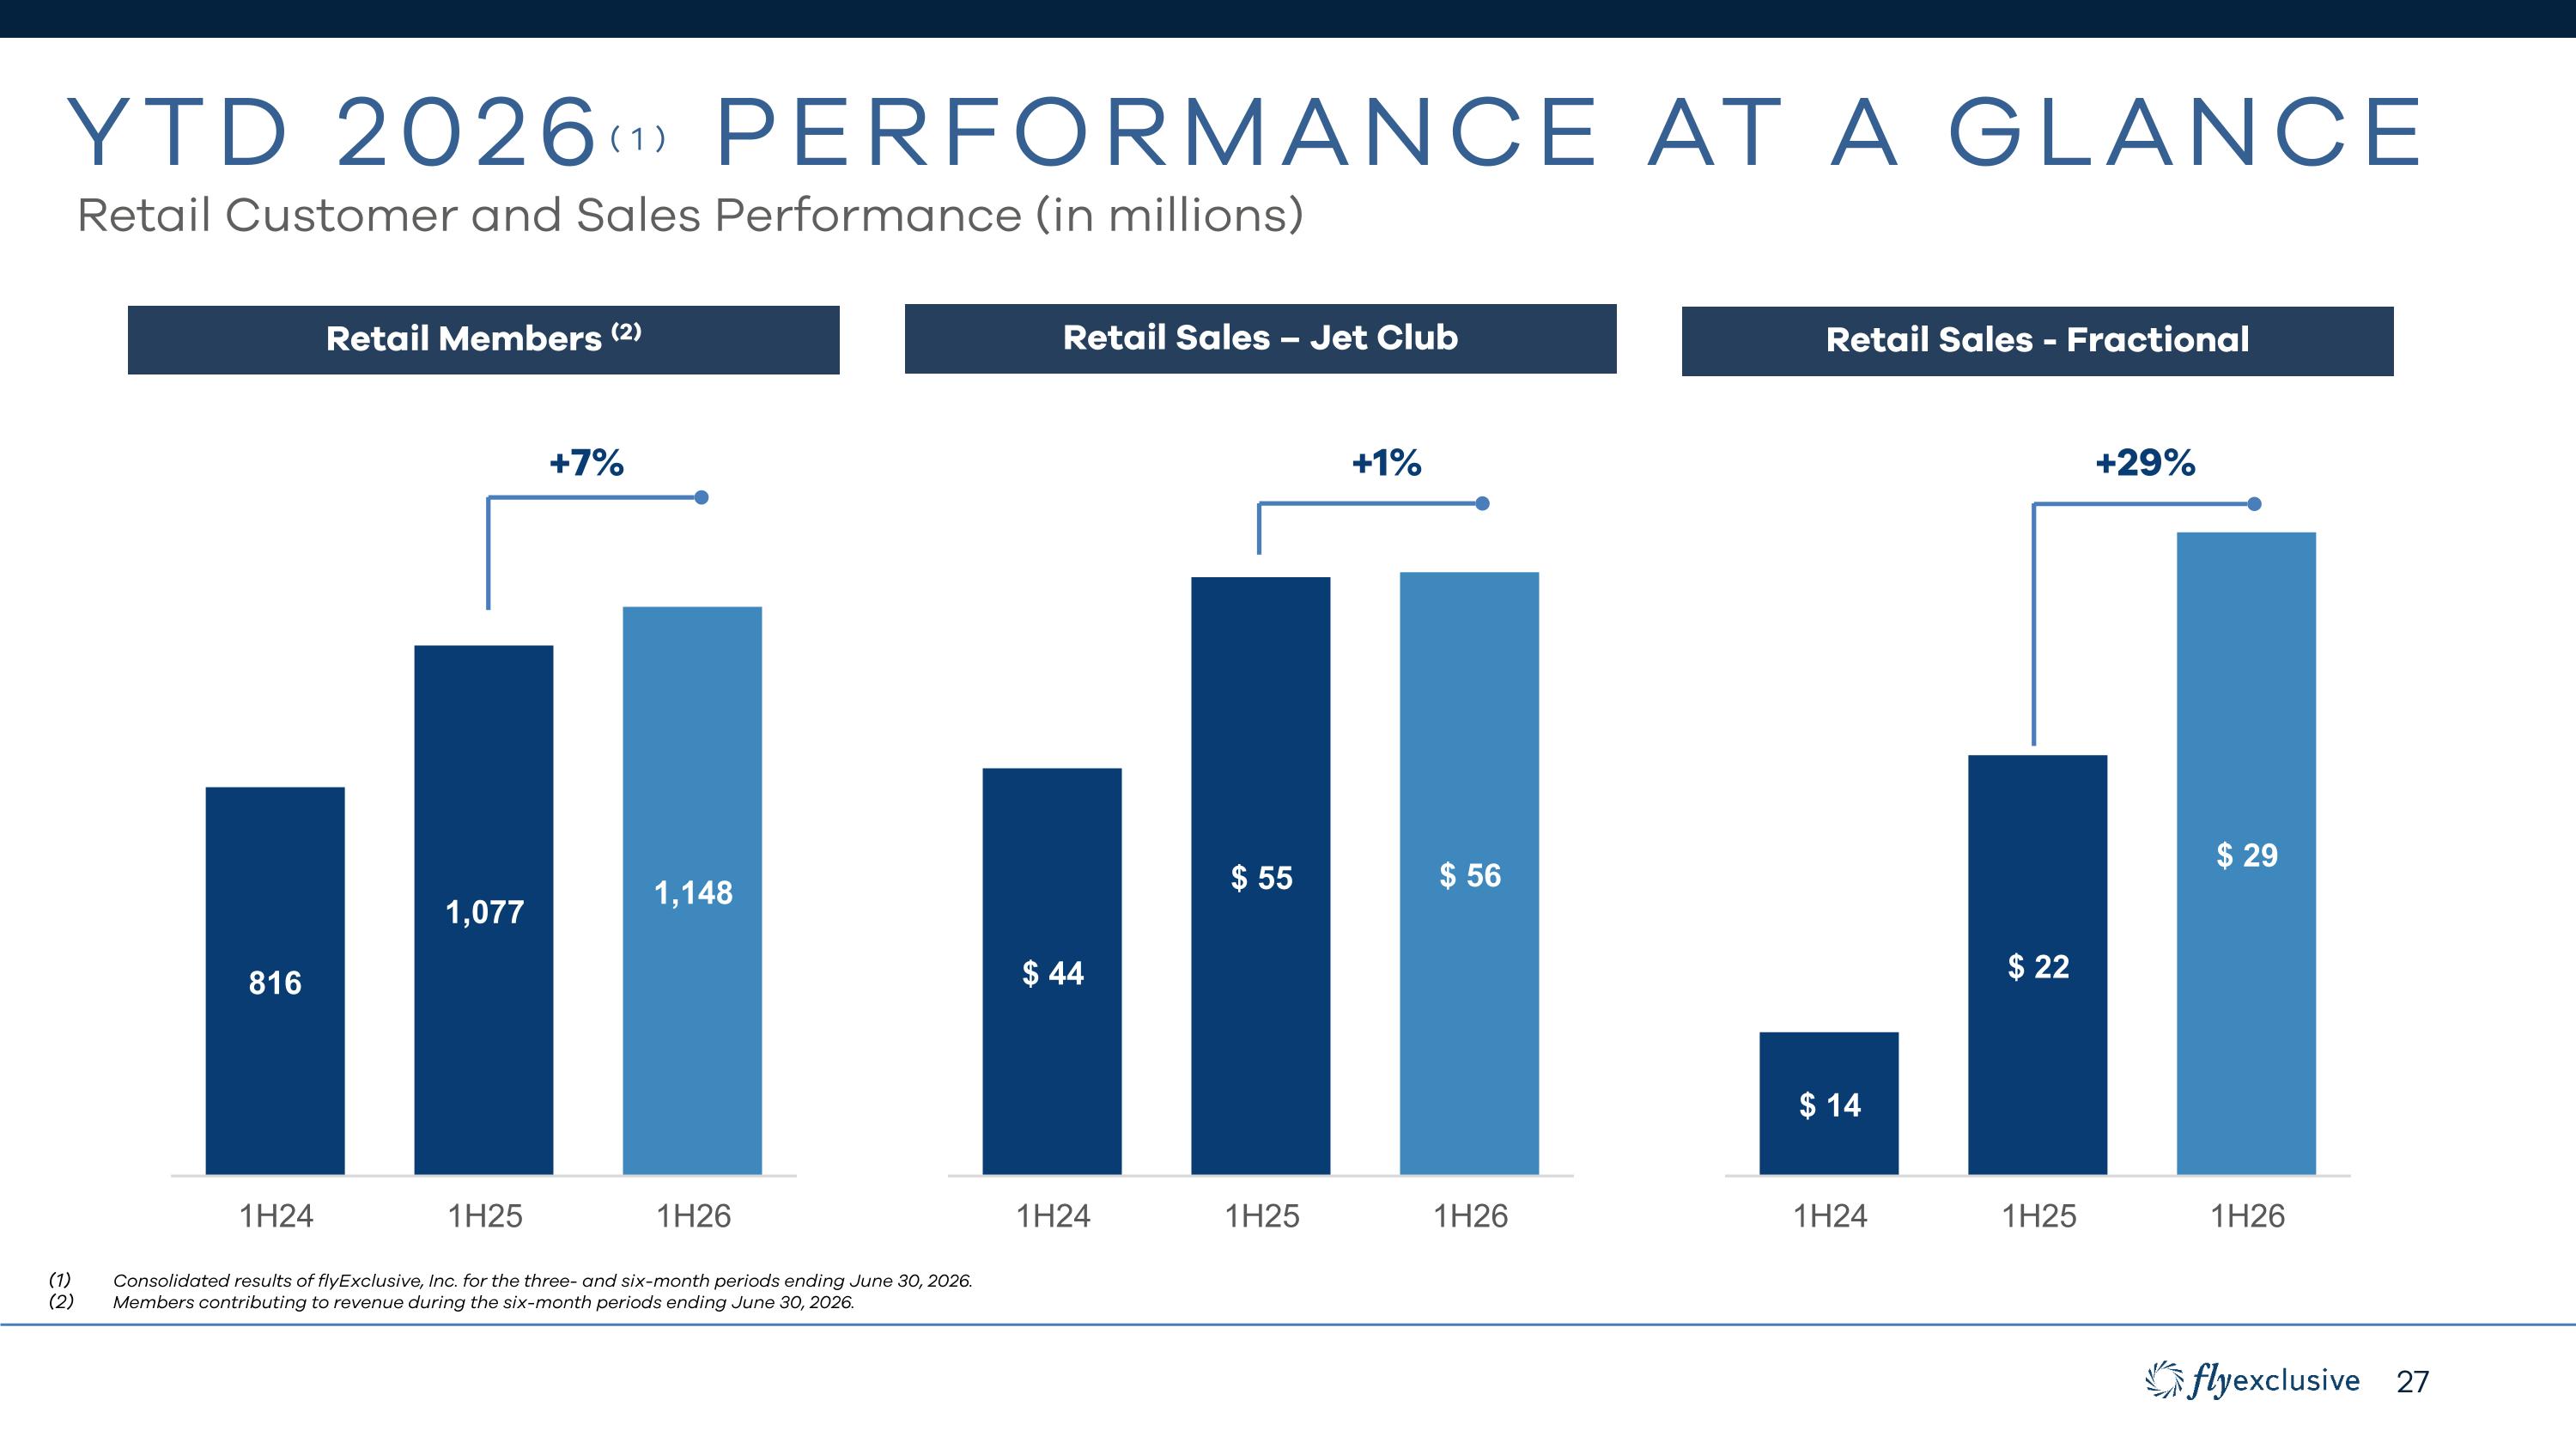
YTD 2026(1) Performance at a glance Retail Customer and Sales Performance (in millions) Retail Sales – Jet Club Retail Sales - Fractional +7% +1% +29% Retail Members (2) Consolidated results of flyExclusive, Inc. for the three- and six-month periods ending June 30, 2026. Members contributing to revenue during the six-month periods ending June 30, 2026.
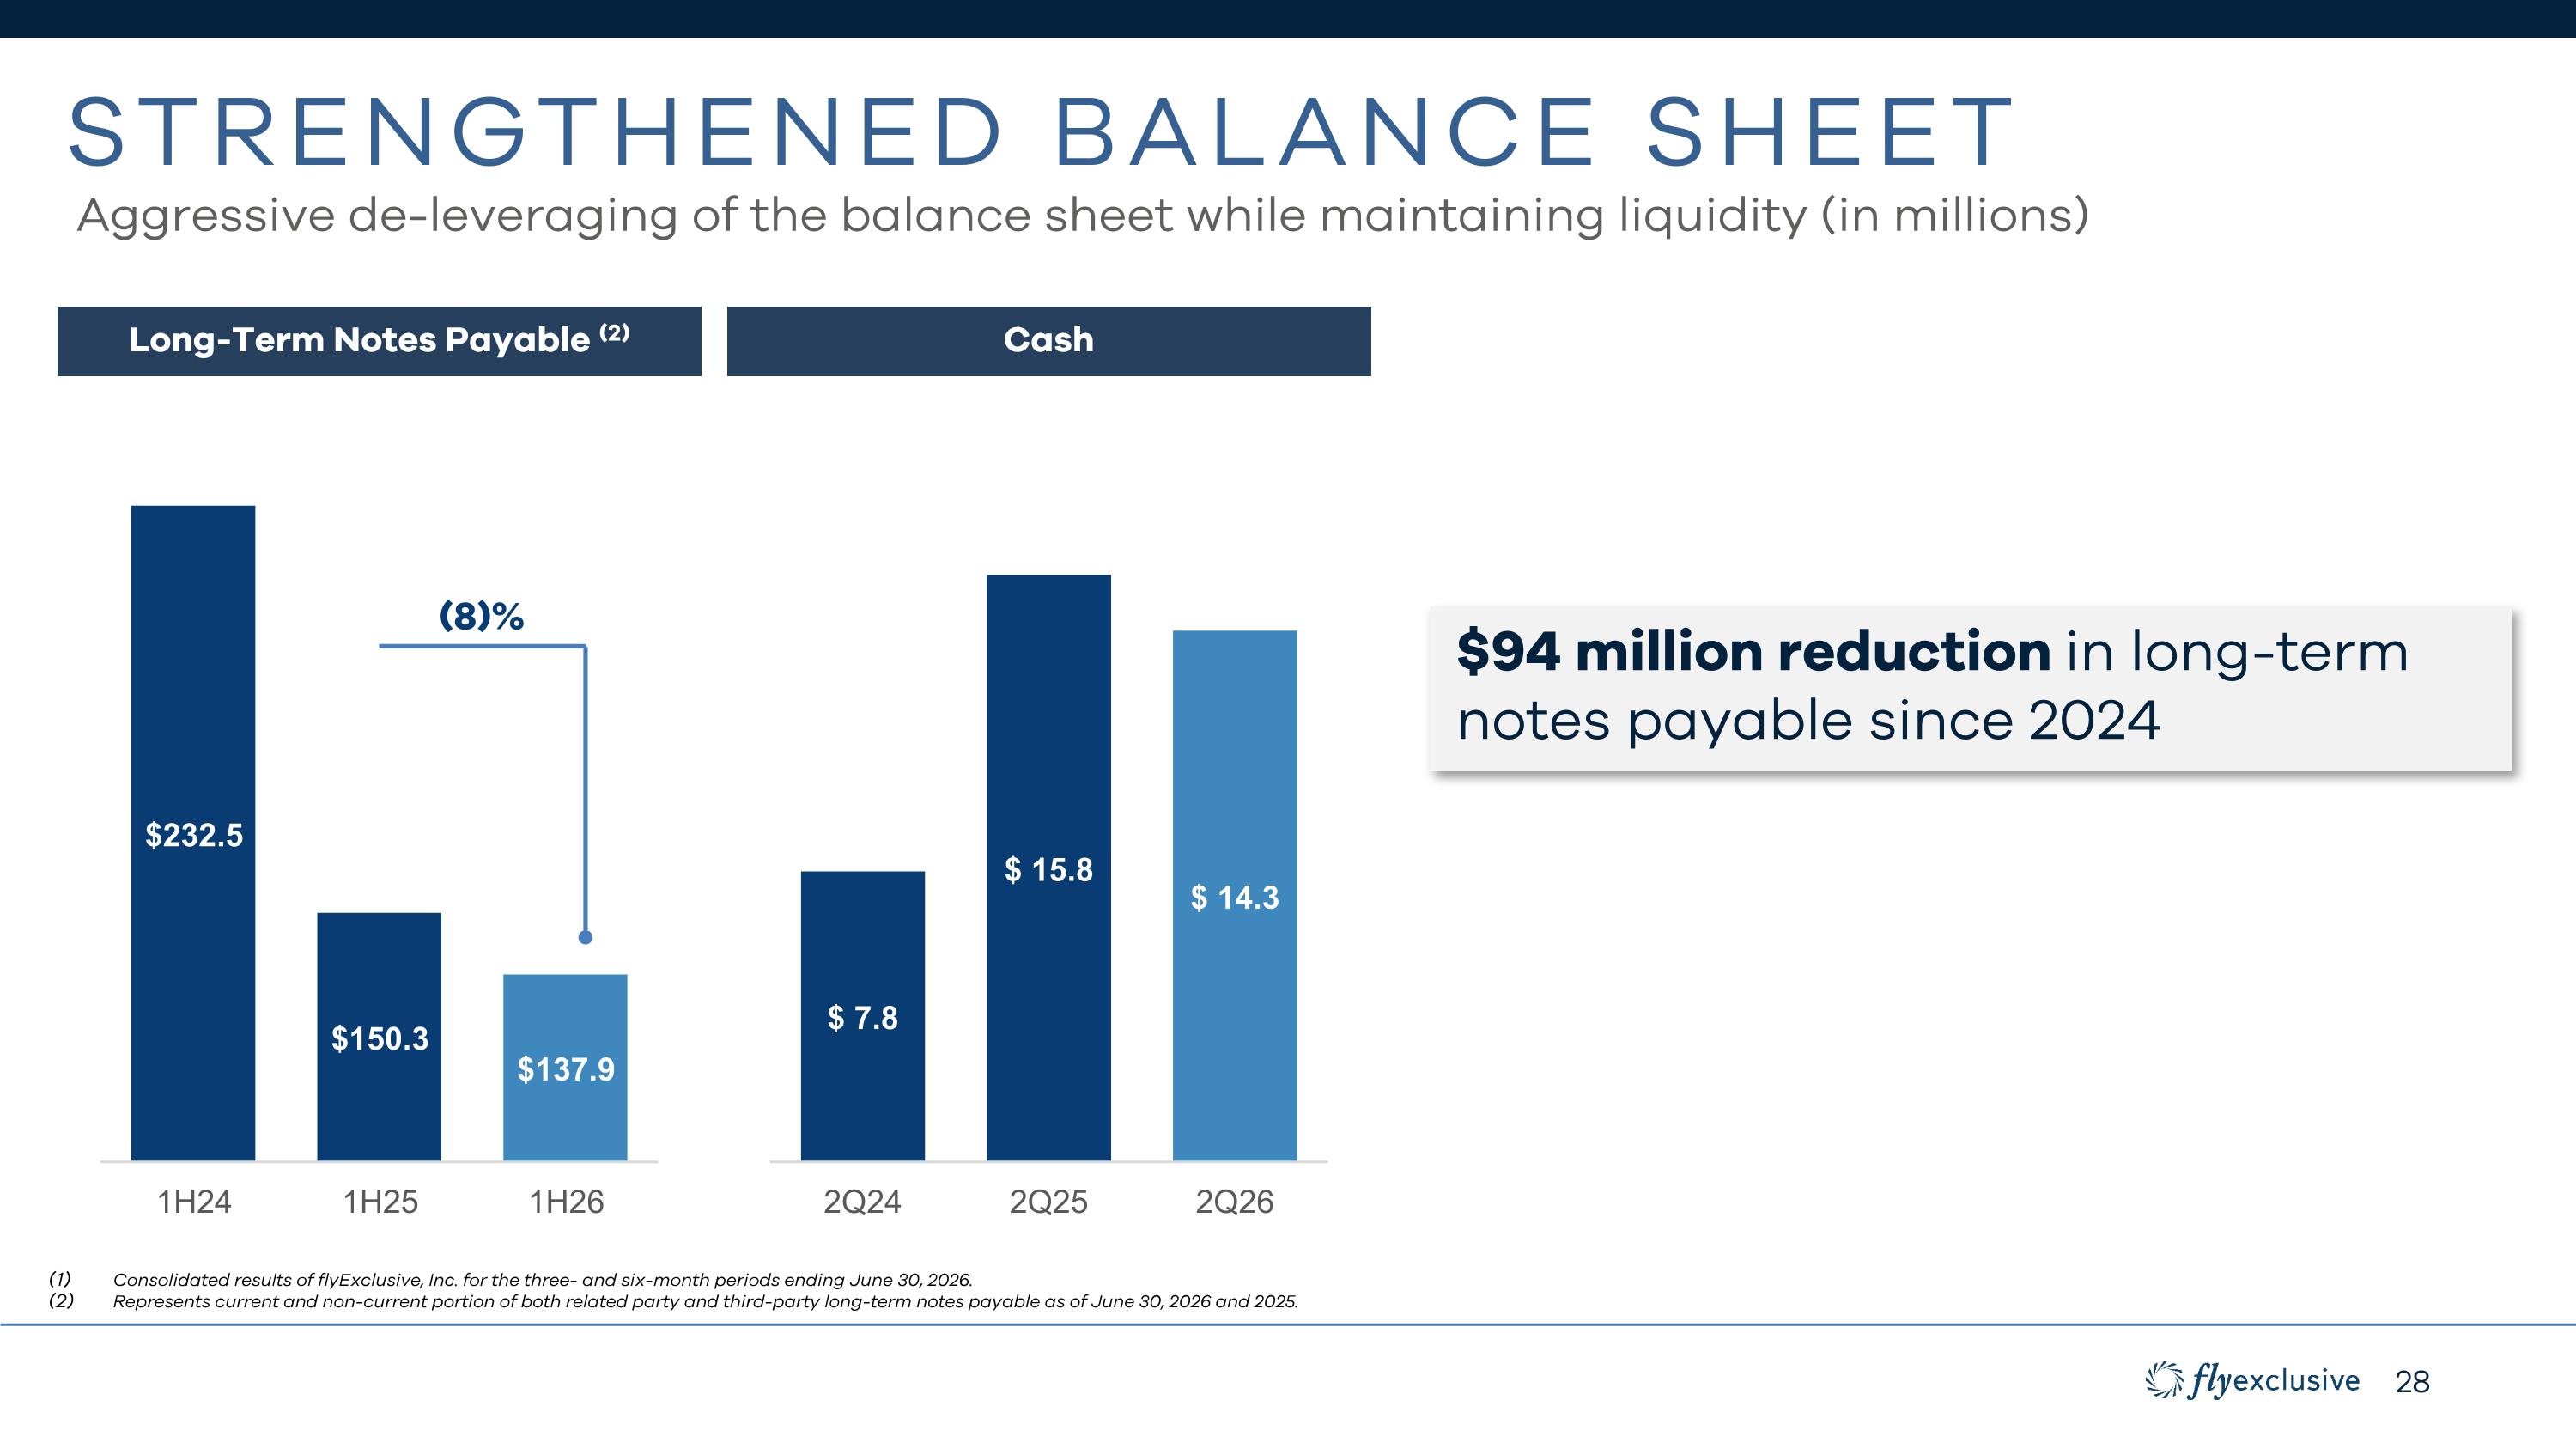
Strengthened Balance Sheet Consolidated results of flyExclusive, Inc. for the three- and six-month periods ending June 30, 2026. Represents current and non-current portion of both related party and third-party long-term notes payable as of June 30, 2026 and 2025. Long-Term Notes Payable (2) Cash $94 million reduction in long-term notes payable since 2024 (8)% Aggressive de-leveraging of the balance sheet while maintaining liquidity (in millions)
I. EXECUTIVE SUMMARY APPENDIX
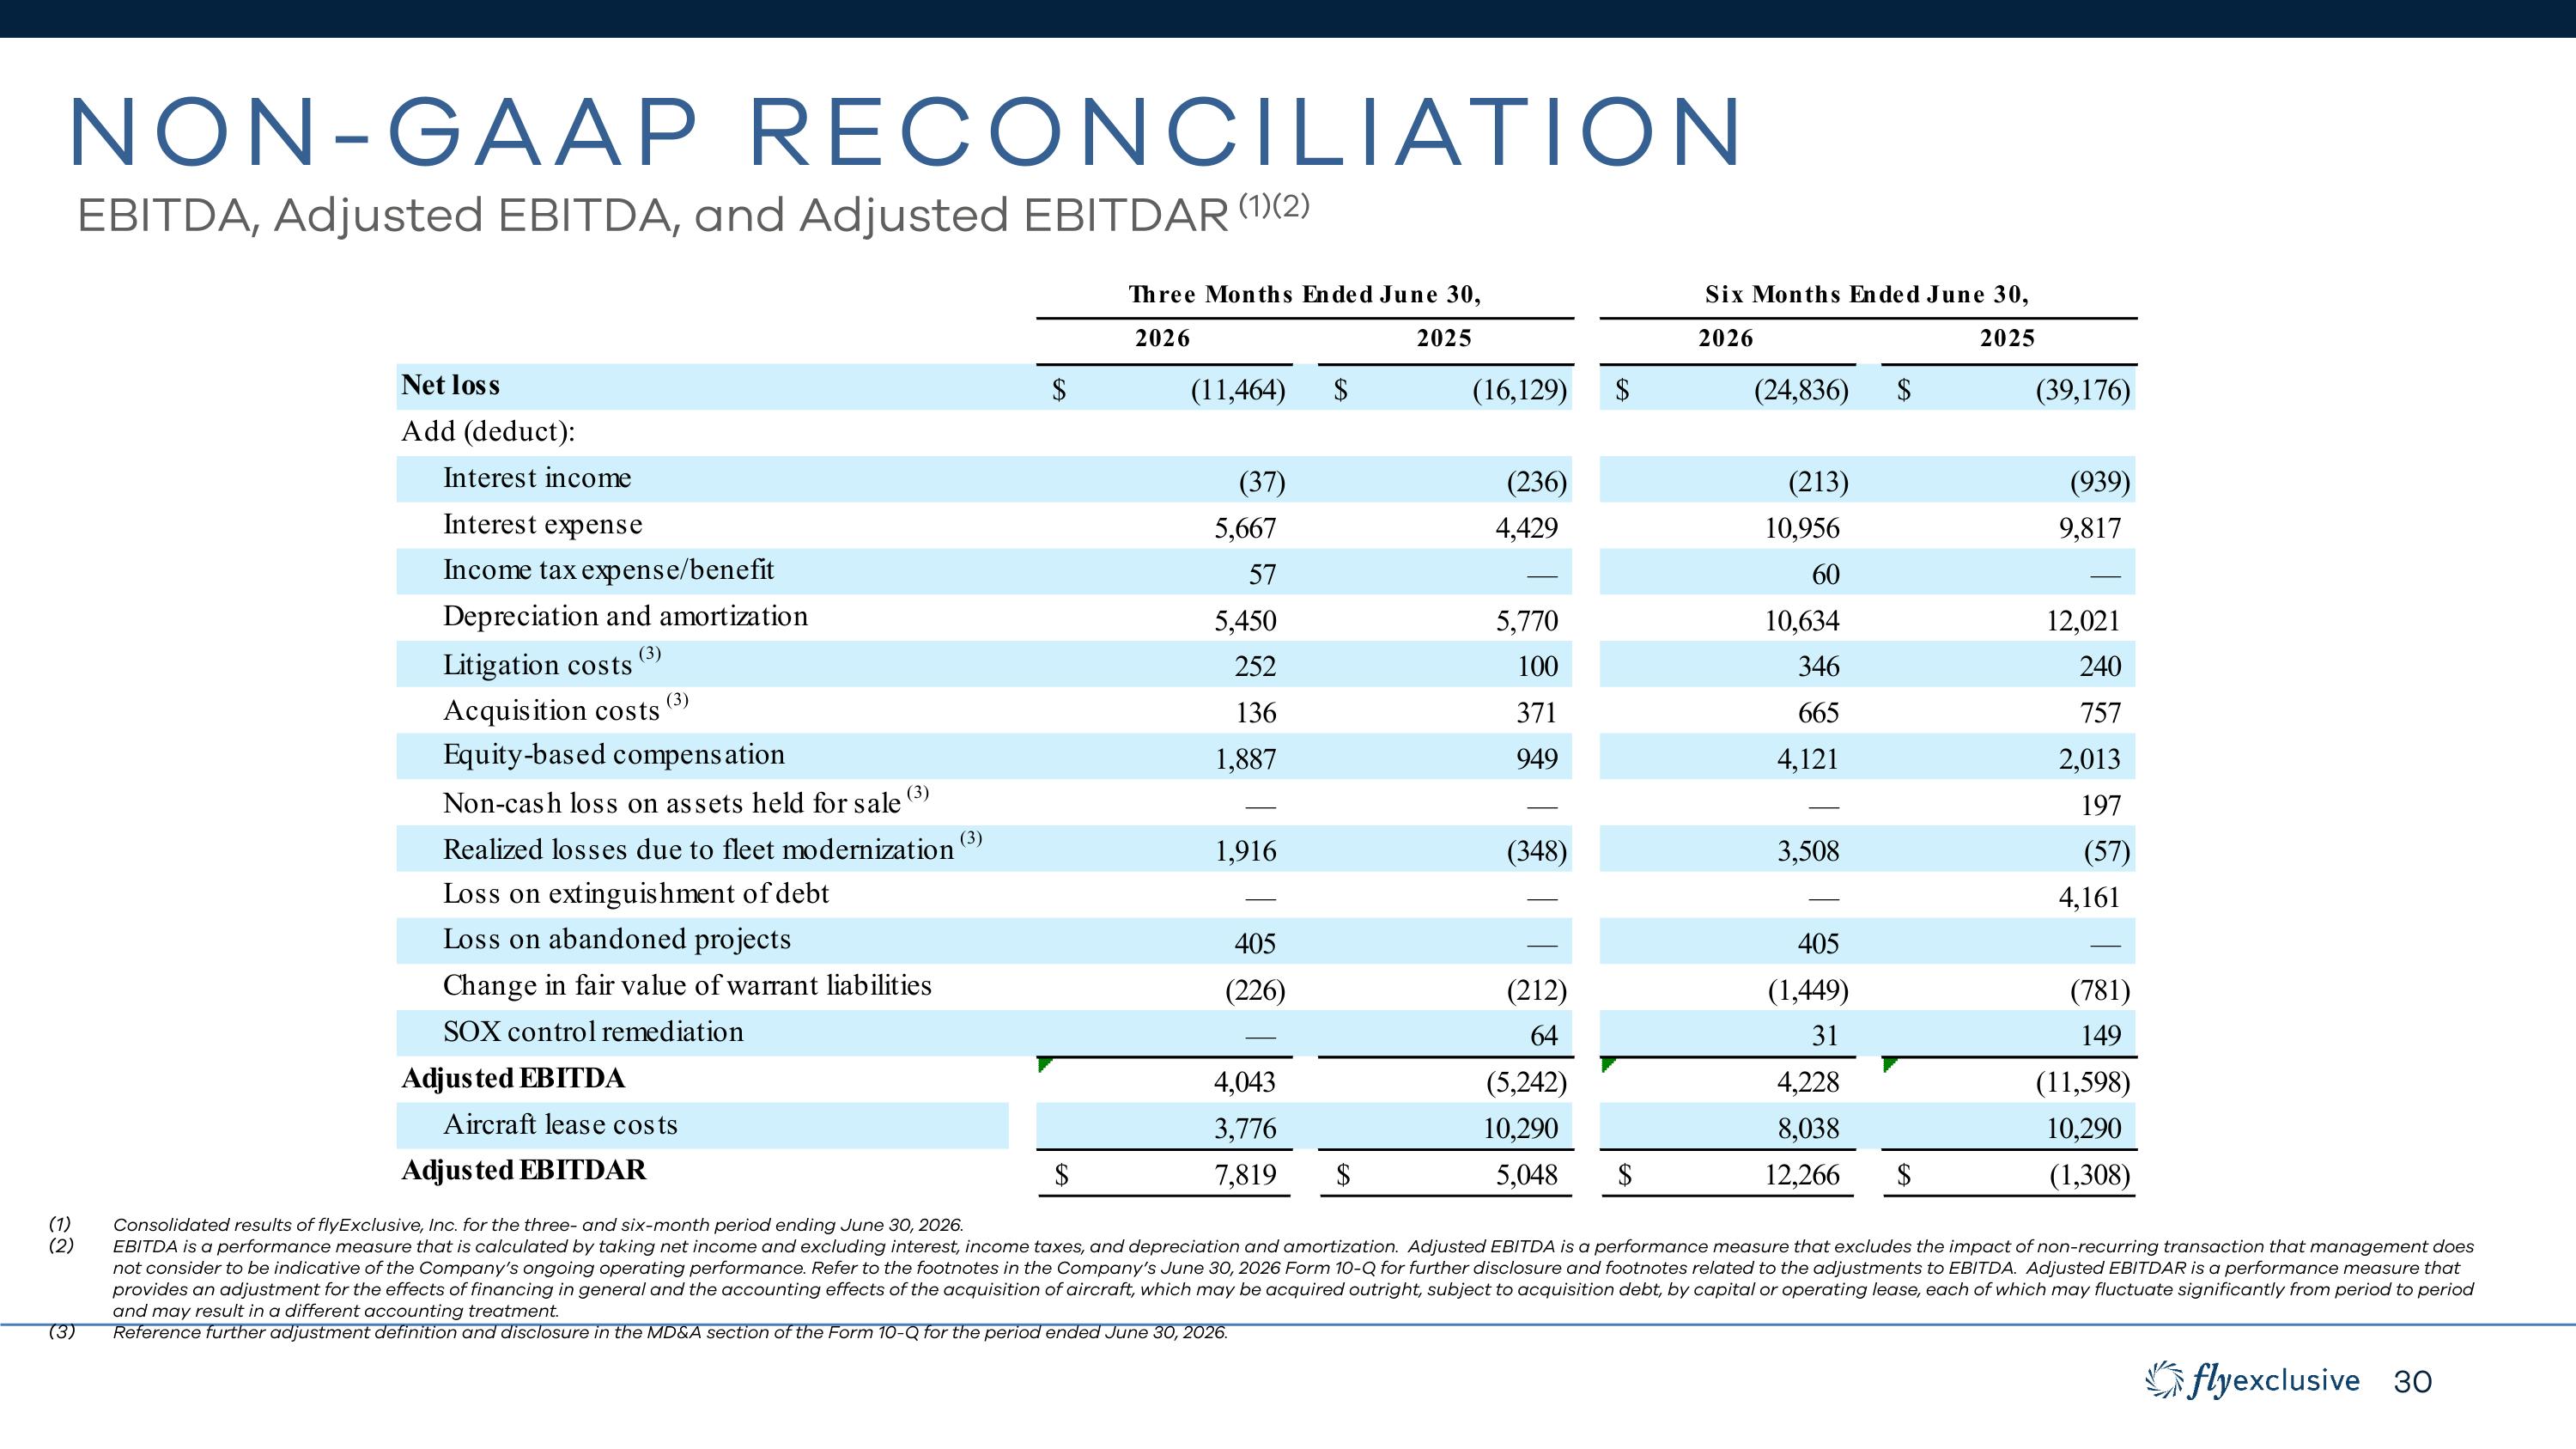
Non-Gaap Reconciliation EBITDA, Adjusted EBITDA, and Adjusted EBITDAR (1)(2) Consolidated results of flyExclusive, Inc. for the three- and six-month period ending June 30, 2026. EBITDA is a performance measure that is calculated by taking net income and excluding interest, income taxes, and depreciation and amortization. Adjusted EBITDA is a performance measure that excludes the impact of non-recurring transaction that management does not consider to be indicative of the Company’s ongoing operating performance. Refer to the footnotes in the Company’s June 30, 2026 Form 10-Q for further disclosure and footnotes related to the adjustments to EBITDA. Adjusted EBITDAR is a performance measure that provides an adjustment for the effects of financing in general and the accounting effects of the acquisition of aircraft, which may be acquired outright, subject to acquisition debt, by capital or operating lease, each of which may fluctuate significantly from period to period and may result in a different accounting treatment. Reference further adjustment definition and disclosure in the MD&A section of the Form 10-Q for the period ended June 30, 2026.