Pay Versus Performance
Under Item 402(v) of Regulation S-K, we must disclose pay-versus performance information for the most recently completed three fiscal years. The following table sets forth the required pay-versus performance disclosures in the form of the “total compensation” as reported in the Company’s “Summary Compensation Table” for the PEO (current and former) and as an average for the other named executive officers.
|
Year |
Summary |
Compensation Actually |
Average |
Average |
Value of Initial Fixed |
|
|
|||||||||||||||||||||||||||||||||
| Compensation | Compensation | Peer | ||||||||||||||||||||||||||||||||||||||
| Table | Actually | Group | ||||||||||||||||||||||||||||||||||||||
| Total for | Paid to | Total | Total | |||||||||||||||||||||||||||||||||||||
| Non-PEO | Non-PEO | Shareholder | Shareholder | Net | Adjusted | |||||||||||||||||||||||||||||||||||
|
Tom McKinlay |
Roeland Polet |
Tom McKinlay |
Roeland Polet |
NEOs (c) | NEOs (c)(d) |
Return (1) |
Return (2) |
Income | EBITDA (3) | |||||||||||||||||||||||||||||||
|
2025 |
- | $ | 531,000 | - | $ | (921,000 | ) | $ | 378,667 | $ | 378,000 | $ | 53.23 | $ | 81.14 | $ | (49,397,000 | ) | $ | (38,317,000 | ) | |||||||||||||||||||
|
2024 |
$ | 429,000 | $ | 5,104,000 | $ | 429,000 | $ | 5,104,000 | $ | 385,000 | $ | 385,000 | $ | 341.62 | $ | 110.94 | $ | 15,503,000 | $ | 17,594,000 | ||||||||||||||||||||
|
2023 |
$ | 699,000 | - | $ | 699,000 | - | $ | 436,000 | $ | 436,000 | $ | 87.11 | $ | 147.44 | $ | 37,382,000 | $ | 34,983,000 | ||||||||||||||||||||||
|
(a) |
Mr. McKinlay retired from the chief executive officer position in May 2024 and was given a separation payment of his expected bonus for 2024 (other compensation) as well as half his annual salary to provide certain consulting services to the Company. He will receive another payment of half his salary in 2025. He had been appointed as chief executive officer on July 31, 2022. In 2023, the Compensation Committee approved an adjustment to Mr. McKinlay's base salary to $400,000 per annum and that resulted in a lump sum payment in February 2023 of $56,000 (based on a deemed retroactive adjustment to August 2022). This lump sum payment was included in Mr. McKinlay’s compensation for 2023 as reported in our Annual Report for the year ended December 31, 2023, as amended. |
|
(b) |
Mr. Polet was appointed Chief Executive Officer effective September 3, 2024 upon Mr. McKinlay’s retirement. Mr. Polet was issued 750,000 RSUs that vest annually on the anniversary date. These RSUs and related dividends had an intrinsic value of $4,519,000 and $392,000, respectively. |
|
(c) |
Non-PEO NEOs in each of the years presented included Rose M. Sparks, Charles Lyon and Kyle Gaither. |
|
(d) |
No stock awards or stock options were granted to our PEOs or Non-PEO NEOs in 2023. In 2024, the Company issued 750,000 RSUs to Roeland Polet, the Company’s Chief Executive Officer, in connection with his Employment Agreement. The RSUs vest in five equal installments on each anniversary of the award date, September 3, 2024. No stock awards or stock options were granted to our Non-PEO NEOs in 2024. In 2025, the Company issued 5,012 shares of restricted stock to each of Rose M. Sparks and Kyle Gaither, which vest in three equal installments beginning April 2, 2026 and ending on the second anniversary of such date. |
|
(1) |
Total stockholder return as calculated based on a fixed investment of one hundred dollars measured from the market close on December 31, 2023 (the last trading day of 2023) through and including the end of the fiscal year for each year reported in the table. |
|
(2) |
Our peer group used for the total stockholder return calculation is Archer-Daniels-Midland Co., Arkema SA, Albemarle Corp., Alto Ingredients Inc., Aemetis Inc., Bunge Global SA, Cabot Corp., Chemours Co., Celanese Corp., Darling Ingredients Inc., Dow Inc., Eastman Chemical Co., Gevo Inc., Green Plains Inc., Hudson Technologies Inc., Huntsman Corp., Kronos Worldwide Inc., Lanxess Ag, Lyondellbasell Industries NV, Olin Corp., Rex American Resources Corp., Stepan Co., Solvay SA and Westlake Corp. |
|
(3) |
Our Company-selected measure, which is the measure we believe represents the most important financial performance measure not otherwise presented in the table above that we use to link compensation actually paid to our named executive officers for 2025 to our Company’s performance, is Adjusted EBITDA (a non-GAAP financial measure). For a reconciliation of Adjusted EBITDA to net income (the relevant GAAP measure), please see the Company’s 2025 Annual Report; provided, that for purposes of the above table, the Company restated previously reported Adjusted EBITDA per interpretive guidance to exclude unrealized (non-cash) gains and losses on derivative instruments. |
Relationship Between Compensation Actually Paid and Performance Measures
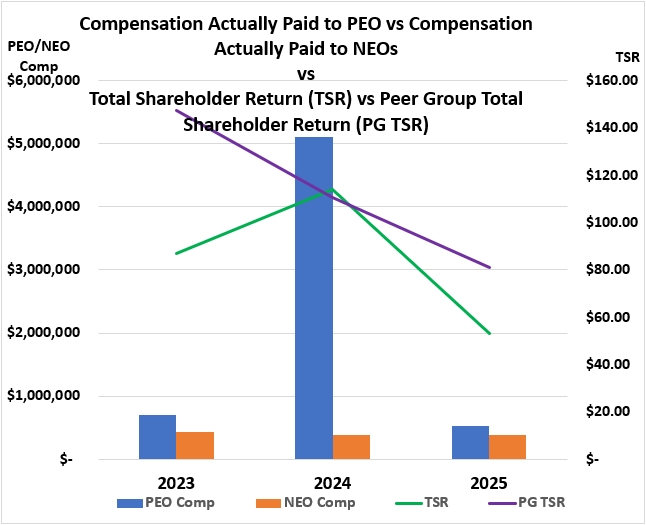
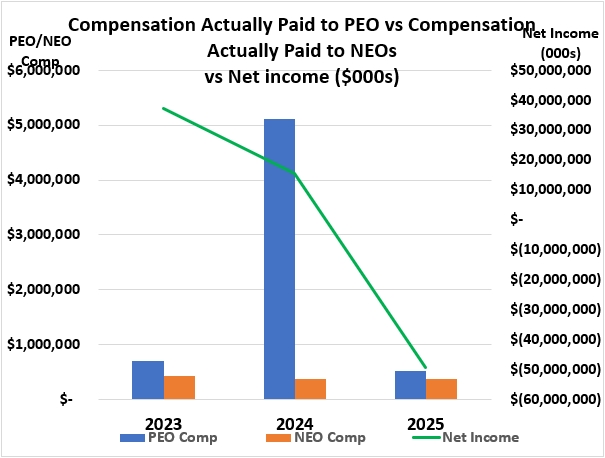
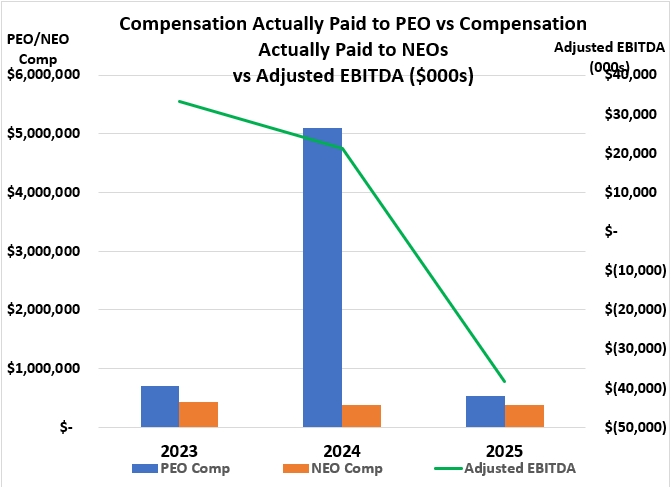
The charts below illustrate, for the past three fiscal years, the relationship between compensation actually paid to the PEOs and the average compensation actually paid to NEOs and the financial metrics disclosed in the Pay versus Performance Table.
Tabular List of Company Performance Measures
The following lists the measures we believe are most important in linking compensation actually paid to Company performance during 2025.
|
(a) |
Adjusted EBITDA |
|
(b) |
Gross Profit |
|
(c) |
Net Income |