
Results Conference Call 2Q26
1 Disclaimer and Forward-Looking Statement This presentation may contain forward-looking statements within the meaning of federal securities law that are subject to risks and uncertainties. These statements are only predictions based upon our current expectations and projections about possible or assumed future results of our business, financial condition, results of operations, liquidity, plans and objectives. In some cases, you can identify forward-looking statements by terminology such as “believe,” “may,” “estimate,” “continue,” “anticipate,” “intend,” “should,” “plan,” “expect,” “predict,” “potential,” “seek,” “forecast,” or the negative of these terms or other similar expressions. The forward-looking statements are based on the information currently available to us. There are important factors that could cause our actual results, level of activity, performance or achievements to differ materially from the results, level of activity, performance or achievements expressed or implied by the forward-looking statements, including, among others things: changes in general economic, political, governmental and business conditions globally and in Argentina, changes in inflation rates, fluctuations in the exchange rate of the peso, the level of construction generally, changes in cement demand and prices, changes in raw material and energy prices, changes in business strategy and various other factors. You should not rely upon forward-looking statements as predictions of future events. Although we believe in good faith that the expectations reflected in the forward-looking statements are reasonable, we cannot guarantee that future results, levels of activity, performance and events and circumstances reflected in the forward-looking statements will be achieved or will occur. Any or all of Loma Negra’s forward-looking statements in this release may turn out to be wrong. You should consider these forward-looking statements in light of other factors discussed under the heading “Risk Factors” in Company’s Annual Report on Form 20-F, as well as periodic filings made on Form 6-K, which are filed with or furnished to the United States Securities and Exchange Commission. Except as required by law, we undertake no obligation to update publicly any forward-looking statements for any reason after the date of this release to conform these statements to actual results or to changes in our expectations. The Company presented some figures converted from Argentine pesos to U.S. dollars for comparison purposes. The exchange rate used to convert Pesos to U.S. dollars was the reference exchange rate (Communication “A” 3500) reported by the Central Bank for U.S. dollars. The information presented in U.S. dollars is for the convenience of the reader only. Certain figures included in this report have been subject to rounding adjustments. Accordingly, figures shown as totals in certain tables may not be arithmetic aggregations of the figures presented in previous quarters. Note: Loma Negra’s financial information has been prepared in accordance with the Argentine Securities Commission (Comisión Nacional de Valores-CNV) and with International Financial Reporting Standards. Following the categorization of Argentina as a country with a three-year cumulative inflation rate greater than 100%, the country is considered highly inflationary in accordance with IFRS. Consequently, starting July 1, 2018, the Company is reporting results applying IFRS rule IAS 29. IAS 29 requires that results of operations in hyperinflationary economies are reported as if these economies were highly inflationary as of January 1, 2018, and thus year-to-date, together with comparable results, should be restated adjusting for the change in general purchasing power of the local currency, using official indices. For comparison purposes and a better understanding of our underlying performance, in addition to presenting ‘As Reported’ results, we are also disclosing selected figures as previously reported excluding rule IAS 29. Additional information in connection with the application of rule IAS 29 can be found in our earnings report.
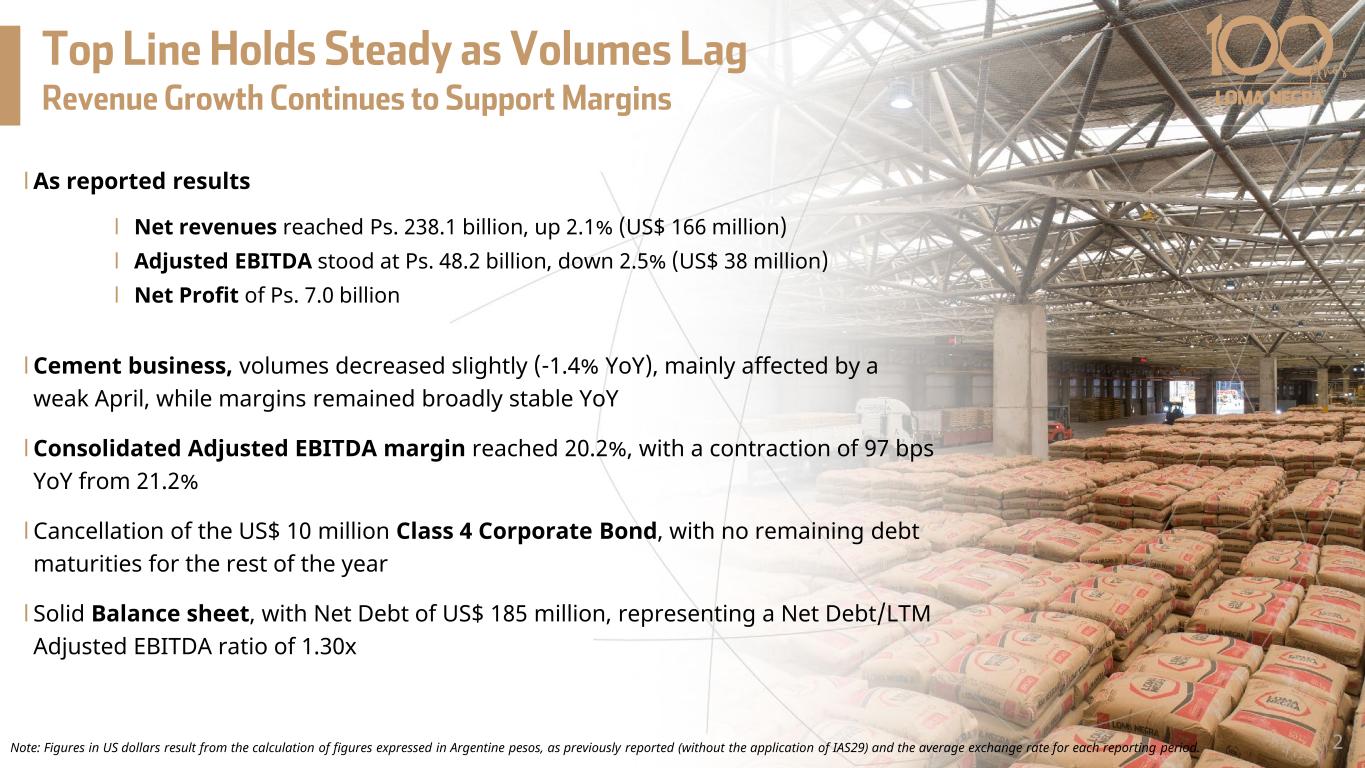
Top Line Holds Steady as Volumes Lag Revenue Growth Continues to Support Margins l As reported results l Net revenues reached Ps. 238.1 billion, up 2.1% (US$ 166 million) l Adjusted EBITDA stood at Ps. 48.2 billion, down 2.5% (US$ 38 million) l Net Profit of Ps. 7.0 billion l Cement business, volumes decreased slightly (-1.4% YoY), mainly affected by a weak April, while margins remained broadly stable YoY l Consolidated Adjusted EBITDA margin reached 20.2%, with a contraction of 97 bps YoY from 21.2% l Cancellation of the US$ 10 million Class 4 Corporate Bond, with no remaining debt maturities for the rest of the year l Solid Balance sheet, with Net Debt of US$ 185 million, representing a Net Debt/LTM Adjusted EBITDA ratio of 1.30x Note: Figures in US dollars result from the calculation of figures expressed in Argentine pesos, as previously reported (without the application of IAS29) and the average exchange rate for each reporting period. 2
Macro & Industry context Revenues and Volumes
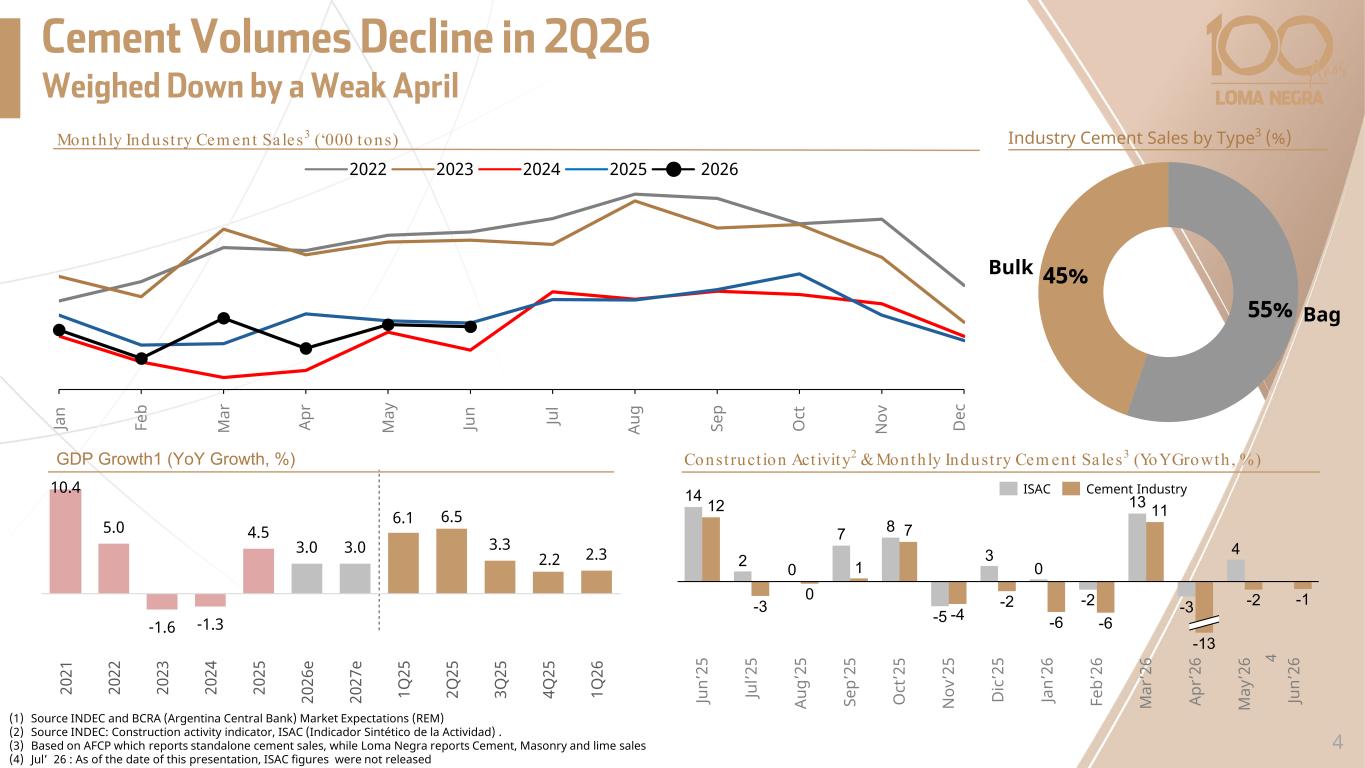
Cement Volumes Decline in 2Q26 Weighed Down by a Weak April 10.4 5.0 -1.6 -1.3 4.5 3.0 3.0 6.1 6.5 3.3 2.2 2.3 20 21 20 22 20 23 20 24 20 25 20 26 e 20 27 e 1Q 25 2Q 25 3Q 25 4Q 25 1Q 26 Ap r Fe b Ja n M ar M ay N ovJu n Au g D ec Se p O ct 202620232022 2025 GDP Growth1 (YoY Growth, %) Monthly Industry Cem ent Sa les3 (‘000 tons) 2024 14 2 7 8 -5 3 0 -2 13 -3 4 12 -3 0 1 7 -4 -2 -6 -6 11 -2 -1 Ju n’ 25 Ju l’2 5 Au g’ 25 Se p’ 25 O ct ’2 5 N ov ’2 5 D ic ’2 5 Ja n’ 26 Fe b’ 26 M ar ’2 6 0 Ap r’ 26 M ay ’2 6 Ju n’ 26 -13 ISAC Cement Industry Ju l Industry Cement Sales by Type3 (%) Construct ion Act ivity2 & Month ly Industry Cem ent Sa les3 (YoY Growth , %) (1) Source INDEC and BCRA (Argentina Central Bank) Market Expectations (REM) (2) Source INDEC: Construction activity indicator, ISAC (Indicador Sintético de la Actividad) . (3) Based on AFCP which reports standalone cement sales, while Loma Negra reports Cement, Masonry and lime sales (4) Jul’ 26 : As of the date of this presentation, ISAC figures were not released 55% 45% Bag Bulk 4 4
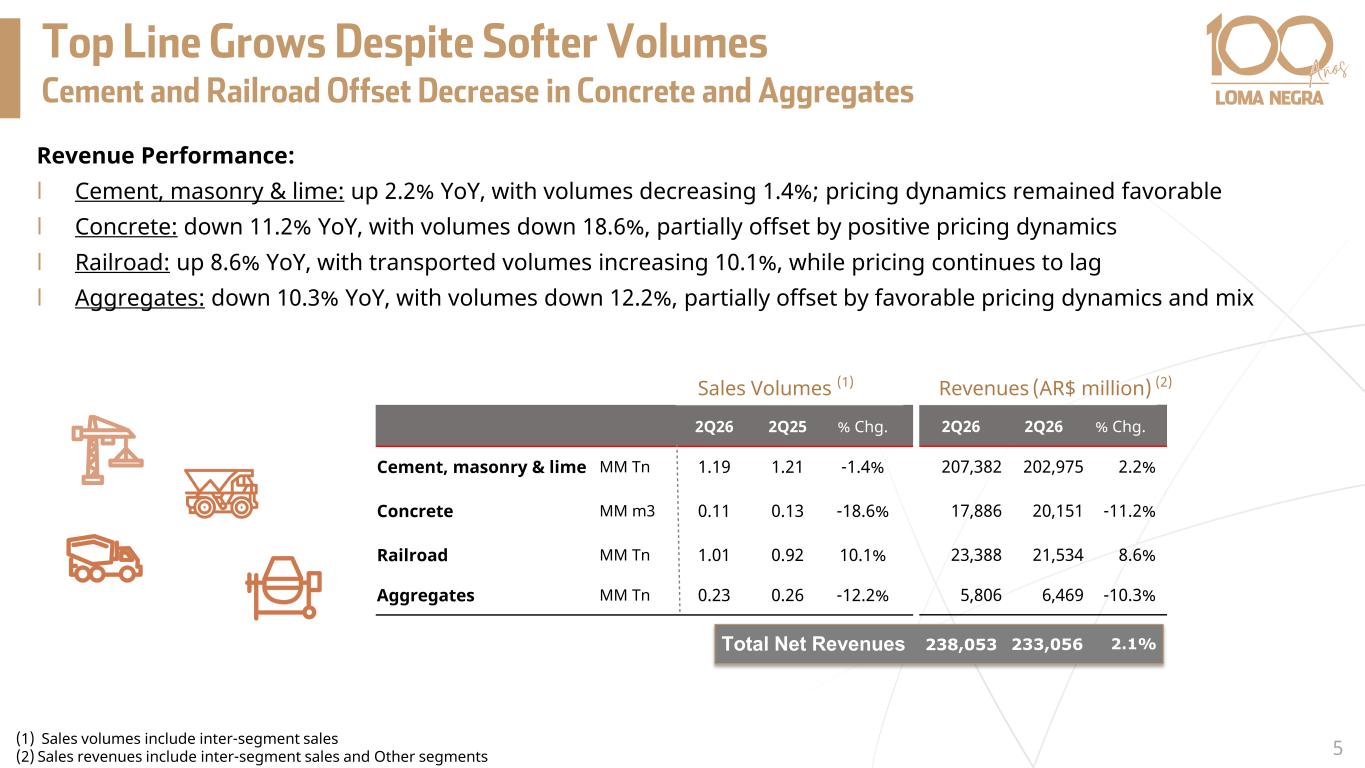
Top Line Grows Despite Softer Volumes Cement and Railroad Offset Decrease in Concrete and Aggregates Revenue Performance: l Cement, masonry & lime: up 2.2% YoY, with volumes decreasing 1.4%; pricing dynamics remained favorable l Concrete: down 11.2% YoY, with volumes down 18.6%, partially offset by positive pricing dynamics l Railroad: up 8.6% YoY, with transported volumes increasing 10.1%, while pricing continues to lag l Aggregates: down 10.3% YoY, with volumes down 12.2%, partially offset by favorable pricing dynamics and mix 2Q26 2Q25 % Chg. Cement, masonry & lime MM Tn 1.19 1.21 -1.4% Concrete MM m3 0.11 0.13 -18.6% Railroad MM Tn 1.01 0.92 10.1% Aggregates MM Tn 0.23 0.26 -12.2% 2Q26 2Q26 % Chg. 207,382 202,975 2.2% 17,886 20,151 -11.2% 23,388 21,534 8.6% 5,806 6,469 -10.3% Sales Volumes (1) Revenues (AR$ million) (2) (1) Sales volumes include inter-segment sales (2) Sales revenues include inter-segment sales and Other segments 5 Total Net Revenues 238,053 233,056 2.1%

Business Performance
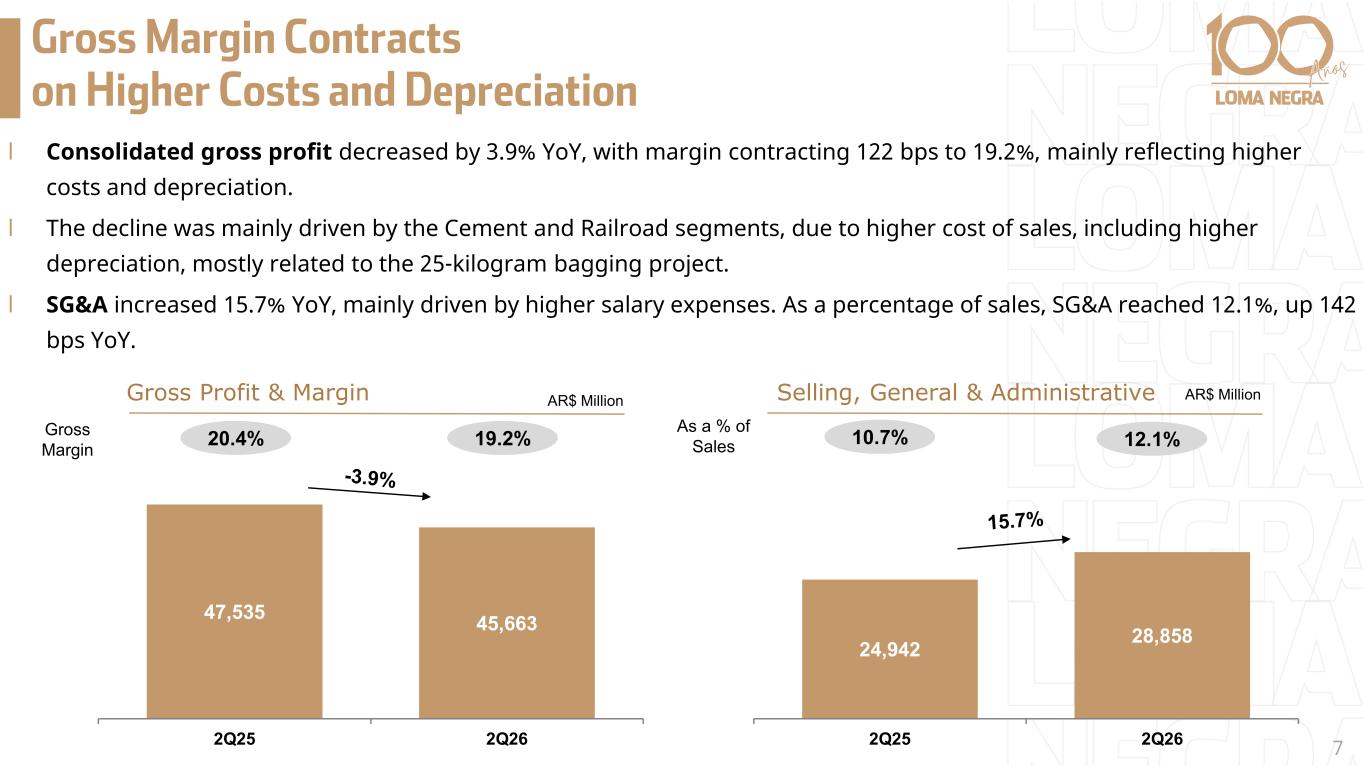
Gross Margin Contracts on Higher Costs and Depreciation l Consolidated gross profit decreased by 3.9% YoY, with margin contracting 122 bps to 19.2%, mainly reflecting higher costs and depreciation. l The decline was mainly driven by the Cement and Railroad segments, due to higher cost of sales, including higher depreciation, mostly related to the 25-kilogram bagging project. l SG&A increased 15.7% YoY, mainly driven by higher salary expenses. As a percentage of sales, SG&A reached 12.1%, up 142 bps YoY. 47,535 45,663 2Q25 2Q26 Gross Profit & Margin 24,942 28,858 2Q25 2Q26 Selling, General & Administrative As a % of Sales AR$ Million AR$ Million Gross Margin 20.4% 10.7% 7 19.2% 12.1%
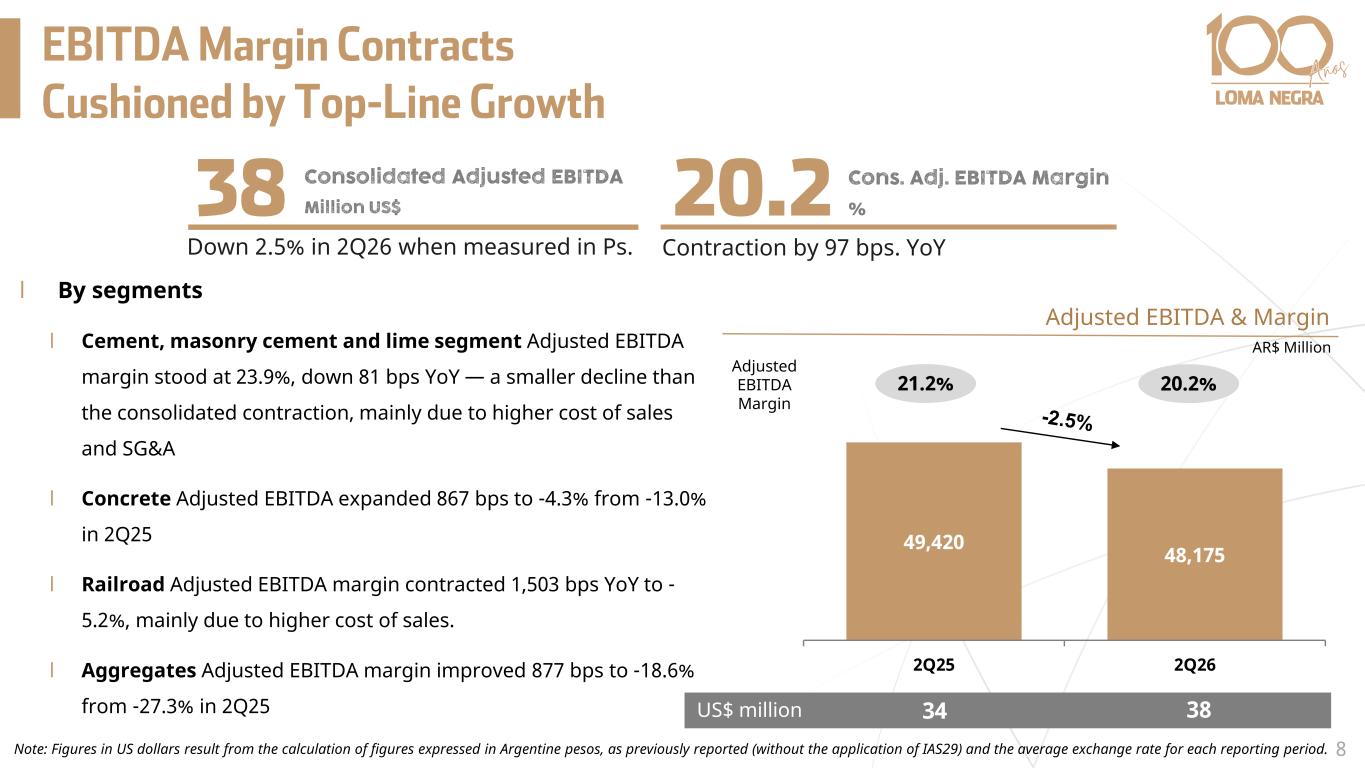
49,420 48,175 2Q25 2Q26 l By segments l Cement, masonry cement and lime segment Adjusted EBITDA margin stood at 23.9%, down 81 bps YoY — a smaller decline than the consolidated contraction, mainly due to higher cost of sales and SG&A l Concrete Adjusted EBITDA expanded 867 bps to -4.3% from -13.0% in 2Q25 l Railroad Adjusted EBITDA margin contracted 1,503 bps YoY to - 5.2%, mainly due to higher cost of sales. l Aggregates Adjusted EBITDA margin improved 877 bps to -18.6% from -27.3% in 2Q25 Adjusted EBITDA & Margin AR$ Million US$ million Adjusted EBITDA Margin 21.2% 34 Note: Figures in US dollars result from the calculation of figures expressed in Argentine pesos, as previously reported (without the application of IAS29) and the average exchange rate for each reporting period. 8 20.2% 38 EBITDA Margin Contracts Cushioned by Top-Line Growth Down 2.5% in 2Q26 when measured in Ps. 38 20.2Consolidated Adjusted EBITDA Million US$ Cons. Adj. EBITDA Margin % Contraction by 97 bps. YoY

Bottom line & Financial performance
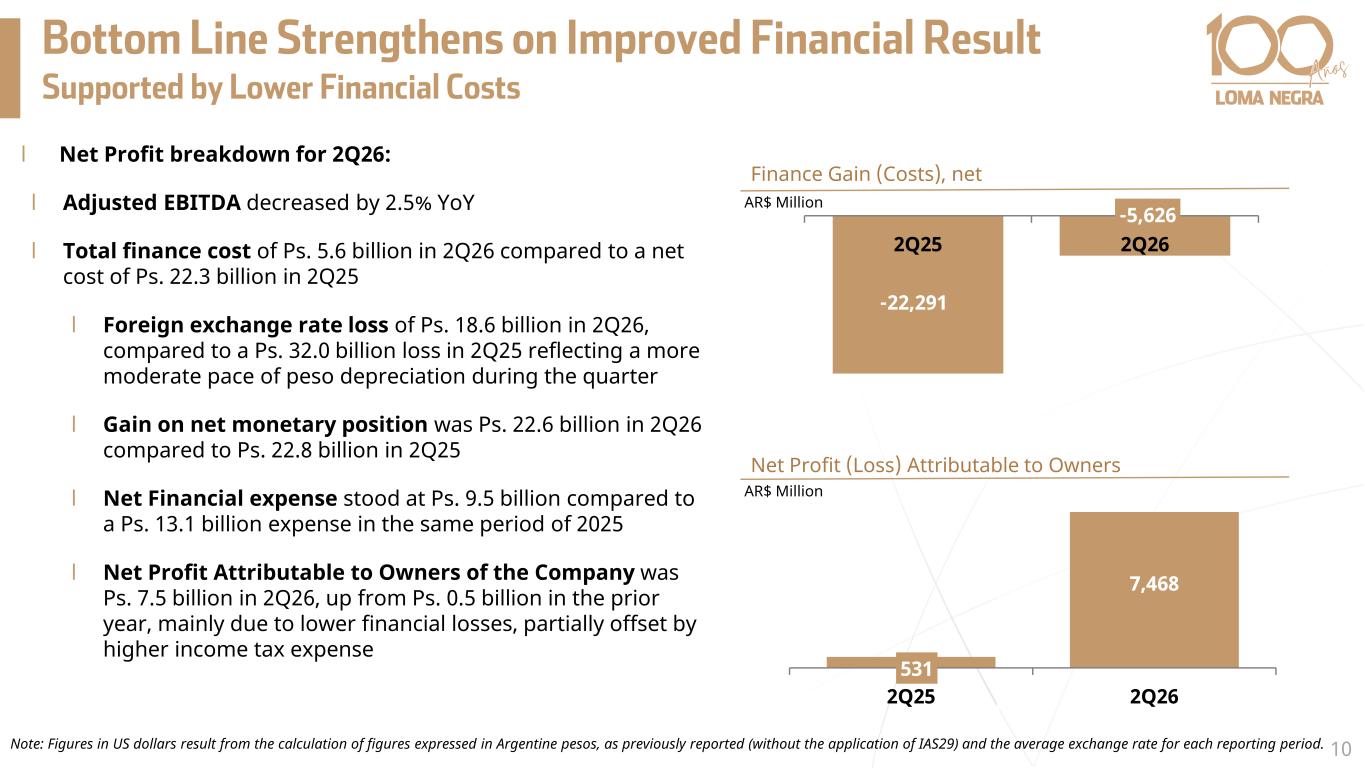
l Net Profit breakdown for 2Q26: l Adjusted EBITDA decreased by 2.5% YoY l Total finance cost of Ps. 5.6 billion in 2Q26 compared to a net cost of Ps. 22.3 billion in 2Q25 l Foreign exchange rate loss of Ps. 18.6 billion in 2Q26, compared to a Ps. 32.0 billion loss in 2Q25 reflecting a more moderate pace of peso depreciation during the quarter l Gain on net monetary position was Ps. 22.6 billion in 2Q26 compared to Ps. 22.8 billion in 2Q25 l Net Financial expense stood at Ps. 9.5 billion compared to a Ps. 13.1 billion expense in the same period of 2025 l Net Profit Attributable to Owners of the Company was Ps. 7.5 billion in 2Q26, up from Ps. 0.5 billion in the prior year, mainly due to lower financial losses, partially offset by higher income tax expense 531 7,468 2Q25 2Q26 Net Profit (Loss) Attributable to Owners AR$ Million -22,291 -5,626 2Q25 2Q26 Finance Gain (Costs), net AR$ Million Note: Figures in US dollars result from the calculation of figures expressed in Argentine pesos, as previously reported (without the application of IAS29) and the average exchange rate for each reporting period. 10 Bottom Line Strengthens on Improved Financial Result Supported by Lower Financial Costs
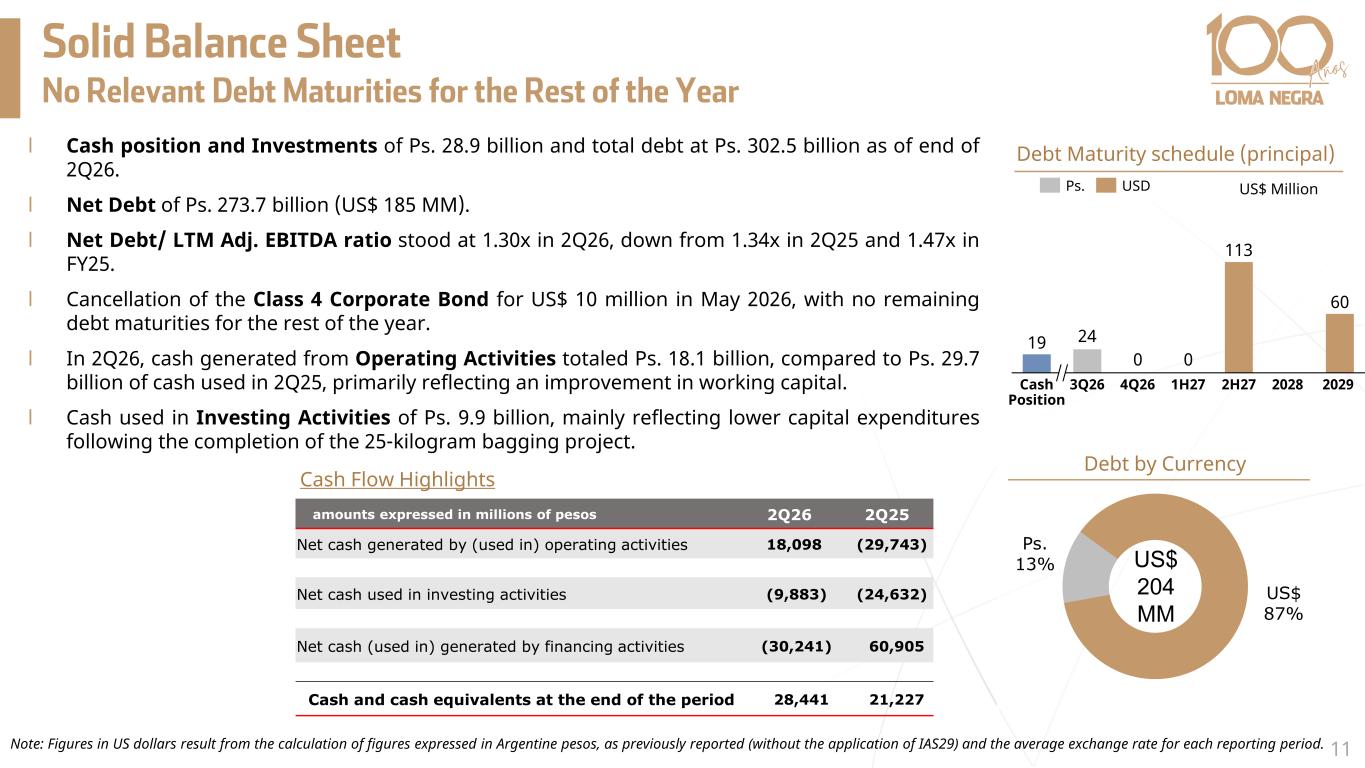
49 Note: Figures in US dollars result from the calculation of figures expressed in Argentine pesos, as previously reported (without the application of IAS29) and the average exchange rate for each reporting period. l Cash position and Investments of Ps. 28.9 billion and total debt at Ps. 302.5 billion as of end of 2Q26. l Net Debt of Ps. 273.7 billion (US$ 185 MM). l Net Debt/ LTM Adj. EBITDA ratio stood at 1.30x in 2Q26, down from 1.34x in 2Q25 and 1.47x in FY25. l Cancellation of the Class 4 Corporate Bond for US$ 10 million in May 2026, with no remaining debt maturities for the rest of the year. l In 2Q26, cash generated from Operating Activities totaled Ps. 18.1 billion, compared to Ps. 29.7 billion of cash used in 2Q25, primarily reflecting an improvement in working capital. l Cash used in Investing Activities of Ps. 9.9 billion, mainly reflecting lower capital expenditures following the completion of the 25-kilogram bagging project. US$ 87% Ps. 13% Debt by Currency Debt Maturity schedule (principal) US$ Million 19 113 60 Cash Position 3Q26 4Q26 1H27 2H27 2028 2029 24 0 0 Ps. USD US$ 204 MM 11 Solid Balance Sheet No Relevant Debt Maturities for the Rest of the Year Cash Flow Highlights amounts expressed in millions of pesos 2Q26 2Q25 Net cash generated by (used in) operating activities 18,098 (29,743) Net cash used in investing activities (9,883) (24,632) Net cash (used in) generated by financing activities (30,241) 60,905 Cash and cash equivalents at the end of the period 28,441 21,227

Outlook
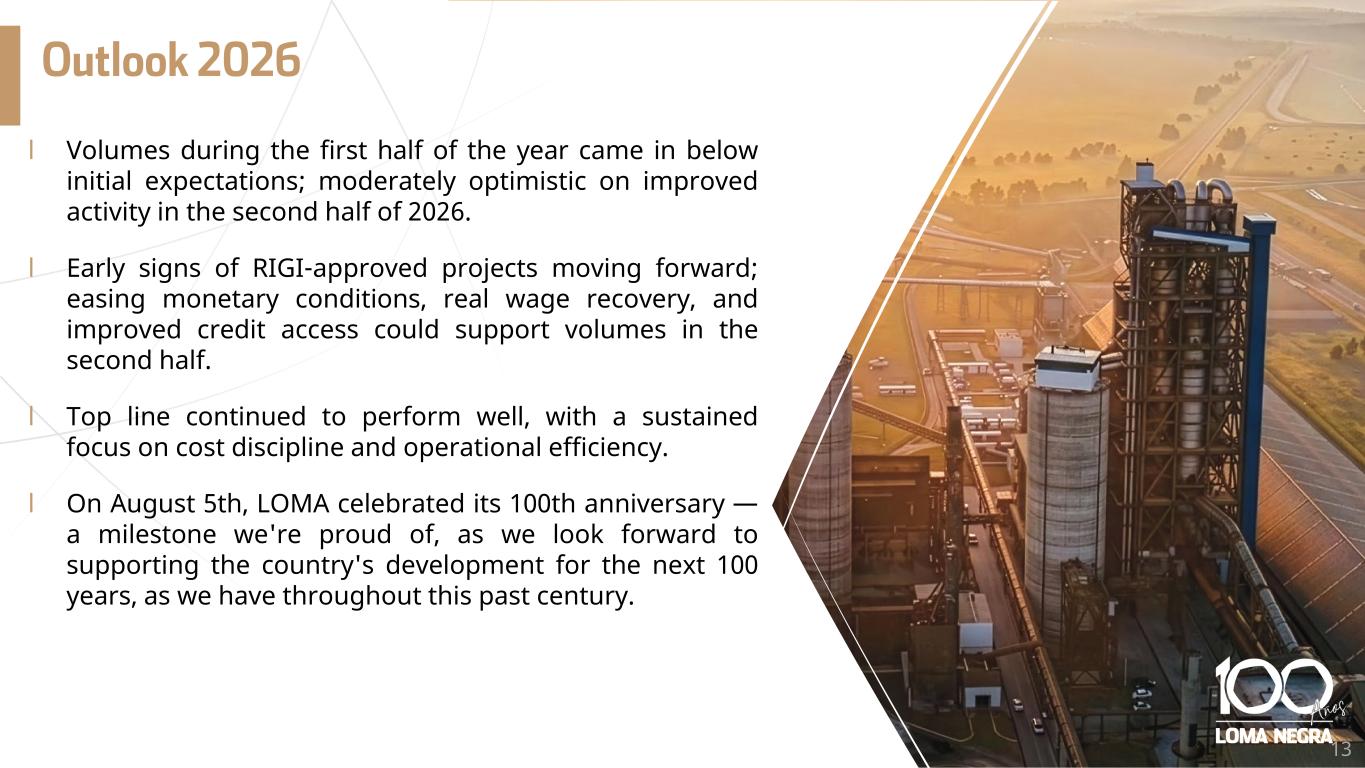
Outlook 2026 l Volumes during the first half of the year came in below initial expectations; moderately optimistic on improved activity in the second half of 2026. l Early signs of RIGI-approved projects moving forward; easing monetary conditions, real wage recovery, and improved credit access could support volumes in the second half. l Top line continued to perform well, with a sustained focus on cost discipline and operational efficiency. l On August 5th, LOMA celebrated its 100th anniversary — a milestone we're proud of, as we look forward to supporting the country's development for the next 100 years, as we have throughout this past century. 13

Financial Tables
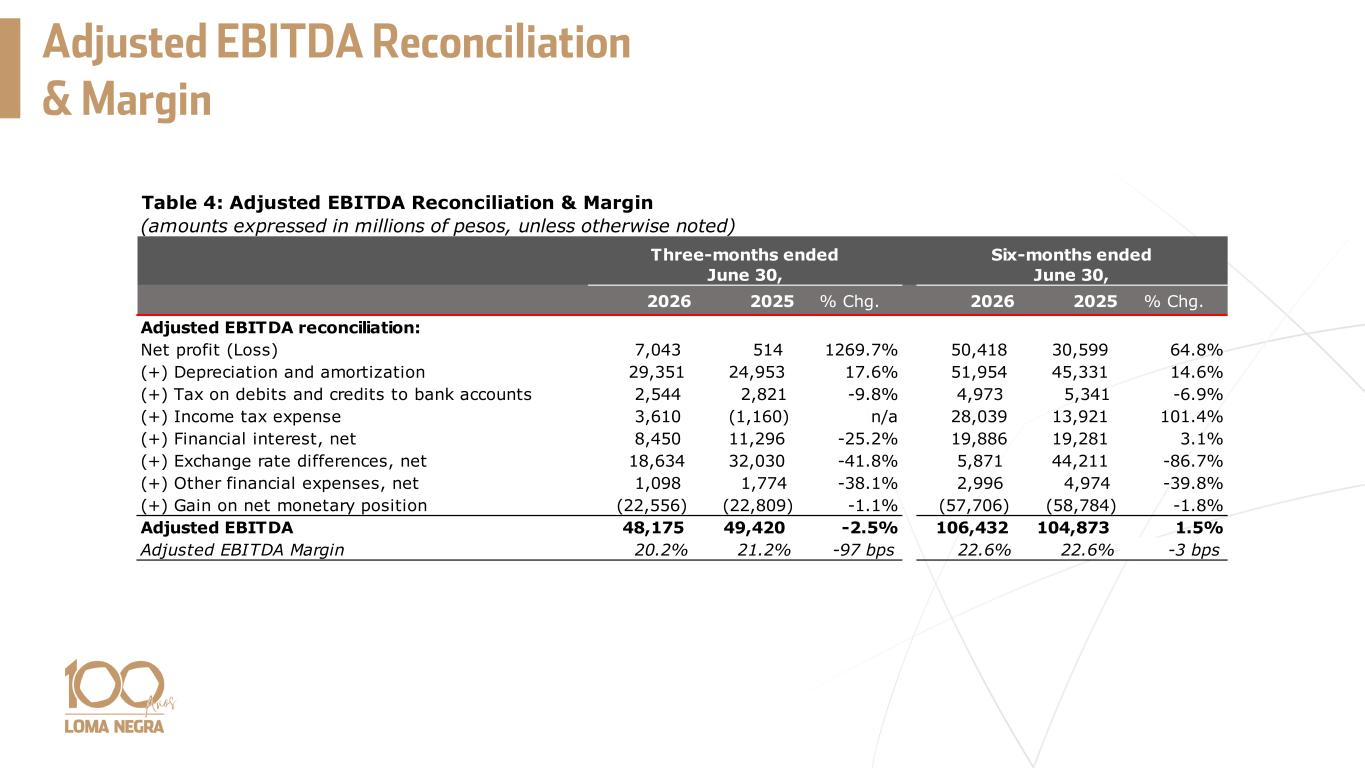
Adjusted EBITDA Reconciliation & Margin Table 4: Adjusted EBITDA Reconciliation & Margin (amounts expressed in millions of pesos, unless otherwise noted) 2026 2025 % Chg. 2026 2025 % Chg. Adjusted EBITDA reconciliation: Net profit (Loss) 7,043 514 1269.7% 50,418 30,599 64.8% (+) Depreciation and amortization 29,351 24,953 17.6% 51,954 45,331 14.6% (+) Tax on debits and credits to bank accounts 2,544 2,821 -9.8% 4,973 5,341 -6.9% (+) Income tax expense 3,610 (1,160) n/a 28,039 13,921 101.4% (+) Financial interest, net 8,450 11,296 -25.2% 19,886 19,281 3.1% (+) Exchange rate differences, net 18,634 32,030 -41.8% 5,871 44,211 -86.7% (+) Other financial expenses, net 1,098 1,774 -38.1% 2,996 4,974 -39.8% (+) Gain on net monetary position (22,556) (22,809) -1.1% (57,706) (58,784) -1.8% Adjusted EBITDA 48,175 49,420 -2.5% 106,432 104,873 1.5% Adjusted EBITDA Margin 20.2% 21.2% -97 bps 22.6% 22.6% -3 bps Three-months ended June 30, Six-months ended June 30,
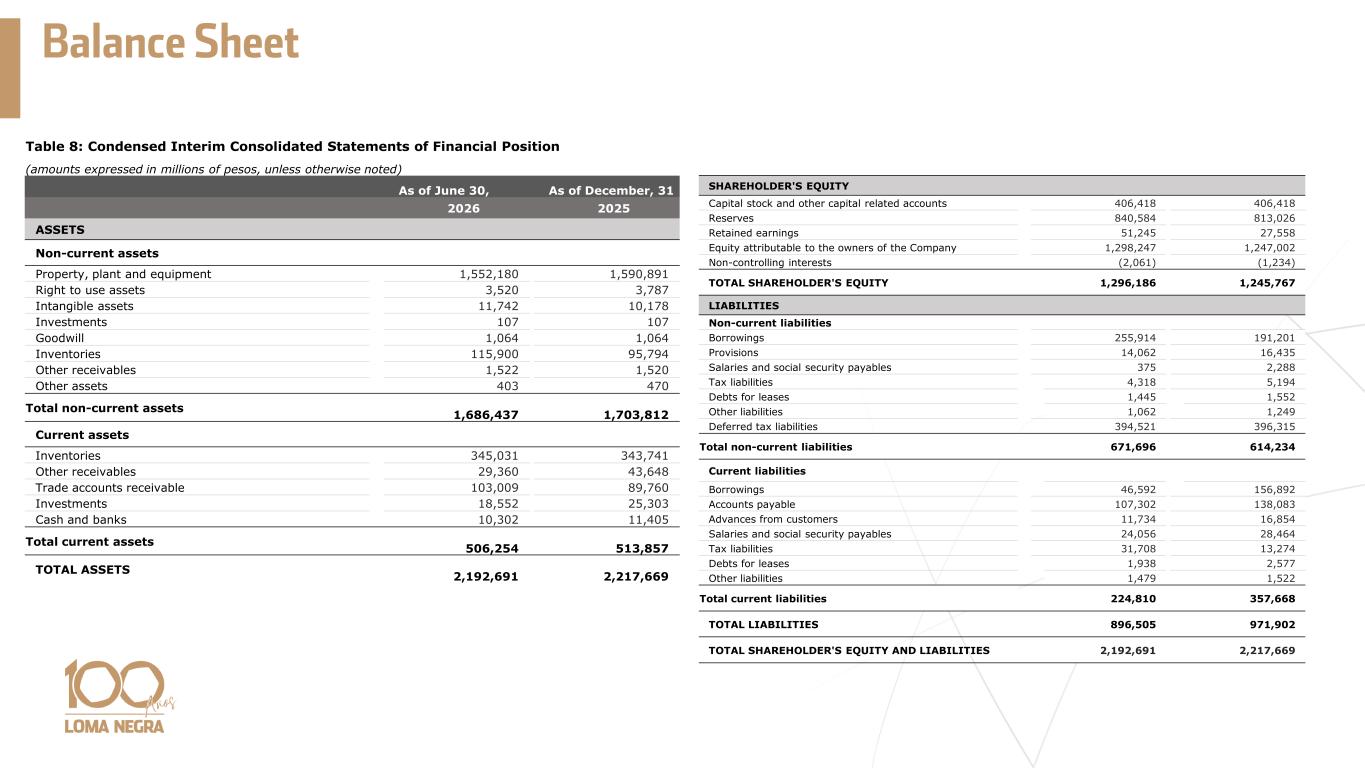
Balance Sheet Table 8: Condensed Interim Consolidated Statements of Financial Position (amounts expressed in millions of pesos, unless otherwise noted) As of June 30, As of December, 31 2026 2025 ASSETS Non-current assets Property, plant and equipment 1,552,180 1,590,891 Right to use assets 3,520 3,787 Intangible assets 11,742 10,178 Investments 107 107 Goodwill 1,064 1,064 Inventories 115,900 95,794 Other receivables 1,522 1,520 Other assets 403 470 Total non-current assets 1,686,437 1,703,812 Current assets Inventories 345,031 343,741 Other receivables 29,360 43,648 Trade accounts receivable 103,009 89,760 Investments 18,552 25,303 Cash and banks 10,302 11,405 Total current assets 506,254 513,857 TOTAL ASSETS 2,192,691 2,217,669 SHAREHOLDER'S EQUITY Capital stock and other capital related accounts 406,418 406,418 Reserves 840,584 813,026 Retained earnings 51,245 27,558 Equity attributable to the owners of the Company 1,298,247 1,247,002 Non-controlling interests (2,061) (1,234) TOTAL SHAREHOLDER'S EQUITY 1,296,186 1,245,767 LIABILITIES Non-current liabilities Borrowings 255,914 191,201 Provisions 14,062 16,435 Salaries and social security payables 375 2,288 Tax liabilities 4,318 5,194 Debts for leases 1,445 1,552 Other liabilities 1,062 1,249 Deferred tax liabilities 394,521 396,315 Total non-current liabilities 671,696 614,234 Current liabilities Borrowings 46,592 156,892 Accounts payable 107,302 138,083 Advances from customers 11,734 16,854 Salaries and social security payables 24,056 28,464 Tax liabilities 31,708 13,274 Debts for leases 1,938 2,577 Other liabilities 1,479 1,522 Total current liabilities 224,810 357,668 TOTAL LIABILITIES 896,505 971,902 TOTAL SHAREHOLDER'S EQUITY AND LIABILITIES 2,192,691 2,217,669
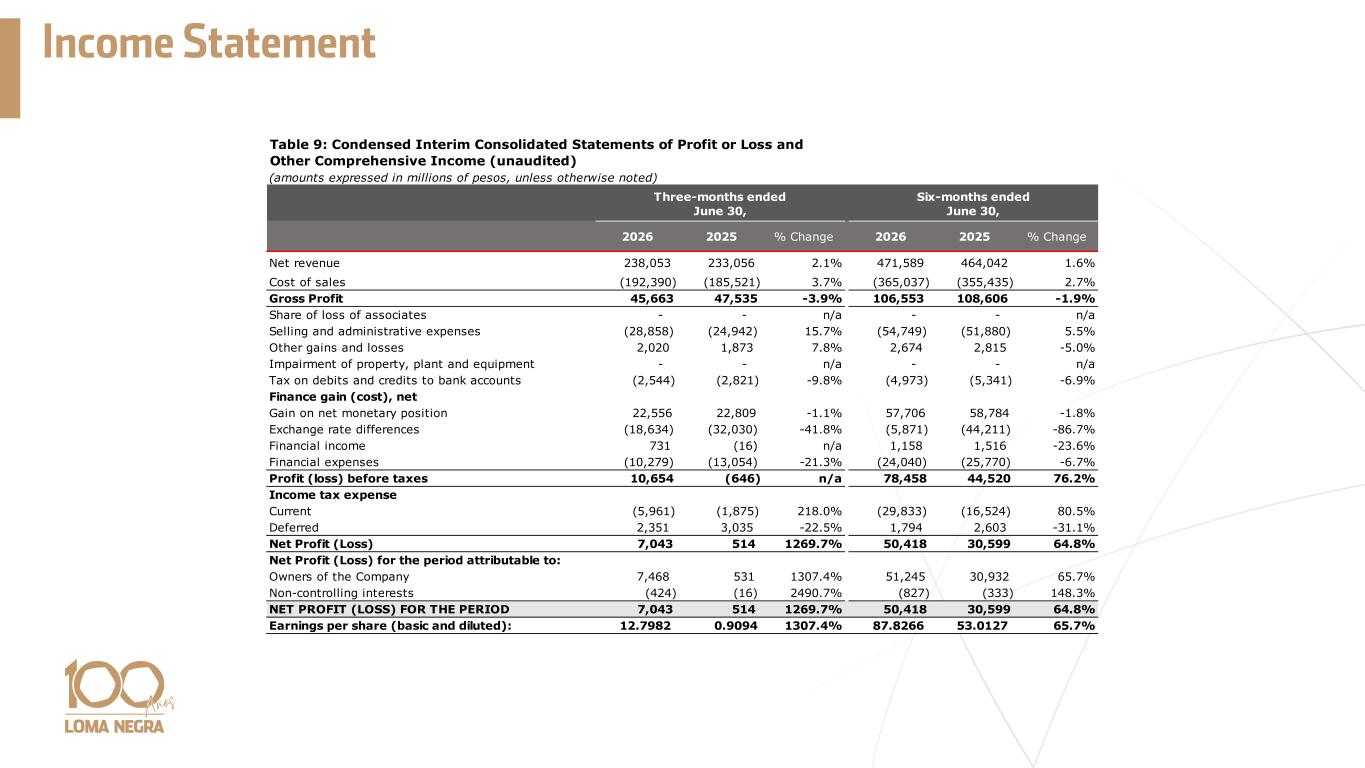
Income Statement (amounts expressed in millions of pesos, unless otherwise noted) 2026 2025 % Change 2026 2025 % Change Net revenue 238,053 233,056 2.1% 471,589 464,042 1.6% Cost of sales (192,390) (185,521) 3.7% (365,037) (355,435) 2.7% Gross Profit 45,663 47,535 -3.9% 106,553 108,606 -1.9% Share of loss of associates - - n/a - - n/a Selling and administrative expenses (28,858) (24,942) 15.7% (54,749) (51,880) 5.5% Other gains and losses 2,020 1,873 7.8% 2,674 2,815 -5.0% Impairment of property, plant and equipment - - n/a - - n/a Tax on debits and credits to bank accounts (2,544) (2,821) -9.8% (4,973) (5,341) -6.9% Finance gain (cost), net Gain on net monetary position 22,556 22,809 -1.1% 57,706 58,784 -1.8% Exchange rate differences (18,634) (32,030) -41.8% (5,871) (44,211) -86.7% Financial income 731 (16) n/a 1,158 1,516 -23.6% Financial expenses (10,279) (13,054) -21.3% (24,040) (25,770) -6.7% Profit (loss) before taxes 10,654 (646) n/a 78,458 44,520 76.2% Income tax expense Current (5,961) (1,875) 218.0% (29,833) (16,524) 80.5% Deferred 2,351 3,035 -22.5% 1,794 2,603 -31.1% Net Profit (Loss) 7,043 514 1269.7% 50,418 30,599 64.8% Net Profit (Loss) for the period attributable to: Owners of the Company 7,468 531 1307.4% 51,245 30,932 65.7% Non-controlling interests (424) (16) 2490.7% (827) (333) 148.3% NET PROFIT (LOSS) FOR THE PERIOD 7,043 514 1269.7% 50,418 30,599 64.8% Earnings per share (basic and diluted): 12.7982 0.9094 1307.4% 87.8266 53.0127 65.7% Table 9: Condensed Interim Consolidated Statements of Profit or Loss and Other Comprehensive Income (unaudited) Three-months ended June 30, Six-months ended June 30,
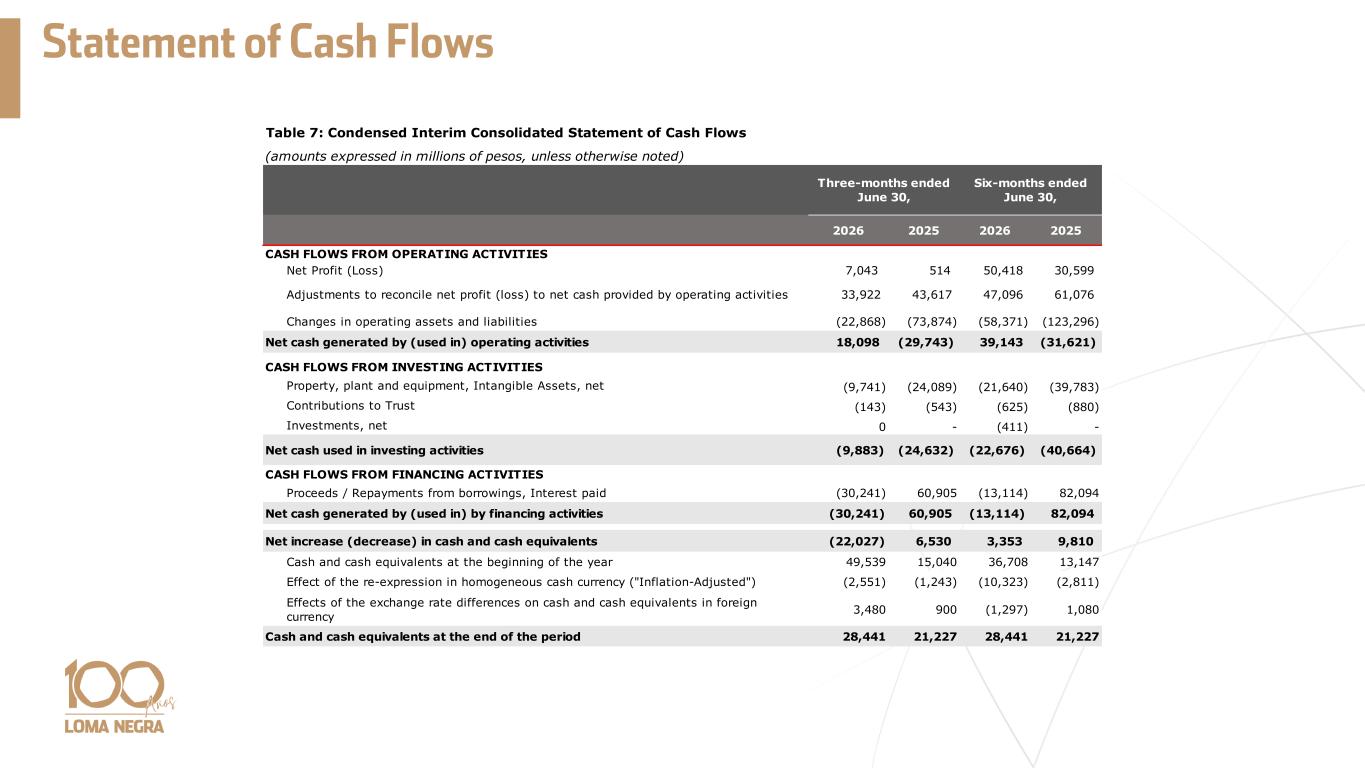
Statement of Cash Flows Table 7: Condensed Interim Consolidated Statement of Cash Flows (amounts expressed in millions of pesos, unless otherwise noted) 2026 2025 2026 2025 CASH FLOWS FROM OPERATING ACTIVITIES Net Profit (Loss) 7,043 514 50,418 30,599 Adjustments to reconcile net profit (loss) to net cash provided by operating activities 33,922 43,617 47,096 61,076 Changes in operating assets and liabilities (22,868) (73,874) (58,371) (123,296) Net cash generated by (used in) operating activities 18,098 (29,743) 39,143 (31,621) CASH FLOWS FROM INVESTING ACTIVITIES Property, plant and equipment, Intangible Assets, net (9,741) (24,089) (21,640) (39,783) Contributions to Trust (143) (543) (625) (880) Investments, net 0 - (411) - Net cash used in investing activities (9,883) (24,632) (22,676) (40,664) CASH FLOWS FROM FINANCING ACTIVITIES Proceeds / Repayments from borrowings, Interest paid (30,241) 60,905 (13,114) 82,094 Net cash generated by (used in) by financing activities (30,241) 60,905 (13,114) 82,094 Net increase (decrease) in cash and cash equivalents (22,027) 6,530 3,353 9,810 Cash and cash equivalents at the beginning of the year 49,539 15,040 36,708 13,147 Effect of the re-expression in homogeneous cash currency ("Inflation-Adjusted") (2,551) (1,243) (10,323) (2,811) Effects of the exchange rate differences on cash and cash equivalents in foreign currency 3,480 900 (1,297) 1,080 Cash and cash equivalents at the end of the period 28,441 21,227 28,441 21,227 Six-months ended June 30, Three-months ended June 30,

IR Contact Thank you! Marcos I. Gradin Chief Financial Officer and Investor Relations Diego M. Jalón Head of Investor Relations investorrelations@lomanegra.com