PAY VERSUS PERFORMANCE
The following table shows (i) the total compensation for our principal executive officer (PEO), and on an average basis, our other named executive officers (NEOs) as set forth in the summary compensation tables set forth in the Company’s proxy statements for 2025, 2024 and 2023 (“SCT”), (ii) the “compensation actually paid” to our PEO and, on an average basis, our other named executive officers (in each case, as determined under applicable SEC rules), (iii) our total shareholder return and (iv) our net loss. No dividends were paid or accrued on share awards for the years presented.
| Year | Summary | Compensation | Average | Average | Value of | Net Loss | |||||||
| 2025 | 890,653 | 600,167 | 464,411 | 424,638 | 4.09 | (7,978,000 | ) | ||||||
| 2024 | 976,339 | 823,533 | 352,307 | 322,161 | 18.79 | (13,197,000 | ) | ||||||
| 2023 | 801,621 | 575,598 | 412,017 | 400,427 | 34.60 | (5,123,341 | ) | ||||||
(1) Cary Claiborne was our PEO for each year presented. The non-PEO NEOs for the 2025 period were Vinay Shah, the Company’s Chief Financial Officer and Tony Goodman, the Company’s Chief Operating Officer. The non-PEO NEOs for the 2024 period were Joseph A. M. Truluck, the Company’s Former Chief Financial Officer and Tony Goodman, the Company’s Chief Operating Officer. The non-PEO NEO for the 2023 period were Joseph A. M. Truluck, the Company’s former Chief Financial Officer and Bankole A. Johnson, the Company’s former Chief Medical Officer. Refer to “Executive Compensation — Summary Compensation Table.”
(2) The amounts shown for Compensation Actually Paid have been calculated in accordance with Item 402(v) of Regulation S-K and do not reflect compensation actually earned, realized, or received by our named executive officers. These amounts reflect the Summary Compensation Table Total with certain adjustments as described in footnote 3 below.
(3) Compensation Actually Paid reflects the exclusions and inclusions of certain amounts for the PEO and the Non-PEO NEOs as set forth below. Amounts in the Exclusion of Option Awards column are the totals from the Option Awards column set forth in the Summary Compensation Table, with equity values calculated in accordance with FASB ASC Topic 718.
| Year | Summary | Exclusion of | Inclusion of | Compensation | ||||||||
| 2025 | PEO | 890,653 | (80,538 | ) | (209,948 | ) | 600,167 | |||||
| Other NEOs Average | 464,411 | (30,056 | ) | (9,717 | ) | 424,638 | ||||||
The amounts in the Inclusion of Equity Values in the table above are derived from the amounts set forth in the following table, with fair values calculated in accordance with FASB ASC Topic 718:
| Year | Year-End | Change in | Vesting-Date | Change in | Fair Value at | Total – Inclusion | |||||||||||
| 2025 | PEO | 17,073 | (178,508 | ) | 10,708 | (59,221 | ) | 0 | (209,948 | ) | |||||||
| Other NEOS Average | 6,371 | (14,572 | ) | 3,996 | (5,512 | ) | 0 | (9,717 | ) | ||||||||
____________
(1) TSR is determined based on the value of an initial fixed investment of $100 in Adial’s Common Stock at December 31, 2022.
Description of Relationship Between PEO and Non-PEO NEO Compensation Actually Paid and Our Total Shareholder Return (“TSR”)
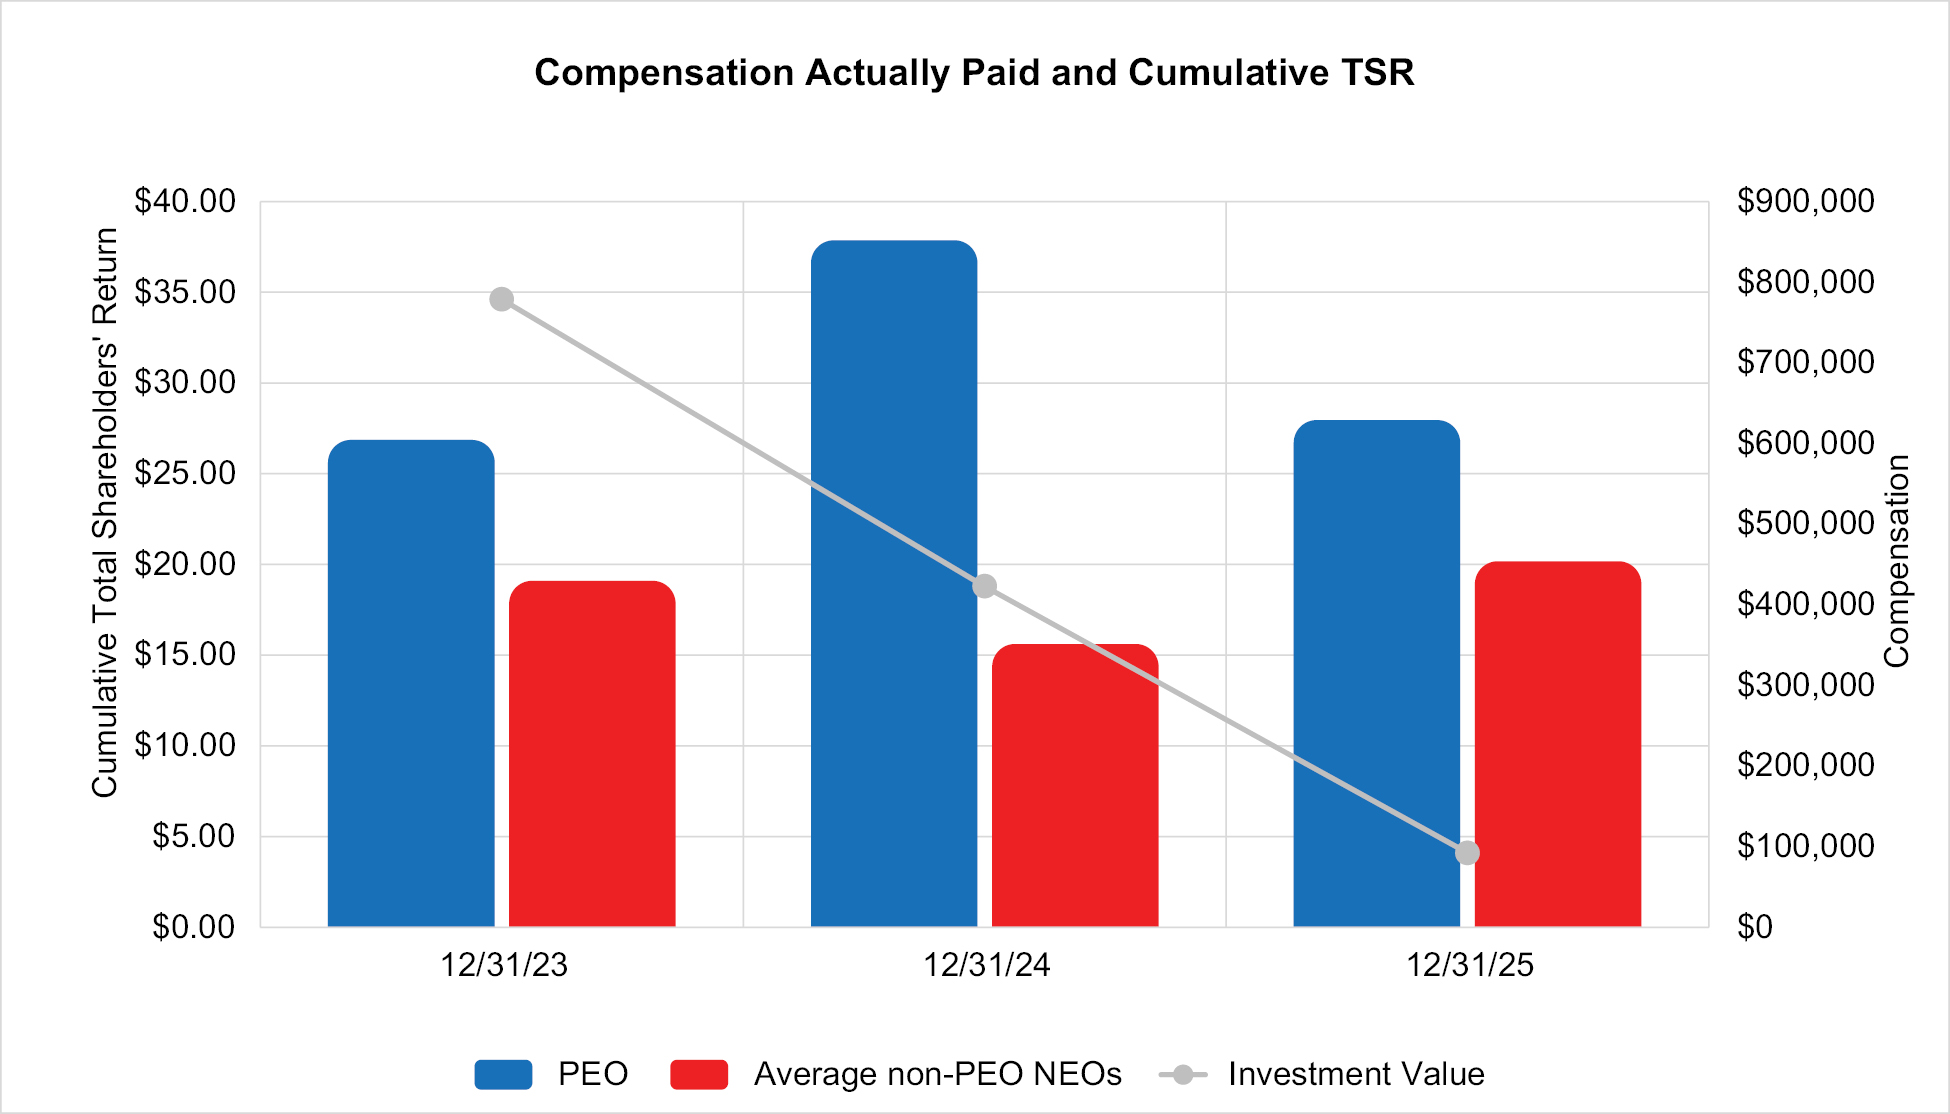
The following chart sets forth the relationship between Compensation Actually Paid to our PEO, the average of Compensation Actually Paid to our Non-PEO NEOs, and our cumulative TSR over the three most recently completed fiscal years.
Description of Relationship Between PEO and Non-PEO NEO Compensation Actually Paid and Net Loss
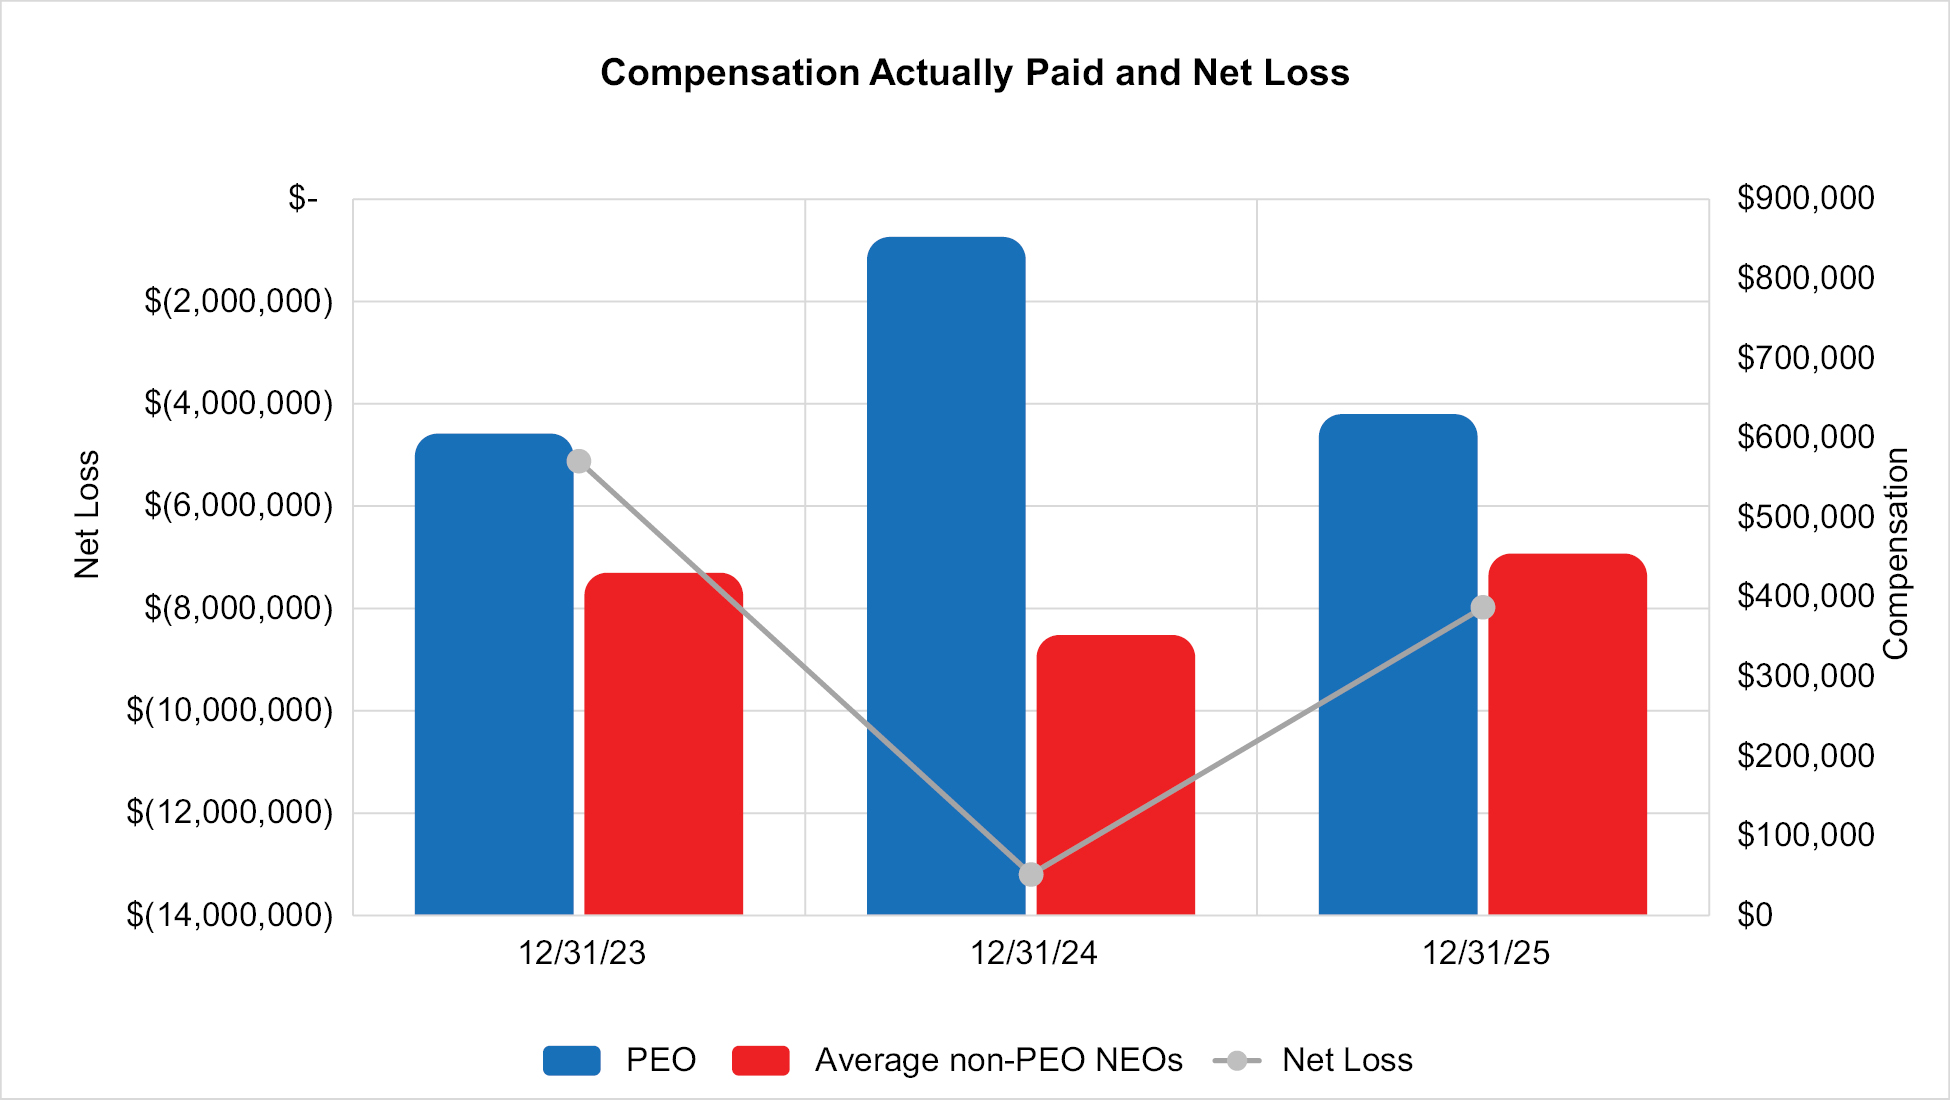
The following chart sets forth the relationship between Compensation Actually Paid to our PEO, the average of Compensation Actually Paid to our Non-PEO NEOs, and our Net Loss during the three most recently completed fiscal years.
| [1] | Cary Claiborne was our PEO for each year presented. The non-PEO NEOs for the 2025 period were Vinay Shah, the Company’s Chief Financial Officer and Tony Goodman, the Company’s Chief Operating Officer. The non-PEO NEOs for the 2024 period were Joseph A. M. Truluck, the Company’s Former Chief Financial Officer and Tony Goodman, the Company’s Chief Operating Officer. The non-PEO NEO for the 2023 period were Joseph A. M. Truluck, the Company’s former Chief Financial Officer and Bankole A. Johnson, the Company’s former Chief Medical Officer. Refer to “Executive Compensation — Summary Compensation Table.” |
| [2] | The amounts shown for Compensation Actually Paid have been calculated in accordance with Item 402(v) of Regulation S-K and do not reflect compensation actually earned, realized, or received by our named executive officers. These amounts reflect the Summary Compensation Table Total with certain adjustments as described in footnote 3 below. |
| [3] | Compensation Actually Paid reflects the exclusions and inclusions of certain amounts for the PEO and the Non-PEO NEOs as set forth below. Amounts in the Exclusion of Option Awards column are the totals from the Option Awards column set forth in the Summary Compensation Table, with equity values calculated in accordance with FASB ASC Topic 718. |