
Third Quarter 2026 Results August 11th, 2026
Non-GAAP Financial Measures Vestis reports its financial results in accordance with U.S. GAAP, but in this presentation and the non-GAAP reconciliations that follow, Vestis also uses the following non-GAAP measures: Adjusted EBITDA, Adjusted EBITDA Margin, Adjusted Net Income (Loss), Adjusted Basic Earnings Per Share (“EPS”), Adjusted Diluted EPS, Free Cash Flow, Adjusted Free Cash Flow, Operating Working Capital, Net Debt, Net Leverage Ratio, Covenant Adjusted EBITDA, Covenant Adjusted EBITDA Margin, Trailing Twelve Months Covenant Adjusted EBITDA, Return on Working Capital, Adjusted Operating Expenses, Cost Per Pound, Operating Leverage and Investments in Capital Assets. Vestis believes that non-GAAP financial measures, when considered together with the corresponding U.S. GAAP financial measure, provide useful supplemental information to investors. Certain adjustment-based measures exclude items that management believes may not be indicative of or are unrelated to Vestis’ core operating results. Vestis uses these non-GAAP financial measures with U.S. GAAP financial measures and other operating data to assist in the evaluation of its operating performance. Vestis believes that presentation of these measures also helps investors because the measures enable better comparisons of Vestis’ historical results and allow investors to evaluate Vestis’ performance based on the same metrics that Vestis uses to evaluate its performance and trends in its results. However, these measures have limitations as analytical tools and should not be considered in isolation or as a substitute for Vestis’ results as reported under U.S. GAAP. Specifically, you should not consider these measures as alternatives to revenue, operating income, operating expenses, operating income margin, net income (loss), net income margin or net cash provided by operating activities determined in accordance with U.S. GAAP. These non-GAAP financial measures also should not be considered as measures of cash available to Vestis to invest in the growth of Vestis’ business or cash that will be available to Vestis to meet its obligations. Non-GAAP financial measures as presented by Vestis may not be comparable to other similarly titled measures of other companies because not all companies use identical calculations. Reconciliations of non-GAAP financial measures to the most directly comparable U.S.GAAP measures are provided in the tables at the end of this presentation. Forward-Looking Statements This presentation contains “forward-looking statements” within the meaning of the securities laws. All statements that reflect our expectations, assumptions or projections about the future, other than statements of historical fact, are forward-looking statements, including, without limitation, forecasts relating to discussions of future operations and financial performance and statements regarding our strategy for growth, future product development, regulatory approvals, competitive position and expenditures. In some cases, forward-looking statements can be identified by words such as “potential,” “outlook,” “guidance,” “anticipate,” “continue,” “estimate,” “expect,” “will,” and “believe,” and other words and terms of similar meaning or the negative versions of such words. Examples of forward-looking statements in this release include, but are not limited to, statements regarding: the potential effects of our comprehensive actions to enhance both our commercial and operational processes, and our expectations regarding our updated fiscal year 2026 performance outlook. These forward-looking statements are subject to risks and uncertainties that may change at any time, and actual results or outcomes may differ materially from those that we expected. Forward-looking statements are not guarantees of future performance and are subject to risks, uncertainties, and changes in circumstances that are difficult to predict including, but not limited to: unfavorable macroeconomic conditions and geopolitical instability, including as a result of the military conflict among the United States, Israel, and Iran, government shutdowns, inflationary pressures and higher interest rates; the failure to retain current customers, renew existing customer contracts and obtain new customer contracts, which could result in continued stock volatility and potential future goodwill impairment charges; competition in our industry; our ability to comply with certain financial ratios, tests and covenants in our credit agreement, including the Net Leverage Ratio; our significant indebtedness and ability to meet debt obligations and our reliance on an accounts receivable securitization facility; our ability to successfully execute or achieve the expected benefits of our business transformation and restructuring plan and other measures we may take in the future; increases in fuel and energy costs and other supply chain challenges and disruptions, including as a result of disruptions in international shipping through the Strait of Hormuz and the military conflicts in the Middle East and Ukraine; implementation of new or increased tariffs and ongoing changes in U.S. and foreign government trade policies, including potential modifications to existing trade agreements and retaliatory measures by foreign governments; increased operating costs and obstacles to cost recovery due to the pricing and cancellation terms of our support services contracts; a determination by our customers to reduce their outsourcing or use of preferred vendors; the outcome of legal proceedings to which we are or may become subject, including securities litigation claims that could result in significant legal expenses and settlement and damage awards; risks associated with suppliers from whom our products are sourced; challenge of contracts by our customers; currency risks and other risks associated with international operations, including compliance with a broad range of laws and regulations, including the United States Foreign Corrupt Practices Act; increases in labor costs or inability to hire and retain key or sufficient qualified personnel; continued or further unionization of our workforce; our expansion strategy and our ability to successfully integrate the businesses we acquire and costs and timing related thereto; natural disasters, global calamities, climate change, civil or political unrest, terrorist attacks, pandemics or other public health crises, and other adverse incidents; liability resulting from our participation in multiemployer-defined benefit pension plans; liability associated with noncompliance with applicable law or other governmental regulations; laws and governmental regulations including those relating to the environment, wage and hour and government contracting; unanticipated changes in tax law; new interpretations of or changes in the enforcement of the government regulatory framework; a cybersecurity incident or other disruptions in the availability of our computer systems or privacy breaches; stakeholder expectations relating to environmental, social and governance (“ESG”) considerations which may expose us to liabilities and other adverse effects on our business; any failure by Aramark to perform its obligations under the various separation agreements entered into in connection with the separation; and a determination by the IRS that the distribution or certain related transactions are taxable. The above list of factors is not exhaustive or necessarily in order of importance. For additional information on identifying factors that may cause actual results to vary materially from those stated in forward-looking statements, see the Company’s filings with the Securities and Exchange Commission (“SEC”), including “Item 1A-Risk Factors” in the Company’s most recent Annual Report on Form 10-K and in “Item 1A-Risk Factors” of Part II in subsequently-filed Quarterly Reports on Form 10-Q, which are available on the SEC’s website at www.sec.gov. Any forward-looking statement speaks only as of the date on which it is made, and we assume no obligation to update or revise such statement, whether as a result of new information, future events or otherwise, except as required by applicable law. This presentation and the remarks made during the associated conference call are integrally related and are intended to be presented and understood together. Notes to Investors ©2025 Vestis. All rights reserved. 2
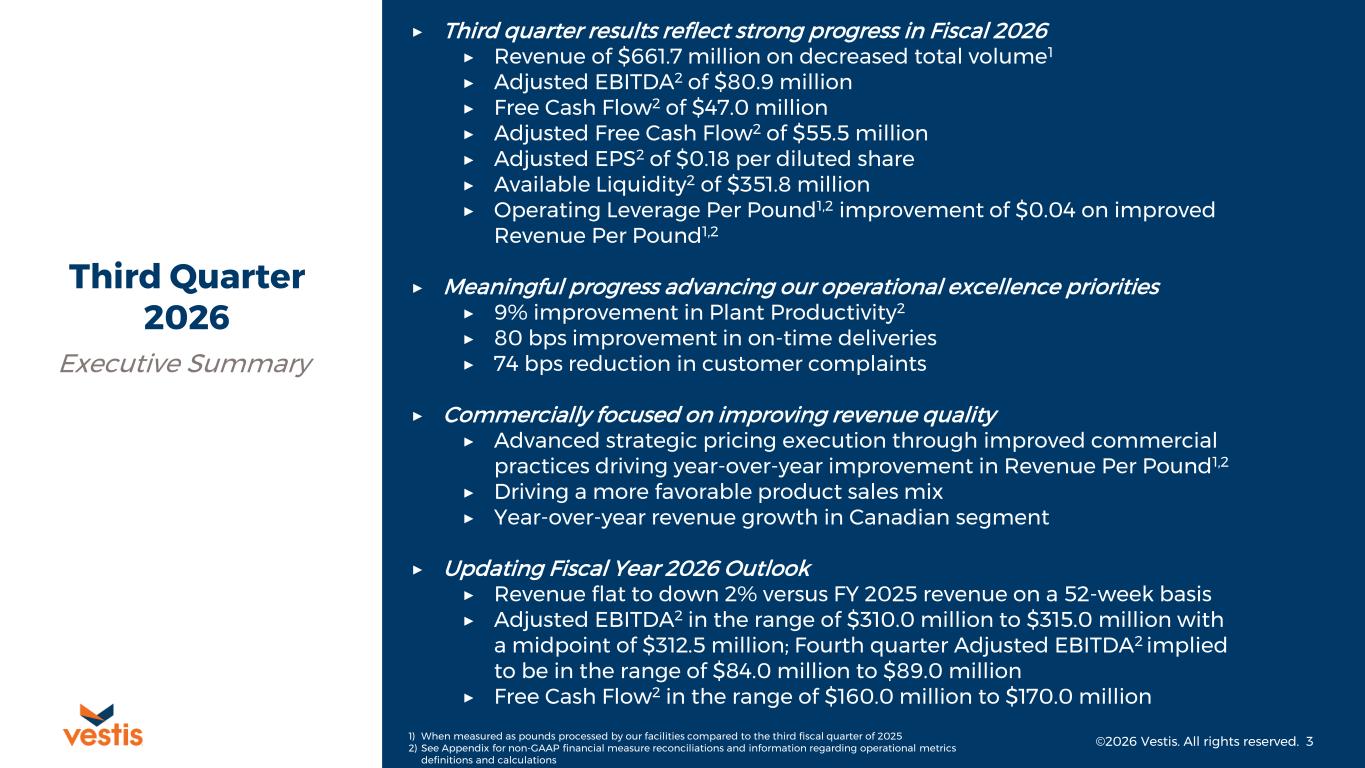
Third Quarter 2026 Executive Summary ©2026 Vestis. All rights reserved. 3 ▶ Third quarter results reflect strong progress in Fiscal 2026 ▶ Revenue of $661.7 million on decreased total volume1 ▶ Adjusted EBITDA2 of $80.9 million ▶ Free Cash Flow2 of $47.0 million ▶ Adjusted Free Cash Flow2 of $55.5 million ▶ Adjusted EPS2 of $0.18 per diluted share ▶ Available Liquidity2 of $351.8 million ▶ Operating Leverage Per Pound1,2 improvement of $0.04 on improved Revenue Per Pound1,2 ▶ Meaningful progress advancing our operational excellence priorities ▶ 9% improvement in Plant Productivity2 ▶ 80 bps improvement in on-time deliveries ▶ 74 bps reduction in customer complaints ▶ Commercially focused on improving revenue quality ▶ Advanced strategic pricing execution through improved commercial practices driving year-over-year improvement in Revenue Per Pound1,2 ▶ Driving a more favorable product sales mix ▶ Year-over-year revenue growth in Canadian segment ▶ Updating Fiscal Year 2026 Outlook ▶ Revenue flat to down 2% versus FY 2025 revenue on a 52-week basis ▶ Adjusted EBITDA2 in the range of $310.0 million to $315.0 million with a midpoint of $312.5 million; Fourth quarter Adjusted EBITDA2 implied to be in the range of $84.0 million to $89.0 million ▶ Free Cash Flow2 in the range of $160.0 million to $170.0 million 1) When measured as pounds processed by our facilities compared to the third fiscal quarter of 2025 2) See Appendix for non-GAAP financial measure reconciliations and information regarding operational metrics definitions and calculations
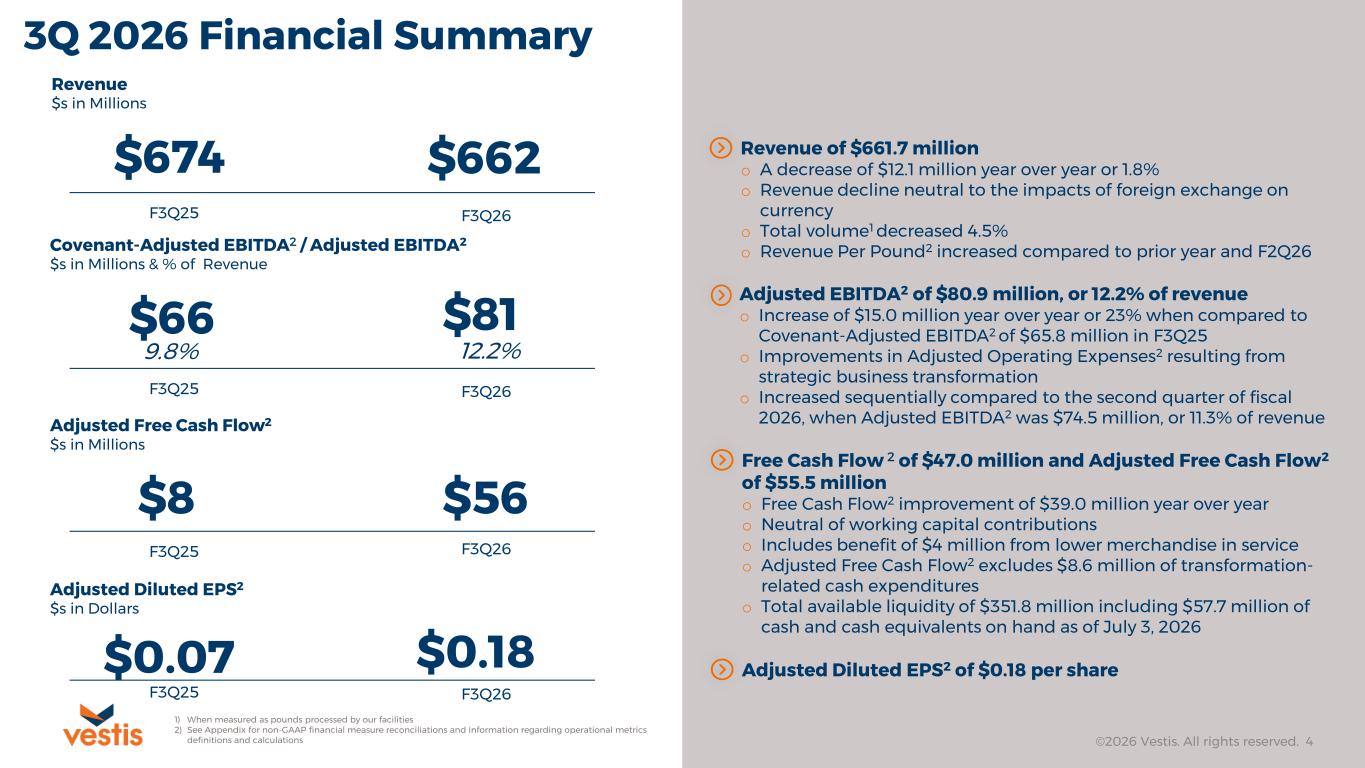
3Q 2026 Financial Summary ©2026 Vestis. All rights reserved. 4 Revenue $s in Millions Covenant-Adjusted EBITDA2 / Adjusted EBITDA2 $s in Millions & % of Revenue 1) When measured as pounds processed by our facilities 2) See Appendix for non-GAAP financial measure reconciliations and information regarding operational metrics definitions and calculations Adjusted Free Cash Flow2 $s in Millions Revenue of $661.7 million o A decrease of $12.1 million year over year or 1.8% o Revenue decline neutral to the impacts of foreign exchange on currency o Total volume1 decreased 4.5% o Revenue Per Pound2 increased compared to prior year and F2Q26 Adjusted EBITDA2 of $80.9 million, or 12.2% of revenue o Increase of $15.0 million year over year or 23% when compared to Covenant-Adjusted EBITDA2 of $65.8 million in F3Q25 o Improvements in Adjusted Operating Expenses2 resulting from strategic business transformation o Increased sequentially compared to the second quarter of fiscal 2026, when Adjusted EBITDA2 was $74.5 million, or 11.3% of revenue Free Cash Flow 2 of $47.0 million and Adjusted Free Cash Flow2 of $55.5 million o Free Cash Flow2 improvement of $39.0 million year over year o Neutral of working capital contributions o Includes benefit of $4 million from lower merchandise in service o Adjusted Free Cash Flow2 excludes $8.6 million of transformation- related cash expenditures o Total available liquidity of $351.8 million including $57.7 million of cash and cash equivalents on hand as of July 3, 2026 Adjusted Diluted EPS2 of $0.18 per share Adjusted Diluted EPS2 $s in Dollars F3Q25 F3Q26 F3Q25 F3Q26 F3Q25 F3Q26 F3Q25 F3Q26 $674 $662 $66 $81 9.8% 12.2% $8 $56 $0.07 $0.18
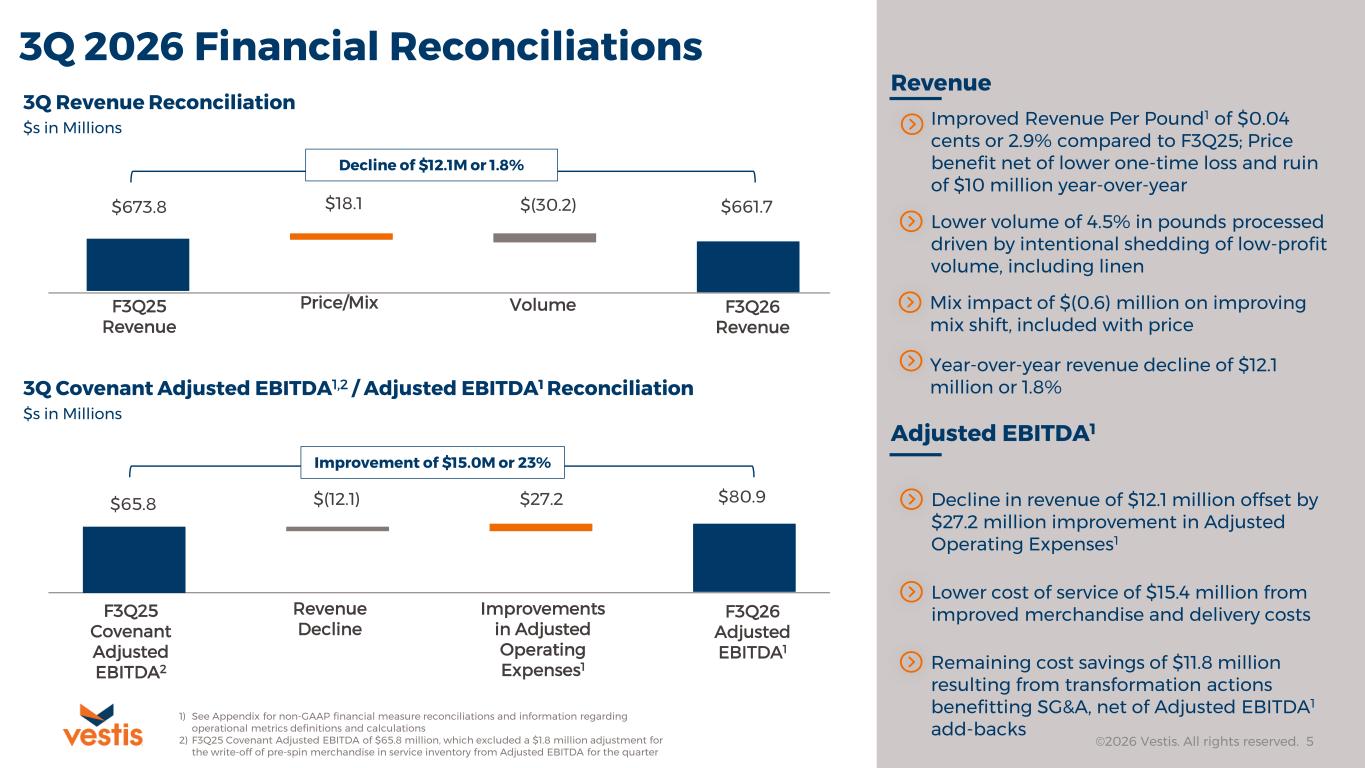
3Q 2026 Financial Reconciliations Lower volume of 4.5% in pounds processed driven by intentional shedding of low-profit volume, including linen 3Q Revenue Reconciliation $s in Millions 3Q Covenant Adjusted EBITDA1,2 / Adjusted EBITDA1 Reconciliation $s in Millions Improved Revenue Per Pound1 of $0.04 cents or 2.9% compared to F3Q25; Price benefit net of lower one-time loss and ruin of $10 million year-over-year Year-over-year revenue decline of $12.1 million or 1.8% Decline in revenue of $12.1 million offset by $27.2 million improvement in Adjusted Operating Expenses1 Lower cost of service of $15.4 million from improved merchandise and delivery costs Adjusted EBITDA1 Revenue 1) See Appendix for non-GAAP financial measure reconciliations and information regarding operational metrics definitions and calculations 2) F3Q25 Covenant Adjusted EBITDA of $65.8 million, which excluded a $1.8 million adjustment for the write-off of pre-spin merchandise in service inventory from Adjusted EBITDA for the quarter ©2026 Vestis. All rights reserved. 5 $661.7$673.8 $18.1 F3Q25 Covenant Adjusted EBITDA2 Revenue Decline Improvements in Adjusted Operating Expenses1 $80.9$65.8 $(12.1) $27.2 F3Q26 Adjusted EBITDA1 Decline of $12.1M or 1.8% Improvement of $15.0M or 23% Remaining cost savings of $11.8 million resulting from transformation actions benefitting SG&A, net of Adjusted EBITDA1 add-backs Mix impact of $(0.6) million on improving mix shift, included with price $(30.2) F3Q25 Revenue Price/Mix Volume F3Q26 Revenue
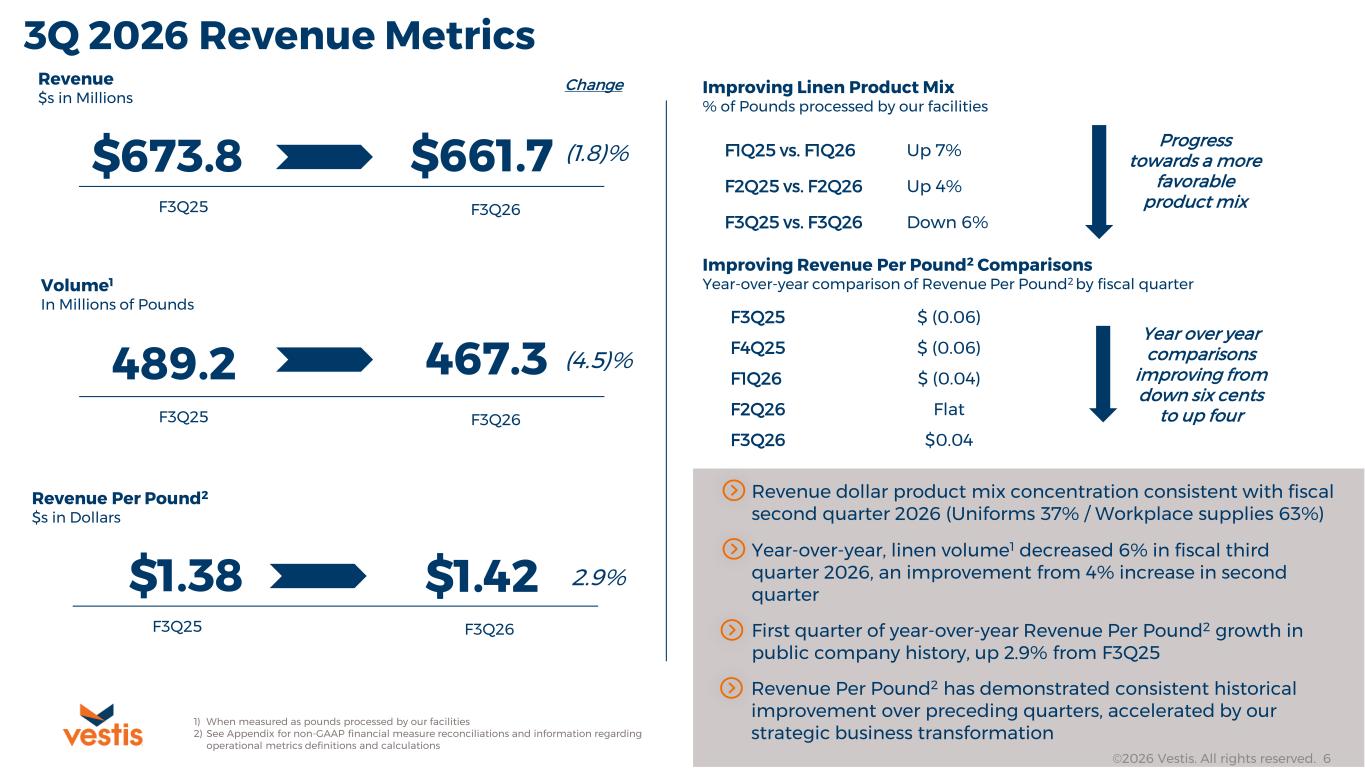
Vestis Confidential ©2025 Vestis. All rights reserved. 6 3Q 2026 Revenue Metrics Revenue $s in Millions F3Q25 F3Q26 $673.8 $661.7 Volume1 In Millions of Pounds 1) When measured as pounds processed by our facilities 2) See Appendix for non-GAAP financial measure reconciliations and information regarding operational metrics definitions and calculations (1.8)% F3Q25 F3Q26 489.2 467.3 (4.5)% Revenue Per Pound2 $s in Dollars F3Q25 F3Q26 $1.38 2.9%$1.42 Improving Linen Product Mix % of Pounds processed by our facilities First quarter of year-over-year Revenue Per Pound2 growth in public company history, up 2.9% from F3Q25 Revenue dollar product mix concentration consistent with fiscal second quarter 2026 (Uniforms 37% / Workplace supplies 63%) Change Year-over-year, linen volume1 decreased 6% in fiscal third quarter 2026, an improvement from 4% increase in second quarter ©2026 Vestis. All rights reserved. 6 F1Q25 vs. F1Q26 Up 7% F2Q25 vs. F2Q26 Up 4% F3Q25 vs. F3Q26 Down 6% Progress towards a more favorable product mix Revenue Per Pound2 has demonstrated consistent historical improvement over preceding quarters, accelerated by our strategic business transformation Improving Revenue Per Pound2 Comparisons Year-over-year comparison of Revenue Per Pound2 by fiscal quarter F3Q25 $ (0.06) F4Q25 $ (0.06) F1Q26 $ (0.04) F2Q26 Flat F3Q26 $0.04 Year over year comparisons improving from down six cents to up four
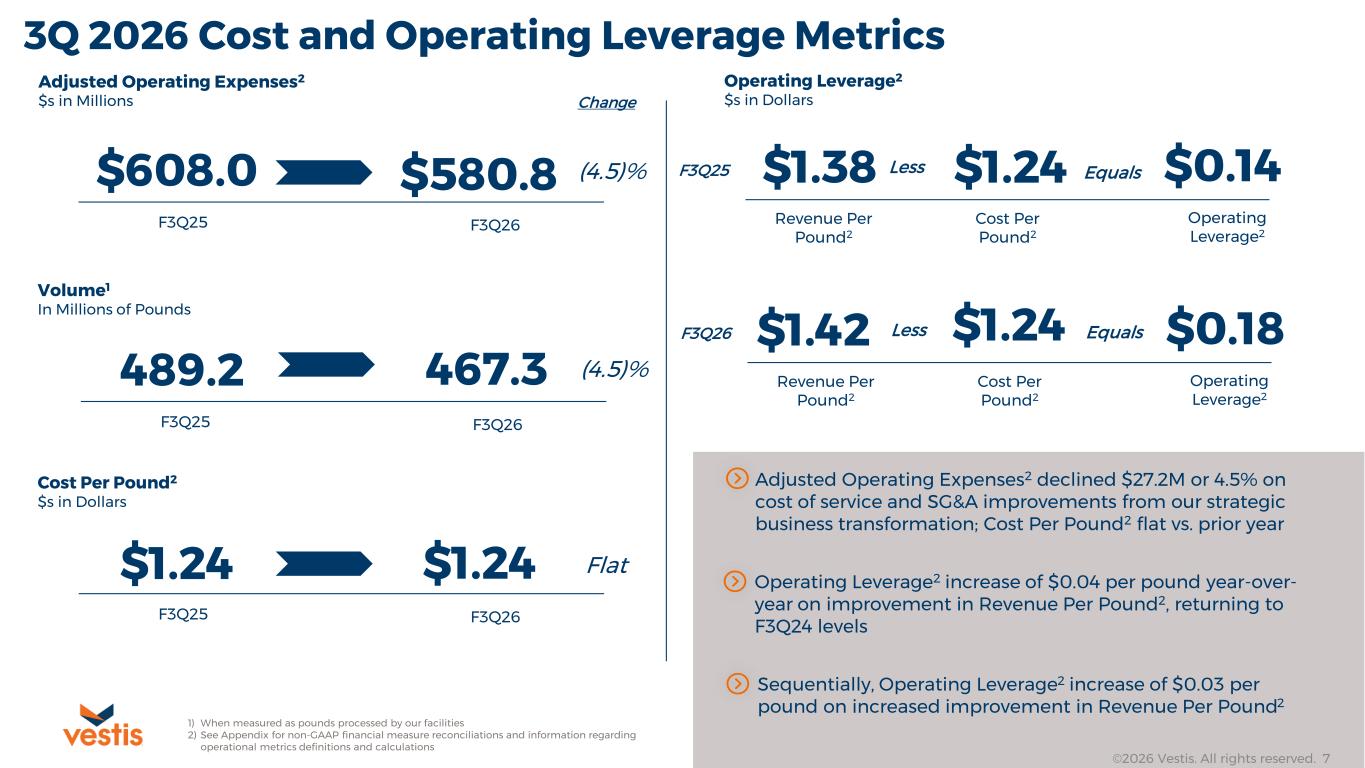
Vestis Confidential ©2025 Vestis. All rights reserved. 7 3Q 2026 Cost and Operating Leverage Metrics Adjusted Operating Expenses2 $s in Millions F3Q25 F3Q26 $608.0 $580.8 Volume1 In Millions of Pounds 1) When measured as pounds processed by our facilities 2) See Appendix for non-GAAP financial measure reconciliations and information regarding operational metrics definitions and calculations (4.5)% F3Q25 F3Q26 489.2 467.3 Cost Per Pound2 $s in Dollars F3Q25 F3Q26 $1.24 Flat$1.24 Operating Leverage2 $s in Dollars Revenue Per Pound2 Cost Per Pound2 Operating Leverage2 Less$1.38 $0.14 Operating Leverage2 increase of $0.04 per pound year-over- year on improvement in Revenue Per Pound2, returning to F3Q24 levels Adjusted Operating Expenses2 declined $27.2M or 4.5% on cost of service and SG&A improvements from our strategic business transformation; Cost Per Pound2 flat vs. prior year Change F3Q25 $1.24 Equals Revenue Per Pound2 Cost Per Pound2 Operating Leverage2 Less$1.42 $0.18F3Q26 Equals$1.24 Sequentially, Operating Leverage2 increase of $0.03 per pound on increased improvement in Revenue Per Pound2 ©2026 Vestis. All rights reserved. 7 (4.5)%
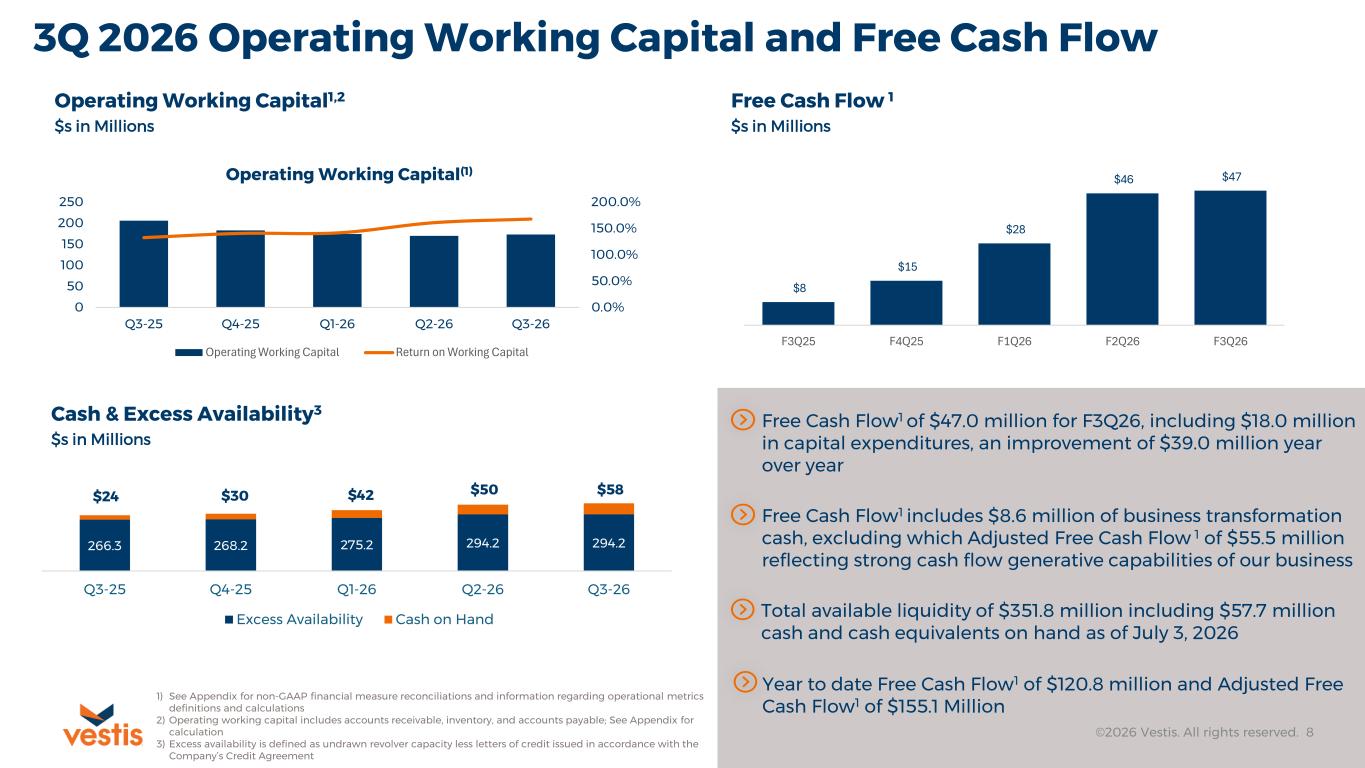
3Q 2026 Operating Working Capital and Free Cash Flow ©2026 Vestis. All rights reserved. 8 Operating Working Capital1,2 $s in Millions Cash & Excess Availability3 $s in Millions Free Cash Flow 1 $s in Millions 1) See Appendix for non-GAAP financial measure reconciliations and information regarding operational metrics definitions and calculations 2) Operating working capital includes accounts receivable, inventory, and accounts payable; See Appendix for calculation 3) Excess availability is defined as undrawn revolver capacity less letters of credit issued in accordance with the Company’s Credit Agreement Free Cash Flow1 of $47.0 million for F3Q26, including $18.0 million in capital expenditures, an improvement of $39.0 million year over year $268$266$264 $295$295 Free Cash Flow1 includes $8.6 million of business transformation cash, excluding which Adjusted Free Cash Flow 1 of $55.5 million reflecting strong cash flow generative capabilities of our business Total available liquidity of $351.8 million including $57.7 million cash and cash equivalents on hand as of July 3, 2026 0.0% 50.0% 100.0% 150.0% 200.0% 0 50 100 150 200 250 Q3-25 Q4-25 Q1-26 Q2-26 Q3-26 Operating Working Capital(1) Operating Working Capital Return on Working Capital $8 $15 $28 $46 $47 F3Q25 F4Q25 F1Q26 F2Q26 F3Q26 266.3 268.2 275.2 294.2 294.2 $24 $30 $42 $50 $58 Q3-25 Q4-25 Q1-26 Q2-26 Q3-26 Excess Availability Cash on Hand Year to date Free Cash Flow1 of $120.8 million and Adjusted Free Cash Flow1 of $155.1 Million
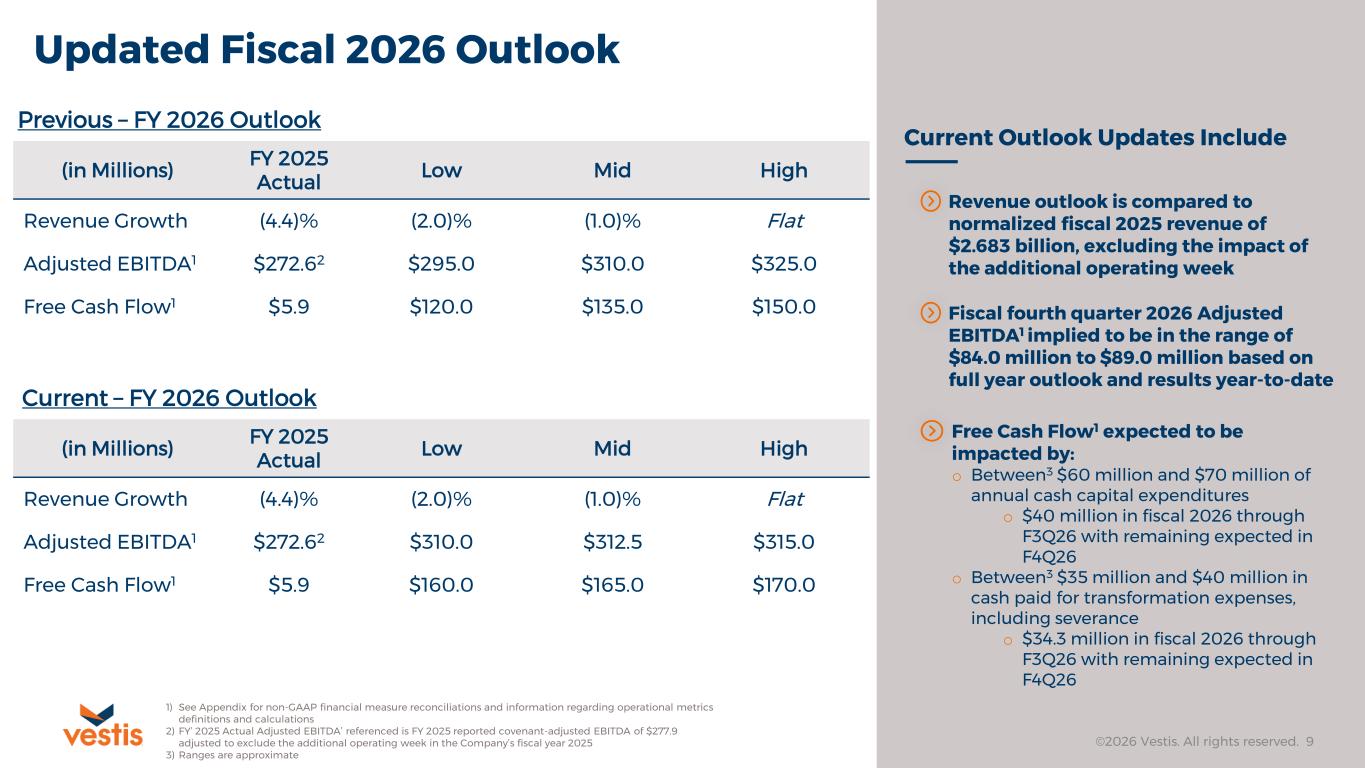
(in Millions) FY 2025 Actual Low Mid High Revenue Growth (4.4)% (2.0)% (1.0)% Flat Adjusted EBITDA1 $272.62 $295.0 $310.0 $325.0 Free Cash Flow1 $5.9 $120.0 $135.0 $150.0 Updated Fiscal 2026 Outlook ©2026 Vestis. All rights reserved. 9 Previous – FY 2026 Outlook 1) See Appendix for non-GAAP financial measure reconciliations and information regarding operational metrics definitions and calculations 2) FY’ 2025 Actual Adjusted EBITDA’ referenced is FY 2025 reported covenant-adjusted EBITDA of $277.9 adjusted to exclude the additional operating week in the Company’s fiscal year 2025 3) Ranges are approximate (in Millions) FY 2025 Actual Low Mid High Revenue Growth (4.4)% (2.0)% (1.0)% Flat Adjusted EBITDA1 $272.62 $310.0 $312.5 $315.0 Free Cash Flow1 $5.9 $160.0 $165.0 $170.0 Current – FY 2026 Outlook Current Outlook Updates Include Free Cash Flow1 expected to be impacted by: o Between3 $60 million and $70 million of annual cash capital expenditures o $40 million in fiscal 2026 through F3Q26 with remaining expected in F4Q26 o Between3 $35 million and $40 million in cash paid for transformation expenses, including severance o $34.3 million in fiscal 2026 through F3Q26 with remaining expected in F4Q26 Revenue outlook is compared to normalized fiscal 2025 revenue of $2.683 billion, excluding the impact of the additional operating week Fiscal fourth quarter 2026 Adjusted EBITDA1 implied to be in the range of $84.0 million to $89.0 million based on full year outlook and results year-to-date
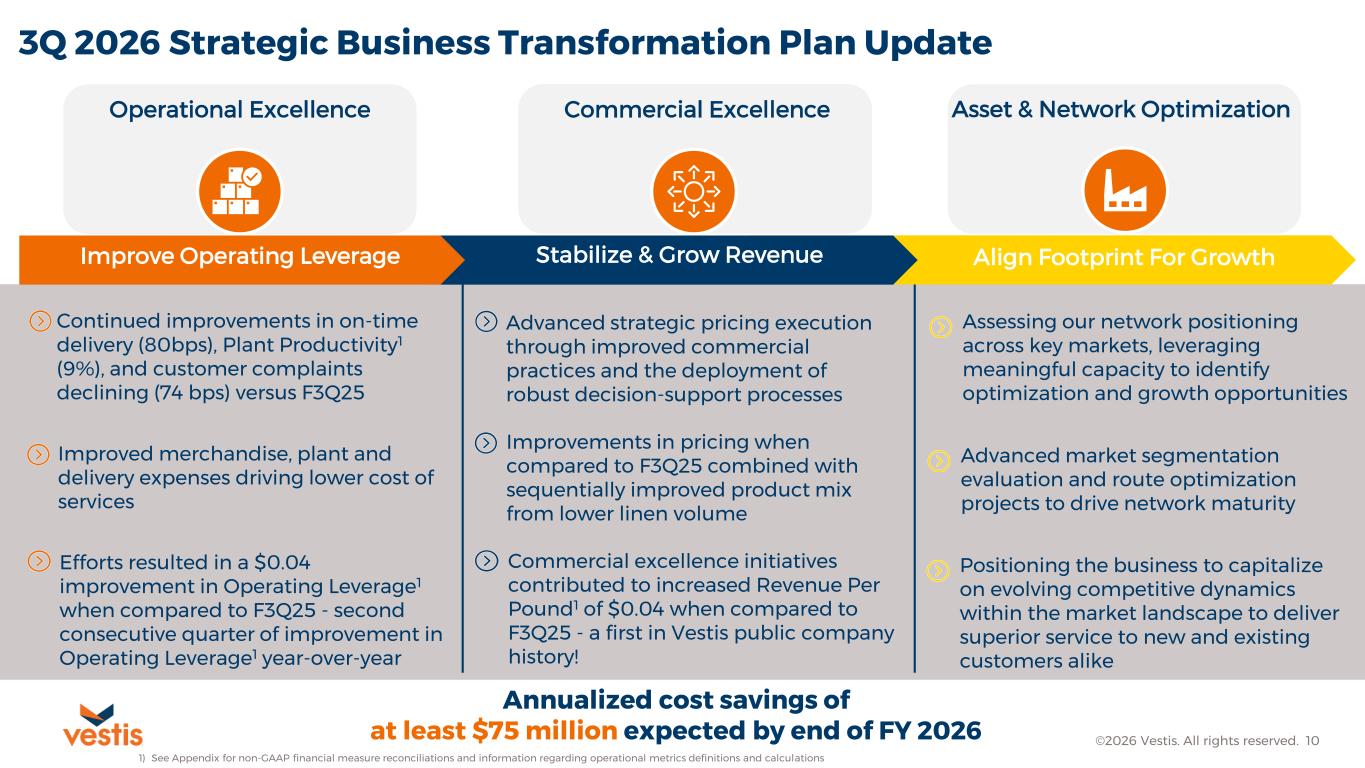
3Q 2026 Strategic Business Transformation Plan Update Commercial ExcellenceOperational Excellence Asset & Network Optimization Improve Operating Leverage Stabilize & Grow Revenue Align Footprint For Growth Advanced strategic pricing execution through improved commercial practices and the deployment of robust decision-support processes Improvements in pricing when compared to F3Q25 combined with sequentially improved product mix from lower linen volume Commercial excellence initiatives contributed to increased Revenue Per Pound1 of $0.04 when compared to F3Q25 - a first in Vestis public company history! Continued improvements in on-time delivery (80bps), Plant Productivity1 (9%), and customer complaints declining (74 bps) versus F3Q25 Improved merchandise, plant and delivery expenses driving lower cost of services Efforts resulted in a $0.04 improvement in Operating Leverage1 when compared to F3Q25 - second consecutive quarter of improvement in Operating Leverage1 year-over-year Annualized cost savings of at least $75 million expected by end of FY 2026 Assessing our network positioning across key markets, leveraging meaningful capacity to identify optimization and growth opportunities Positioning the business to capitalize on evolving competitive dynamics within the market landscape to deliver superior service to new and existing customers alike ©2026 Vestis. All rights reserved. 10 1) See Appendix for non-GAAP financial measure reconciliations and information regarding operational metrics definitions and calculations Advanced market segmentation evaluation and route optimization projects to drive network maturity

Q&A

Appendix
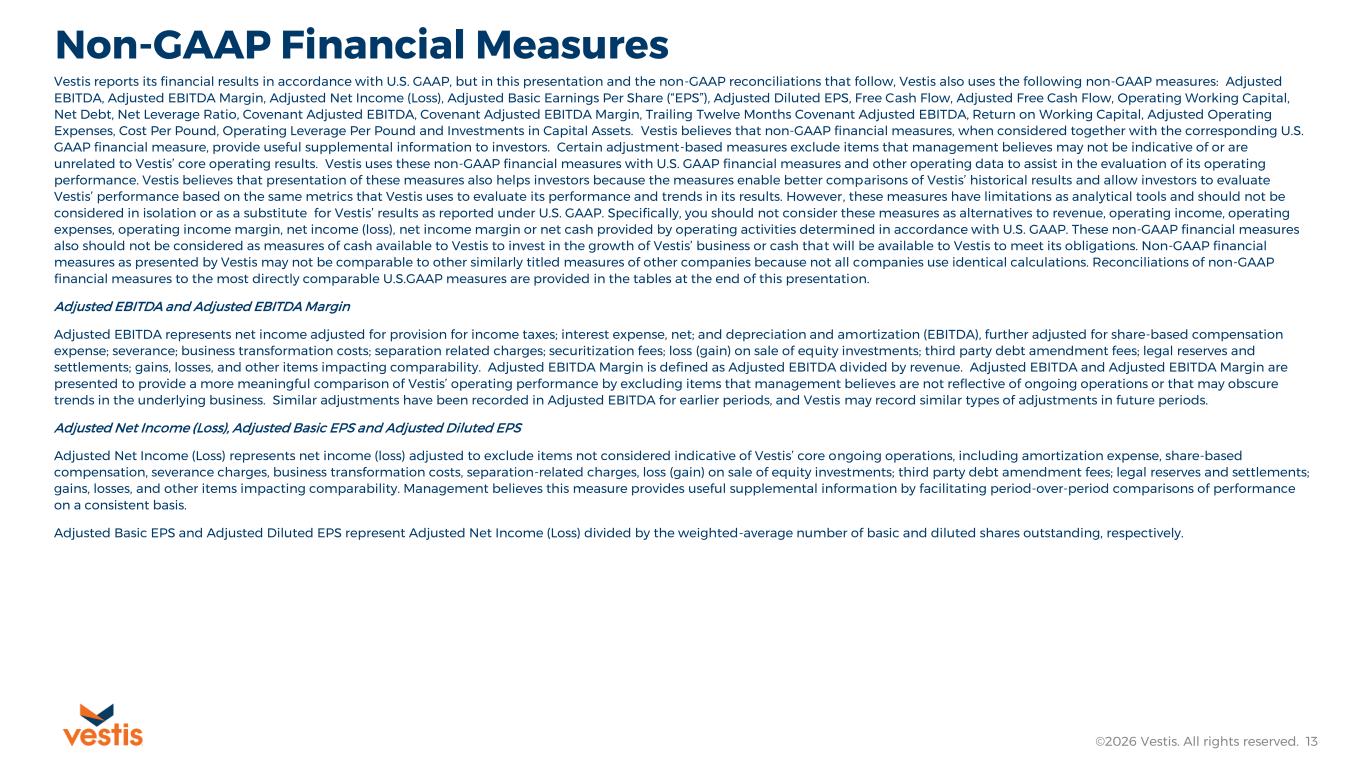
Non-GAAP Financial Measures ©2026 Vestis. All rights reserved. 13 Vestis reports its financial results in accordance with U.S. GAAP, but in this presentation and the non-GAAP reconciliations that follow, Vestis also uses the following non-GAAP measures: Adjusted EBITDA, Adjusted EBITDA Margin, Adjusted Net Income (Loss), Adjusted Basic Earnings Per Share (“EPS”), Adjusted Diluted EPS, Free Cash Flow, Adjusted Free Cash Flow, Operating Working Capital, Net Debt, Net Leverage Ratio, Covenant Adjusted EBITDA, Covenant Adjusted EBITDA Margin, Trailing Twelve Months Covenant Adjusted EBITDA, Return on Working Capital, Adjusted Operating Expenses, Cost Per Pound, Operating Leverage Per Pound and Investments in Capital Assets. Vestis believes that non-GAAP financial measures, when considered together with the corresponding U.S. GAAP financial measure, provide useful supplemental information to investors. Certain adjustment-based measures exclude items that management believes may not be indicative of or are unrelated to Vestis’ core operating results. Vestis uses these non-GAAP financial measures with U.S. GAAP financial measures and other operating data to assist in the evaluation of its operating performance. Vestis believes that presentation of these measures also helps investors because the measures enable better comparisons of Vestis’ historical results and allow investors to evaluate Vestis’ performance based on the same metrics that Vestis uses to evaluate its performance and trends in its results. However , these measures have limitations as analytical tools and should not be considered in isolation or as a substitute for Vestis’ results as reported under U.S. GAAP. Specifically, you should not consider these measures as alternatives to revenue, operating income, operating expenses, operating income margin, net income (loss), net income margin or net cash provided by operating activities determined in accordance with U.S. GAAP. These non-GAAP financial measures also should not be considered as measures of cash available to Vestis to invest in the growth of Vestis’ business or cash that will be available to Vestis to meet its obligations. Non-GAAP financial measures as presented by Vestis may not be comparable to other similarly titled measures of other companies because not all companies use identical calculations. Reconciliations of non-GAAP financial measures to the most directly comparable U.S.GAAP measures are provided in the tables at the end of this presentation. Adjusted EBITDA and Adjusted EBITDA Margin Adjusted EBITDA represents net income adjusted for provision for income taxes; interest expense, net; and depreciation and amortization (EBITDA), further adjusted for share-based compensation expense; severance; business transformation costs; separation related charges; securitization fees; loss (gain) on sale of equity investments; third party debt amendment fees; legal reserves and settlements; gains, losses, and other items impacting comparability. Adjusted EBITDA Margin is defined as Adjusted EBITDA divided by revenue. Adjusted EBITDA and Adjusted EBITDA Margin are presented to provide a more meaningful comparison of Vestis’ operating performance by excluding items that management believes are not reflective of ongoing operations or that may obscure trends in the underlying business. Similar adjustments have been recorded in Adjusted EBITDA for earlier periods, and Vestis may record similar types of adjustments in future periods. Adjusted Net Income (Loss), Adjusted Basic EPS and Adjusted Diluted EPS Adjusted Net Income (Loss) represents net income (loss) adjusted to exclude items not considered indicative of Vestis’ core ongoing operations, including amortization expense, share-based compensation, severance charges, business transformation costs, separation-related charges, loss (gain) on sale of equity investments; third party debt amendment fees; legal reserves and settlements; gains, losses, and other items impacting comparability. Management believes this measure provides useful supplemental information by facilitating period-over-period comparisons of performance on a consistent basis. Adjusted Basic EPS and Adjusted Diluted EPS represent Adjusted Net Income (Loss) divided by the weighted-average number of basic and diluted shares outstanding, respectively.
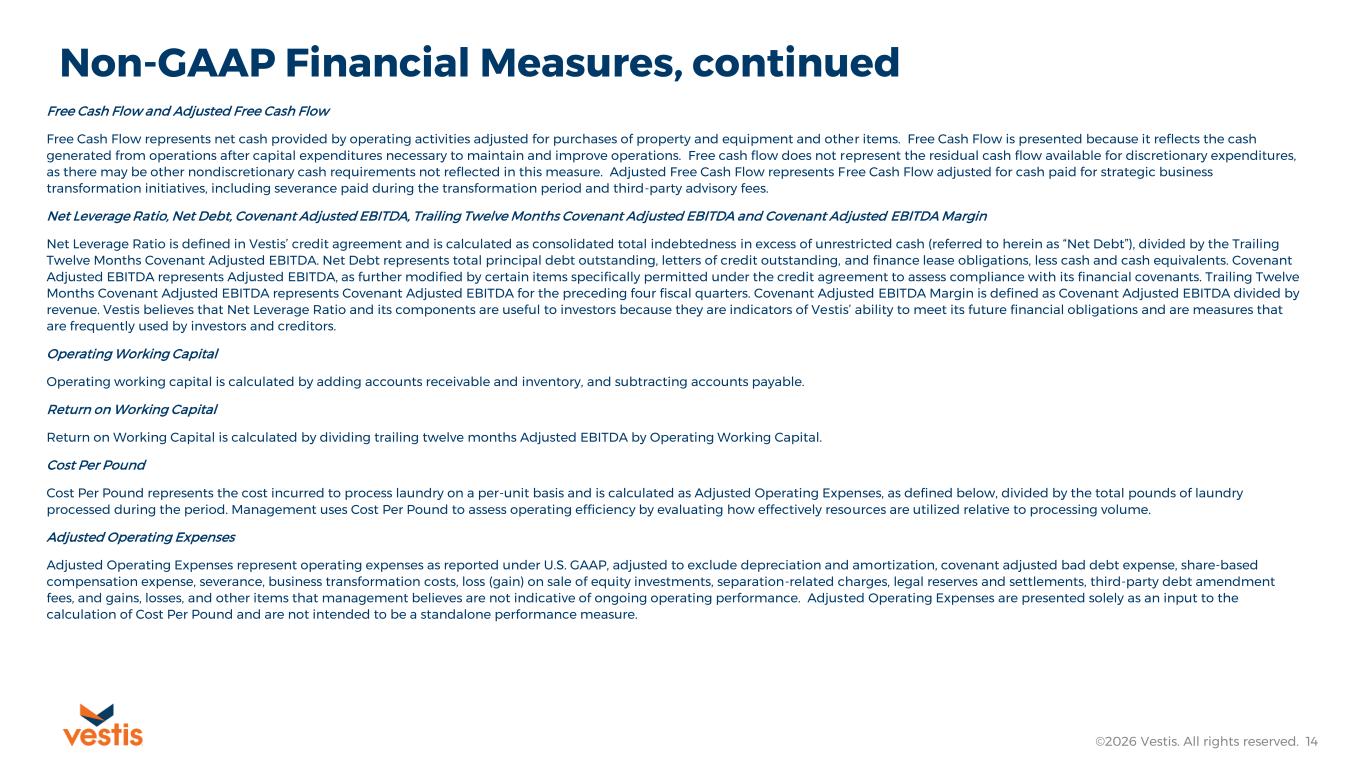
©2026 Vestis. All rights reserved. 14 Non-GAAP Financial Measures, continued Free Cash Flow and Adjusted Free Cash Flow Free Cash Flow represents net cash provided by operating activities adjusted for purchases of property and equipment and other items. Free Cash Flow is presented because it reflects the cash generated from operations after capital expenditures necessary to maintain and improve operations. Free cash flow does not represent the residual cash flow available for discretionary expenditures, as there may be other nondiscretionary cash requirements not reflected in this measure. Adjusted Free Cash Flow represents Free Cash Flow adjusted for cash paid for strategic business transformation initiatives, including severance paid during the transformation period and third-party advisory fees. Net Leverage Ratio, Net Debt, Covenant Adjusted EBITDA, Trailing Twelve Months Covenant Adjusted EBITDA and Covenant Adjusted EBITDA Margin Net Leverage Ratio is defined in Vestis’ credit agreement and is calculated as consolidated total indebtedness in excess of unrestricted cash (referred to herein as “Net Debt”), divided by the Trailing Twelve Months Covenant Adjusted EBITDA. Net Debt represents total principal debt outstanding, letters of credit outstanding, and finance lease obligations, less cash and cash equivalents. Covenant Adjusted EBITDA represents Adjusted EBITDA, as further modified by certain items specifically permitted under the credit agreement to assess compliance with its financial covenants. Trailing Twelve Months Covenant Adjusted EBITDA represents Covenant Adjusted EBITDA for the preceding four fiscal quarters. Covenant Adjusted EBITDA Margin is defined as Covenant Adjusted EBITDA divided by revenue. Vestis believes that Net Leverage Ratio and its components are useful to investors because they are indicators of Vestis’ ability to meet its future financial obligations and are measures that are frequently used by investors and creditors. Operating Working Capital Operating working capital is calculated by adding accounts receivable and inventory, and subtracting accounts payable. Return on Working Capital Return on Working Capital is calculated by dividing trailing twelve months Adjusted EBITDA by Operating Working Capital. Cost Per Pound Cost Per Pound represents the cost incurred to process laundry on a per-unit basis and is calculated as Adjusted Operating Expenses, as defined below, divided by the total pounds of laundry processed during the period. Management uses Cost Per Pound to assess operating efficiency by evaluating how effectively resources are utilized relative to processing volume. Adjusted Operating Expenses Adjusted Operating Expenses represent operating expenses as reported under U.S. GAAP, adjusted to exclude depreciation and amortization, covenant adjusted bad debt expense, share-based compensation expense, severance, business transformation costs, loss (gain) on sale of equity investments, separation-related charges, legal reserves and settlements, third-party debt amendment fees, and gains, losses, and other items that management believes are not indicative of ongoing operating performance. Adjusted Operating Expenses are presented solely as an input to the calculation of Cost Per Pound and are not intended to be a standalone performance measure.
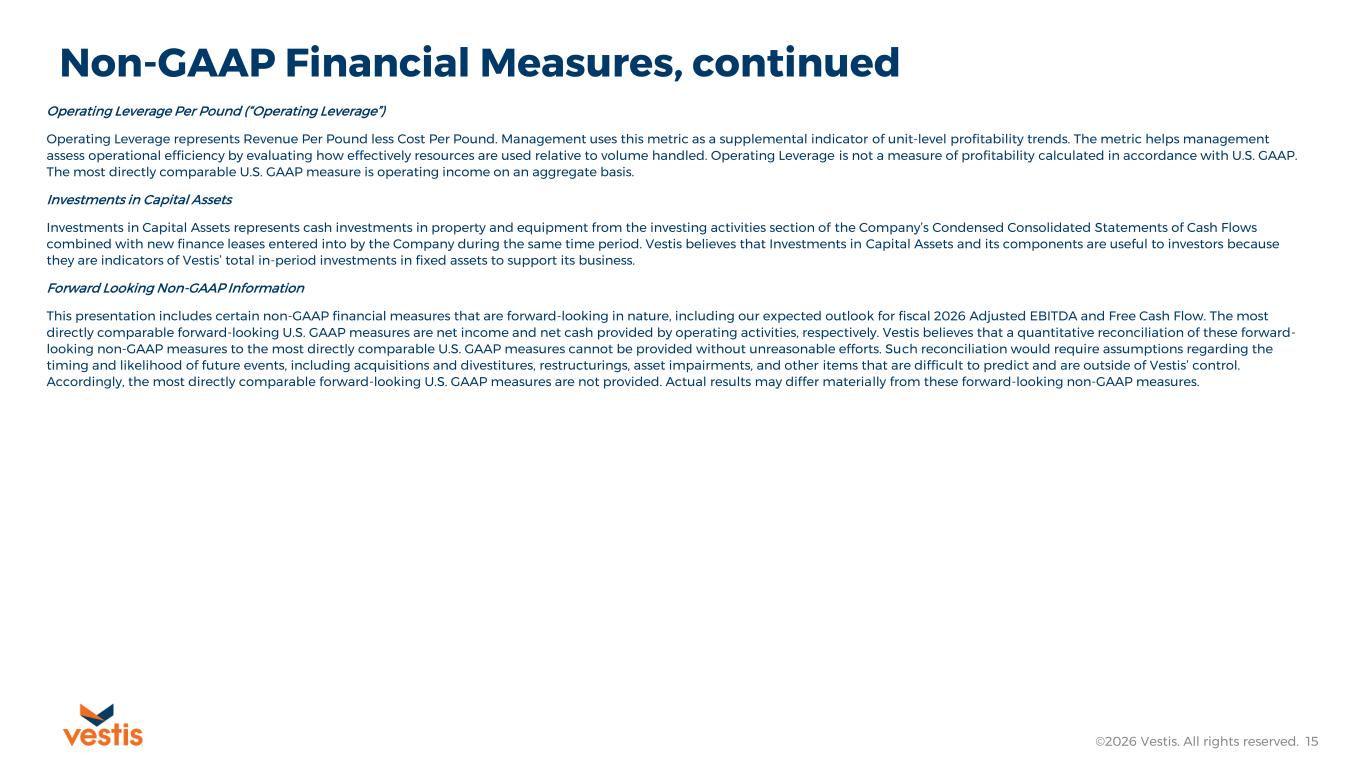
©2026 Vestis. All rights reserved. 15 Non-GAAP Financial Measures, continued Operating Leverage Per Pound (“Operating Leverage”) Operating Leverage represents Revenue Per Pound less Cost Per Pound. Management uses this metric as a supplemental indicator of unit-level profitability trends. The metric helps management assess operational efficiency by evaluating how effectively resources are used relative to volume handled. Operating Leverage is not a measure of profitability calculated in accordance with U.S. GAAP. The most directly comparable U.S. GAAP measure is operating income on an aggregate basis. Investments in Capital Assets Investments in Capital Assets represents cash investments in property and equipment from the investing activities section of the Company’s Condensed Consolidated Statements of Cash Flows combined with new finance leases entered into by the Company during the same time period. Vestis believes that Investments in Capital Assets and its components are useful to investors because they are indicators of Vestis’ total in-period investments in fixed assets to support its business. Forward Looking Non-GAAP Information This presentation includes certain non-GAAP financial measures that are forward-looking in nature, including our expected outlook for fiscal 2026 Adjusted EBITDA and Free Cash Flow. The most directly comparable forward-looking U.S. GAAP measures are net income and net cash provided by operating activities, respectively. Vestis believes that a quantitative reconciliation of these forward- looking non-GAAP measures to the most directly comparable U.S. GAAP measures cannot be provided without unreasonable efforts. Such reconciliation would require assumptions regarding the timing and likelihood of future events, including acquisitions and divestitures, restructurings, asset impairments, and other items that are difficult to predict and are outside of Vestis’ control. Accordingly, the most directly comparable forward-looking U.S. GAAP measures are not provided. Actual results may differ materially from these forward-looking non-GAAP measures.
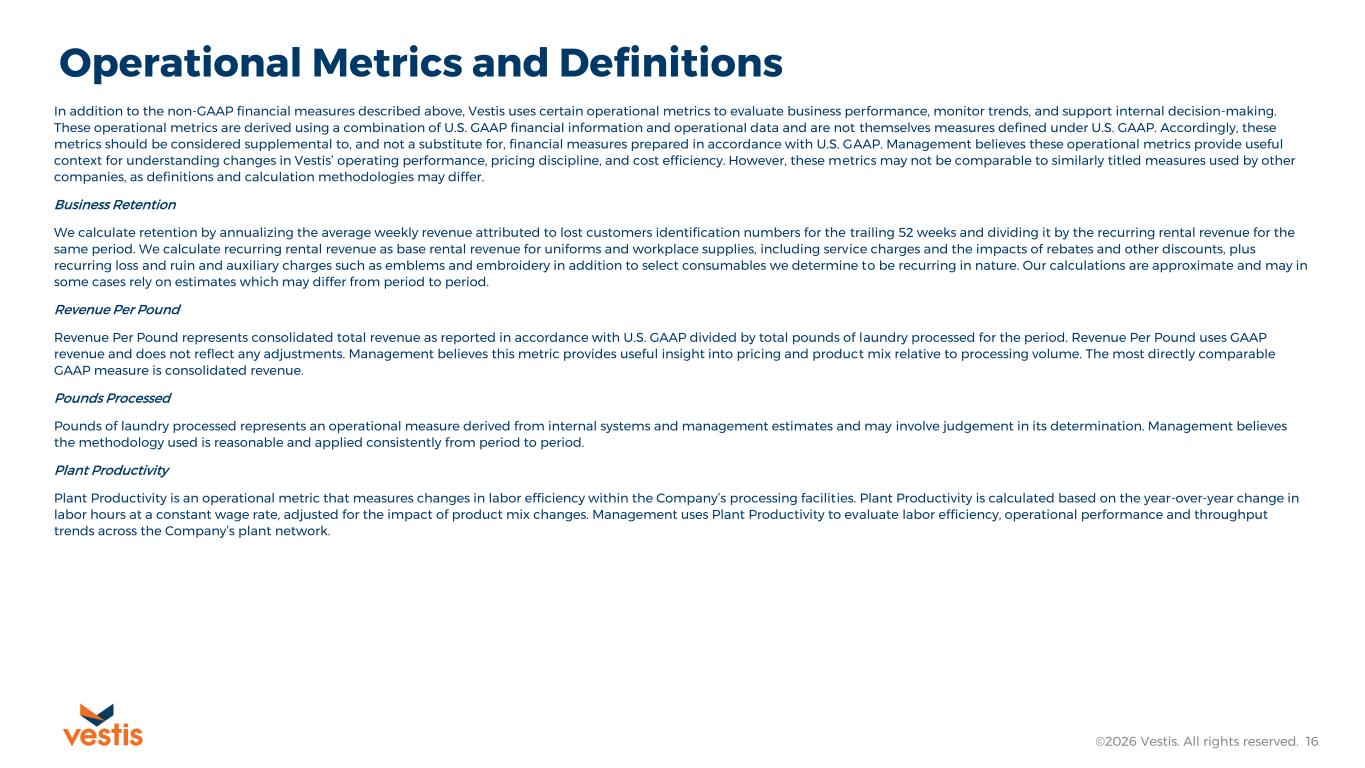
©2026 Vestis. All rights reserved. 16 Operational Metrics and Definitions In addition to the non-GAAP financial measures described above, Vestis uses certain operational metrics to evaluate business performance, monitor trends, and support internal decision-making. These operational metrics are derived using a combination of U.S. GAAP financial information and operational data and are not themselves measures defined under U.S. GAAP. Accordingly, these metrics should be considered supplemental to, and not a substitute for, financial measures prepared in accordance with U.S. GAAP. Management believes these operational metrics provide useful context for understanding changes in Vestis’ operating performance, pricing discipline, and cost efficiency. However, these metrics may not be comparable to similarly titled measures used by other companies, as definitions and calculation methodologies may differ. Business Retention We calculate retention by annualizing the average weekly revenue attributed to lost customers identification numbers for the trailing 52 weeks and dividing it by the recurring rental revenue for the same period. We calculate recurring rental revenue as base rental revenue for uniforms and workplace supplies, including service charges and the impacts of rebates and other discounts, plus recurring loss and ruin and auxiliary charges such as emblems and embroidery in addition to select consumables we determine to be recurring in nature. Our calculations are approximate and may in some cases rely on estimates which may differ from period to period. Revenue Per Pound Revenue Per Pound represents consolidated total revenue as reported in accordance with U.S. GAAP divided by total pounds of laundry processed for the period. Revenue Per Pound uses GAAP revenue and does not reflect any adjustments. Management believes this metric provides useful insight into pricing and product mix relative to processing volume. The most directly comparable GAAP measure is consolidated revenue. Pounds Processed Pounds of laundry processed represents an operational measure derived from internal systems and management estimates and may involve judgement in its determination. Management believes the methodology used is reasonable and applied consistently from period to period. Plant Productivity Plant Productivity is an operational metric that measures changes in labor efficiency within the Company’s processing facilities. Plant Productivity is calculated based on the year-over-year change in labor hours at a constant wage rate, adjusted for the impact of product mix changes. Management uses Plant Productivity to evaluate labor efficiency, operational performance and throughput trends across the Company’s plant network.
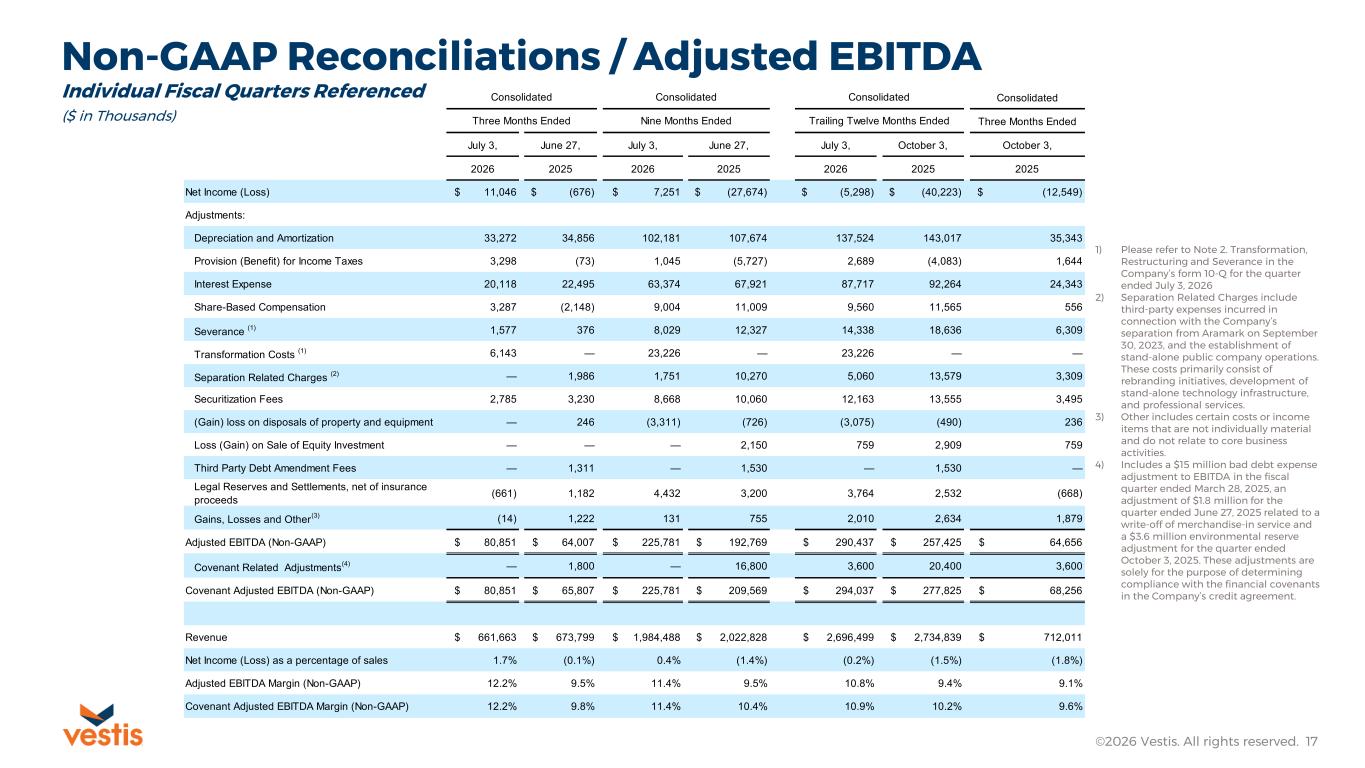
Non-GAAP Reconciliations / Adjusted EBITDA ©2026 Vestis. All rights reserved. 17 ($ in Thousands) 1) Please refer to Note 2. Transformation, Restructuring and Severance in the Company’s form 10-Q for the quarter ended July 3, 2026 2) Separation Related Charges include third-party expenses incurred in connection with the Company’s separation from Aramark on September 30, 2023, and the establishment of stand-alone public company operations. These costs primarily consist of rebranding initiatives, development of stand-alone technology infrastructure, and professional services. 3) Other includes certain costs or income items that are not individually material and do not relate to core business activities. 4) Includes a $15 million bad debt expense adjustment to EBITDA in the fiscal quarter ended March 28, 2025, an adjustment of $1.8 million for the quarter ended June 27, 2025 related to a write-off of merchandise-in service and a $3.6 million environmental reserve adjustment for the quarter ended October 3, 2025. These adjustments are solely for the purpose of determining compliance with the financial covenants in the Company’s credit agreement. Individual Fiscal Quarters Referenced Consolidated Three Months Ended July 3, June 27, July 3, June 27, July 3, October 3, October 3, 2026 2025 2026 2025 2026 2025 2025 Net Income (Loss) $ 11,046 $ (676) $ 7,251 $ (27,674) $ (5,298) $ (40,223) $ (12,549) Adjustments: Depreciation and Amortization 33,272 34,856 102,181 107,674 137,524 143,017 35,343 Provision (Benefit) for Income Taxes 3,298 (73) 1,045 (5,727) 2,689 (4,083) 1,644 Interest Expense 20,118 22,495 63,374 67,921 87,717 92,264 24,343 Share-Based Compensation 3,287 (2,148) 9,004 11,009 9,560 11,565 556 Severance (1) 1,577 376 8,029 12,327 14,338 18,636 6,309 Transformation Costs (1) 6,143 — 23,226 — 23,226 — — Separation Related Charges (2) — 1,986 1,751 10,270 5,060 13,579 3,309 Securitization Fees 2,785 3,230 8,668 10,060 12,163 13,555 3,495 (Gain) loss on disposals of property and equipment — 246 (3,311) (726) (3,075) (490) 236 Loss (Gain) on Sale of Equity Investment — — — 2,150 759 2,909 759 Third Party Debt Amendment Fees — 1,311 — 1,530 — 1,530 — Legal Reserves and Settlements, net of insurance proceeds (661) 1,182 4,432 3,200 3,764 2,532 (668) Gains, Losses and Other (3) (14) 1,222 131 755 2,010 2,634 1,879 Adjusted EBITDA (Non-GAAP) $ 80,851 $ 64,007 $ 225,781 $ 192,769 $ 290,437 $ 257,425 $ 64,656 Covenant Related Adjustments (4) — 1,800 — 16,800 3,600 20,400 3,600 Covenant Adjusted EBITDA (Non-GAAP) $ 80,851 $ 65,807 $ 225,781 $ 209,569 $ 294,037 $ 277,825 $ 68,256 Revenue $ 661,663 $ 673,799 $ 1,984,488 $ 2,022,828 $ 2,696,499 $ 2,734,839 $ 712,011 Net Income (Loss) as a percentage of sales 1.7% (0.1%) 0.4% (1.4%) (0.2%) (1.5%) (1.8%) Adjusted EBITDA Margin (Non-GAAP) 12.2% 9.5% 11.4% 9.5% 10.8% 9.4% 9.1% Covenant Adjusted EBITDA Margin (Non-GAAP) 12.2% 9.8% 11.4% 10.4% 10.9% 10.2% 9.6% Consolidated Consolidated Consolidated Three Months Ended Nine Months Ended Trailing Twelve Months Ended
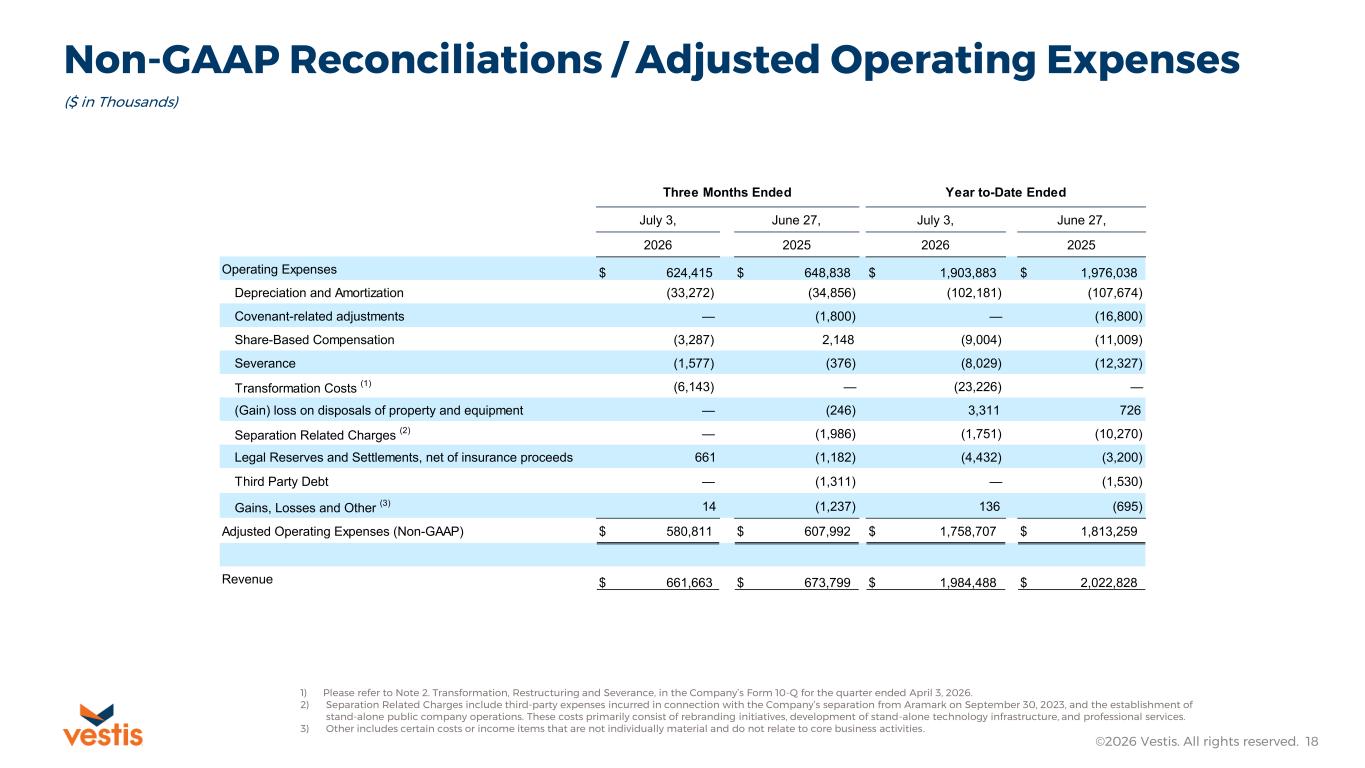
Non-GAAP Reconciliations / Adjusted Operating Expenses ©2026 Vestis. All rights reserved. 18 ($ in Thousands) 1) Please refer to Note 2. Transformation, Restructuring and Severance, in the Company’s Form 10-Q for the quarter ended April 3, 2026. 2) Separation Related Charges include third-party expenses incurred in connection with the Company’s separation from Aramark on September 30, 2023, and the establishment of stand-alone public company operations. These costs primarily consist of rebranding initiatives, development of stand-alone technology infrastructure, and professional services. 3) Other includes certain costs or income items that are not individually material and do not relate to core business activities. July 3, June 27, July 3, June 27, 2026 2025 2026 2025 Operating Expenses $ 624,415 $ 648,838 $ 1,903,883 $ 1,976,038 Depreciation and Amortization (33,272) (34,856) (102,181) (107,674) Covenant-related adjustments — (1,800) — (16,800) Share-Based Compensation (3,287) 2,148 (9,004) (11,009) Severance (1,577) (376) (8,029) (12,327) Transformation Costs (1) (6,143) — (23,226) — (Gain) loss on disposals of property and equipment — (246) 3,311 726 Separation Related Charges (2) — (1,986) (1,751) (10,270) Legal Reserves and Settlements, net of insurance proceeds 661 (1,182) (4,432) (3,200) Third Party Debt — (1,311) — (1,530) Gains, Losses and Other (3) 14 (1,237) 136 (695) Adjusted Operating Expenses (Non-GAAP) $ 580,811 $ 607,992 $ 1,758,707 $ 1,813,259 Revenue $ 661,663 $ 673,799 $ 1,984,488 $ 2,022,828 Three Months Ended Year to-Date Ended
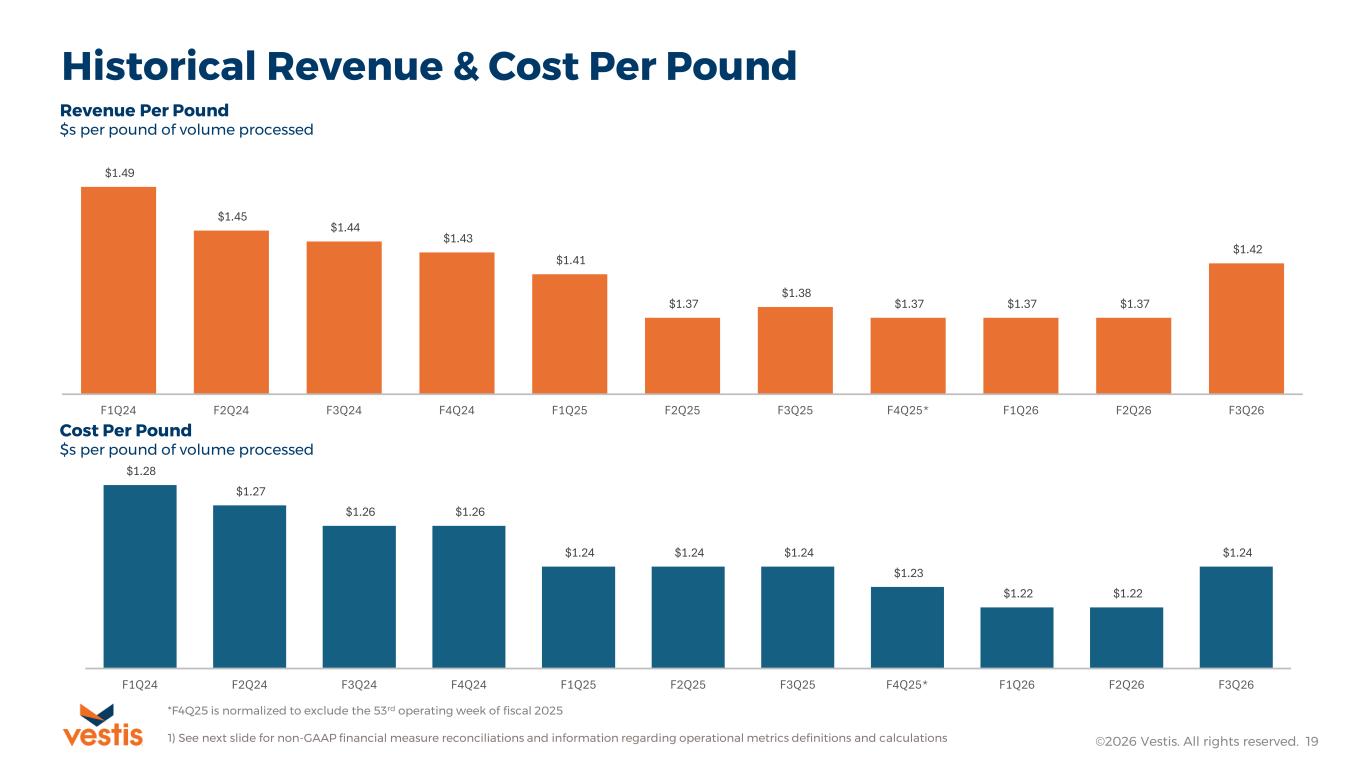
Historical Revenue & Cost Per Pound ©2026 Vestis. All rights reserved. 19 Revenue Per Pound $s per pound of volume processed Cost Per Pound $s per pound of volume processed *F4Q25 is normalized to exclude the 53rd operating week of fiscal 2025 1) See next slide for non-GAAP financial measure reconciliations and information regarding operational metrics definitions and calculations $1.49 $1.45 $1.44 $1.43 $1.41 $1.37 $1.38 $1.37 $1.37 $1.37 $1.42 F1Q24 F2Q24 F3Q24 F4Q24 F1Q25 F2Q25 F3Q25 F4Q25* F1Q26 F2Q26 F3Q26 $1.28 $1.27 $1.26 $1.26 $1.24 $1.24 $1.24 $1.23 $1.22 $1.22 $1.24 F1Q24 F2Q24 F3Q24 F4Q24 F1Q25 F2Q25 F3Q25 F4Q25* F1Q26 F2Q26 F3Q26
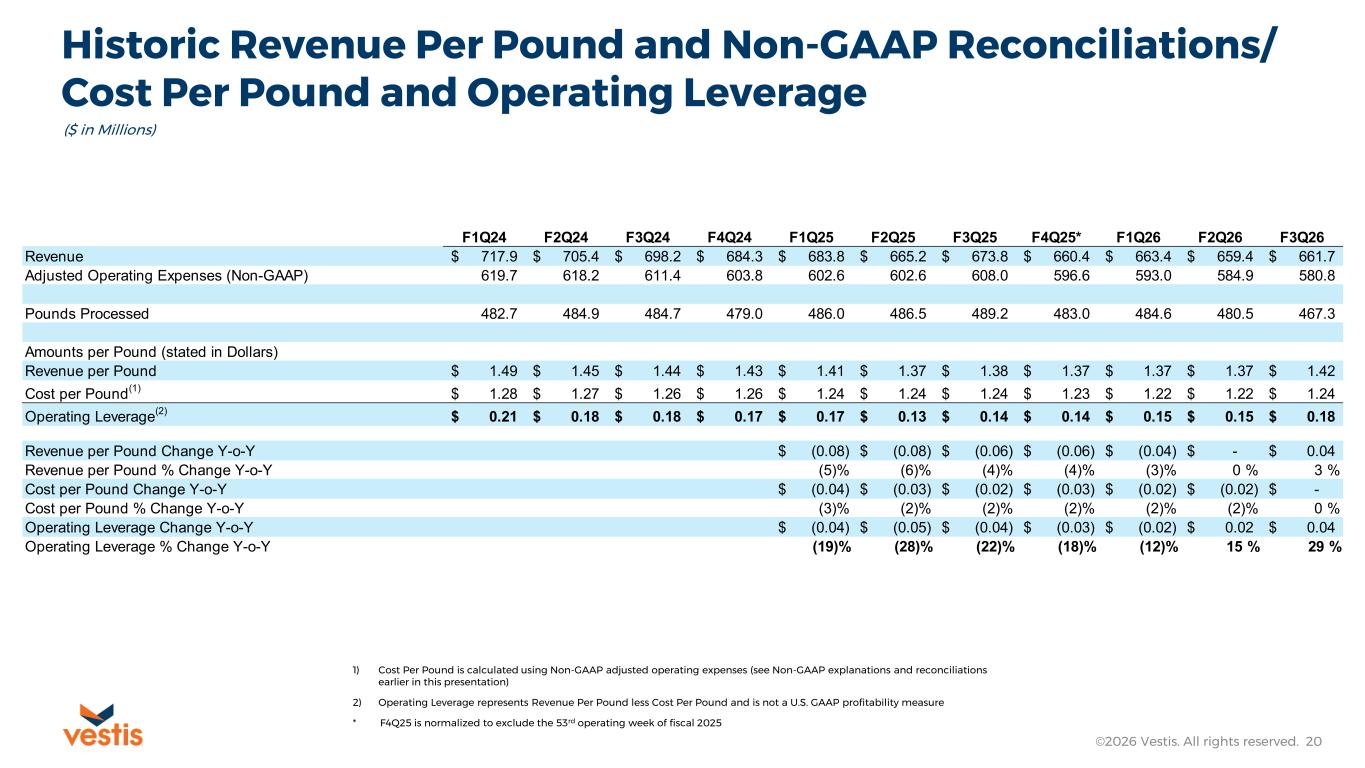
©2026 Vestis. All rights reserved. 20 Historic Revenue Per Pound and Non-GAAP Reconciliations/ Cost Per Pound and Operating Leverage ($ in Millions) 1) Cost Per Pound is calculated using Non-GAAP adjusted operating expenses (see Non-GAAP explanations and reconciliations earlier in this presentation) 2) Operating Leverage represents Revenue Per Pound less Cost Per Pound and is not a U.S. GAAP profitability measure * F4Q25 is normalized to exclude the 53rd operating week of fiscal 2025 F1Q24 F2Q24 F3Q24 F4Q24 F1Q25 F2Q25 F3Q25 F4Q25* F1Q26 F2Q26 F3Q26 Revenue 717.9$ 705.4$ 698.2$ 684.3$ 683.8$ 665.2$ 673.8$ 660.4$ 663.4$ 659.4$ 661.7$ Adjusted Operating Expenses (Non-GAAP) 619.7 618.2 611.4 603.8 602.6 602.6 608.0 596.6 593.0 584.9 580.8 Pounds Processed 482.7 484.9 484.7 479.0 486.0 486.5 489.2 483.0 484.6 480.5 467.3 Amounts per Pound (stated in Dollars) Revenue per Pound 1.49$ 1.45$ 1.44$ 1.43$ 1.41$ 1.37$ 1.38$ 1.37$ 1.37$ 1.37$ 1.42$ Cost per Pound (1) 1.28$ 1.27$ 1.26$ 1.26$ 1.24$ 1.24$ 1.24$ 1.23$ 1.22$ 1.22$ 1.24$ Operating Leverage (2) 0.21$ 0.18$ 0.18$ 0.17$ 0.17$ 0.13$ 0.14$ 0.14$ 0.15$ 0.15$ 0.18$ Revenue per Pound Change Y-o-Y (0.08)$ (0.08)$ (0.06)$ (0.06)$ (0.04)$ -$ 0.04$ Revenue per Pound % Change Y-o-Y (5)% (6)% (4)% (4)% (3)% 0 % 3 % Cost per Pound Change Y-o-Y (0.04)$ (0.03)$ (0.02)$ (0.03)$ (0.02)$ (0.02)$ -$ Cost per Pound % Change Y-o-Y (3)% (2)% (2)% (2)% (2)% (2)% 0 % Operating Leverage Change Y-o-Y (0.04)$ (0.05)$ (0.04)$ (0.03)$ (0.02)$ 0.02$ 0.04$ Operating Leverage % Change Y-o-Y (19)% (28)% (22)% (18)% (12)% 15 % 29 %
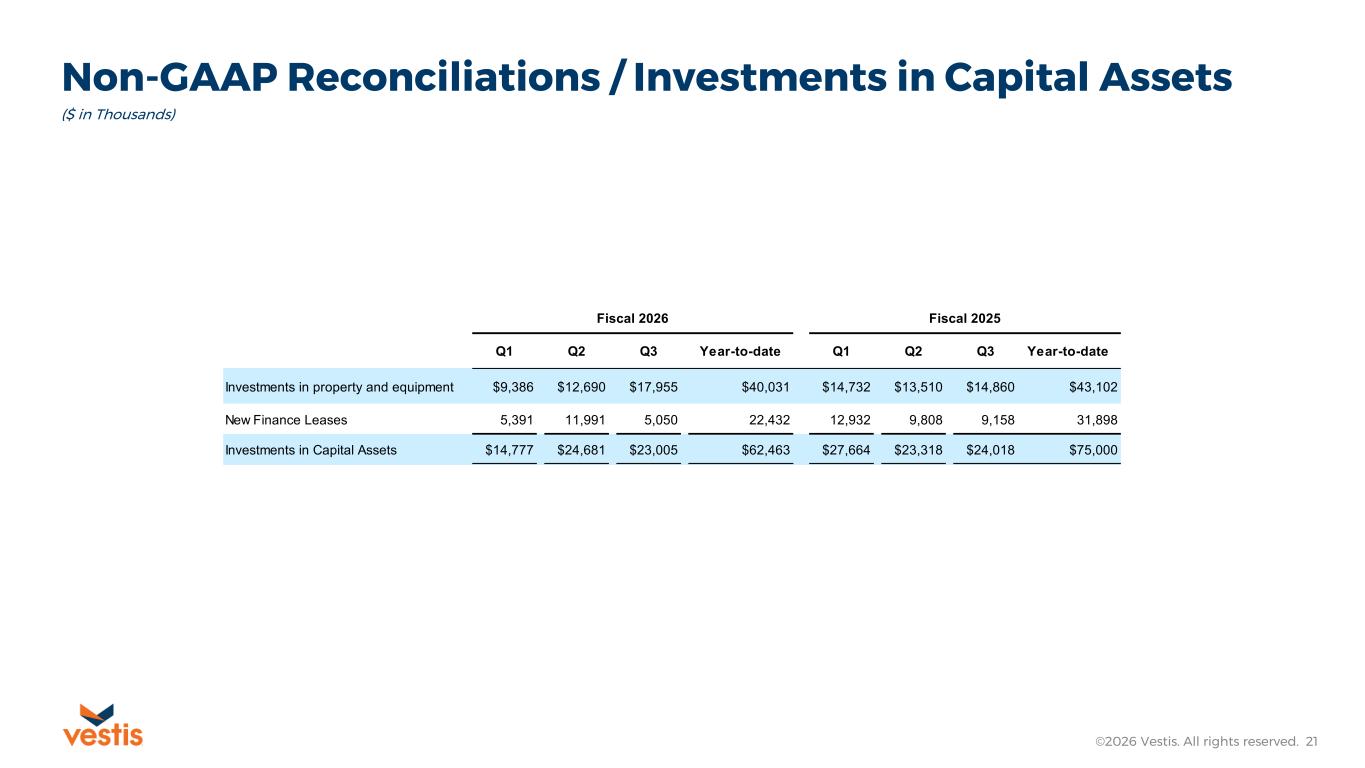
Non-GAAP Reconciliations / Investments in Capital Assets ©2026 Vestis. All rights reserved. 21 ($ in Thousands) Q1 Q2 Q3 Year-to-date Q1 Q2 Q3 Year-to-date Investments in property and equipment $9,386 $12,690 $17,955 $40,031 $14,732 $13,510 $14,860 $43,102 New Finance Leases 5,391 11,991 5,050 22,432 12,932 9,808 9,158 31,898 Investments in Capital Assets $14,777 $24,681 $23,005 $62,463 $27,664 $23,318 $24,018 $75,000 Fiscal 2026 Fiscal 2025
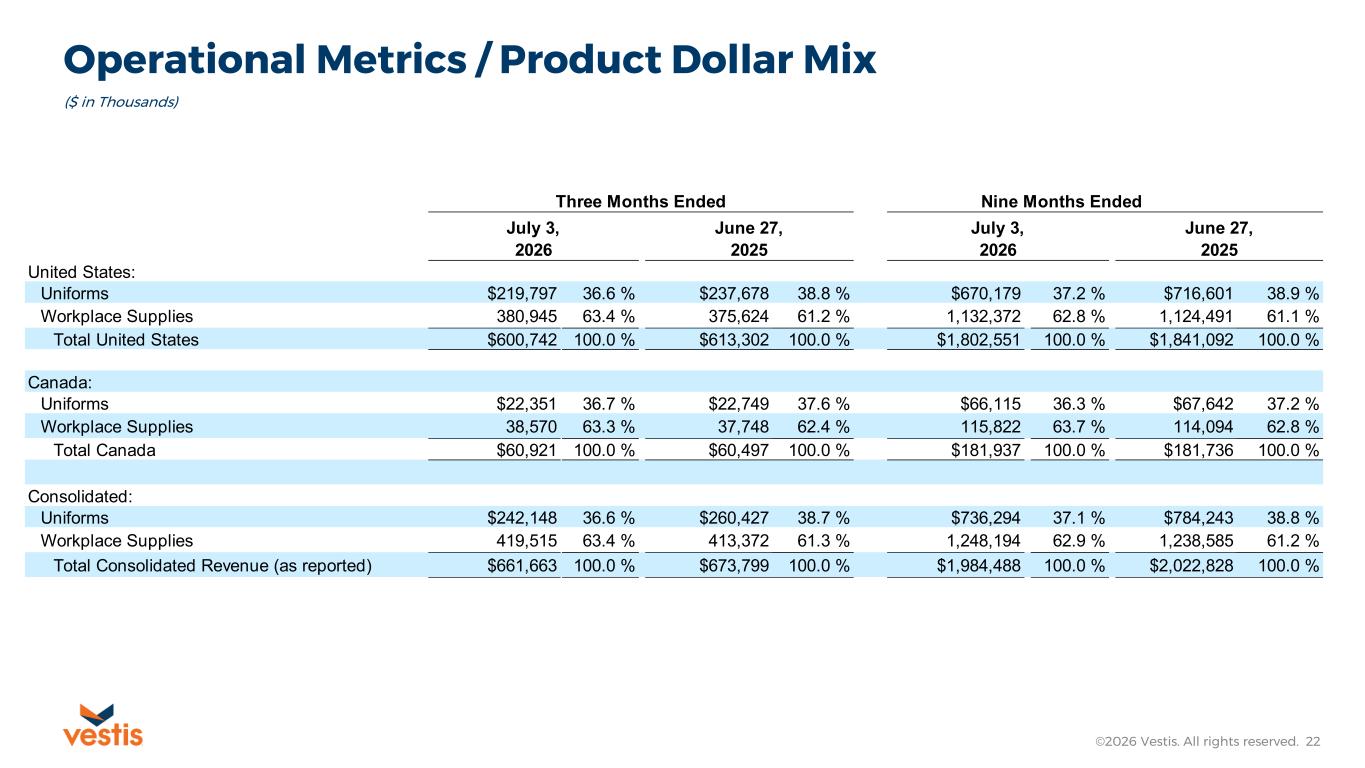
Operational Metrics / Product Dollar Mix ©2026 Vestis. All rights reserved. 22 ($ in Thousands) United States: Uniforms $219,797 36.6 % $237,678 38.8 % $670,179 37.2 % $716,601 38.9 % Workplace Supplies 380,945 63.4 % 375,624 61.2 % 1,132,372 62.8 % 1,124,491 61.1 % Total United States $600,742 100.0 % $613,302 100.0 % $1,802,551 100.0 % $1,841,092 100.0 % Canada: Uniforms $22,351 36.7 % $22,749 37.6 % $66,115 36.3 % $67,642 37.2 % Workplace Supplies 38,570 63.3 % 37,748 62.4 % 115,822 63.7 % 114,094 62.8 % Total Canada $60,921 100.0 % $60,497 100.0 % $181,937 100.0 % $181,736 100.0 % Consolidated: Uniforms $242,148 36.6 % $260,427 38.7 % $736,294 37.1 % $784,243 38.8 % Workplace Supplies 419,515 63.4 % 413,372 61.3 % 1,248,194 62.9 % 1,238,585 61.2 % Total Consolidated Revenue (as reported) $661,663 100.0 % $673,799 100.0 % $1,984,488 100.0 % $2,022,828 100.0 % July 3, 2026 June 27, 2025 Three Months Ended July 3, 2026 Nine Months Ended June 27, 2025
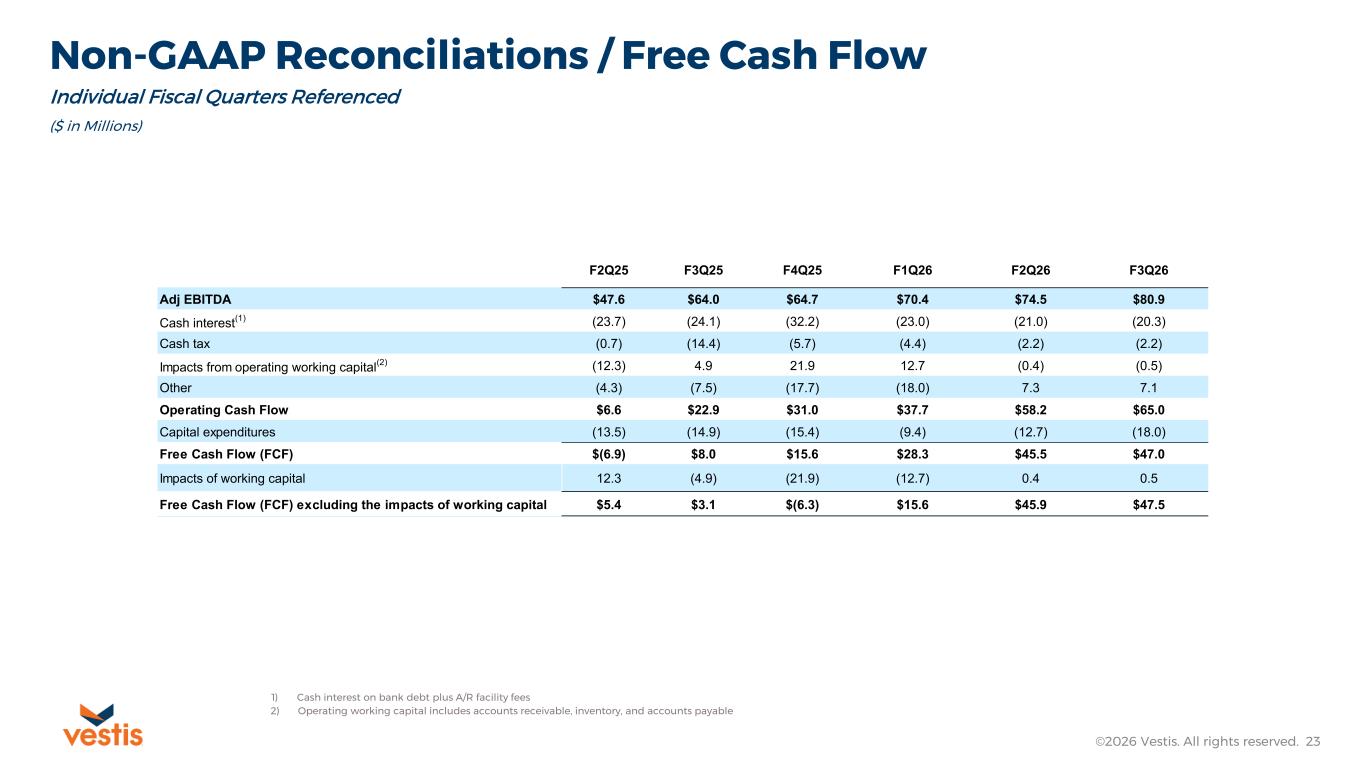
Non-GAAP Reconciliations / Free Cash Flow ©2026 Vestis. All rights reserved. 23 ($ in Millions) 1) Cash interest on bank debt plus A/R facility fees Individual Fiscal Quarters Referenced 2) Operating working capital includes accounts receivable, inventory, and accounts payable F2Q25 F3Q25 F4Q25 F1Q26 F2Q26 F3Q26 Adj EBITDA $47.6 $64.0 $64.7 $70.4 $74.5 $80.9 Cash interest (1) (23.7) (24.1) (32.2) (23.0) (21.0) (20.3) Cash tax (0.7) (14.4) (5.7) (4.4) (2.2) (2.2) Impacts from operating working capital (2) (12.3) 4.9 21.9 12.7 (0.4) (0.5) Other (4.3) (7.5) (17.7) (18.0) 7.3 7.1 Operating Cash Flow $6.6 $22.9 $31.0 $37.7 $58.2 $65.0 Capital expenditures (13.5) (14.9) (15.4) (9.4) (12.7) (18.0) Free Cash Flow (FCF) $(6.9) $8.0 $15.6 $28.3 $45.5 $47.0 Impacts of working capital 12.3 (4.9) (21.9) (12.7) 0.4 0.5 Free Cash Flow (FCF) excluding the impacts of working capital $5.4 $3.1 $(6.3) $15.6 $45.9 $47.5
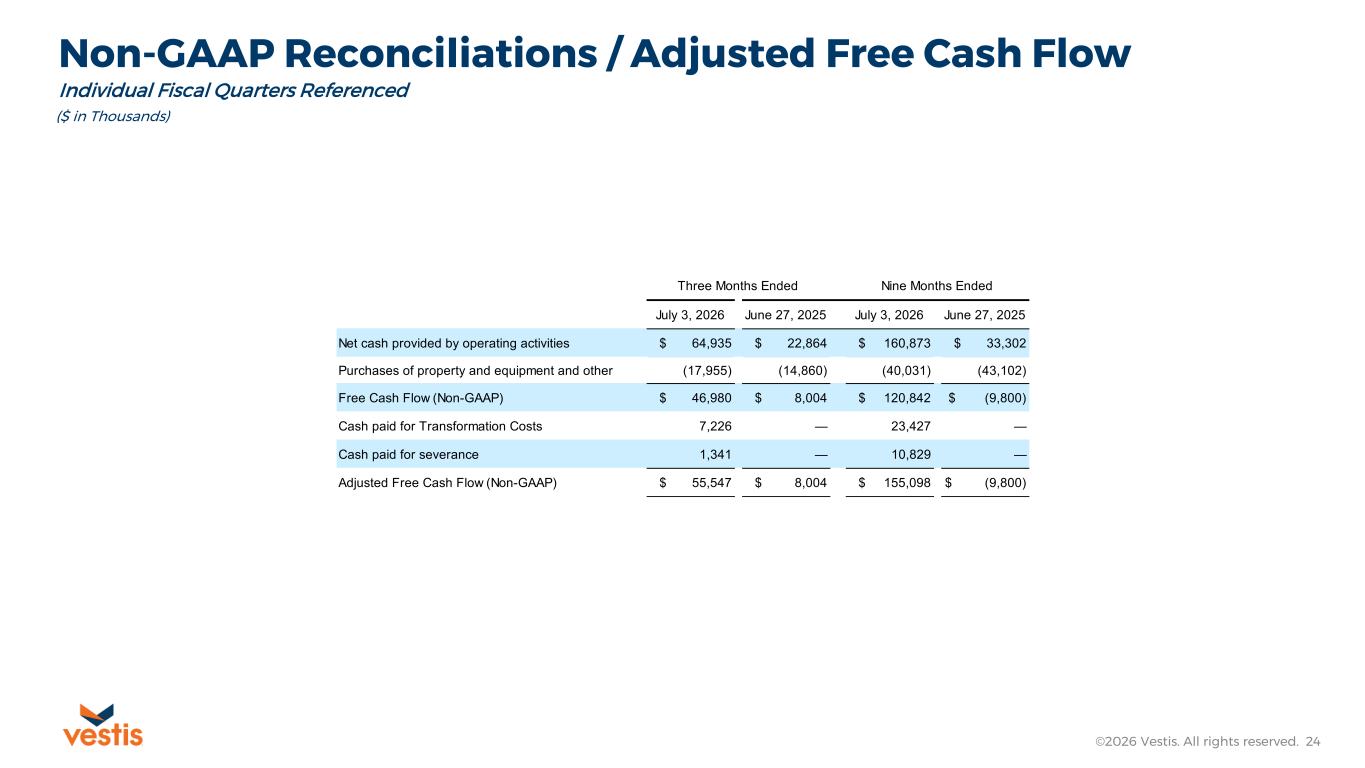
Non-GAAP Reconciliations / Adjusted Free Cash Flow ©2026 Vestis. All rights reserved. 24 ($ in Thousands) Individual Fiscal Quarters Referenced July 3, 2026 June 27, 2025 July 3, 2026 June 27, 2025 Net cash provided by operating activities $ 64,935 $ 22,864 $ 160,873 $ 33,302 Purchases of property and equipment and other (17,955) (14,860) (40,031) (43,102) Free Cash Flow (Non-GAAP) $ 46,980 $ 8,004 $ 120,842 $ (9,800) Cash paid for Transformation Costs 7,226 — 23,427 — Cash paid for severance 1,341 — 10,829 — Adjusted Free Cash Flow (Non-GAAP) $ 55,547 $ 8,004 $ 155,098 $ (9,800) Three Months Ended Nine Months Ended
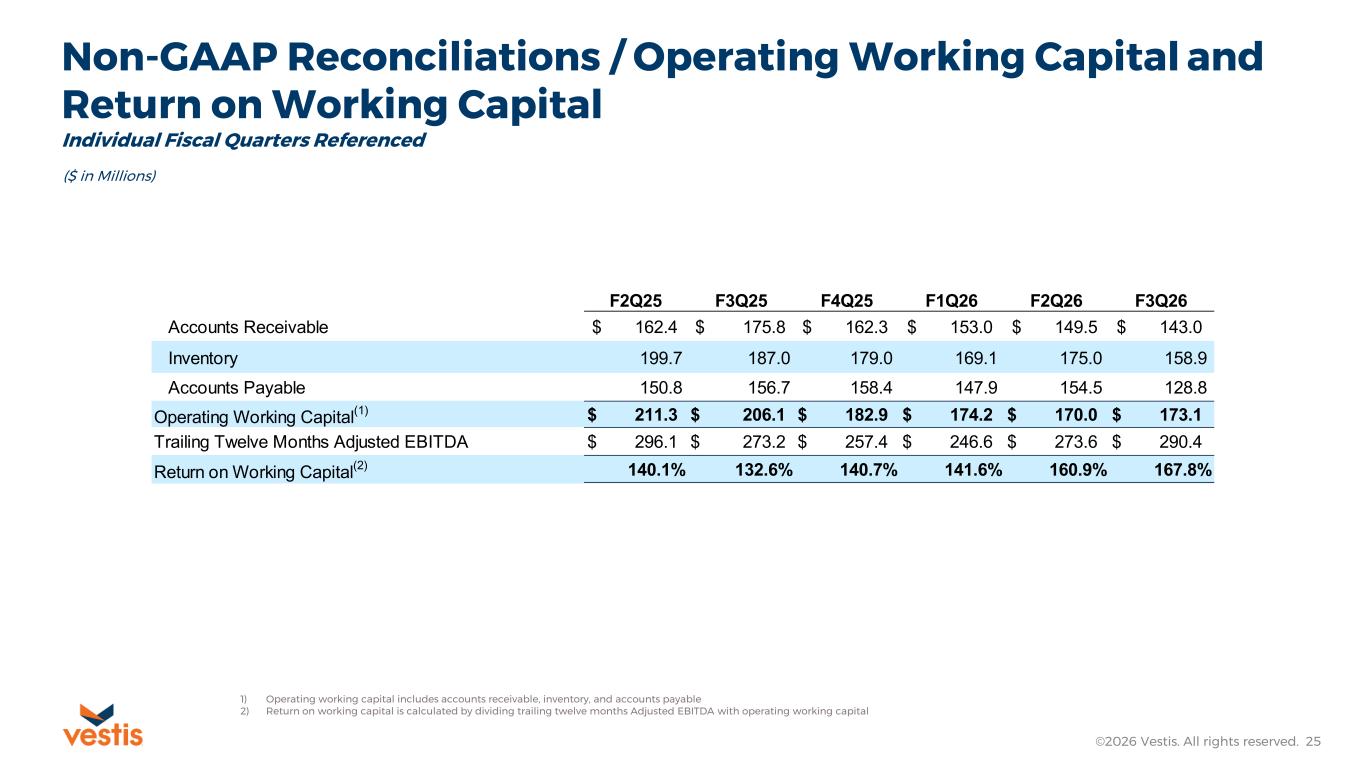
Non-GAAP Reconciliations / Operating Working Capital and Return on Working Capital Individual Fiscal Quarters Referenced ©2026 Vestis. All rights reserved. 25 ($ in Millions) 1) Operating working capital includes accounts receivable, inventory, and accounts payable 2) Return on working capital is calculated by dividing trailing twelve months Adjusted EBITDA with operating working capital F2Q25 F3Q25 F4Q25 F1Q26 F2Q26 F3Q26 Accounts Receivable $ 162.4 $ 175.8 $ 162.3 $ 153.0 $ 149.5 $ 143.0 Inventory 199.7 187.0 179.0 169.1 175.0 158.9 Accounts Payable 150.8 156.7 158.4 147.9 154.5 128.8 Operating Working Capital (1) $ 211.3 $ 206.1 $ 182.9 $ 174.2 $ 170.0 $ 173.1 Trailing Twelve Months Adjusted EBITDA $ 296.1 $ 273.2 $ 257.4 $ 246.6 $ 273.6 $ 290.4 Return on Working Capital (2) 140.1% 132.6% 140.7% 141.6% 160.9% 167.8%
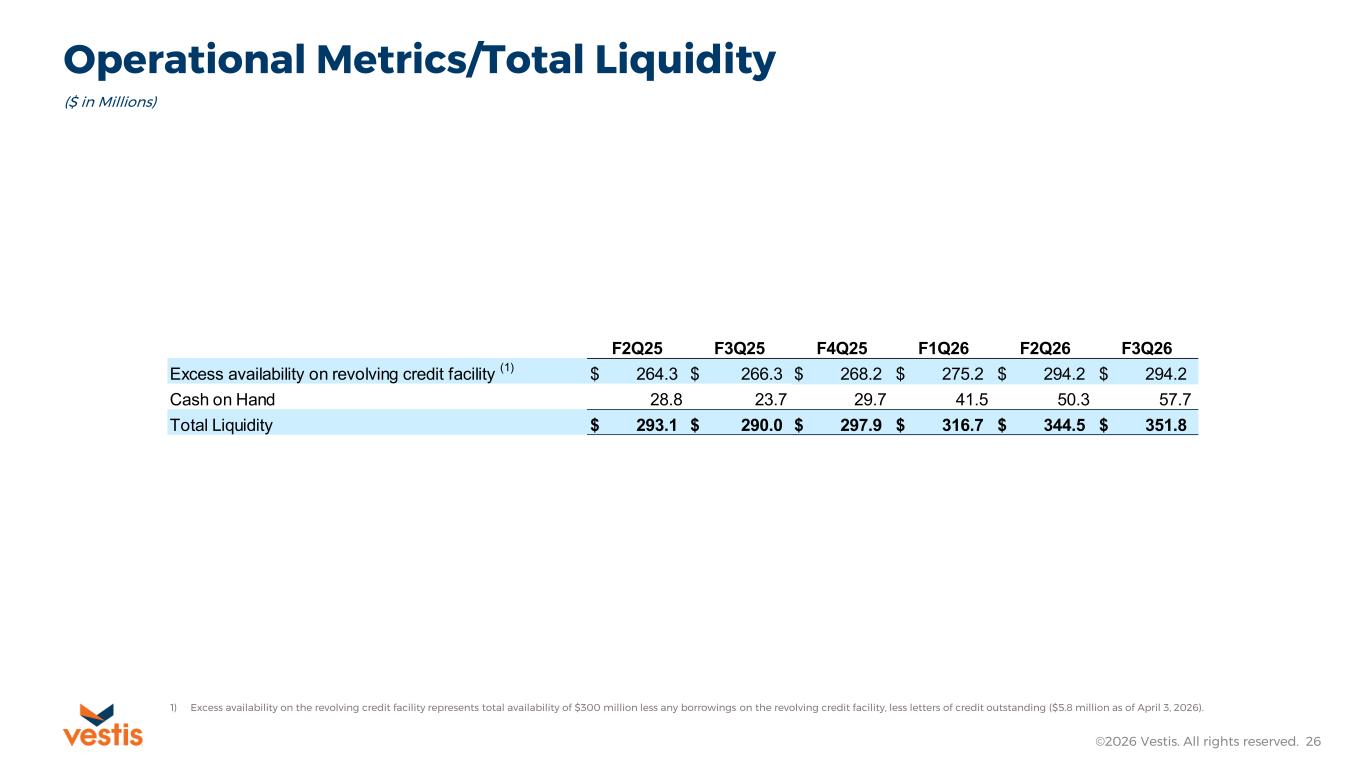
Operational Metrics/Total Liquidity ©2026 Vestis. All rights reserved. 26 ($ in Millions) 1) Excess availability on the revolving credit facility represents total availability of $300 million less any borrowings on the revolving credit facility, less letters of credit outstanding ($5.8 million as of April 3, 2026). F2Q25 F3Q25 F4Q25 F1Q26 F2Q26 F3Q26 Excess availability on revolving credit facility (1) $ 264.3 $ 266.3 $ 268.2 $ 275.2 $ 294.2 $ 294.2 Cash on Hand 28.8 23.7 29.7 41.5 50.3 57.7 Total Liquidity $ 293.1 $ 290.0 $ 297.9 $ 316.7 $ 344.5 $ 351.8
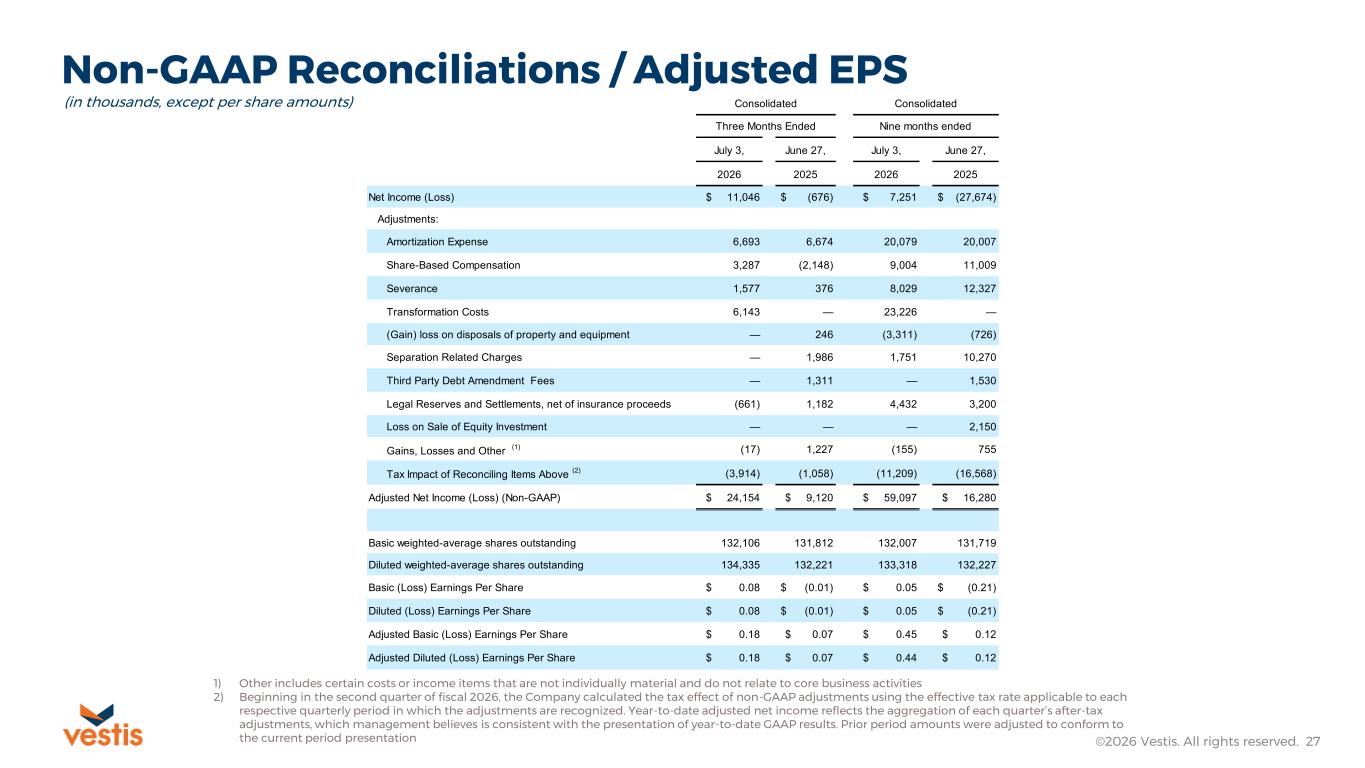
Non-GAAP Reconciliations / Adjusted EPS ©2026 Vestis. All rights reserved. 27 1) Other includes certain costs or income items that are not individually material and do not relate to core business activities 2) Beginning in the second quarter of fiscal 2026, the Company calculated the tax effect of non-GAAP adjustments using the effective tax rate applicable to each respective quarterly period in which the adjustments are recognized. Year-to-date adjusted net income reflects the aggregation of each quarter’s after-tax adjustments, which management believes is consistent with the presentation of year-to-date GAAP results. Prior period amounts were adjusted to conform to the current period presentation (in thousands, except per share amounts) July 3, June 27, July 3, June 27, 2026 2025 2026 2025 Net Income (Loss) $ 11,046 $ (676) $ 7,251 $ (27,674) Adjustments: Amortization Expense 6,693 6,674 20,079 20,007 Share-Based Compensation 3,287 (2,148) 9,004 11,009 Severance 1,577 376 8,029 12,327 Transformation Costs 6,143 — 23,226 — (Gain) loss on disposals of property and equipment — 246 (3,311) (726) Separation Related Charges — 1,986 1,751 10,270 Third Party Debt Amendment Fees — 1,311 — 1,530 Legal Reserves and Settlements, net of insurance proceeds (661) 1,182 4,432 3,200 Loss on Sale of Equity Investment — — — 2,150 Gains, Losses and Other (1) (17) 1,227 (155) 755 Tax Impact of Reconciling Items Above (2) (3,914) (1,058) (11,209) (16,568) Adjusted Net Income (Loss) (Non-GAAP) $ 24,154 $ 9,120 $ 59,097 $ 16,280 Basic weighted-average shares outstanding 132,106 131,812 132,007 131,719 Diluted weighted-average shares outstanding 134,335 132,221 133,318 132,227 Basic (Loss) Earnings Per Share $ 0.08 $ (0.01) $ 0.05 $ (0.21) Diluted (Loss) Earnings Per Share $ 0.08 $ (0.01) $ 0.05 $ (0.21) Adjusted Basic (Loss) Earnings Per Share $ 0.18 $ 0.07 $ 0.45 $ 0.12 Adjusted Diluted (Loss) Earnings Per Share $ 0.18 $ 0.07 $ 0.44 $ 0.12 Consolidated Consolidated Three Months Ended Nine months ended
©2026 Vestis. All rights reserved.