
Second Quarter 2026 Varagon Capital Corporation Earnings Presentation © Man 2025
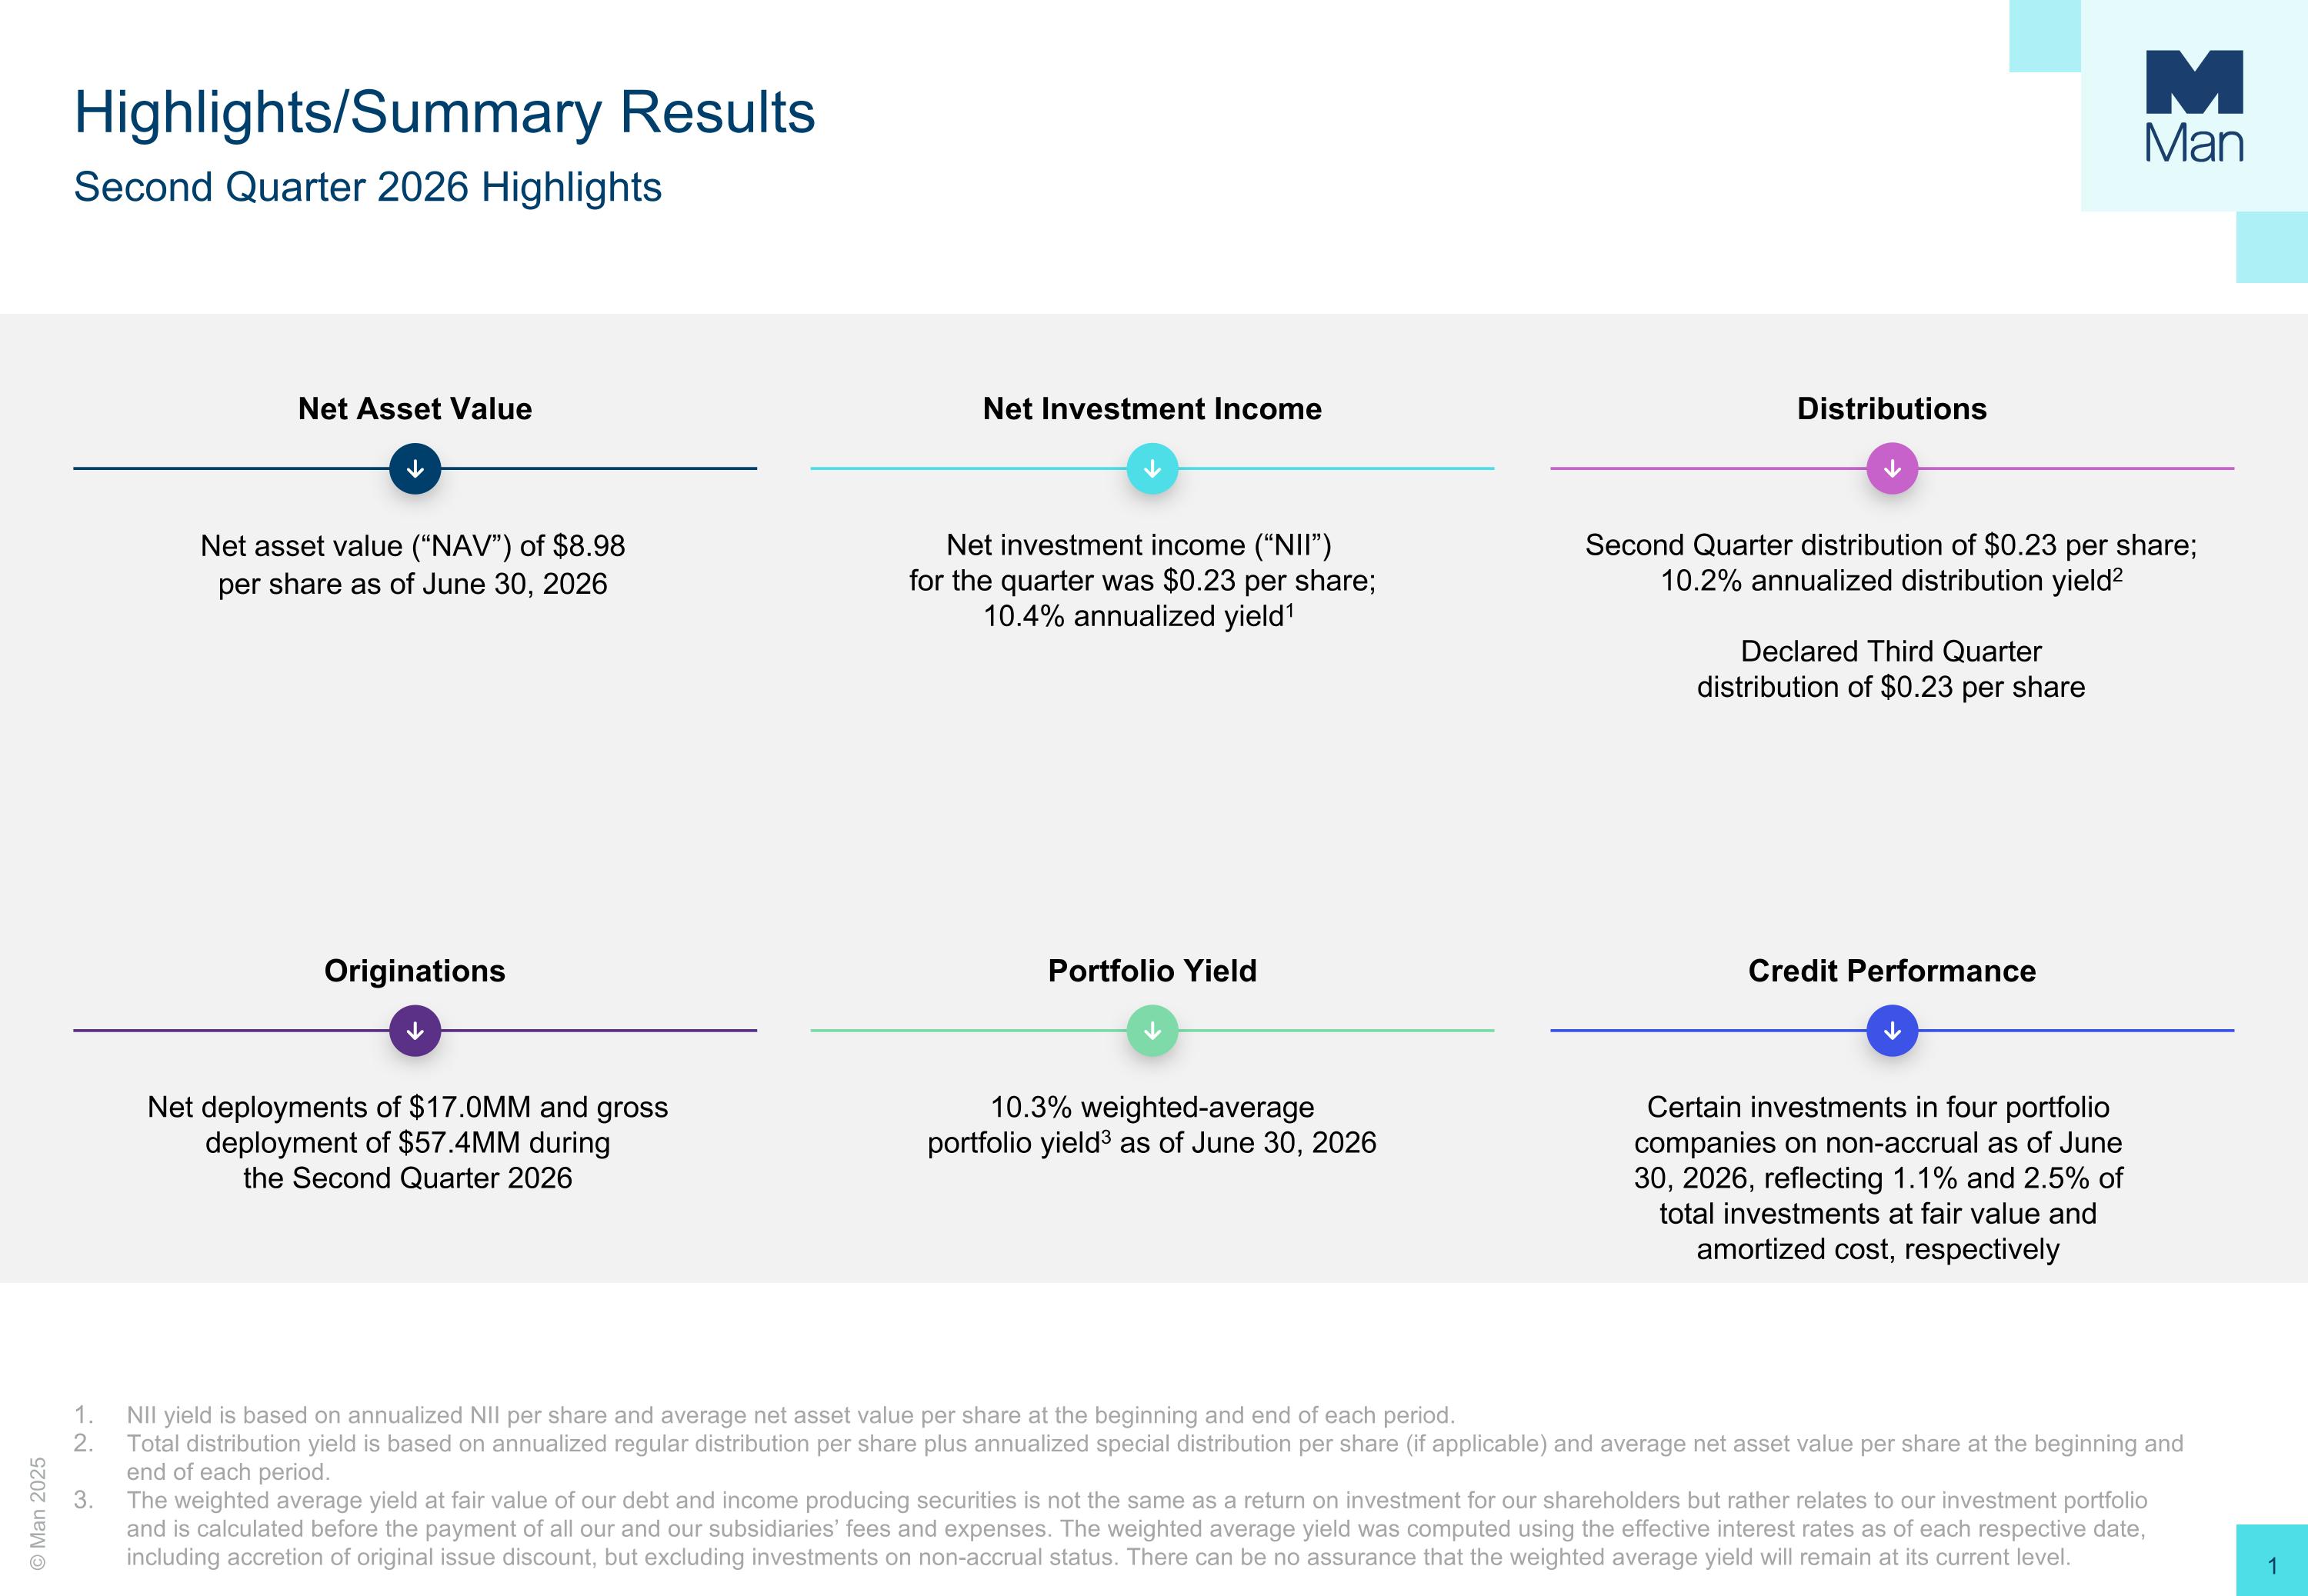
Highlights/Summary Results Second Quarter 2026 Highlights NII yield is based on annualized NII per share and average net asset value per share at the beginning and end of each period. Total distribution yield is based on annualized regular distribution per share plus annualized special distribution per share (if applicable) and average net asset value per share at the beginning and end of each period. The weighted average yield at fair value of our debt and income producing securities is not the same as a return on investment for our shareholders but rather relates to our investment portfolio and is calculated before the payment of all our and our subsidiaries’ fees and expenses. The weighted average yield was computed using the effective interest rates as of each respective date, including accretion of original issue discount, but excluding investments on non-accrual status. There can be no assurance that the weighted average yield will remain at its current level. Distributions Net asset value (“NAV”) of $8.98 per share as of June 30, 2026 Net investment income (“NII”) for the quarter was $0.23 per share; 10.4% annualized yield1 Second Quarter distribution of $0.23 per share; 10.2% annualized distribution yield2 Declared Third Quarter distribution of $0.23 per share Portfolio Yield Credit Performance Net deployments of $17.0MM and gross deployment of $57.4MM during the Second Quarter 2026 10.3% weighted-average portfolio yield3 as of June 30, 2026 Certain investments in four portfolio companies on non-accrual as of June 30, 2026, reflecting 1.1% and 2.5% of total investments at fair value and amortized cost, respectively Net Asset Value Net Investment Income Originations
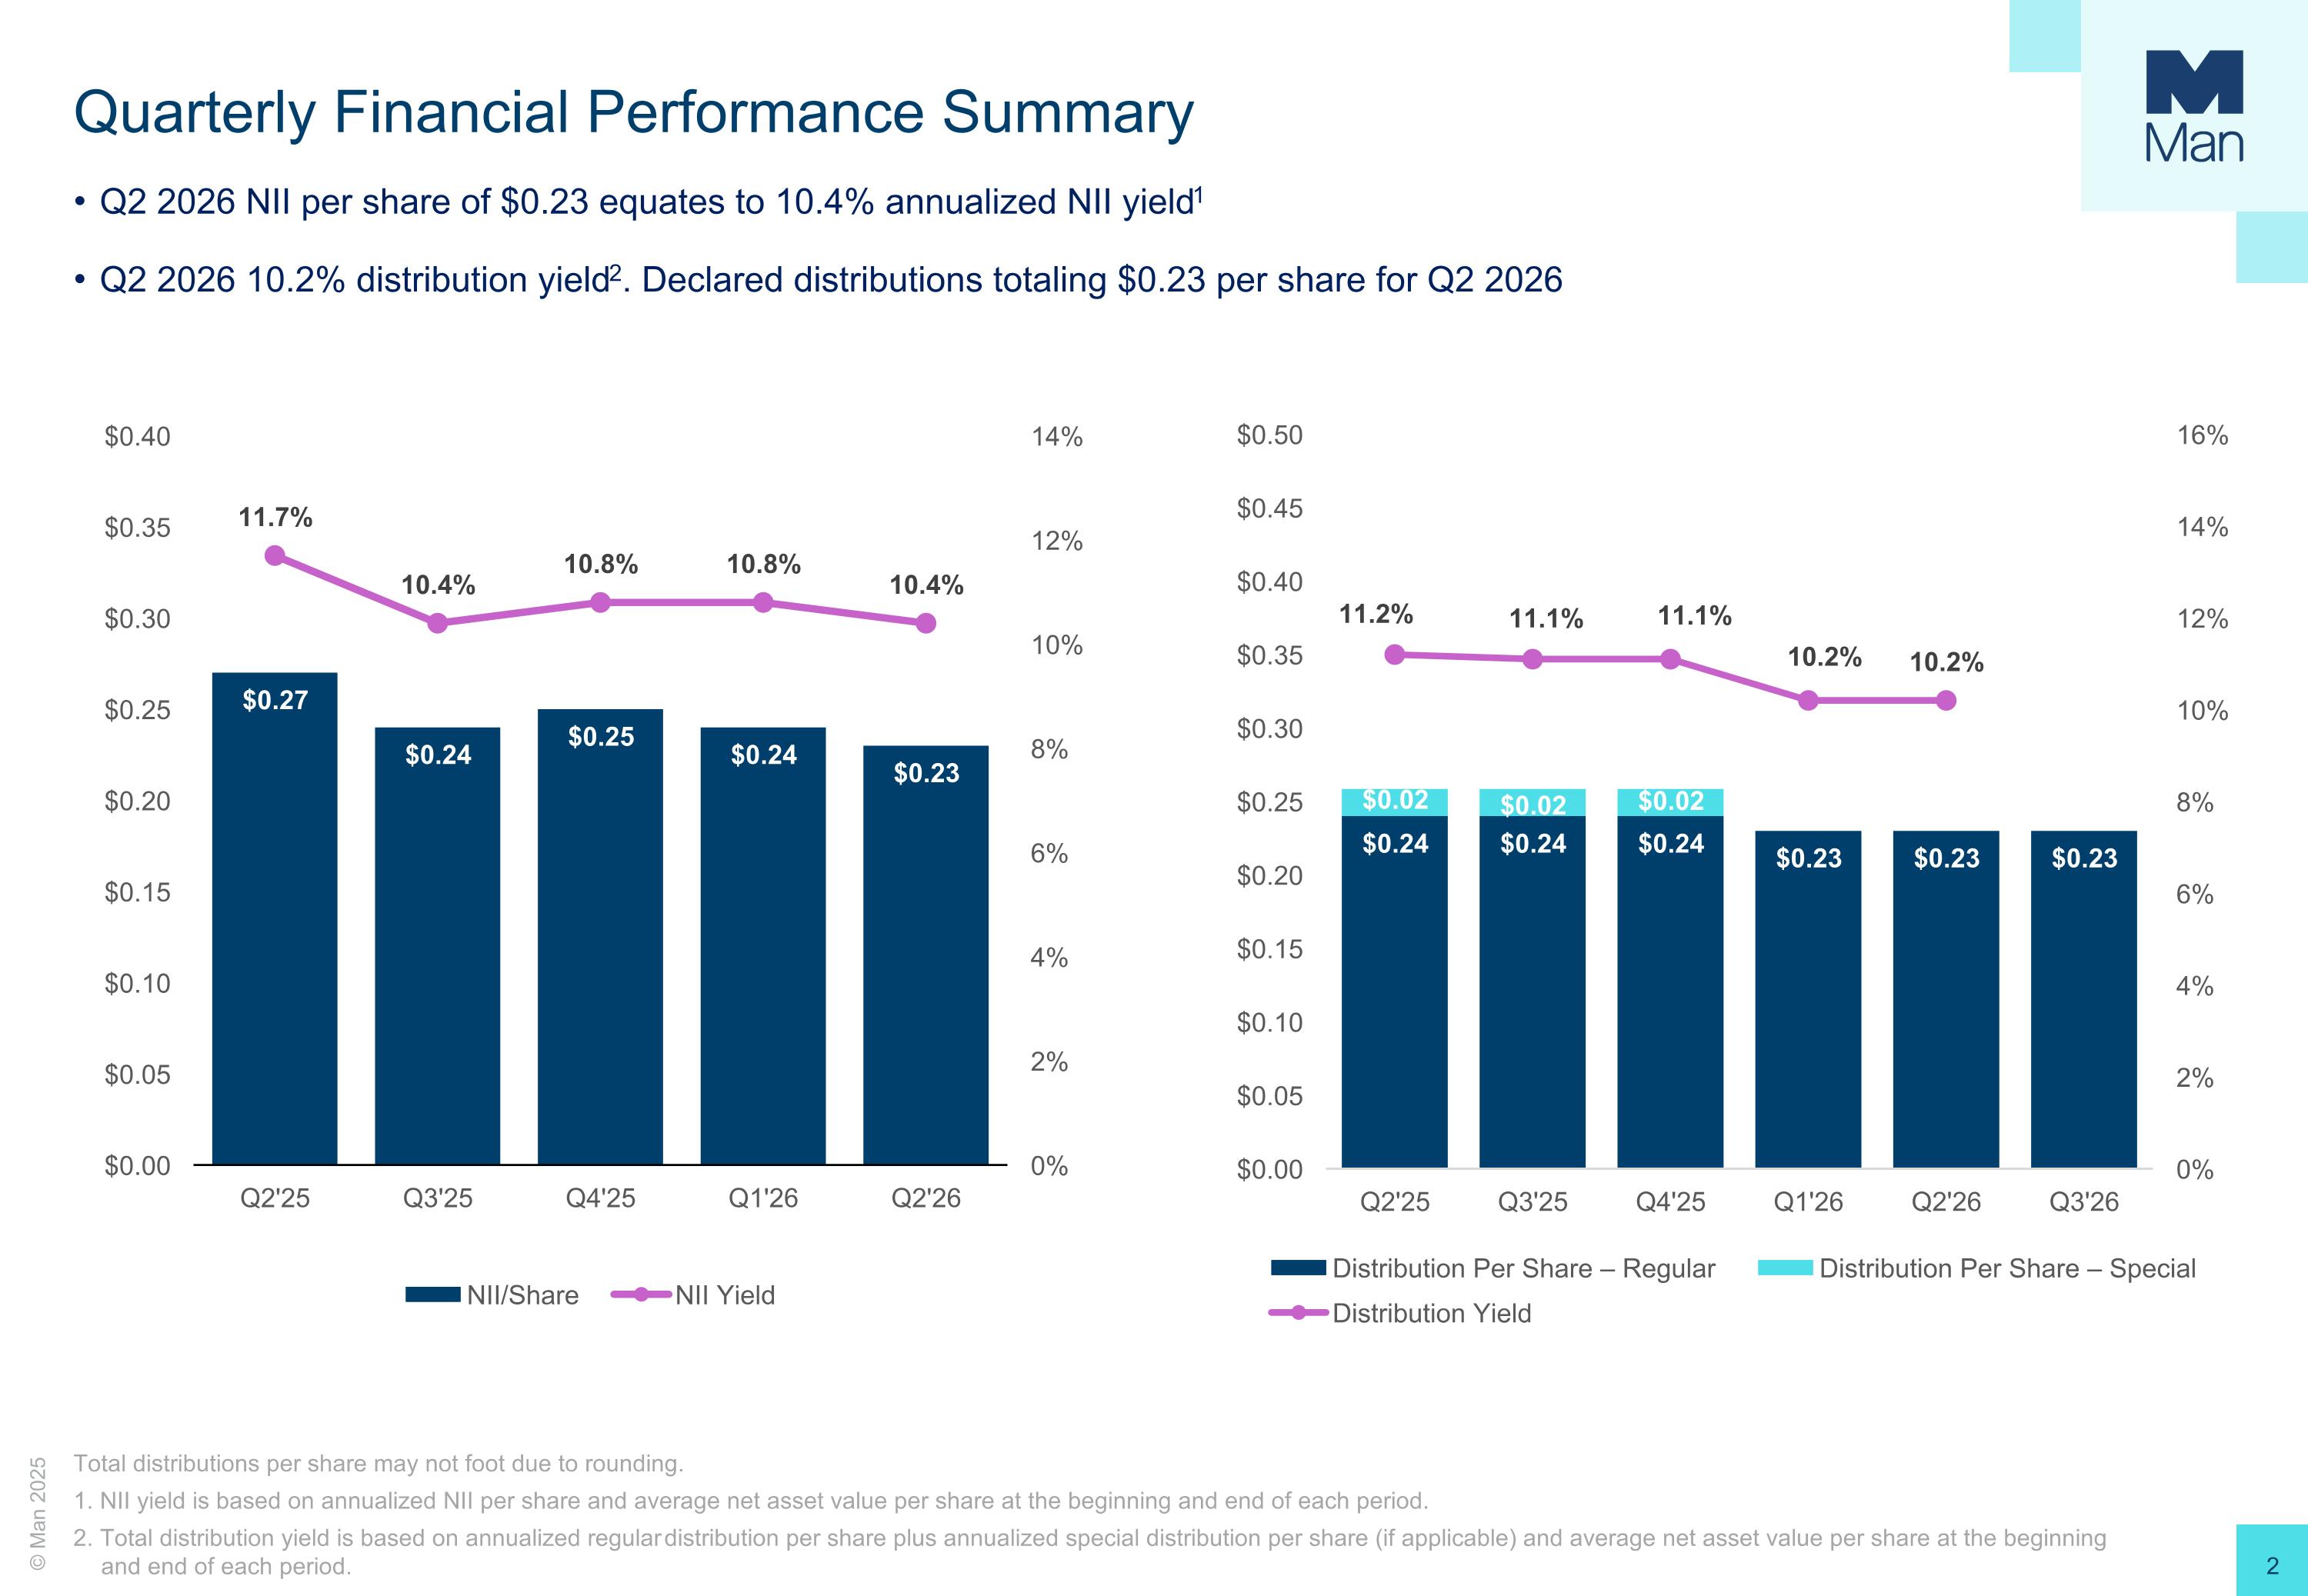
Total distributions per share may not foot due to rounding. 1. NII yield is based on annualized NII per share and average net asset value per share at the beginning and end of each period. 2. Total distribution yield is based on annualized regular distribution per share plus annualized special distribution per share (if applicable) and average net asset value per share at the beginning and end of each period. Quarterly Financial Performance Summary Q2 2026 NII per share of $0.23 equates to 10.4% annualized NII yield1 Q2 2026 10.2% distribution yield2. Declared distributions totaling $0.23 per share for Q2 2026
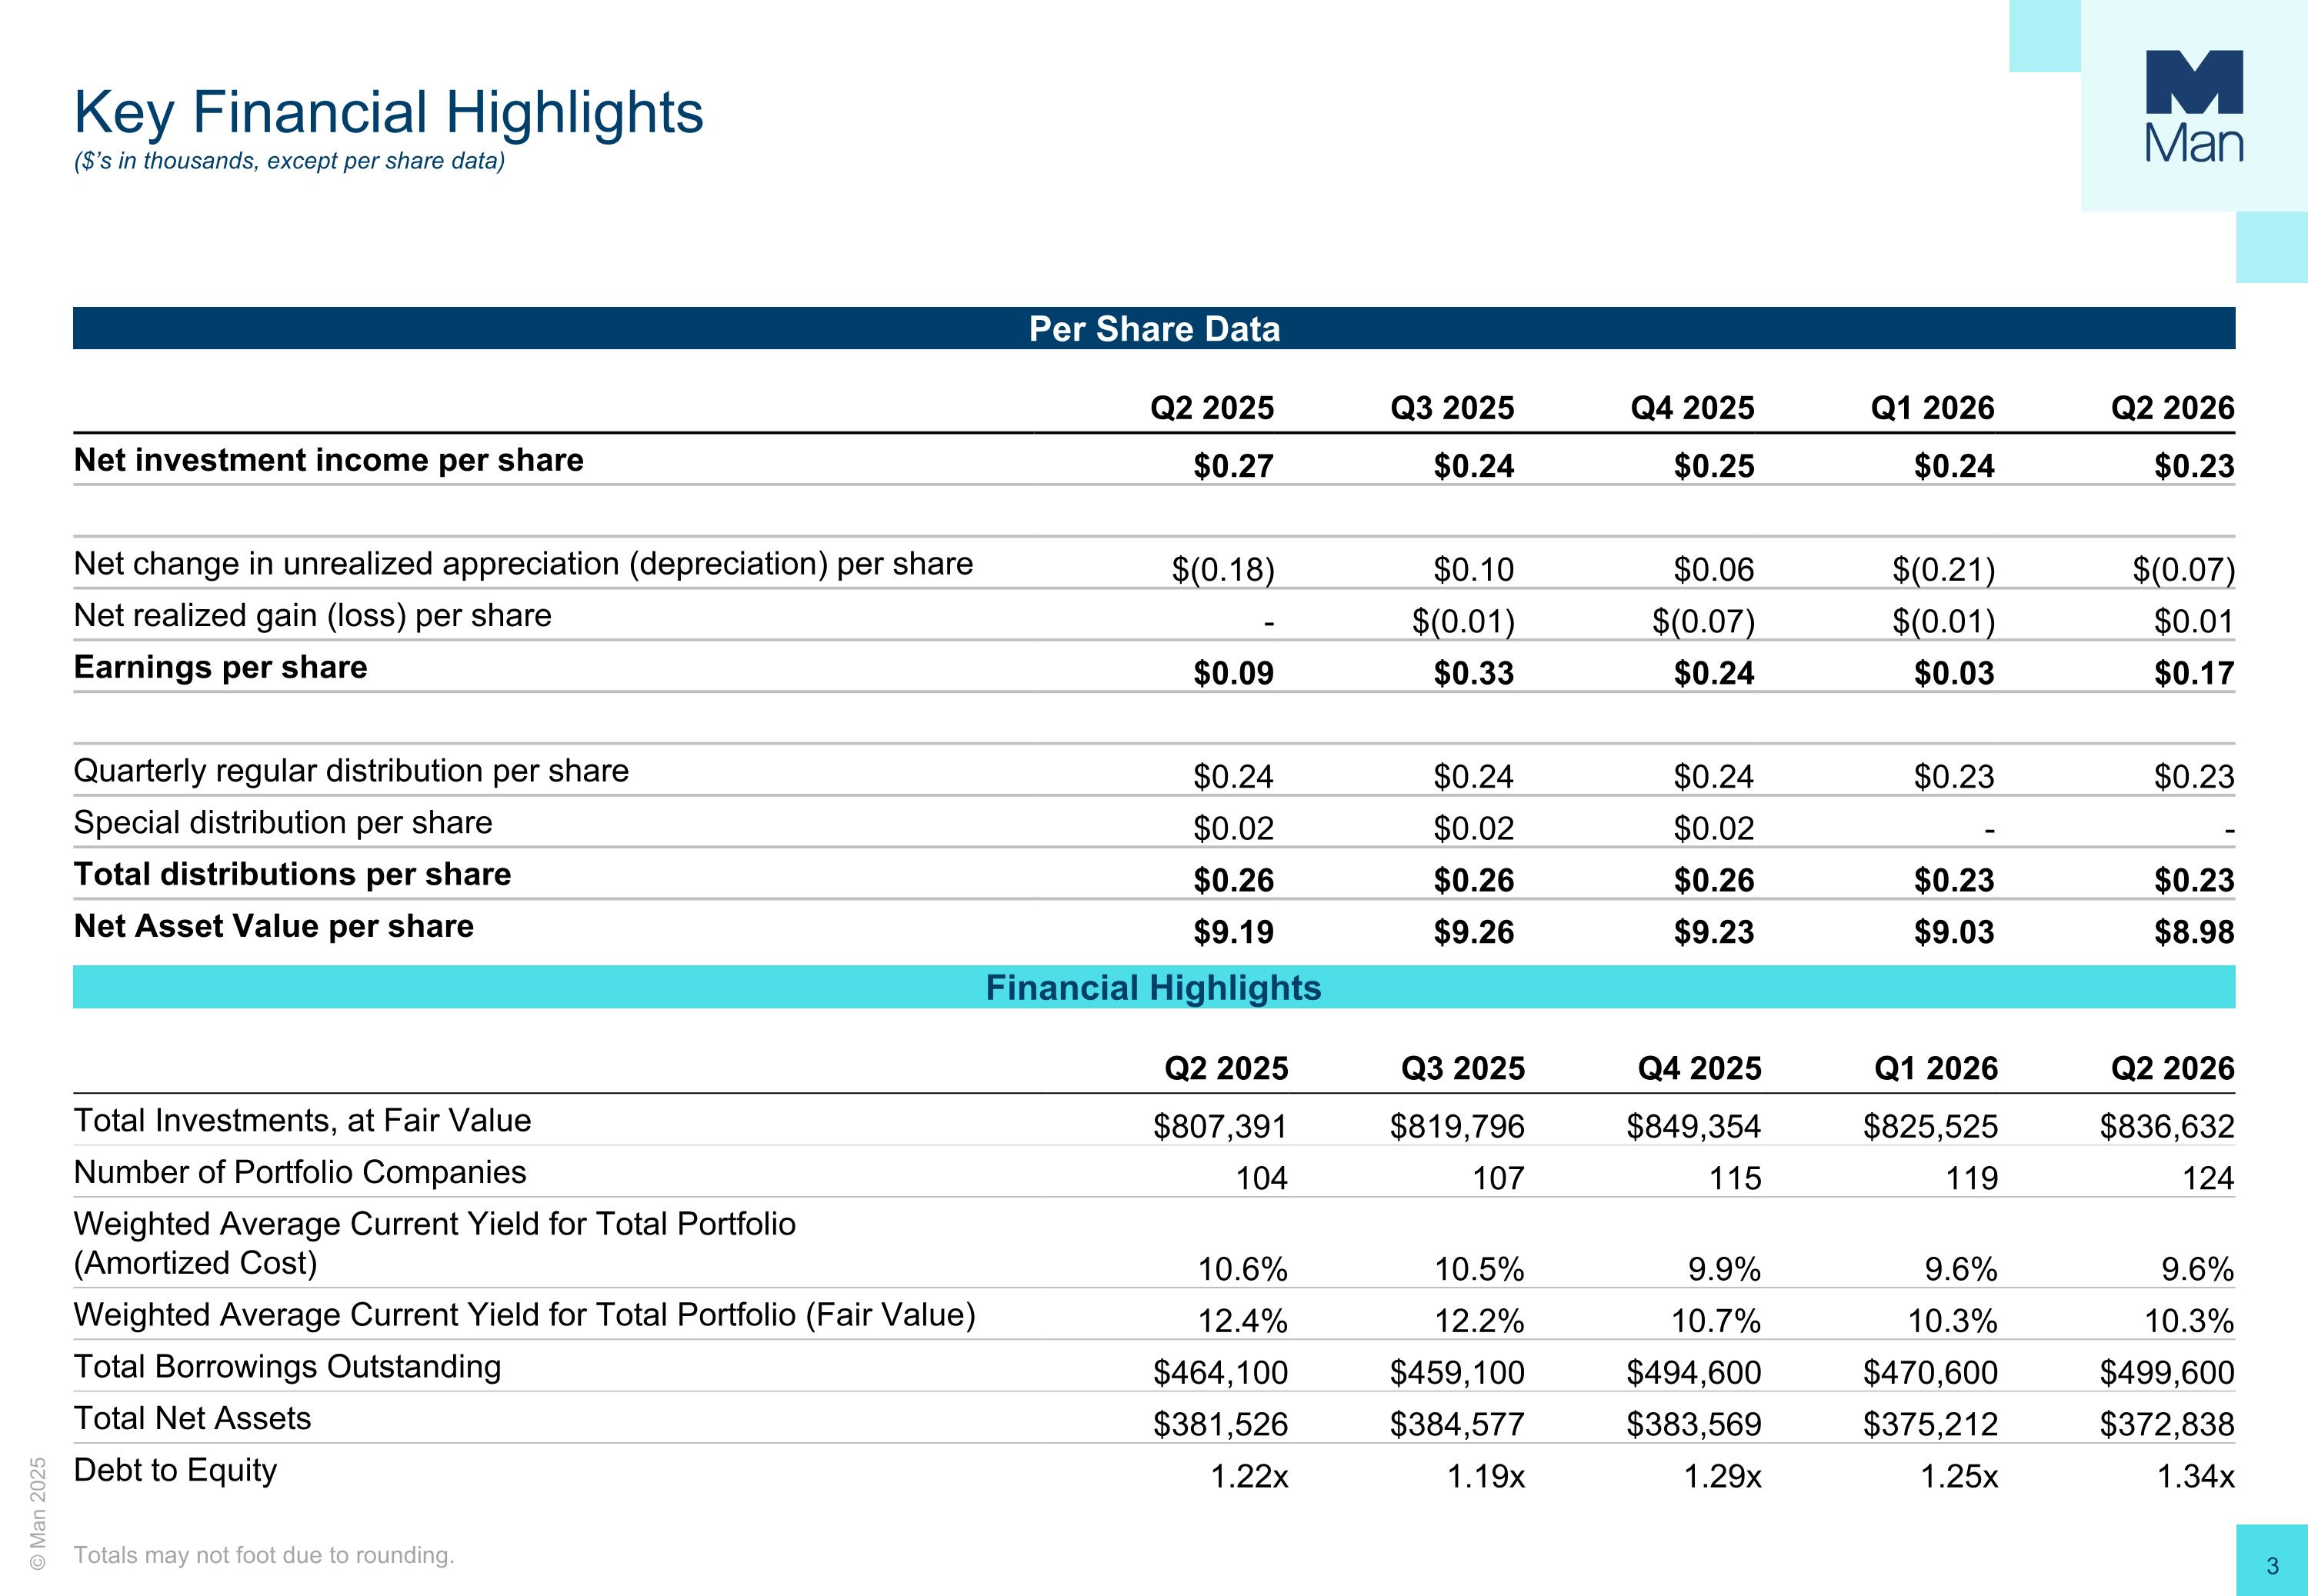
Key Financial Highlights ($’s in thousands, except per share data) Totals may not foot due to rounding. Per Share Data Financial Highlights Q2 2025 Q3 2025 Q4 2025 Q1 2026 Q2 2026 Net investment income per share $0.27 $0.24 $0.25 $0.24 $0.23 Net change in unrealized appreciation (depreciation) per share $(0.18) $0.10 $0.06 $(0.21) $(0.07) Net realized gain (loss) per share - $(0.01) $(0.07) $(0.01) $0.01 Earnings per share $0.09 $0.33 $0.24 $0.03 $0.17 Quarterly regular distribution per share $0.24 $0.24 $0.24 $0.23 $0.23 Special distribution per share $0.02 $0.02 $0.02 - - Total distributions per share $0.26 $0.26 $0.26 $0.23 $0.23 Net Asset Value per share $9.19 $9.26 $9.23 $9.03 $8.98 Q2 2025 Q3 2025 Q4 2025 Q1 2026 Q2 2026 Total Investments, at Fair Value $807,391 $819,796 $849,354 $825,525 $836,632 Number of Portfolio Companies 104 107 115 119 124 Weighted Average Current Yield for Total Portfolio (Amortized Cost) 10.6% 10.5% 9.9% 9.6% 9.6% Weighted Average Current Yield for Total Portfolio (Fair Value) 12.4% 12.2% 10.7% 10.3% 10.3% Total Borrowings Outstanding $464,100 $459,100 $494,600 $470,600 $499,600 Total Net Assets $381,526 $384,577 $383,569 $375,212 $372,838 Debt to Equity 1.22x 1.19x 1.29x 1.25x 1.34x
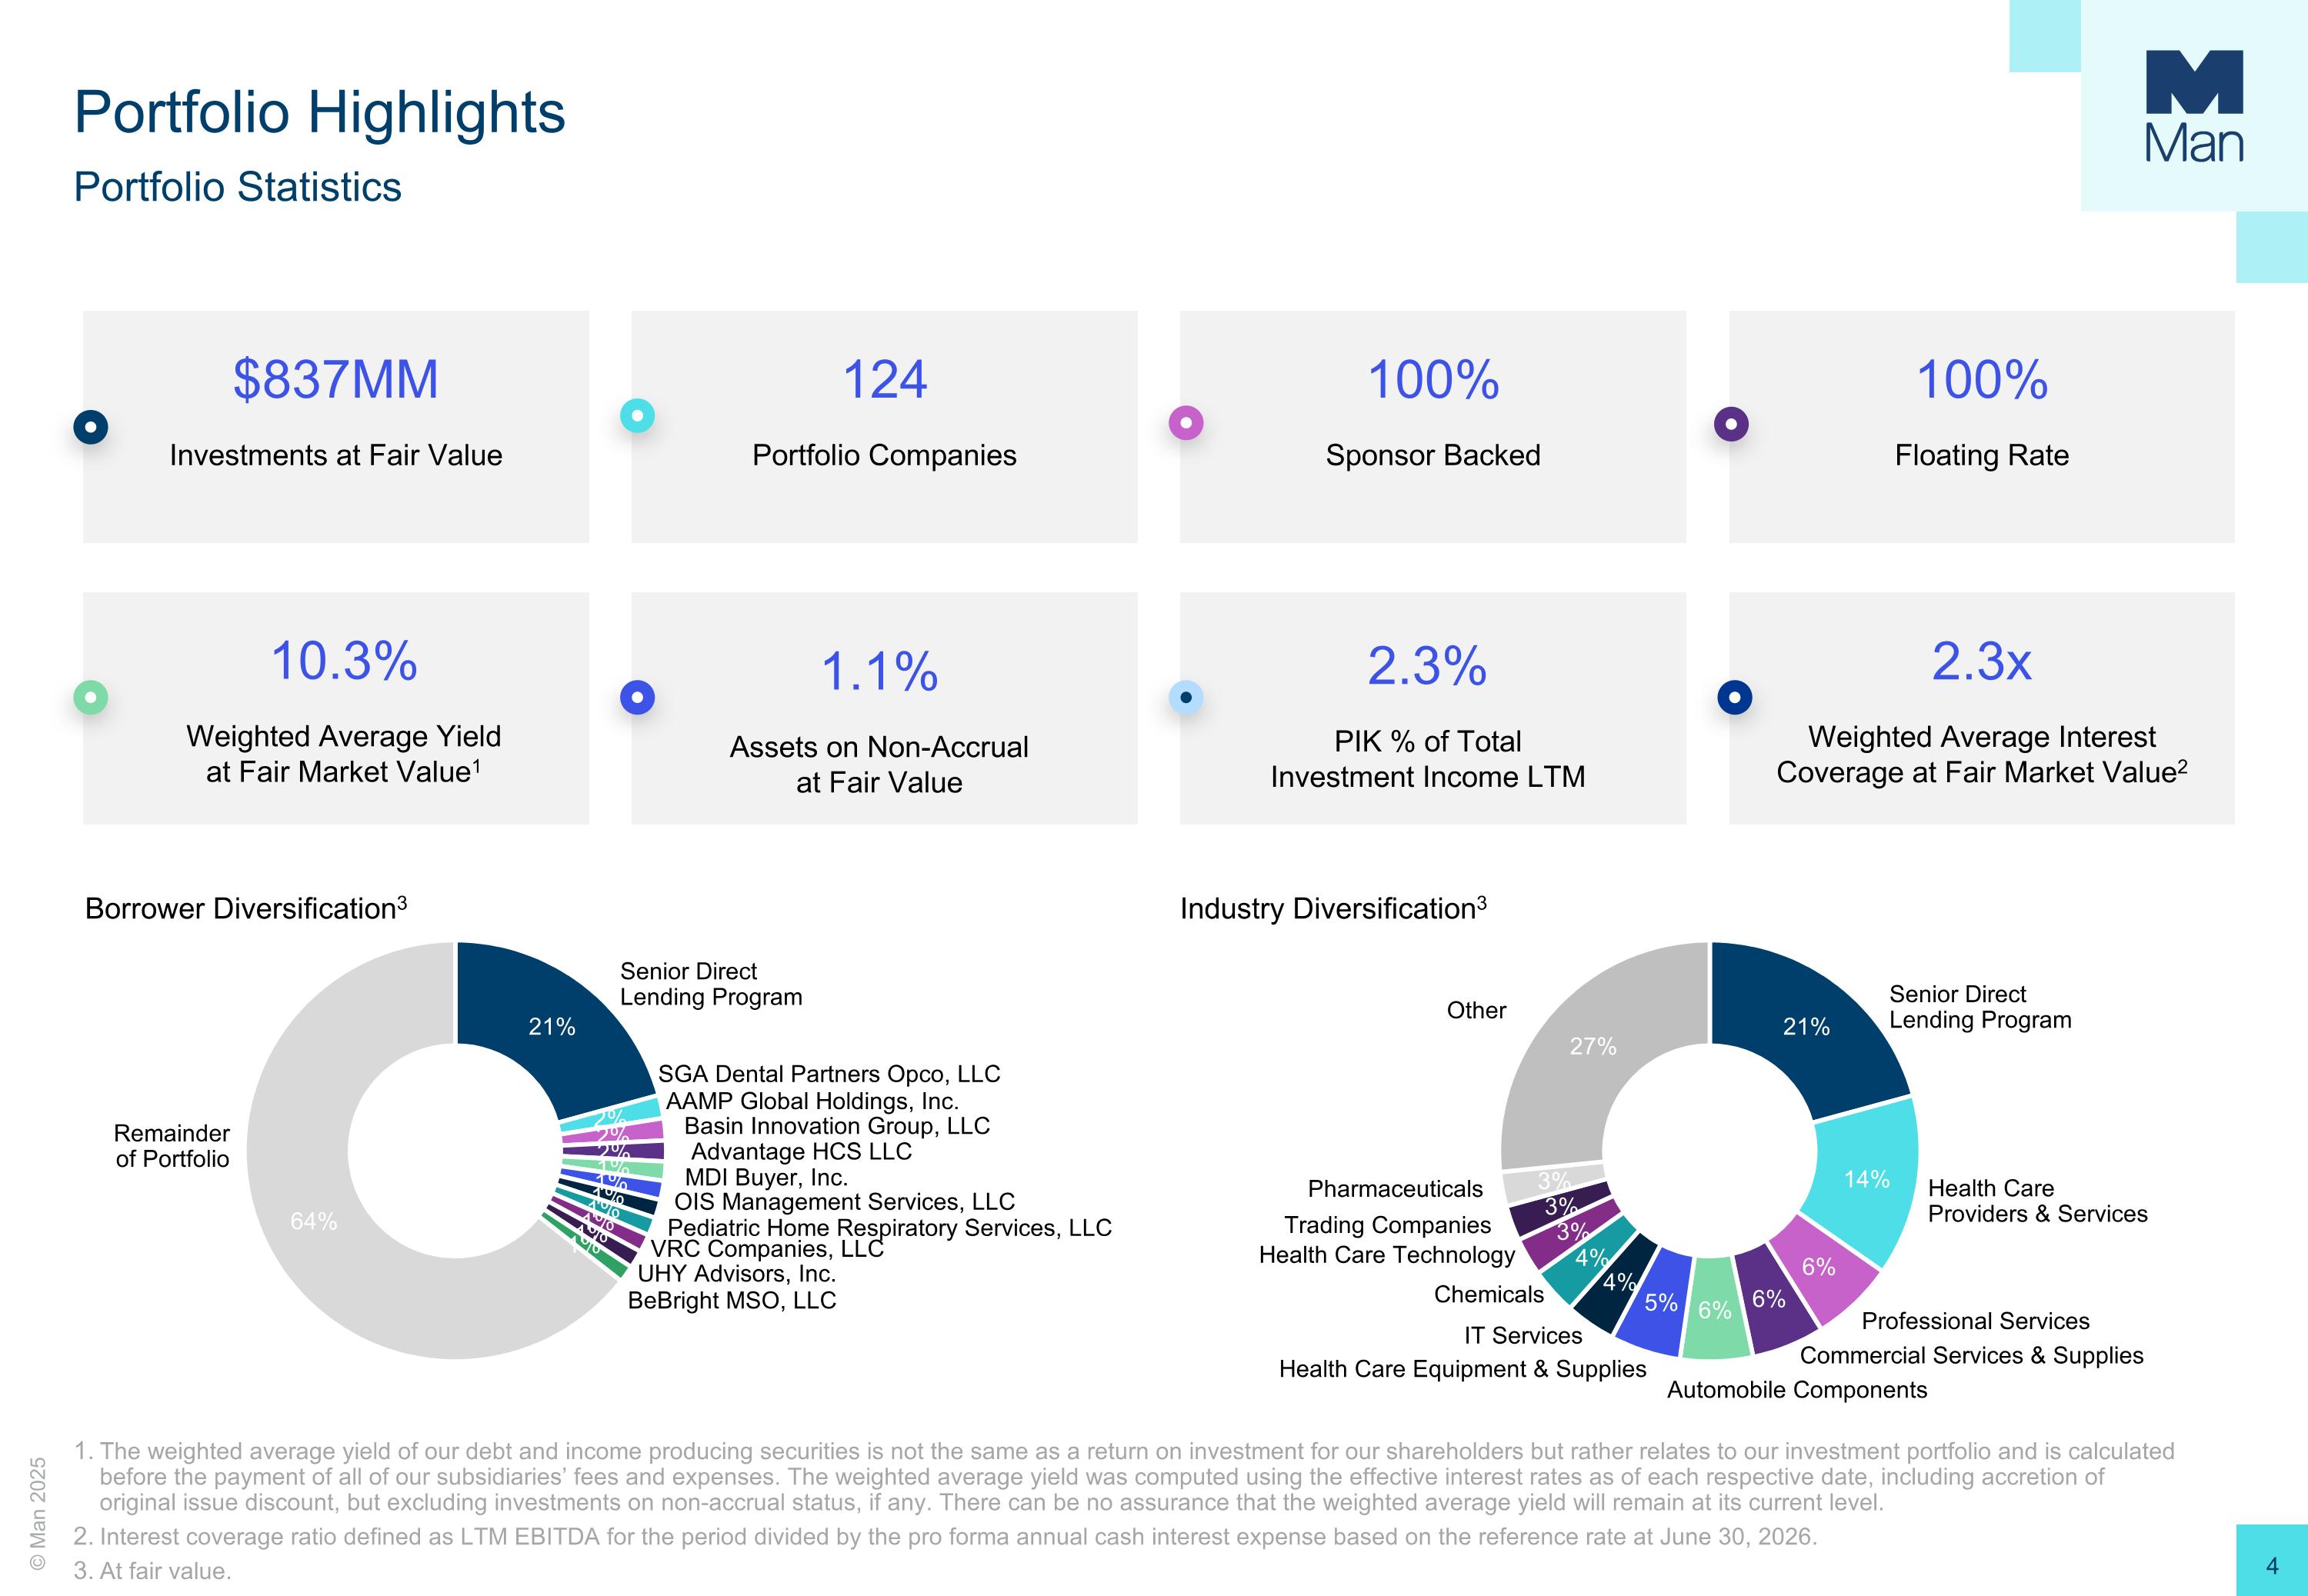
Portfolio Highlights Portfolio Statistics $837MM Investments at Fair Value 124 Portfolio Companies 100% Sponsor Backed 100% Floating Rate 2.3% PIK % of Total Investment Income LTM 1.1% Assets on Non-Accrual at Fair Value 2.3x Weighted Average Interest Coverage at Fair Market Value2 The weighted average yield of our debt and income producing securities is not the same as a return on investment for our shareholders but rather relates to our investment portfolio and is calculated before the payment of all of our subsidiaries’ fees and expenses. The weighted average yield was computed using the effective interest rates as of each respective date, including accretion of original issue discount, but excluding investments on non-accrual status, if any. There can be no assurance that the weighted average yield will remain at its current level. Interest coverage ratio defined as LTM EBITDA for the period divided by the pro forma annual cash interest expense based on the reference rate at June 30, 2026. At fair value. Borrower Diversification3 Senior Direct Lending Program BeBright MSO, LLC SGA Dental Partners Opco, LLC AAMP Global Holdings, Inc. Advantage HCS LLC VRC Companies, LLC Pediatric Home Respiratory Services, LLC Basin Innovation Group, LLC MDI Buyer, Inc. OIS Management Services, LLC UHY Advisors, Inc. Remainder of Portfolio Industry Diversification3 Other Senior Direct Lending Program Health Care Providers & Services Professional Services Health Care Equipment & Supplies Health Care Technology Chemicals Automobile Components Trading Companies Commercial Services & Supplies 10.3% Weighted Average Yield at Fair Market Value1 IT Services Pharmaceuticals
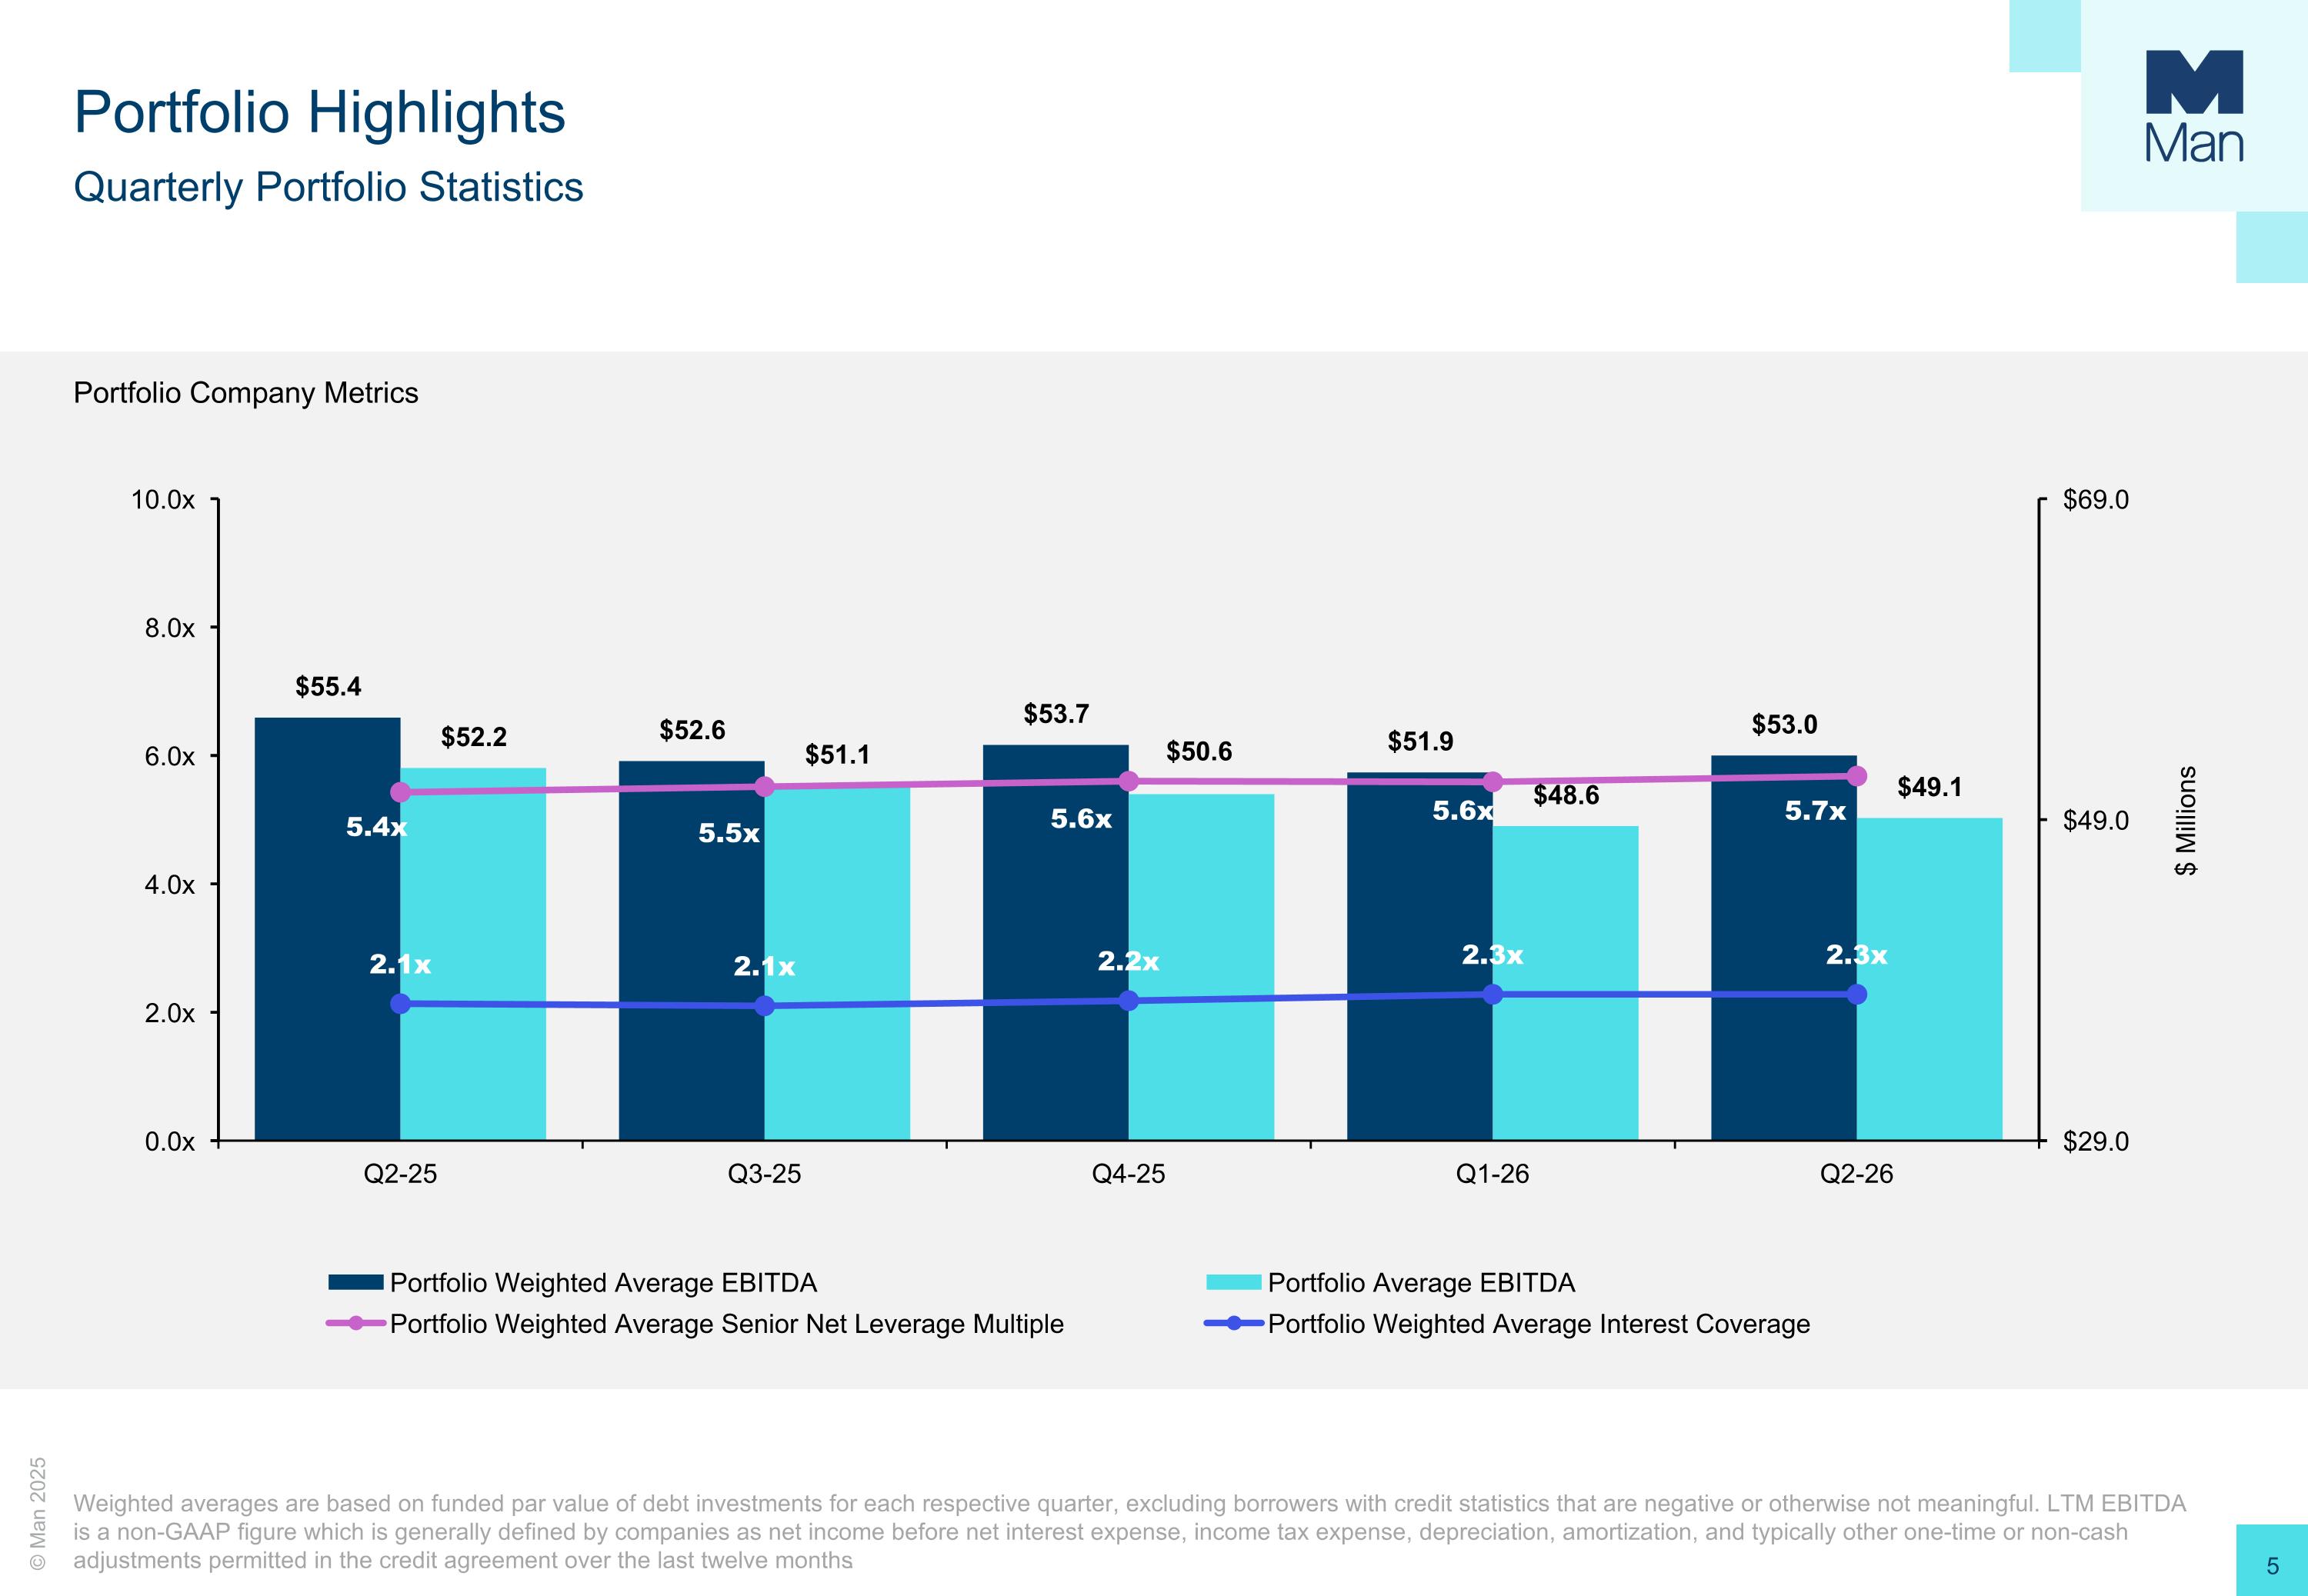
Portfolio Highlights Quarterly Portfolio Statistics Weighted averages are based on funded par value of debt investments for each respective quarter, excluding borrowers with credit statistics that are negative or otherwise not meaningful. LTM EBITDA is a non-GAAP figure which is generally defined by companies as net income before net interest expense, income tax expense, depreciation, amortization, and typically other one-time or non-cash adjustments permitted in the credit agreement over the last twelve months. $ Millions Portfolio Company Metrics
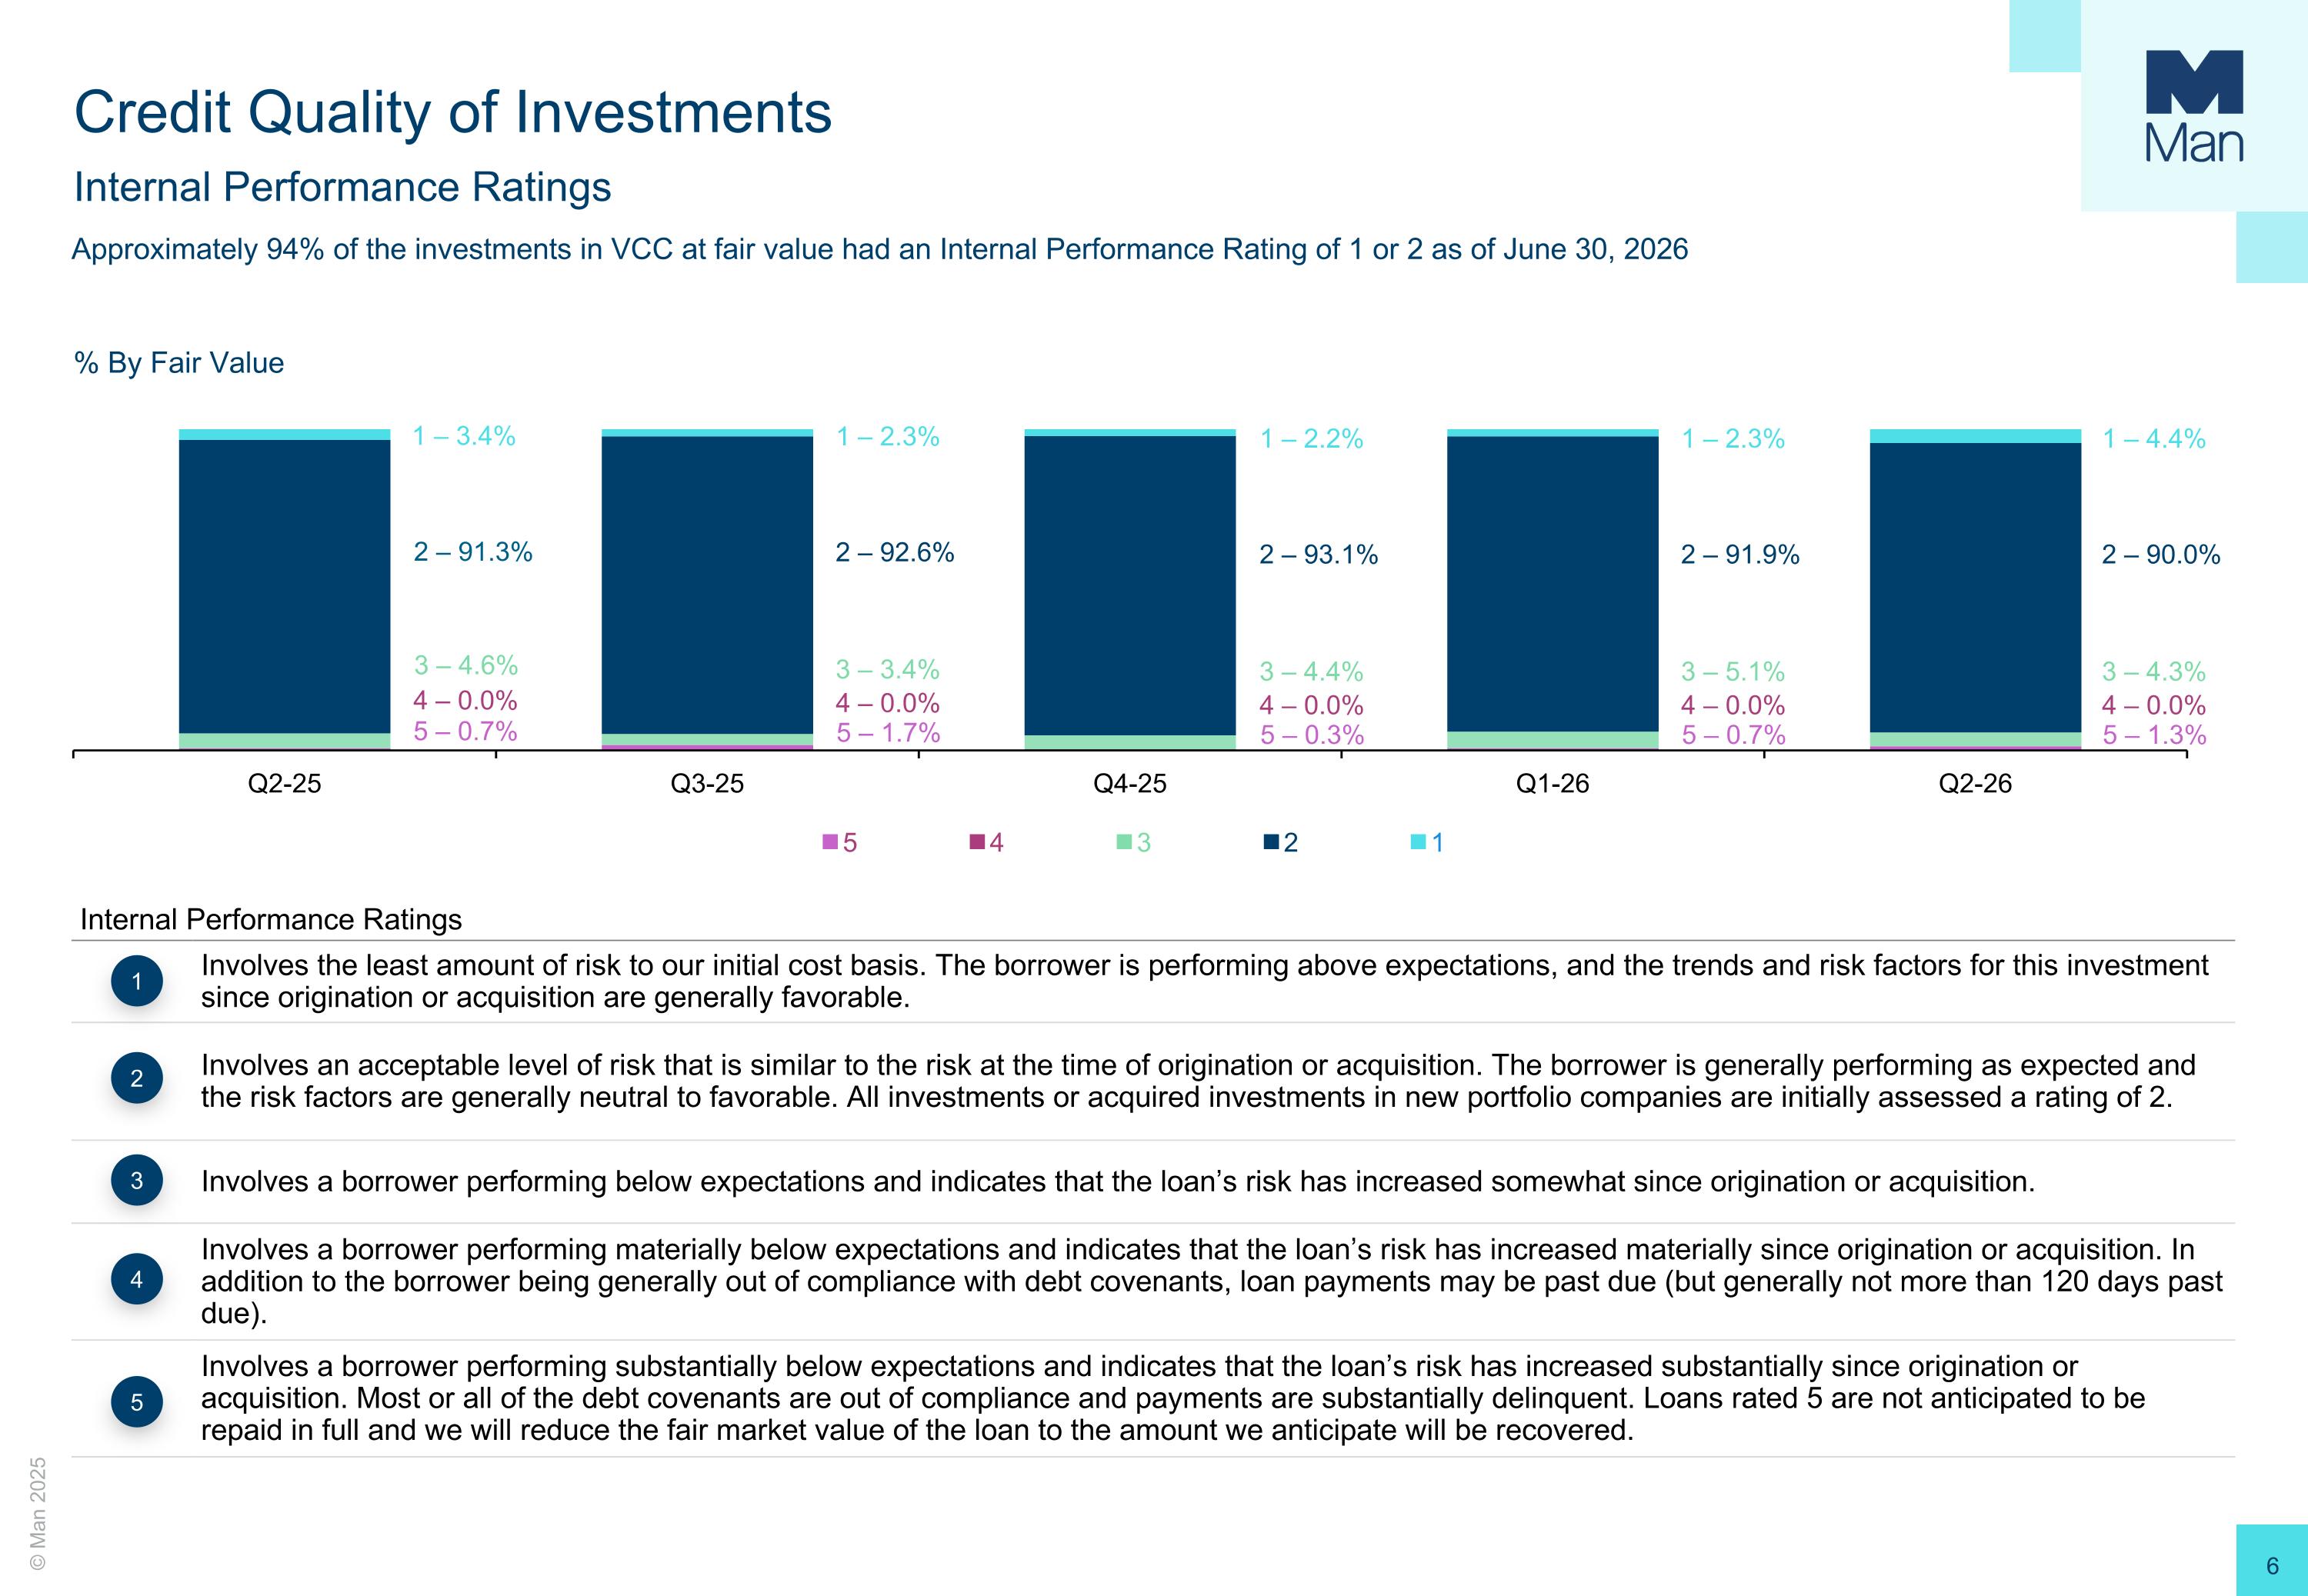
Credit Quality of Investments Internal Performance Ratings Internal Performance Ratings Involves the least amount of risk to our initial cost basis. The borrower is performing above expectations, and the trends and risk factors for this investment since origination or acquisition are generally favorable. Involves an acceptable level of risk that is similar to the risk at the time of origination or acquisition. The borrower is generally performing as expected and the risk factors are generally neutral to favorable. All investments or acquired investments in new portfolio companies are initially assessed a rating of 2. Involves a borrower performing below expectations and indicates that the loan’s risk has increased somewhat since origination or acquisition. Involves a borrower performing materially below expectations and indicates that the loan’s risk has increased materially since origination or acquisition. In addition to the borrower being generally out of compliance with debt covenants, loan payments may be past due (but generally not more than 120 days past due). Involves a borrower performing substantially below expectations and indicates that the loan’s risk has increased substantially since origination or acquisition. Most or all of the debt covenants are out of compliance and payments are substantially delinquent. Loans rated 5 are not anticipated to be repaid in full and we will reduce the fair market value of the loan to the amount we anticipate will be recovered. 1 2 3 4 5 1 – 3.4% 2 – 91.3% 3 – 4.6% 4 – 0.0% 5 – 0.7% % By Fair Value Approximately 94% of the investments in VCC at fair value had an Internal Performance Rating of 1 or 2 as of June 30, 2026 1 – 2.3% 2 – 92.6% 3 – 3.4% 4 – 0.0% 5 – 1.7% 1 – 2.2% 2 – 93.1% 3 – 4.4% 4 – 0.0% 5 – 0.3% 1 – 2.3% 2 – 91.9% 3 – 5.1% 4 – 0.0% 5 – 0.7% 1 – 4.4% 2 – 90.0% 3 – 4.3% 4 – 0.0% 5 – 1.3%
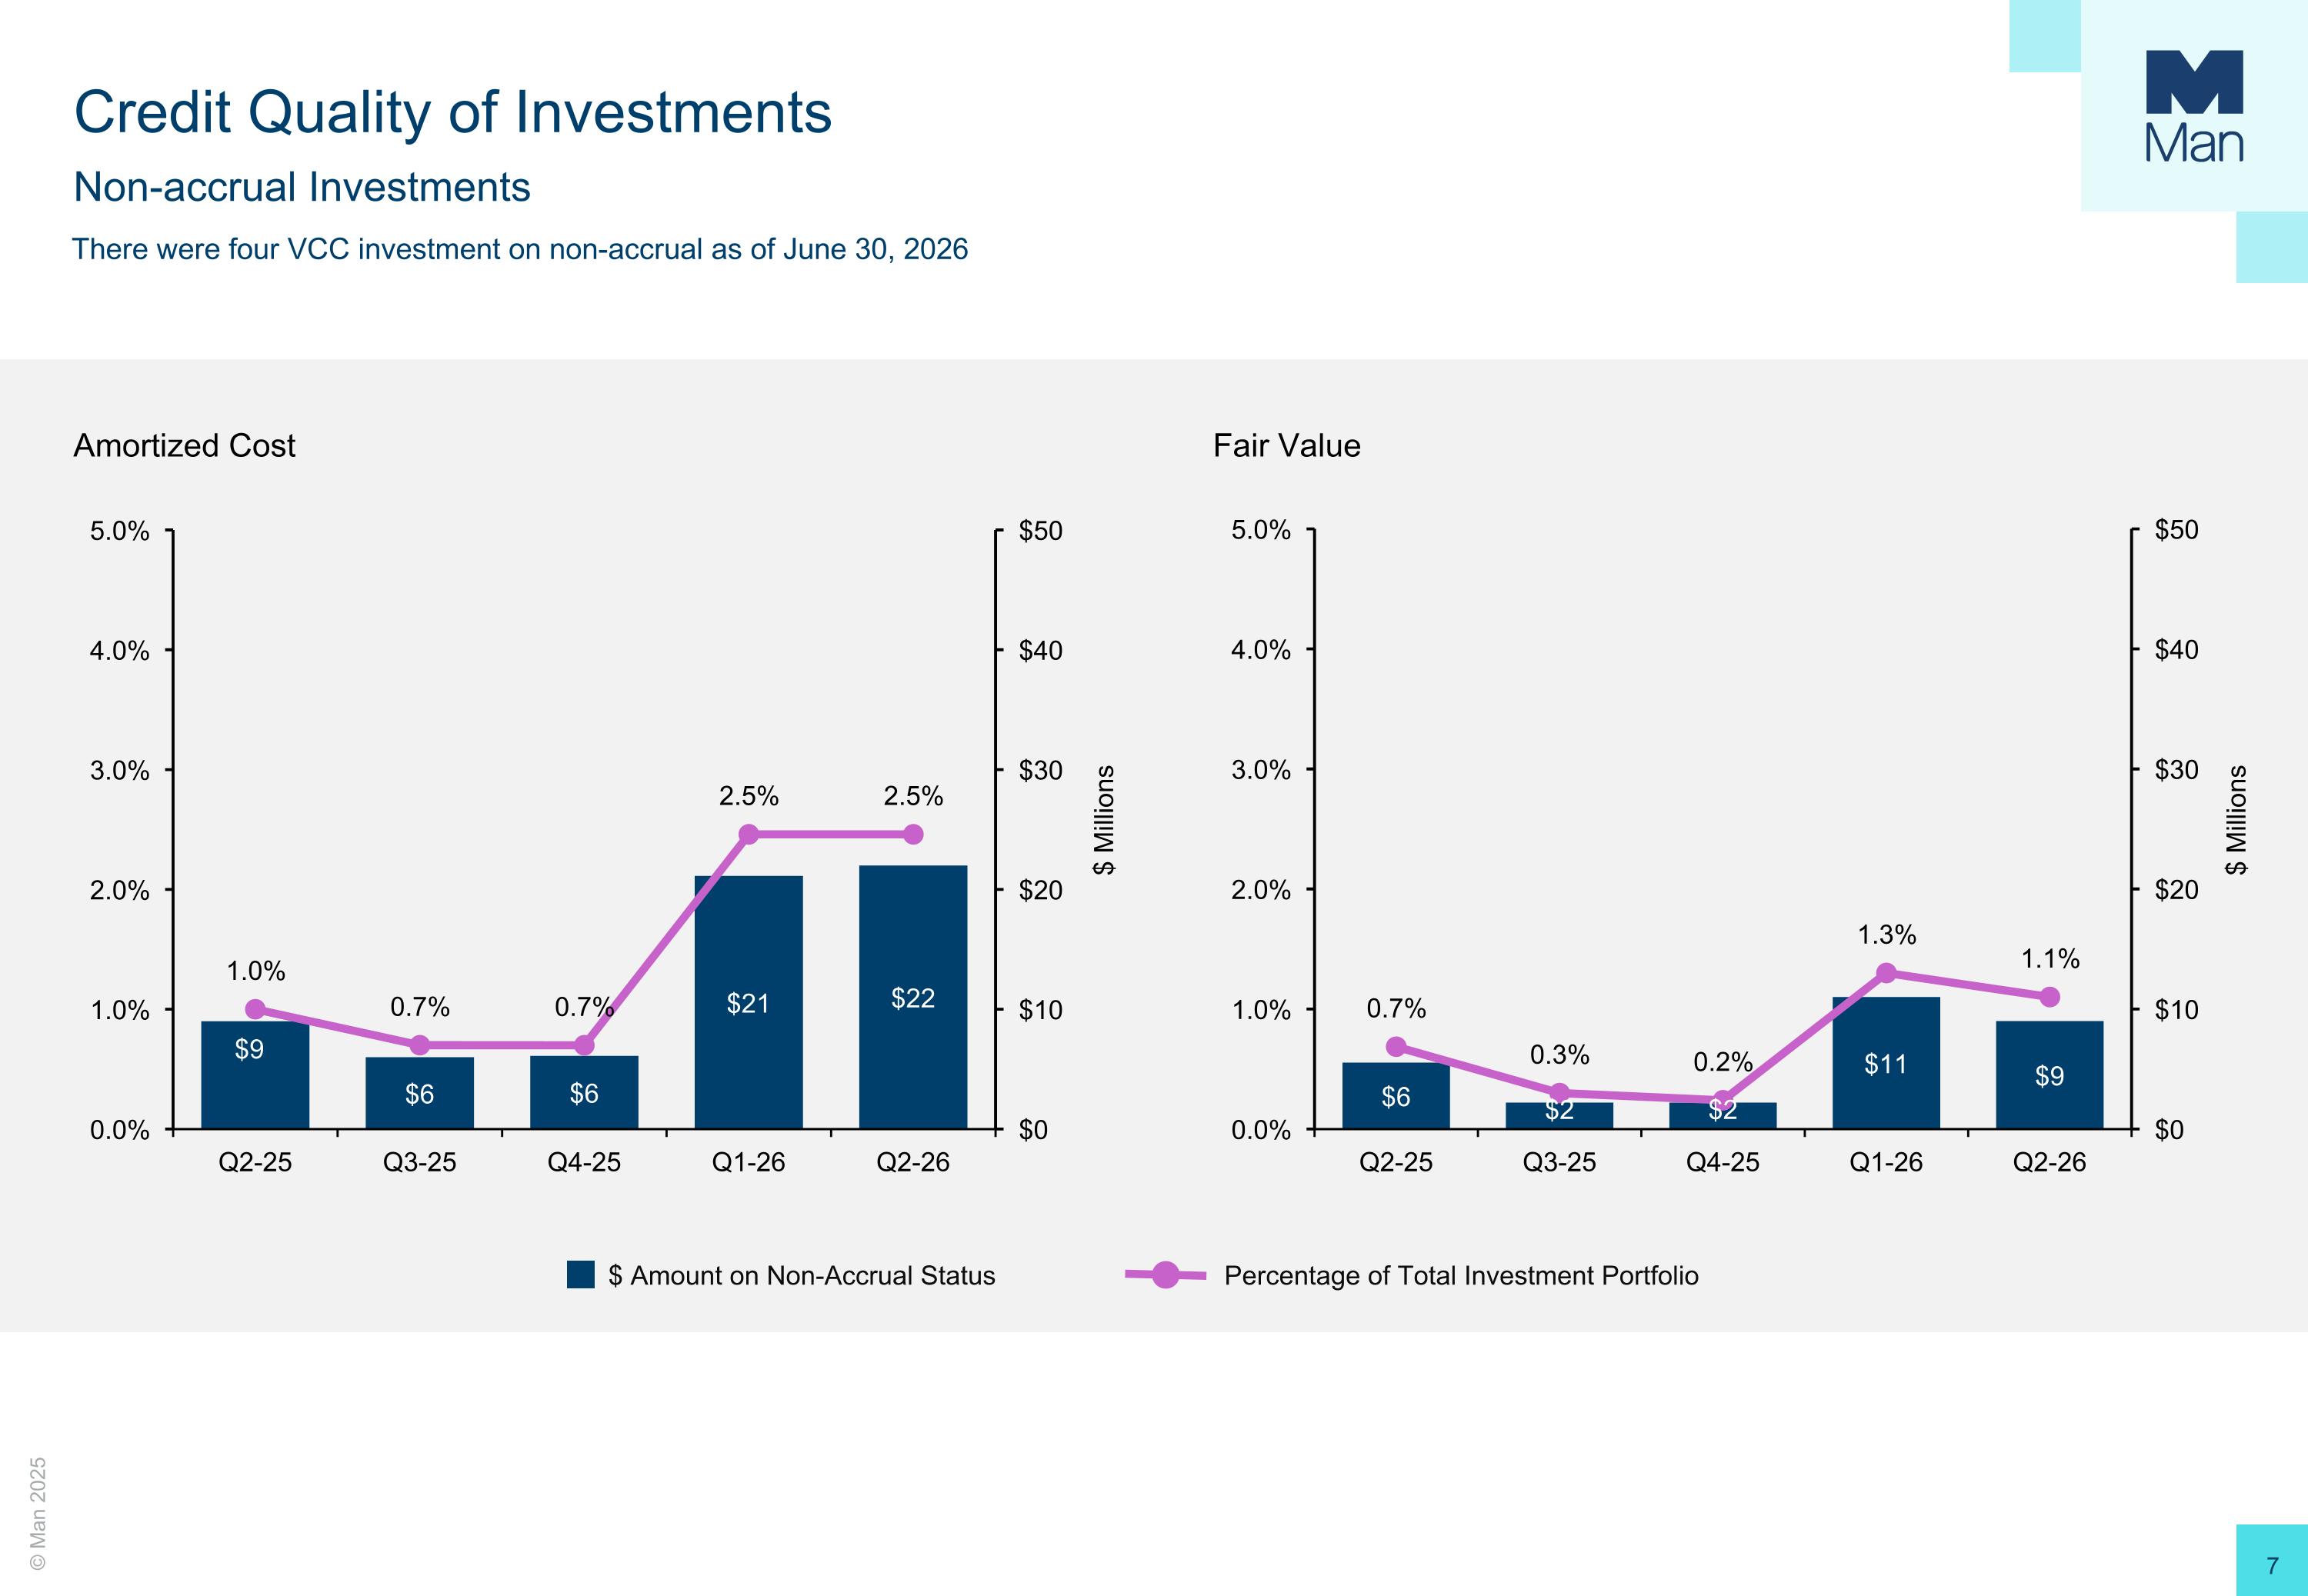
Credit Quality of Investments Non-accrual Investments Amortized Cost Fair Value $ Amount on Non-Accrual Status Percentage of Total Investment Portfolio There were four VCC investment on non-accrual as of June 30, 2026 $ Millions $ Millions
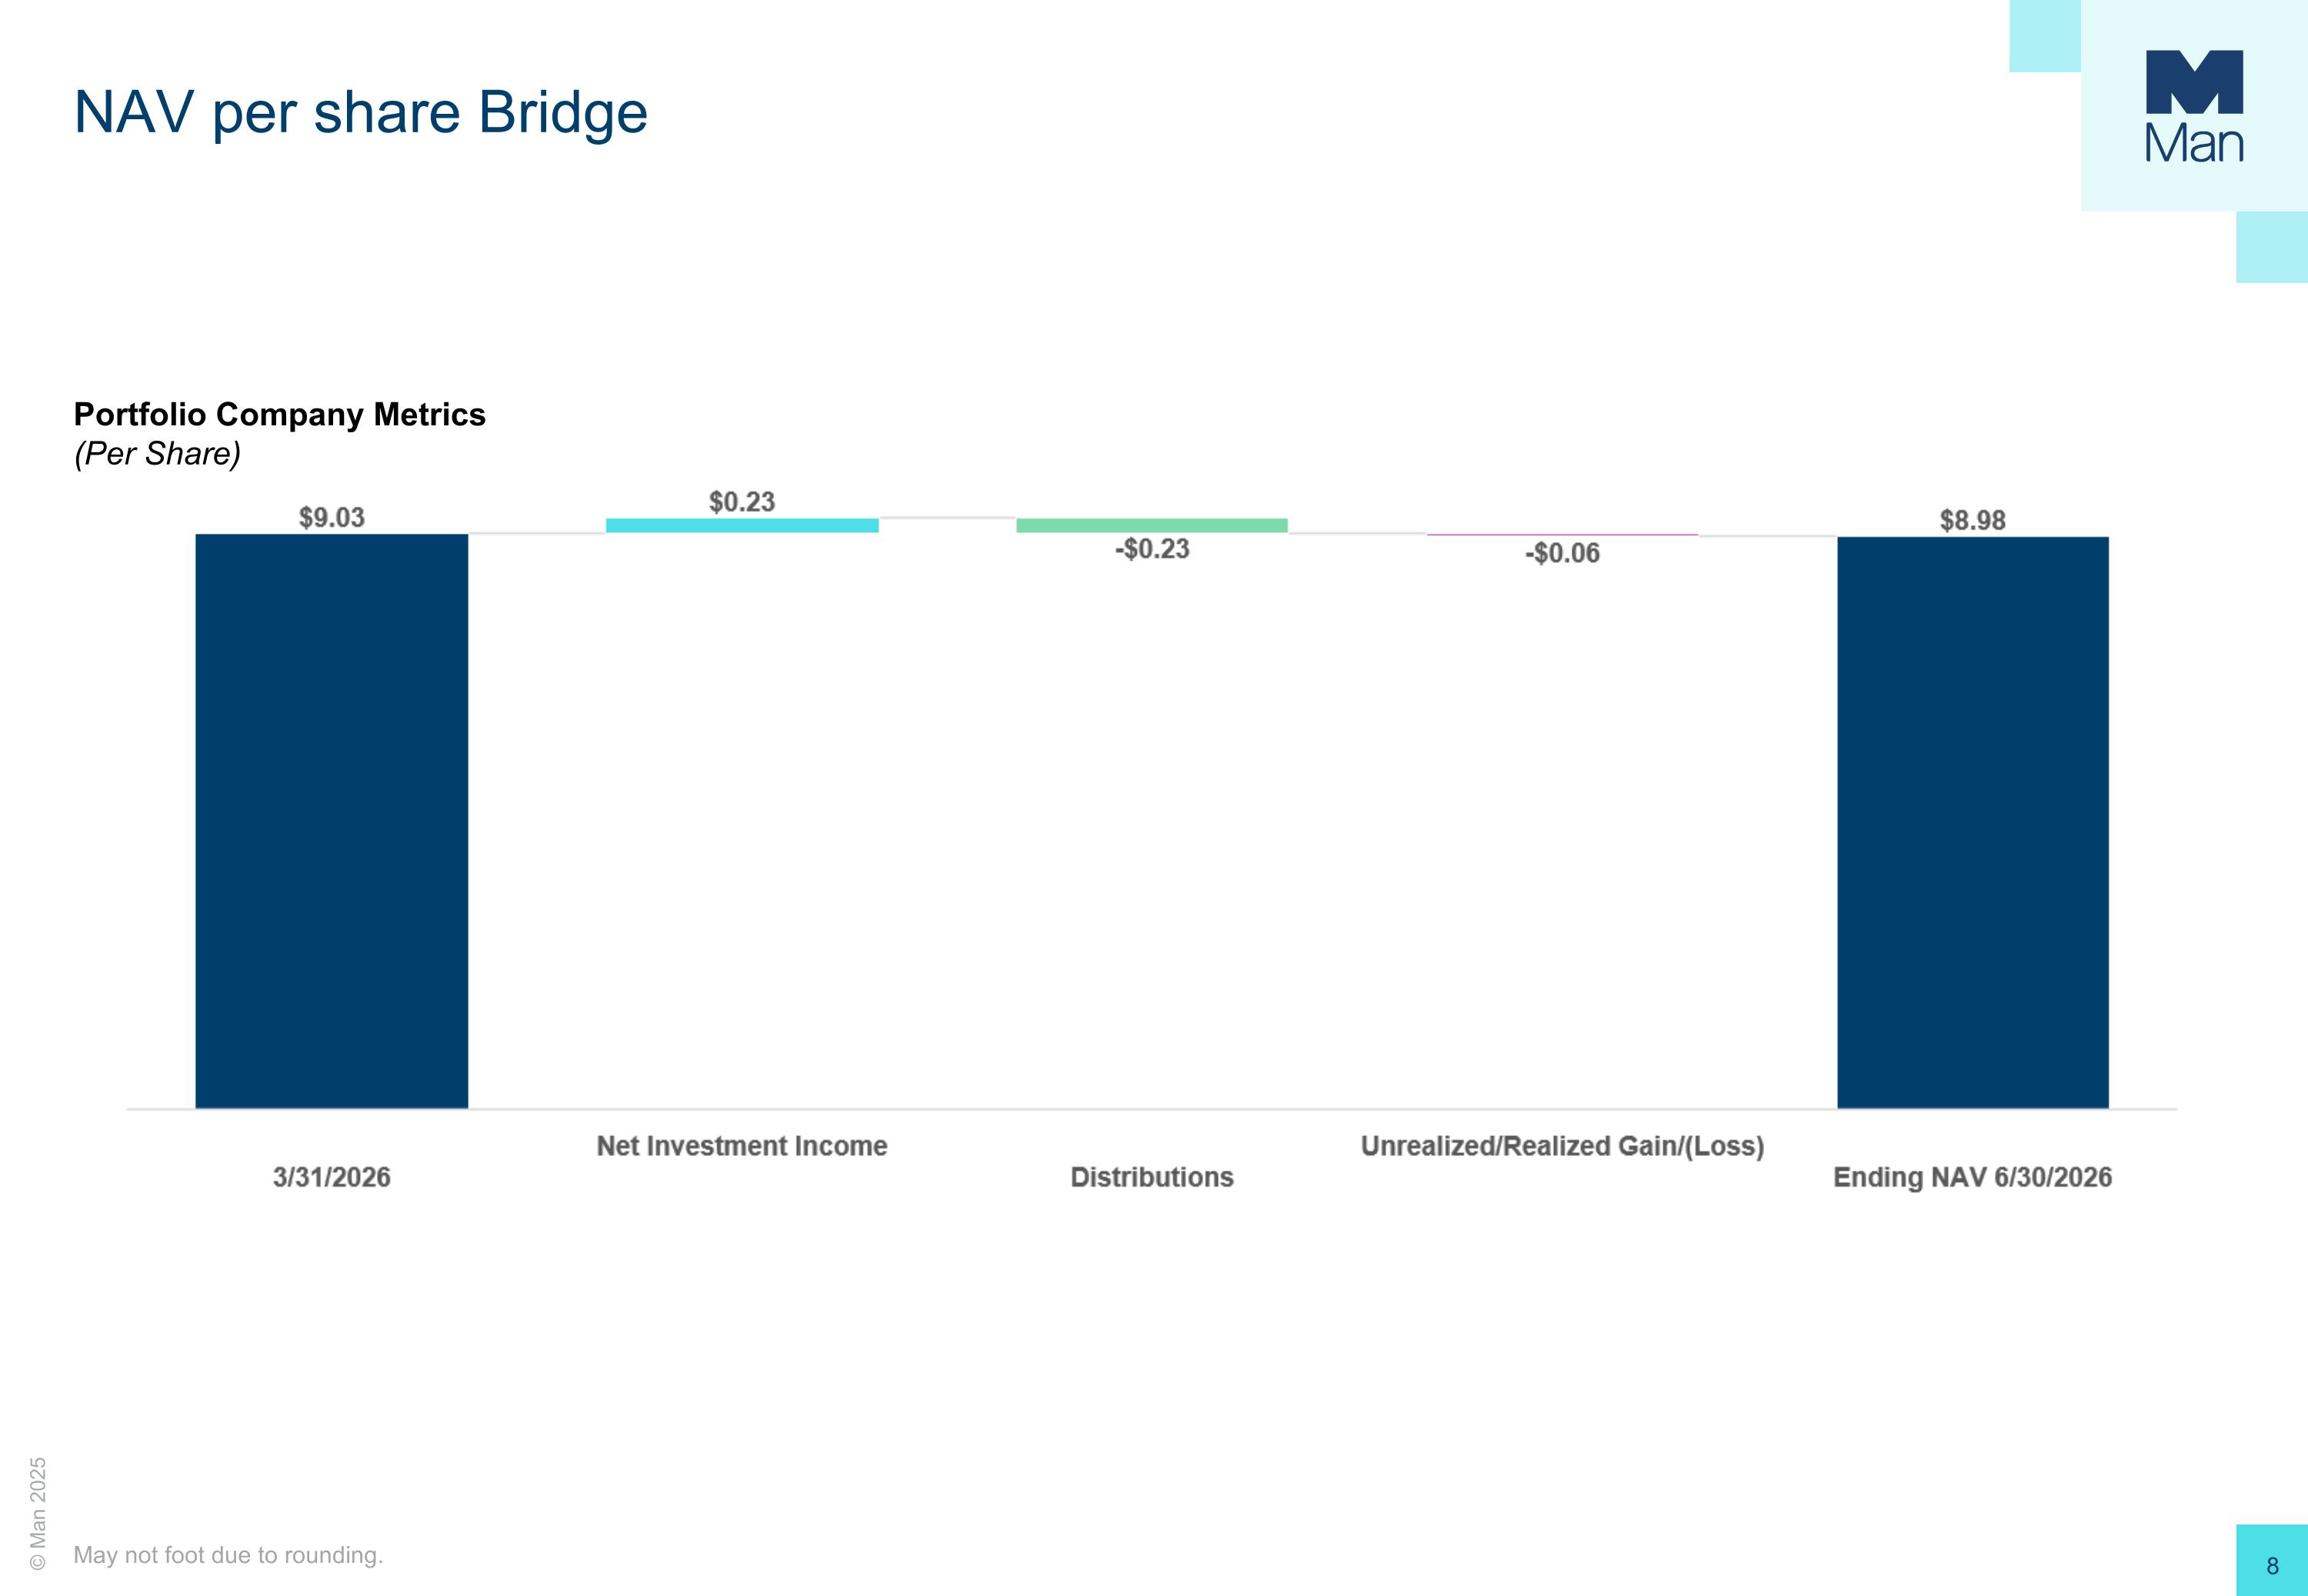
NAV per share Bridge Portfolio Company Metrics (Per Share) May not foot due to rounding.
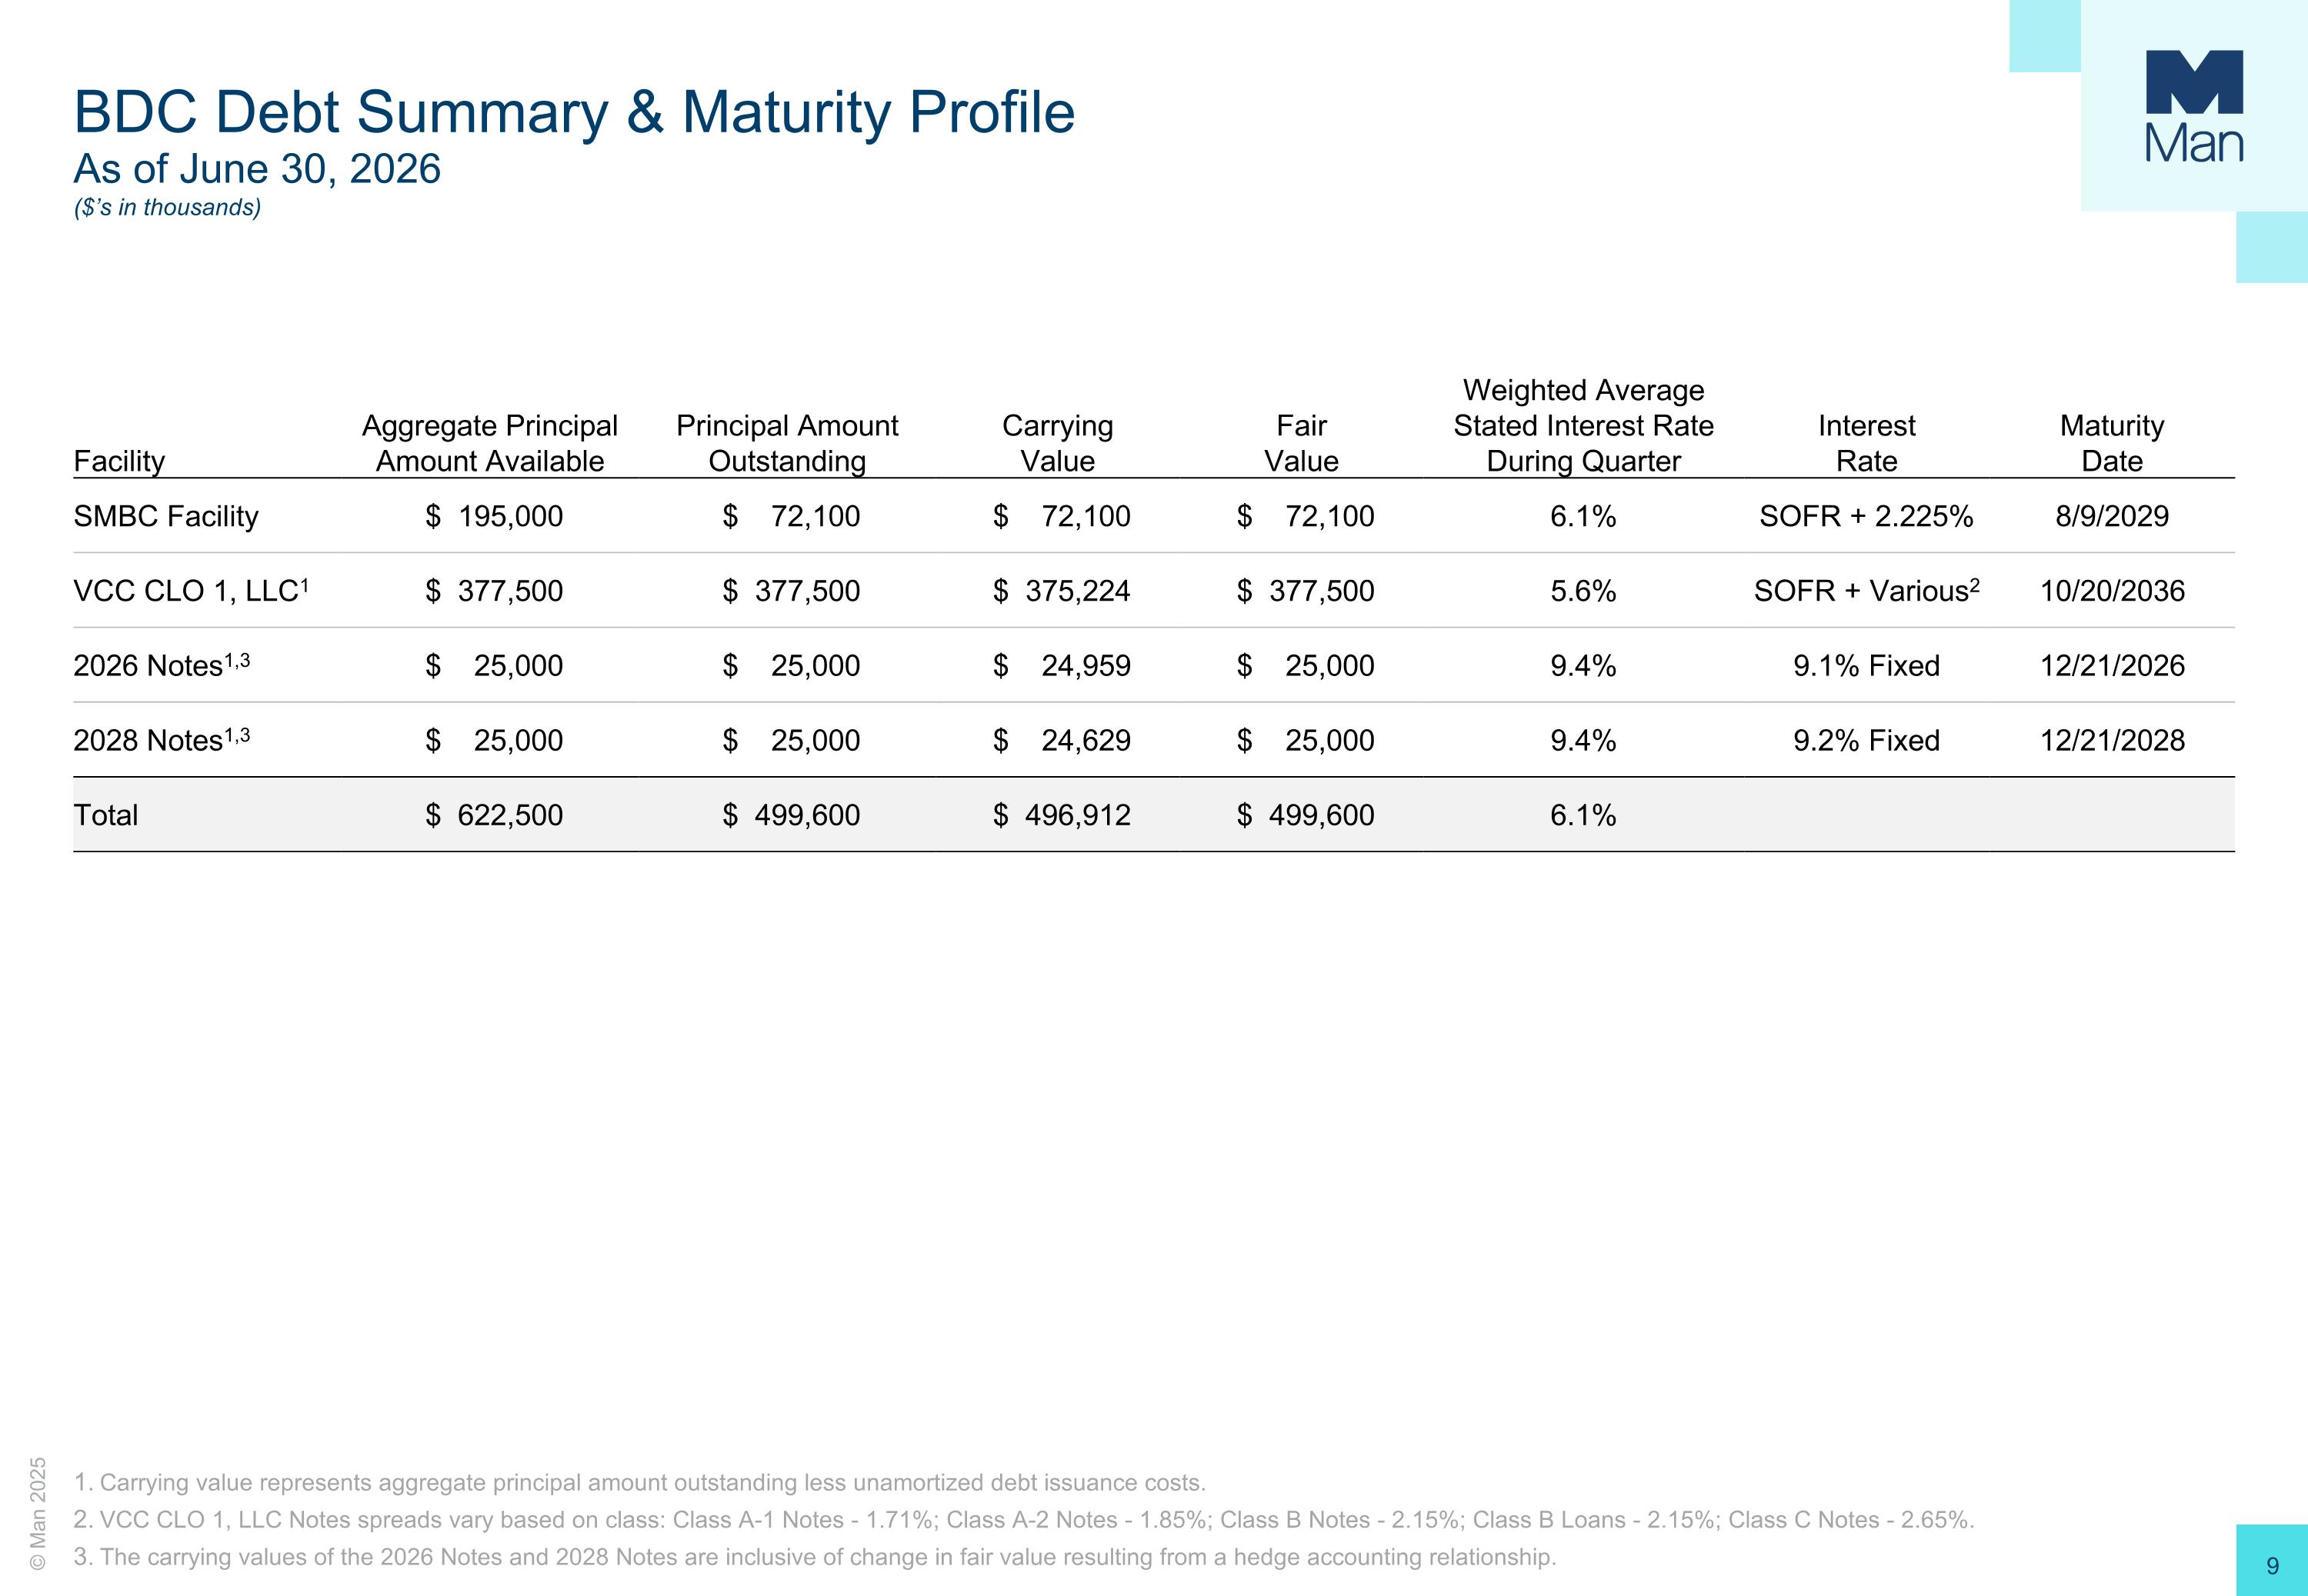
BDC Debt Summary & Maturity Profile As of June 30, 2026 ($’s in thousands) Facility Aggregate Principal Amount Available Principal Amount Outstanding Carrying Value Fair Value Weighted Average Stated Interest Rate During Quarter Interest Rate Maturity Date SMBC Facility $ 195,000 $ 72,100 $ 72,100 $ 72,100 6.1% SOFR + 2.225% 8/9/2029 VCC CLO 1, LLC1 $ 377,500 $ 377,500 $ 375,224 $ 377,500 5.6% SOFR + Various2 10/20/2036 2026 Notes1,3 $ 25,000 $ 25,000 $ 24,959 $ 25,000 9.4% 9.1% Fixed 12/21/2026 2028 Notes1,3 $ 25,000 $ 25,000 $ 24,629 $ 25,000 9.4% 9.2% Fixed 12/21/2028 Total $ 622,500 $ 499,600 $ 496,912 $ 499,600 6.1% Carrying value represents aggregate principal amount outstanding less unamortized debt issuance costs. VCC CLO 1, LLC Notes spreads vary based on class: Class A-1 Notes - 1.71%; Class A-2 Notes - 1.85%; Class B Notes - 2.15%; Class B Loans - 2.15%; Class C Notes - 2.65%. The carrying values of the 2026 Notes and 2028 Notes are inclusive of change in fair value resulting from a hedge accounting relationship.
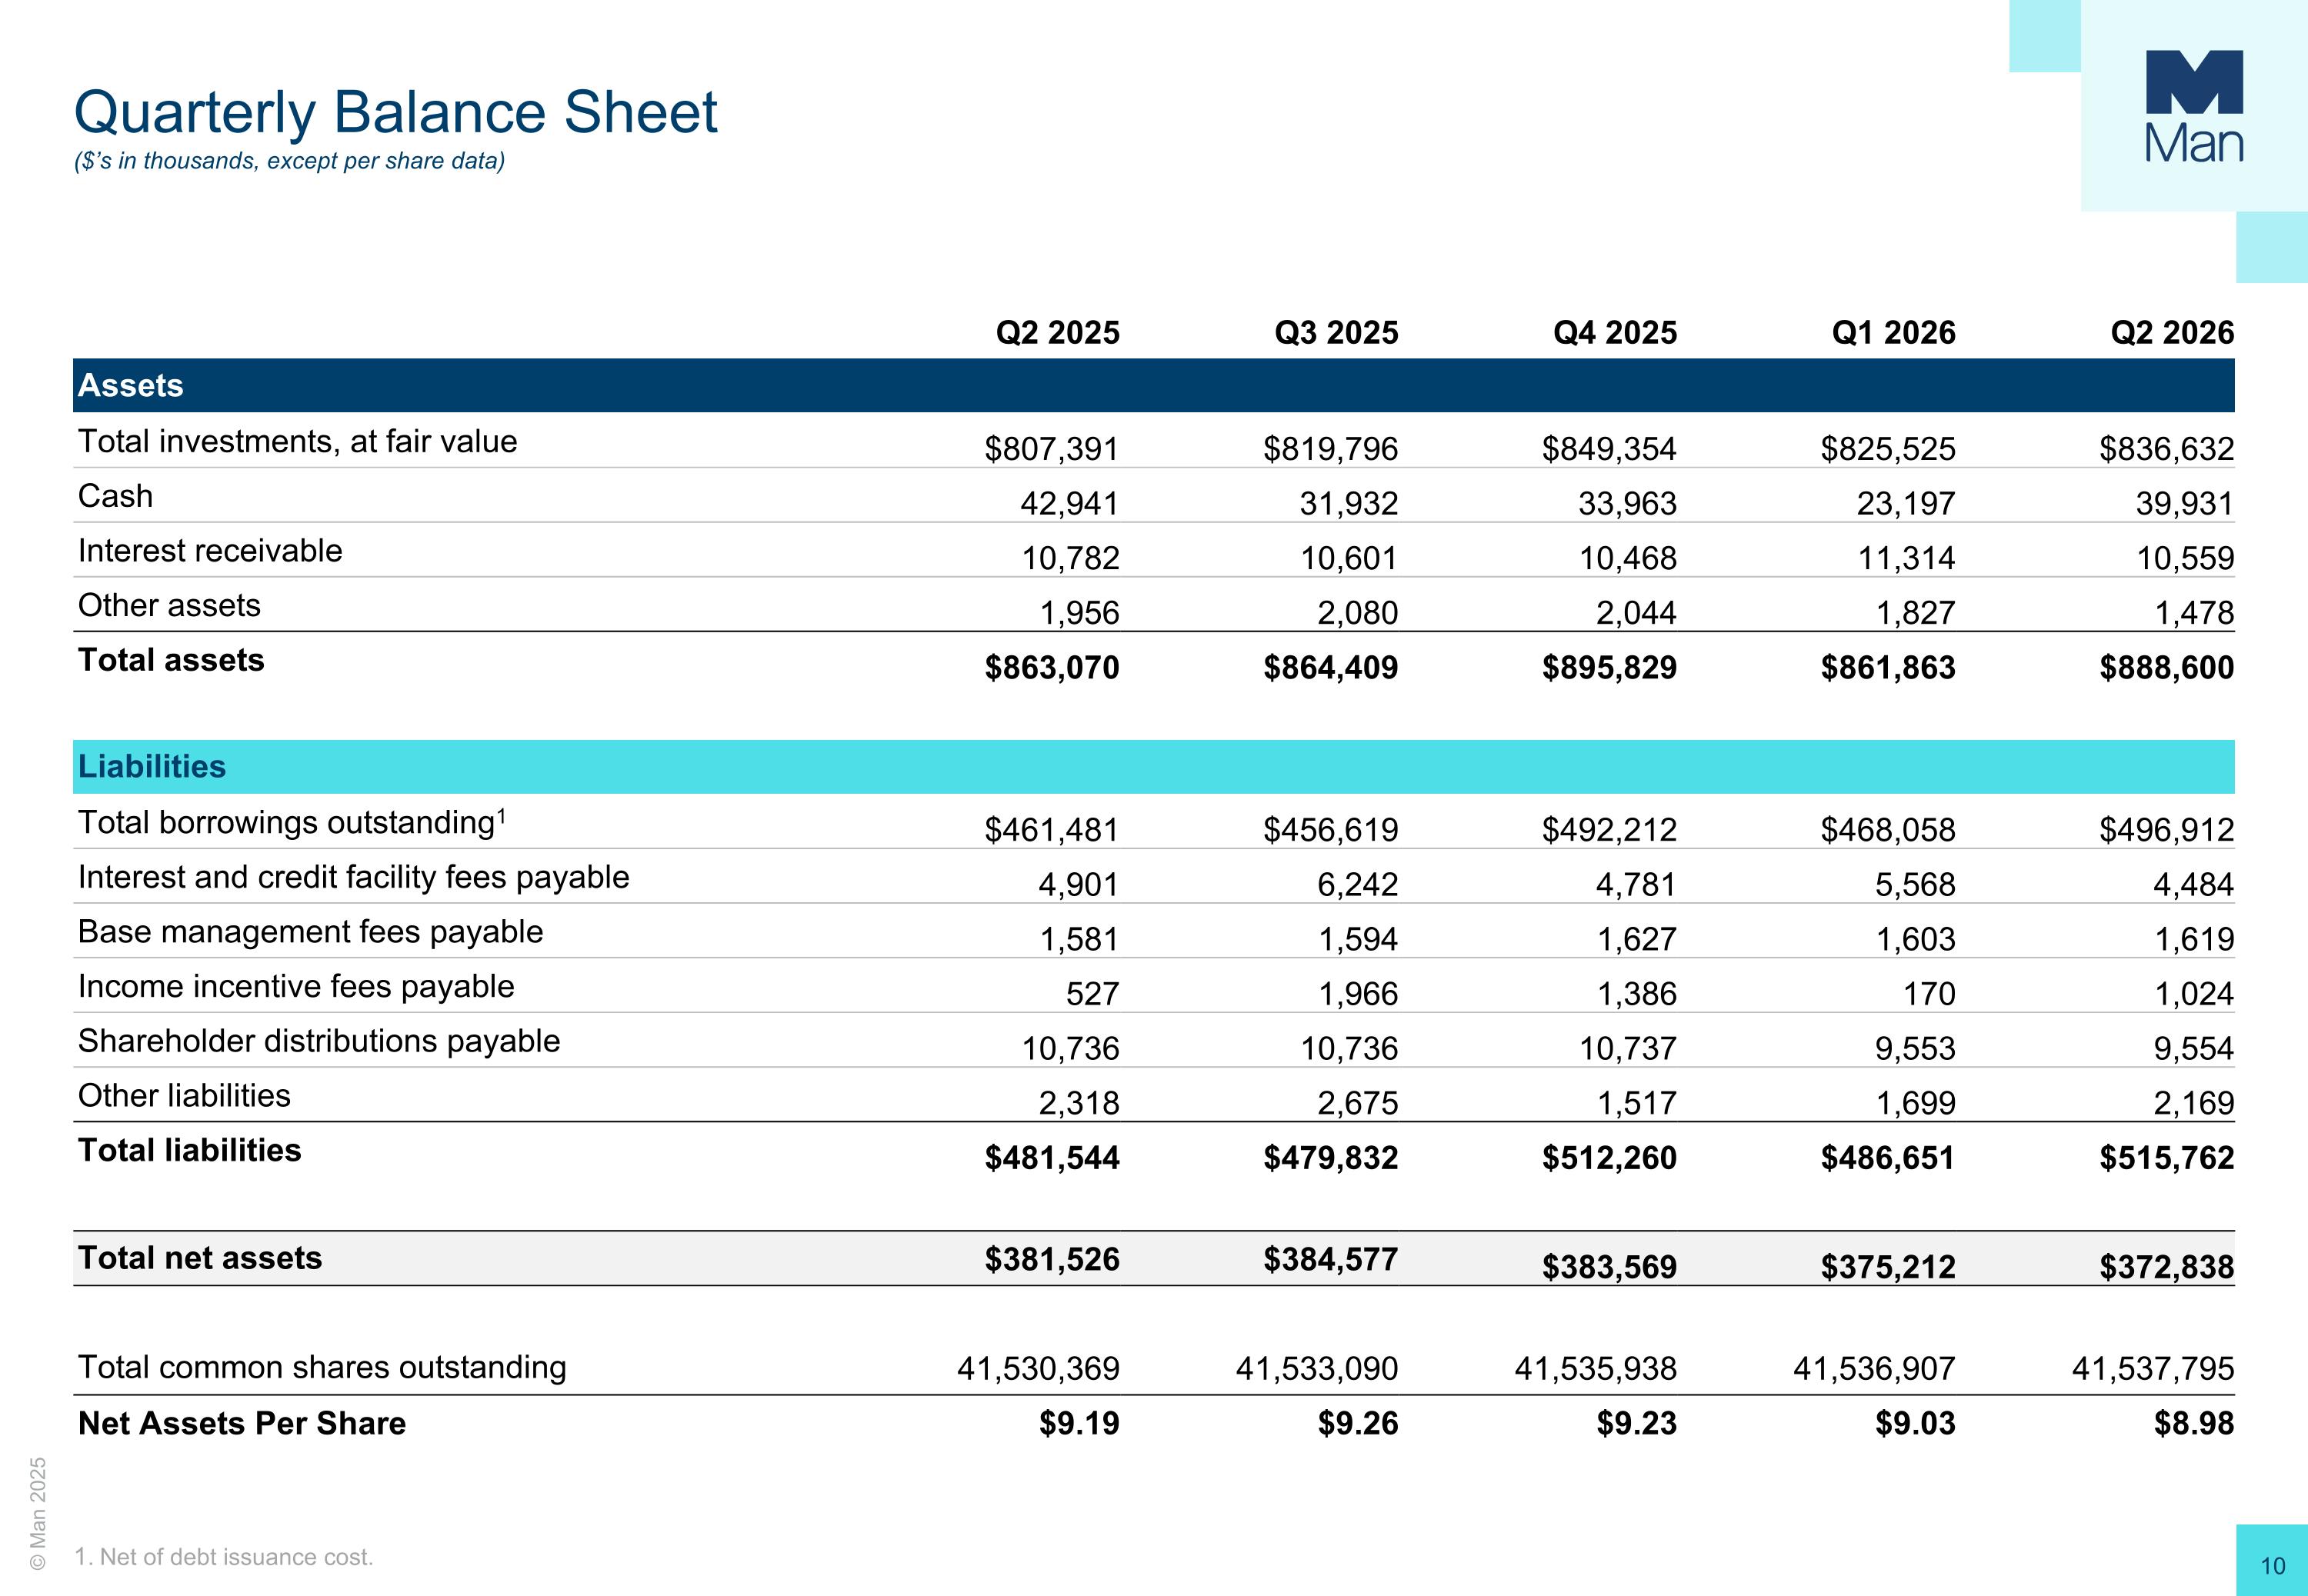
Quarterly Balance Sheet ($’s in thousands, except per share data) Q2 2025 Q3 2025 Q4 2025 Q1 2026 Q2 2026 Assets Total investments, at fair value $807,391 $819,796 $849,354 $825,525 $836,632 Cash 42,941 31,932 33,963 23,197 39,931 Interest receivable 10,782 10,601 10,468 11,314 10,559 Other assets 1,956 2,080 2,044 1,827 1,478 Total assets $863,070 $864,409 $895,829 $861,863 $888,600 Liabilities Total borrowings outstanding1 $461,481 $456,619 $492,212 $468,058 $496,912 Interest and credit facility fees payable 4,901 6,242 4,781 5,568 4,484 Base management fees payable 1,581 1,594 1,627 1,603 1,619 Income incentive fees payable 527 1,966 1,386 170 1,024 Shareholder distributions payable 10,736 10,736 10,737 9,553 9,554 Other liabilities 2,318 2,675 1,517 1,699 2,169 Total liabilities $481,544 $479,832 $512,260 $486,651 $515,762 Total net assets $381,526 $384,577 $383,569 $375,212 $372,838 Total common shares outstanding 41,530,369 41,533,090 41,535,938 41,536,907 41,537,795 Net Assets Per Share $9.19 $9.26 $9.23 $9.03 $8.98 Net of debt issuance cost.
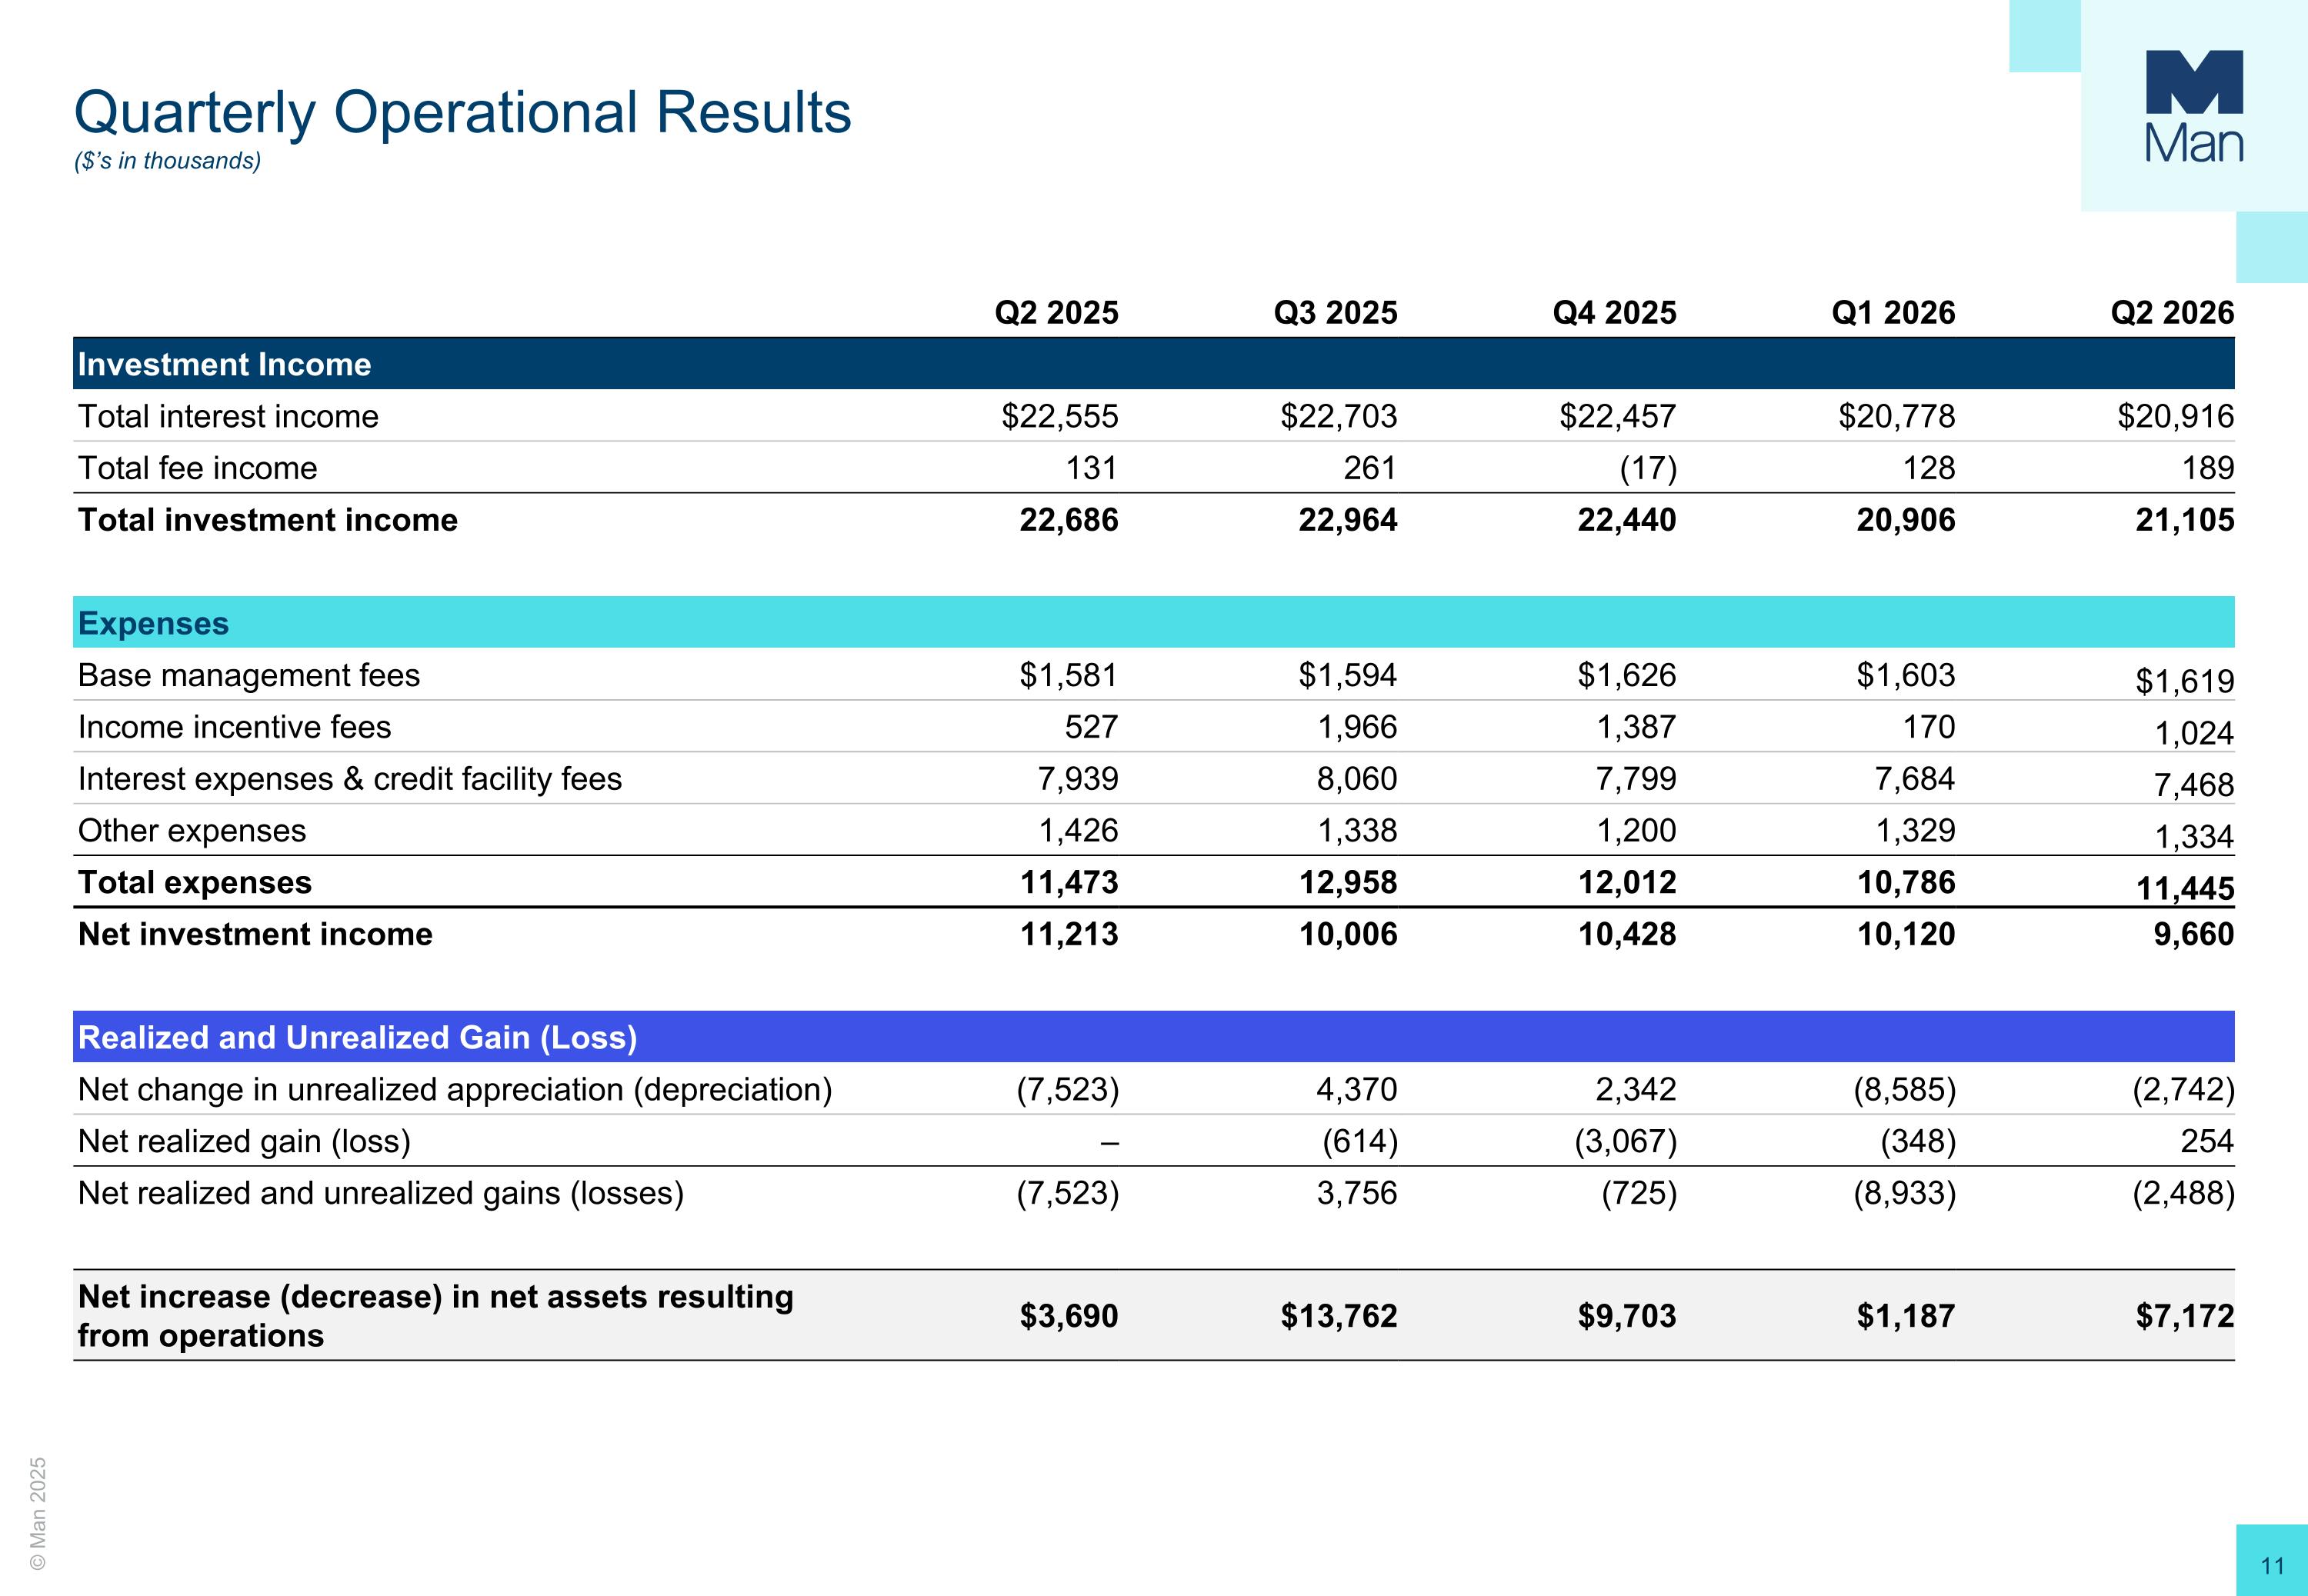
Quarterly Operational Results ($’s in thousands) Q2 2025 Q3 2025 Q4 2025 Q1 2026 Q2 2026 Investment Income Total interest income $22,555 $22,703 $22,457 $20,778 $20,916 Total fee income 131 261 (17) 128 189 Total investment income 22,686 22,964 22,440 20,906 21,105 Expenses Base management fees $1,581 $1,594 $1,626 $1,603 $1,619 Income incentive fees 527 1,966 1,387 170 1,024 Interest expenses & credit facility fees 7,939 8,060 7,799 7,684 7,468 Other expenses 1,426 1,338 1,200 1,329 1,334 Total expenses 11,473 12,958 12,012 10,786 11,445 Net investment income 11,213 10,006 10,428 10,120 9,660 Realized and Unrealized Gain (Loss) Net change in unrealized appreciation (depreciation) (7,523) 4,370 2,342 (8,585) (2,742) Net realized gain (loss) – (614) (3,067) (348) 254 Net realized and unrealized gains (losses) (7,523) 3,756 (725) (8,933) (2,488) Net increase (decrease) in net assets resulting from operations $3,690 $13,762 $9,703 $1,187 $7,172
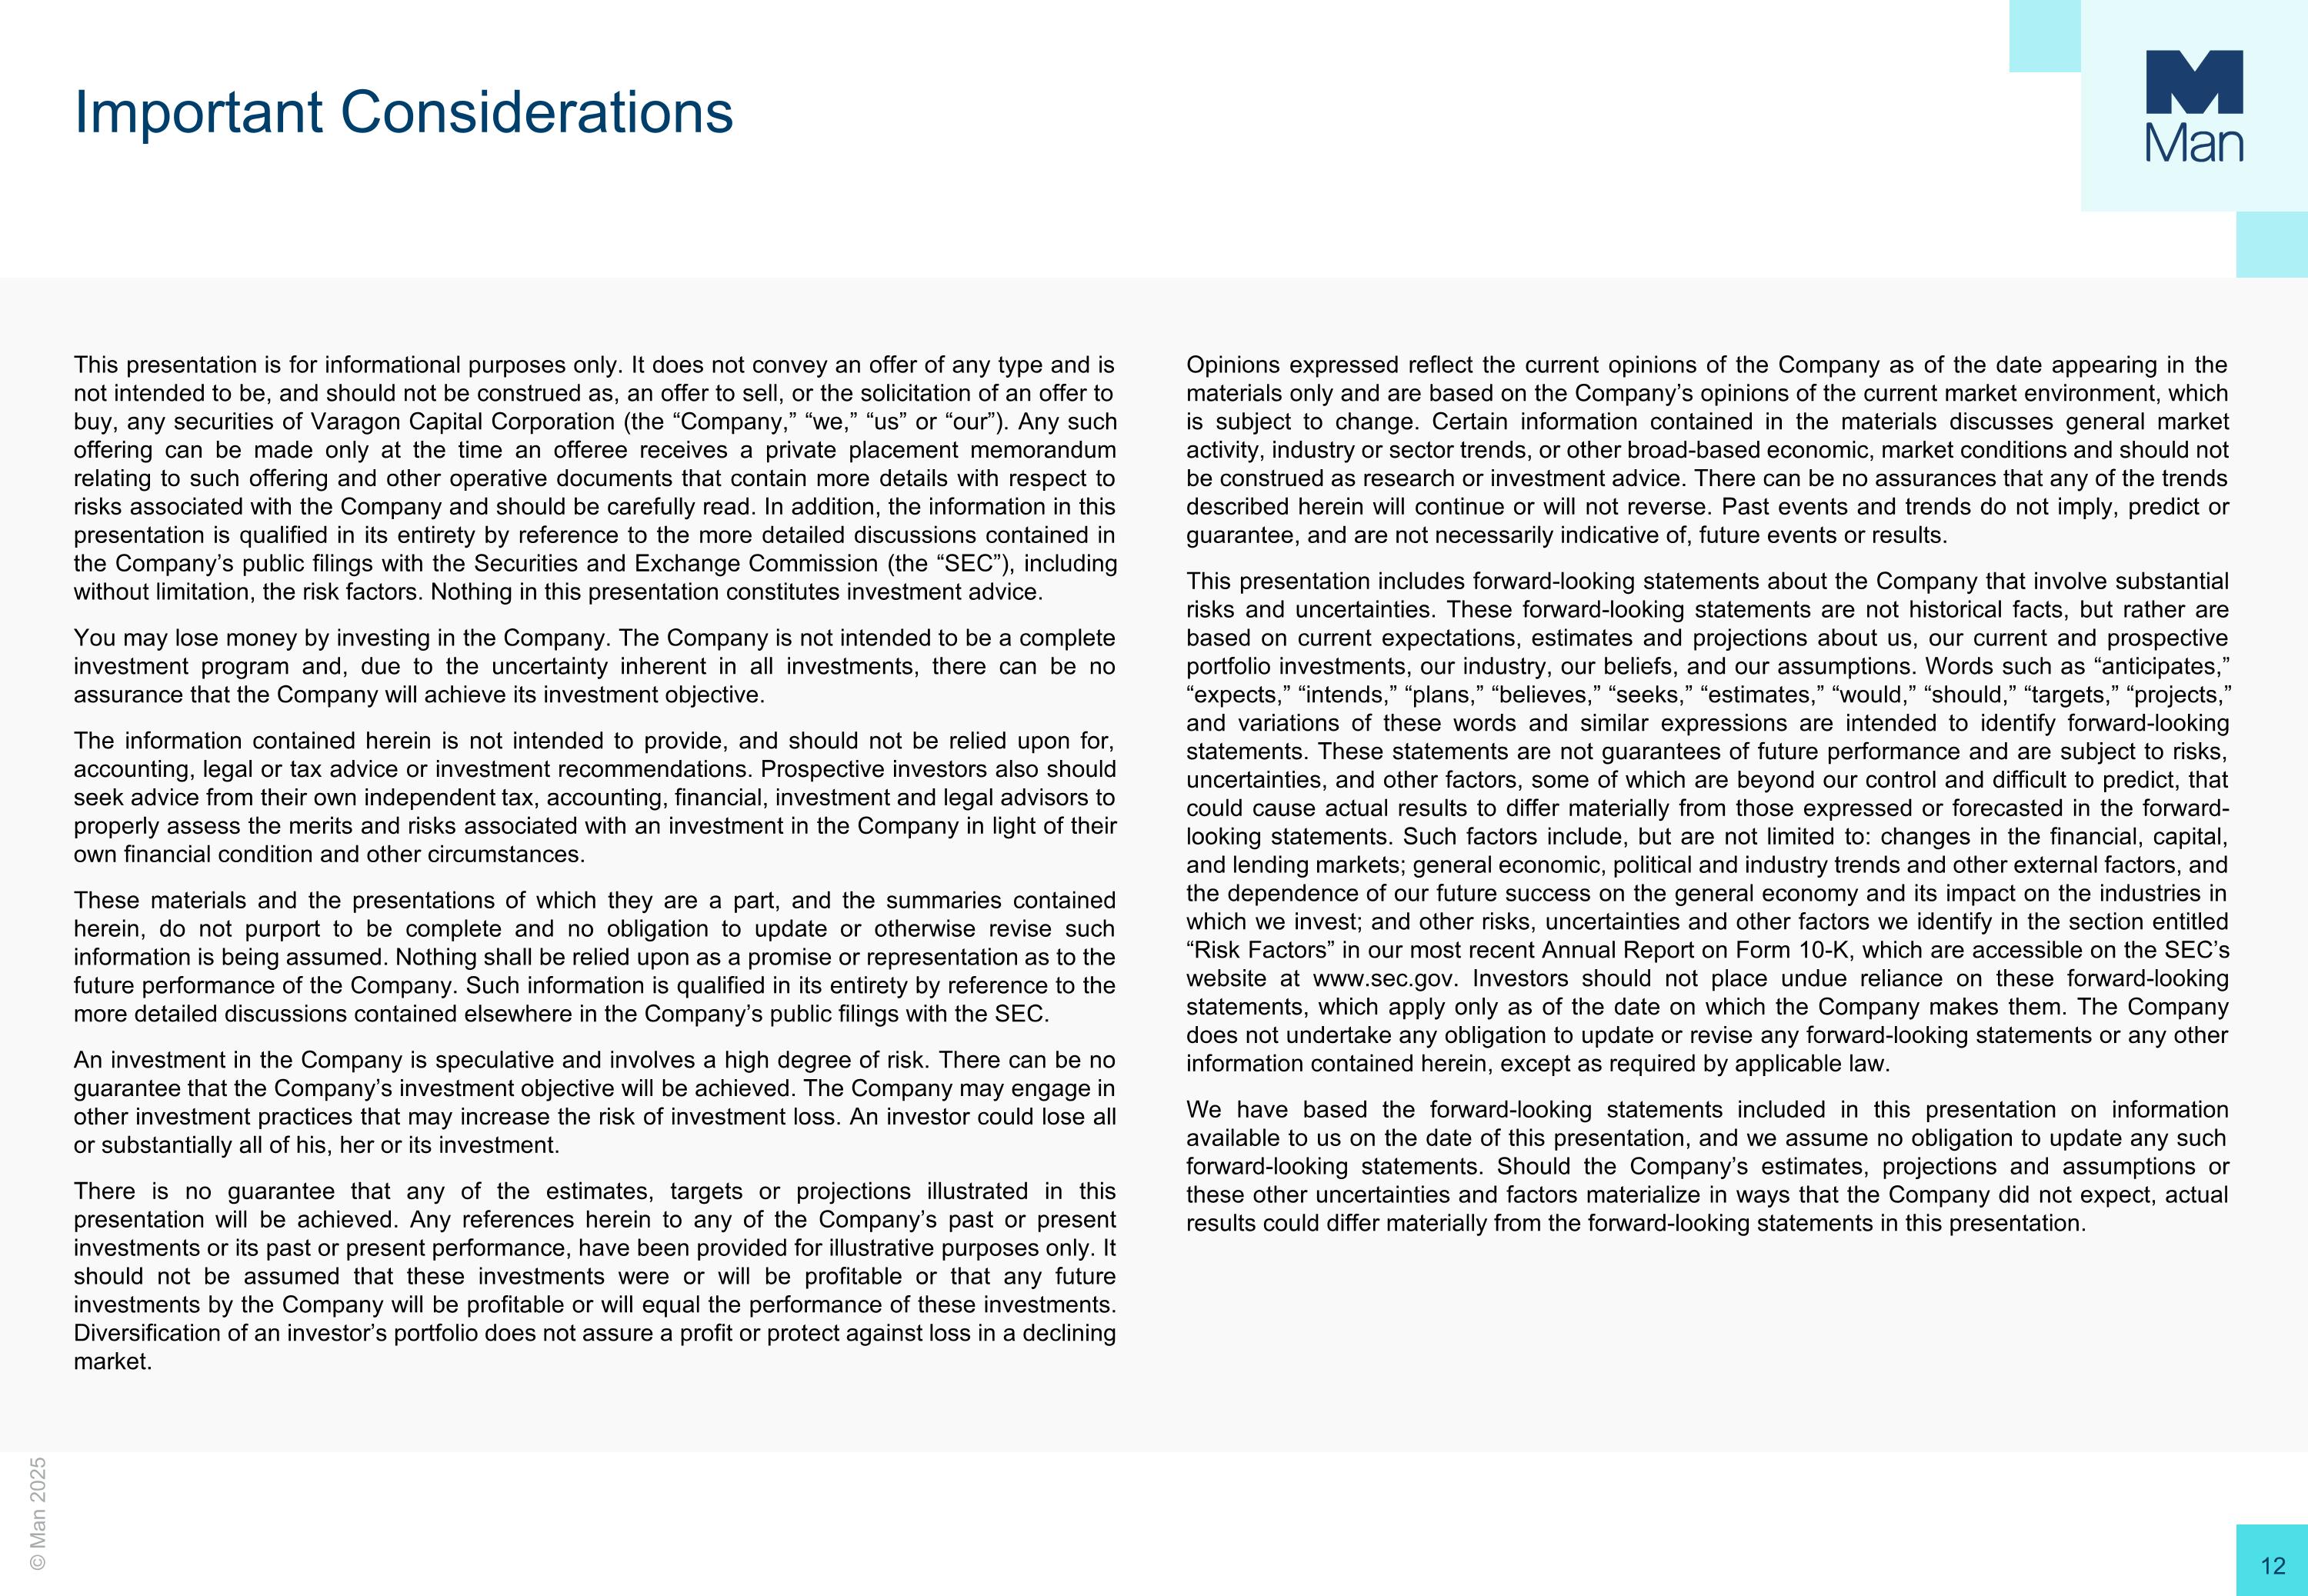
This presentation is for informational purposes only. It does not convey an offer of any type and is not intended to be, and should not be construed as, an offer to sell, or the solicitation of an offer to buy, any securities of Varagon Capital Corporation (the “Company,” “we,” “us” or “our”). Any such offering can be made only at the time an offeree receives a private placement memorandum relating to such offering and other operative documents that contain more details with respect to risks associated with the Company and should be carefully read. In addition, the information in this presentation is qualified in its entirety by reference to the more detailed discussions contained in the Company’s public filings with the Securities and Exchange Commission (the “SEC”), including without limitation, the risk factors. Nothing in this presentation constitutes investment advice. You may lose money by investing in the Company. The Company is not intended to be a complete investment program and, due to the uncertainty inherent in all investments, there can be no assurance that the Company will achieve its investment objective. The information contained herein is not intended to provide, and should not be relied upon for, accounting, legal or tax advice or investment recommendations. Prospective investors also should seek advice from their own independent tax, accounting, financial, investment and legal advisors to properly assess the merits and risks associated with an investment in the Company in light of their own financial condition and other circumstances. These materials and the presentations of which they are a part, and the summaries contained herein, do not purport to be complete and no obligation to update or otherwise revise such information is being assumed. Nothing shall be relied upon as a promise or representation as to the future performance of the Company. Such information is qualified in its entirety by reference to the more detailed discussions contained elsewhere in the Company’s public filings with the SEC. An investment in the Company is speculative and involves a high degree of risk. There can be no guarantee that the Company’s investment objective will be achieved. The Company may engage in other investment practices that may increase the risk of investment loss. An investor could lose all or substantially all of his, her or its investment. There is no guarantee that any of the estimates, targets or projections illustrated in this presentation will be achieved. Any references herein to any of the Company’s past or present investments or its past or present performance, have been provided for illustrative purposes only. It should not be assumed that these investments were or will be profitable or that any future investments by the Company will be profitable or will equal the performance of these investments. Diversification of an investor’s portfolio does not assure a profit or protect against loss in a declining market. Opinions expressed reflect the current opinions of the Company as of the date appearing in the materials only and are based on the Company’s opinions of the current market environment, which is subject to change. Certain information contained in the materials discusses general market activity, industry or sector trends, or other broad-based economic, market conditions and should not be construed as research or investment advice. There can be no assurances that any of the trends described herein will continue or will not reverse. Past events and trends do not imply, predict or guarantee, and are not necessarily indicative of, future events or results. This presentation includes forward-looking statements about the Company that involve substantial risks and uncertainties. These forward-looking statements are not historical facts, but rather are based on current expectations, estimates and projections about us, our current and prospective portfolio investments, our industry, our beliefs, and our assumptions. Words such as “anticipates,” “expects,” “intends,” “plans,” “believes,” “seeks,” “estimates,” “would,” “should,” “targets,” “projects,” and variations of these words and similar expressions are intended to identify forward-looking statements. These statements are not guarantees of future performance and are subject to risks, uncertainties, and other factors, some of which are beyond our control and difficult to predict, that could cause actual results to differ materially from those expressed or forecasted in the forward-looking statements. Such factors include, but are not limited to: changes in the financial, capital, and lending markets; general economic, political and industry trends and other external factors, and the dependence of our future success on the general economy and its impact on the industries in which we invest; and other risks, uncertainties and other factors we identify in the section entitled “Risk Factors” in our most recent Annual Report on Form 10-K, which are accessible on the SEC’s website at www.sec.gov. Investors should not place undue reliance on these forward-looking statements, which apply only as of the date on which the Company makes them. The Company does not undertake any obligation to update or revise any forward-looking statements or any other information contained herein, except as required by applicable law. We have based the forward-looking statements included in this presentation on information available to us on the date of this presentation, and we assume no obligation to update any such forward-looking statements. Should the Company’s estimates, projections and assumptions or these other uncertainties and factors materialize in ways that the Company did not expect, actual results could differ materially from the forward-looking statements in this presentation. Important Considerations