In accordance with rules adopted by the SEC pursuant to the Dodd-Frank Wall Street Reform and Consumer Protection Act of 2010 and Item 402(v) of Regulation S-K, we provide the following disclosure, as it applies to smaller reporting companies, regarding executive compensation for our principal executive officer ("PEO") and Non-PEO named executive officers ("Non-PEO NEOs") and Company performance for the fiscal years ended December 31, 2025, 2024 and 2023. The Board did not consider the pay versus performance disclosure below in making its pay decisions for any of the years shown.
In determining the "compensation actually paid" ("CAP") to our PEO and Non-PEO NEOs, we are required to make various adjustments to amounts that have previously been reported in the Summary Compensation Table ("SCT") in previous years, as the SEC's valuation methods for this section differ from those required in the SCT. The table below summarizes compensation values both previously reported in our SCT, as well as the adjusted values required in this section for the fiscal years ended December 31, 2025, 2024 and 2023. Given the complexity with respect to the standards of financial accounting and reporting related to equity compensation, the adjustments related to the fair value of equity awards in the calculation of CAP do not necessarily correspond to the actual value that has been realized or will be realized in the future with respect to these awards.
|
Year |
Summary Compensation Table Total for PEO (1) |
Compensation Actually Paid for PEO (2) |
Average Summary Compensation Table Total for Non-PEO NEO (1) |
Average Compensation Actually Paid to Non-PEO NEO (2) |
Value of Initial Fixed $100 Investment Based on Total Shareholder Return (3) |
Net (Loss) Income in thousands |
||||||||||||
| 2025 |
$ |
2,100,923 |
$ |
2,100,923 |
$ |
443,462 |
$ |
443,462 |
$ |
91.30 |
$ |
(7,426) | ||||||
| 2024 |
$ |
634,000 |
$ |
634,000 |
$ |
280,000 |
$ |
280,000 |
$ |
381.50 |
$ |
(14,472) | ||||||
| 2023 |
$ |
455,020 |
$ |
455,020 |
$ |
225,000 |
$ |
225,000 |
$ |
69.60 |
$ |
9,515 | ||||||
| 1 |
The Company's PEO for each of the years presented was Jeffrey Parker. The Company's only Non-PEO NEO for each of the years presented was Cynthia French, Chief Financial Officer. |
| 2 | CAP is computed in accordance with Item 402(v) of Regulation S-K, but does not reflect the actual compensation earned by or paid to the PEO or Non-PEO NEO during the applicable year. This calculation determines the value of awards at the date they vest, but does not consider the impact of changes in the value of those outstanding vested awards from year to year. The "Adjustments to Determine Compensation Actually Paid" table below reflects the exclusions and inclusions of certain equity values for the PEO and Non-PEO NEO calculated in accordance with ASC 718. |
| 3 | Assumes a $100 fixed investment as of year-end 2022 and continuing through year-end 2023, 2024 and 2025, respectively. |
Adjustments to Determine Compensation Actually Paid to PEO and NEOs
|
2025 |
2024 |
2023 |
||||||||||||||||||||||
|
PEO |
Average Non- PEO NEO |
PEO |
Average Non- PEO NEO |
PEO |
Average Non- PEO NEO |
|||||||||||||||||||
|
Summary Compensation Table (SCT) Totals for PEO and Non-PEO NEOs |
$ | 2,100,923 | $ | 443,462 | $ | 634,000 | $ | 280,000 | $ | 455,020 | $ | 225,000 | ||||||||||||
|
Add (Subtract) |
||||||||||||||||||||||||
|
Fair value of equity awards granted during the year from the SCT |
(1,720,000 | ) | 1 | (215,000 | ) | 1 | - | - | (60,020 | ) | - | |||||||||||||
|
Year-End fair value of unvested equity awards granted in year |
- | - | - | - | - | - | ||||||||||||||||||
|
Fair value of equity awards vested and granted during the year |
- | - | - | 60,020 | - | |||||||||||||||||||
|
Change in fair value of unvested awards granted in prior years |
- | - | - | - | - | - | ||||||||||||||||||
|
Excess fair value of modified awards as of the date of modification |
1,720,000 | 1 | 215,000 | 1 | - | - | - | - | ||||||||||||||||
|
Total adjustments |
- | - | - | - | - | - | ||||||||||||||||||
|
Compensation Actually Paid |
$ | 2,100,923 | $ | 443,462 | $ | 634,000 | $ | 280,000 | $ | 455,020 | $ | 225,000 | ||||||||||||
1 The amount represents the excess fair value of modified awards over the fair value of the original awards, measured as of the date of such modification. The awards, originally granted in January 2021, were modified in April 2025 to extend the expiration date by five years. The awards were fully vested in prior years.
Adjustments to Determine Compensation Actually Paid to PEO and NEOs
|
2025 |
2024 |
2023 |
||||||||||||||||||||||
|
PEO |
Average Non- PEO NEO |
PEO |
Average Non- PEO NEO |
PEO |
Average Non- PEO NEO |
|||||||||||||||||||
|
Summary Compensation Table (SCT) Totals for PEO and Non-PEO NEOs |
$ | 2,100,923 | $ | 443,462 | $ | 634,000 | $ | 280,000 | $ | 455,020 | $ | 225,000 | ||||||||||||
|
Add (Subtract) |
||||||||||||||||||||||||
|
Fair value of equity awards granted during the year from the SCT |
(1,720,000 | ) | 1 | (215,000 | ) | 1 | - | - | (60,020 | ) | - | |||||||||||||
|
Year-End fair value of unvested equity awards granted in year |
- | - | - | - | - | - | ||||||||||||||||||
|
Fair value of equity awards vested and granted during the year |
- | - | - | 60,020 | - | |||||||||||||||||||
|
Change in fair value of unvested awards granted in prior years |
- | - | - | - | - | - | ||||||||||||||||||
|
Excess fair value of modified awards as of the date of modification |
1,720,000 | 1 | 215,000 | 1 | - | - | - | - | ||||||||||||||||
|
Total adjustments |
- | - | - | - | - | - | ||||||||||||||||||
|
Compensation Actually Paid |
$ | 2,100,923 | $ | 443,462 | $ | 634,000 | $ | 280,000 | $ | 455,020 | $ | 225,000 | ||||||||||||
1 The amount represents the excess fair value of modified awards over the fair value of the original awards, measured as of the date of such modification. The awards, originally granted in January 2021, were modified in April 2025 to extend the expiration date by five years. The awards were fully vested in prior years.
Description of Relationship Between CAP and Performance Measures
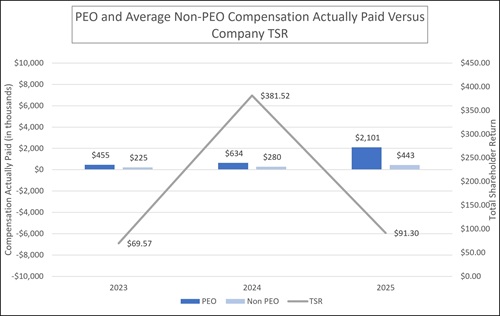
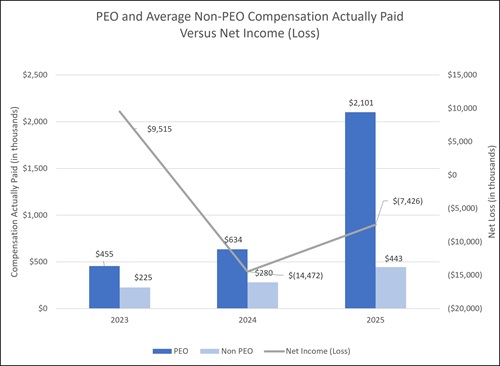
The following graphs further illustrate the relationship between the pay and performance figures that are included in the pay versus performance tabular disclosure above.