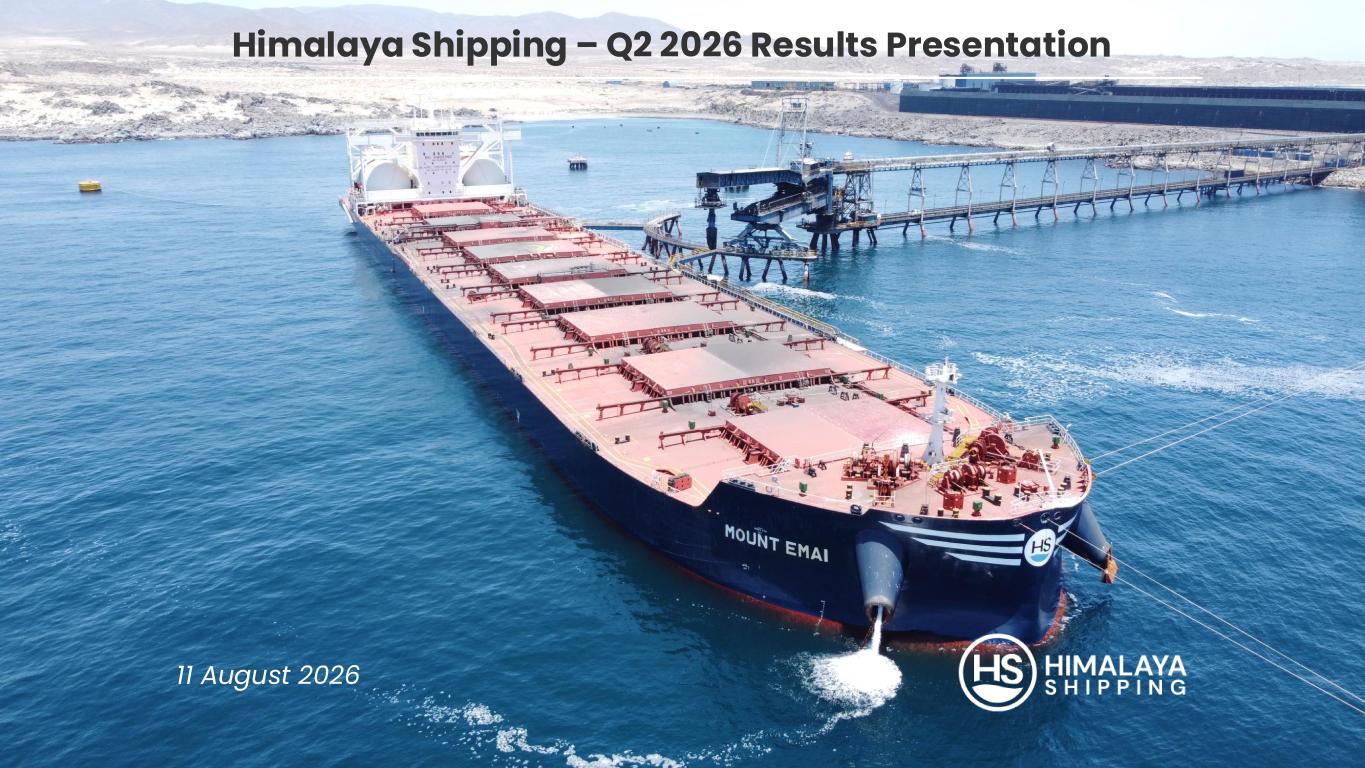
1 Himalaya Shipping – Q2 2026 Results Presentation 11 August 2026
2 Forward looking statements This results presentation and any related discussions, including any related written or oral statements made by us in this presentation, contain forward-looking statements within the meaning of Section 21E of the Securities Exchange Act of 1934 that are subject to risks and uncertainties. Forward-looking statements are statements that do not reflect historical facts and may be identified by words such as “aim”, “believe,” “assuming,” “anticipate,” “could,” “expect,” “intend,” “estimate,” “forecast,” “project,” “likely to,” “due to,” “plan,” “potential,” “will,” “may,” “should,” "indicative," "illustrative," "potential" or other similar expressions and include statements about plans, objectives, goals, strategies, future events or performance, including outlook, prospects, expected cash break-even, illustrative free cash flow per share and earnings potential based on different scenarios and assumptions, the terms of our charters and chartering activity, dry bulk industry trends and market outlook, potential upside in the Capesize market, including market conditions and activity levels in the industry, expected demand for vessels and expected drivers of demand including projects and underlying assumptions, utilization of the global fleet and our fleet, including expected average rates and the information under “Chartering Position” and “The Supply Situation,” fleet growth, vessel orders and order book, expected trends regarding iron ore volumes, including the information under “Significant Iron Ore Volume Increase – Driving Ton-Mile Demand,” expected trends in the bauxite market, mandatory dry-docking trends and impacts on expected supply of dry bulk vessels and yard capacity, statements about our dividend objectives and free cash flow distribution, expectations and plans, expectations on demand, and other non-historical statements. These forward-looking statements are not statements of historical fact and are based upon current estimates, expectations, beliefs, and various assumptions, many of which are based, in turn, upon further assumptions, a number of which are beyond our control and are difficult to predict. These statements are subject to significant uncertainties, contingencies and factors that are difficult or impossible to predict and are beyond our control, and that may cause our actual results, performance or achievements to be materially different from what is expressed, implied or forecasted in such forward-looking statements. Numerous factors, risks and uncertainties that could cause our actual results, level of activity, performance or achievements to differ materially from those expressed, implied or forecasted in the forward-looking statements include but are not limited to: general economic, political and business conditions; general dry bulk market conditions, including fluctuations in charter hire rates and vessel values; charter rates, operating days for our fleet and our ability to achieve charter rates above our break-even rate; changes in demand in the dry bulk shipping industry, including the market for our vessels; demand for the products our vessels carry and the status, timing and number of production of projects that produce iron ore and other products we ship; changes in the supply of dry bulk vessels; our ability to successfully re-employ our dry bulk vessels at the end of their current charters and the terms of future charters; changes in our operating expenses, including fuel or bunker prices, dry-docking and insurance costs; compliance with, and our liabilities under governmental, tax, environmental and safety laws and regulations; changes in governmental regulation, tax and trade matters and actions taken by regulatory authorities; potential disruption of shipping routes due to accidents, hostilities or political events including risks relating to military actions in the Middle East; our ability to refinance our debt and other obligations as they fall due; fluctuations in foreign currency exchange rates; potential conflicts of interest involving members of our board and management and our significant shareholder; the risk of a continued economic slowdown in China and other factors impacting demand from China; global economic and trade conditions, the impact of tariffs and trade wars, wars and geopolitical events and the risk of heightened geopolitical tensions, including the impact of military actions in the Middle East; changes in the size of the fleet or ton miles; the development of projects in Guinea and Brazil, including timing of completion, and output and impact of such projects on the Capesize market; our ability to pay dividends and cash distributions and the amount thereof; risks related to climate change, including climate-change or greenhouse gas-related legislation or regulations and the impact on our business from climate change-related physical changes or changes in weather patterns, and the potential impact of new regulations relating to climate change, as well as the impact of the foregoing on the performance of our vessels; other factors that may affect our financial condition, liquidity and results of operations; and other risks described under “Item 3. Key Information — D. Risk Factors” in our Annual Report on Form 20-F for the year ended December 31, 2025 filed with the U.S. Securities and Exchange Commission on March 12, 2026. The foregoing factors that could cause our actual results to differ materially from those contemplated in any forward-looking statement included in this report should not be construed as exhaustive. You should not place undue reliance on these forward-looking statements, which speak only as of the date of this presentation. Except as required by law, Himalaya Shipping undertakes no obligation to update publicly any forward-looking statements after the date of this investor presentation, whether as a result of new information, future events or otherwise. Non-GAAP Financial Measures This presentation contains certain selected financial measures on a basis other than U.S. generally accepted accounting principles (“GAAP”), including EBITDA, average TCE earnings, gross, and illustrative free cash flow. EBITDA represents our net income plus depreciation and amortization of fixed assets; total financial expenses, net; and income tax expense. EBITDA is presented because the Company believes this measure increases comparability of total business performance from period to period and against the performance of other companies. Average TCE earnings, gross, as presented here, represents time charter revenues and voyage charter revenues adding back address commissions and divided by operational days. Average TCE earnings, gross, is presented because the Company believes this measure provides additional meaningful information for investors to analyse our fleets’ daily income performance. For a reconciliation of EBITDA and average TCE earnings, gross, to the most directly comparable financial measures prepared in accordance with US GAAP, please see the Appendix entitled “Unaudited Non-GAAP Measures And Reconciliations” in our preliminary results for the three and six months ended June 30, 2026. For a discussion of illustrative free cash flow, see slide 11 including the footnotes thereto. We are unable to prepare a reconciliation of illustrative free cash flow without unreasonable effort.
3 Highlights Q2 2026 Highlights: • Net income of $24.6 million and EBITDA of $44.0 million for the quarter ended June 30, 2026. • Achieved time charter equivalent earnings of approximately $50,600 per day, gross. • Entered into a new time charter agreement for the Mount Emai for a period of 12 to 14 months at an index-linked rate, reflecting a significant premium to the Baltic 5TC 180 Capesize index. • Converted the index-linked time charters for four vessels to fixed rate time charters at an average rate of approximately $56,500 per day, gross, for the month of June 2026. • Cash distributions of $0.15, $0.22 and $0.22 per common share for April, May and June 2026. Subsequent Events: • Achieved time charter equivalent earnings for July 2026 of approximately $51,200 per day, gross. • Declared a cash distribution of $0.22 per common share for July 2026. • Entered into a new time charter agreement for the Mount Aconcagua for a period of 16 to 18 months at an index-linked rate, reflecting a significant premium to the Baltic 5TC 180 Capesize index. • Converted the index-linked time charters for two vessels to fixed rate charters at an average rate of approximately $51,200 per day, gross, from August 1, 2026, to December 31, 2026.
4 Financial Update
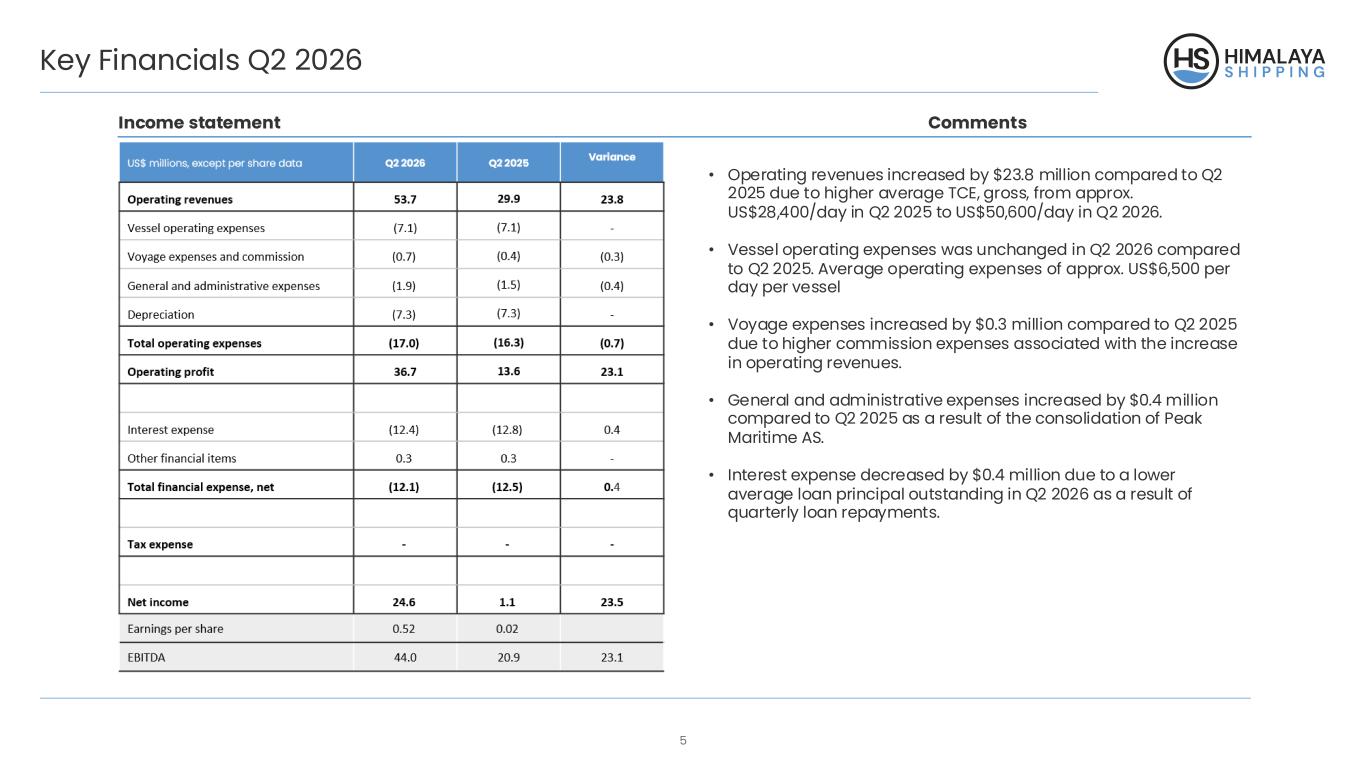
5 Key Financials Q2 2026 Income statement Comments • Operating revenues increased by $23.8 million compared to Q2 2025 due to higher average TCE, gross, from approx. US$28,400/day in Q2 2025 to US$50,600/day in Q2 2026. • Vessel operating expenses was unchanged in Q2 2026 compared to Q2 2025. Average operating expenses of approx. US$6,500 per day per vessel • Voyage expenses increased by $0.3 million compared to Q2 2025 due to higher commission expenses associated with the increase in operating revenues. • General and administrative expenses increased by $0.4 million compared to Q2 2025 as a result of the consolidation of Peak Maritime AS. • Interest expense decreased by $0.4 million due to a lower average loan principal outstanding in Q2 2026 as a result of quarterly loan repayments.
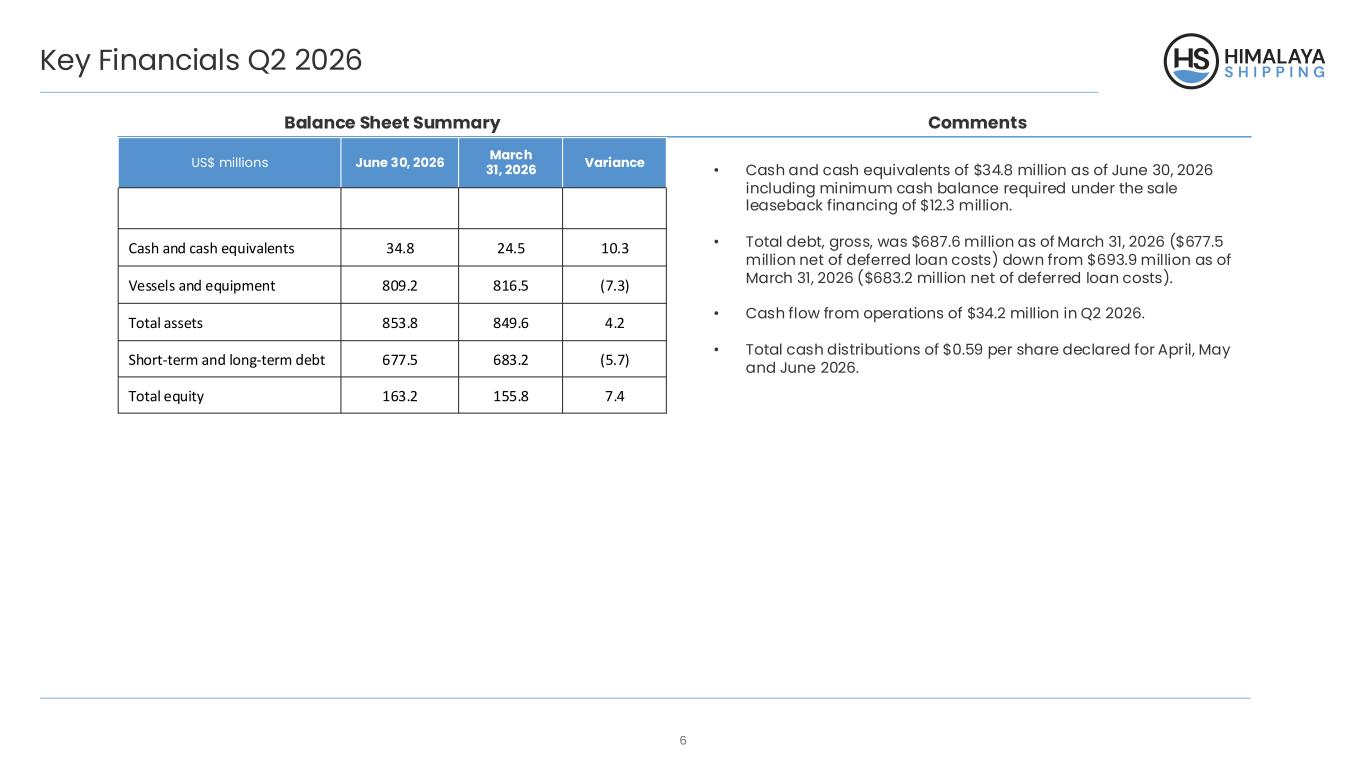
6 Key Financials Q2 2026 Balance Sheet Summary Comments • Cash and cash equivalents of $34.8 million as of June 30, 2026 including minimum cash balance required under the sale leaseback financing of $12.3 million. • Total debt, gross, was $687.6 million as of March 31, 2026 ($677.5 million net of deferred loan costs) down from $693.9 million as of March 31, 2026 ($683.2 million net of deferred loan costs). • Cash flow from operations of $34.2 million in Q2 2026. • Total cash distributions of $0.59 per share declared for April, May and June 2026. US$ millions June 30, 2026 March 31, 2026 Variance Cash and cash equivalents 34.8 24.5 10.3 Vessels and equipment 809.2 816.5 (7.3) Total assets 853.8 849.6 4.2 Short-term and long-term debt 677.5 683.2 (5.7) Total equity 163.2 155.8 7.4
7 Company update
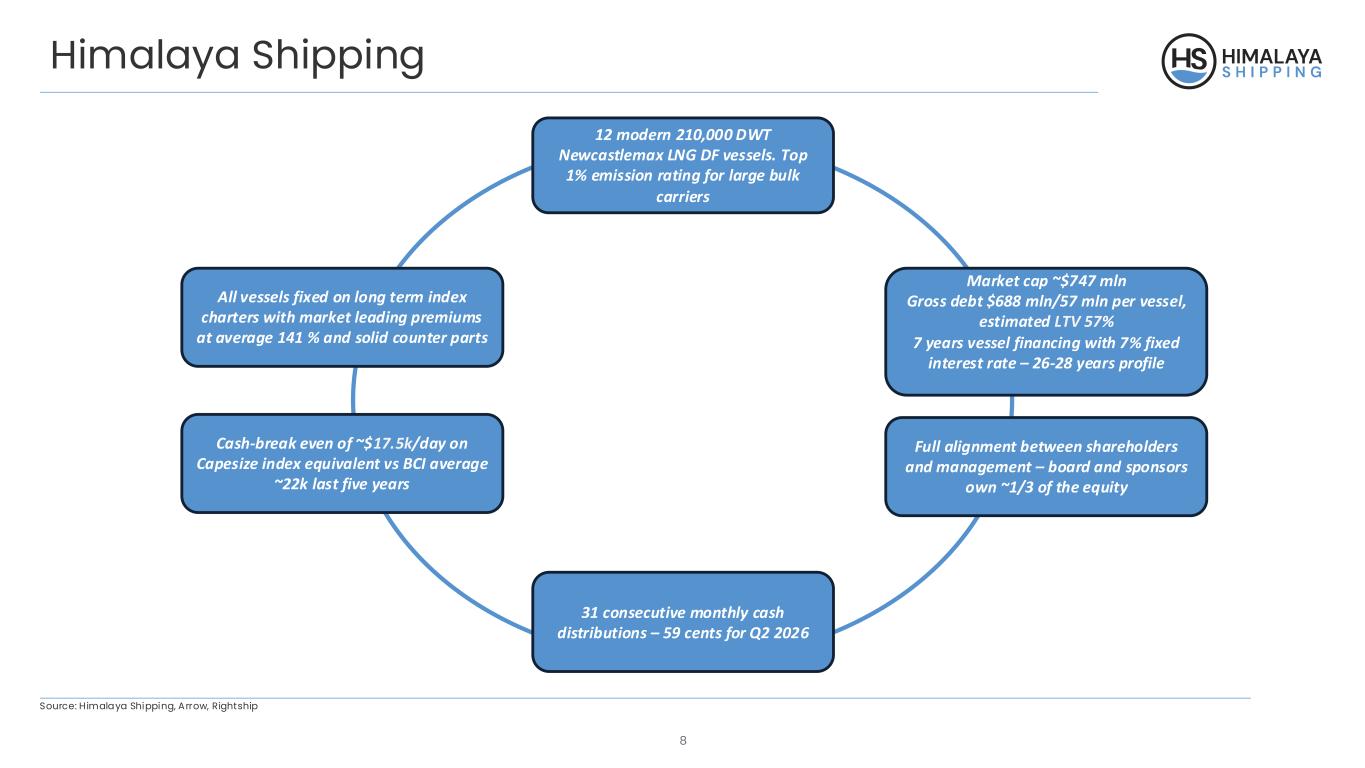
8 Himalaya Shipping 12 modern 210,000 DWT Newcastlemax LNG DF vessels. Top 1% emission rating for large bulk carriers Market cap ~$747 mln Gross debt $688 mln/57 mln per vessel, estimated LTV 57% 7 years vessel financing with 7% fixed interest rate – 26-28 years profile Cash-break even of ~$17.5k/day on Capesize index equivalent vs BCI average ~22k last five years All vessels fixed on long term index charters with market leading premiums at average 141 % and solid counter parts Full alignment between shareholders and management – board and sponsors own ~1/3 of the equity 31 consecutive monthly cash distributions – 59 cents for Q2 2026 Source: Himalaya Shipping, Arrow, Rightship
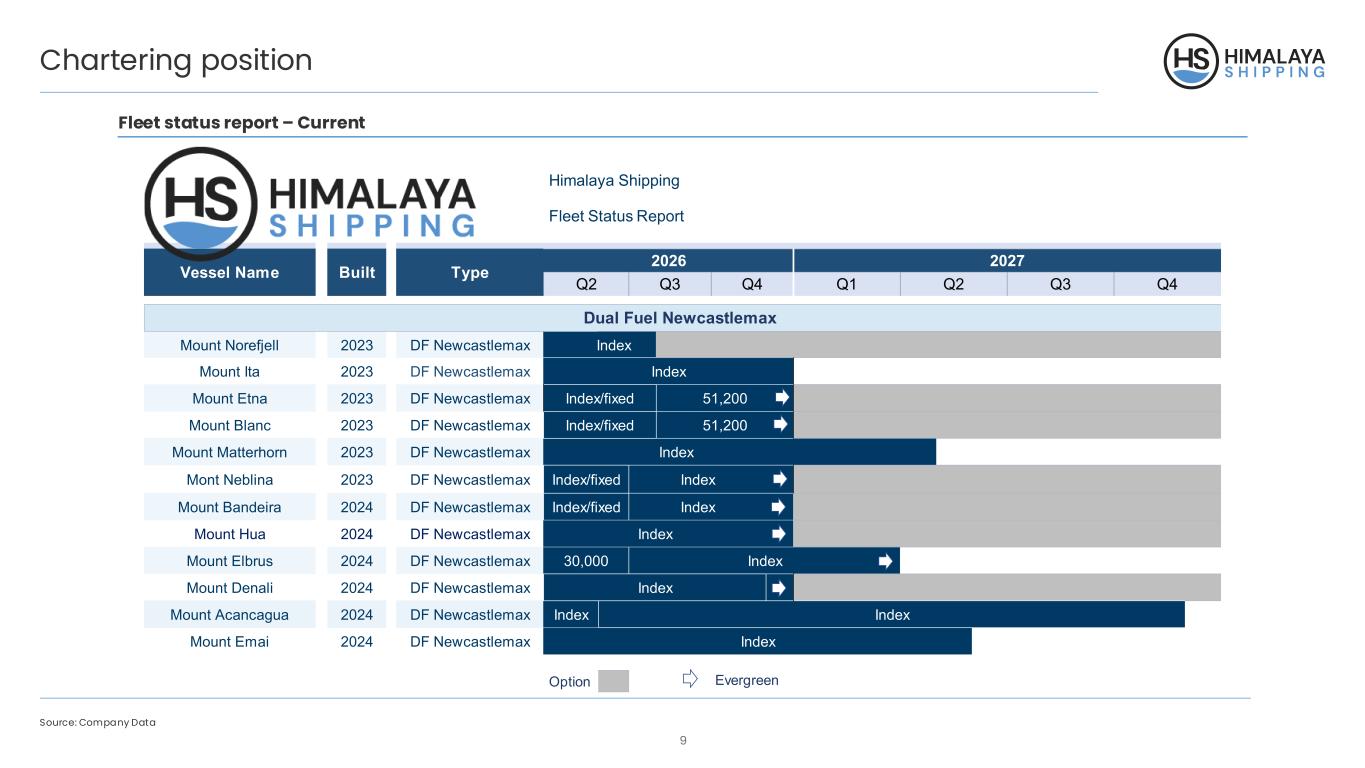
9 Source: Company Data Fleet status report – Current Chartering position Mount Norefjell 2023 DF Newcastlemax Index Mount Ita 2023 DF Newcastlemax Mount Etna 2023 DF Newcastlemax Mount Blanc 2023 DF Newcastlemax Mount Matterhorn 2023 DF Newcastlemax Index Mont Neblina 2023 DF Newcastlemax Mount Bandeira 2024 DF Newcastlemax Mount Hua 2024 DF Newcastlemax Mount Elbrus 2024 DF Newcastlemax Mount Denali 2024 DF Newcastlemax Mount Acancagua 2024 DF Newcastlemax Mount Emai 2024 DF Newcastlemax Index Index/fixed Index/fixed Index/fixed Index/fixed Index Index Index Index 30,000 Index Index Index 51,200 51,200 Q3 Q4 Dual Fuel Newcastlemax Index Q2 Q3 Q4 Q1 Q2 2027 Vessel Name Built Type 2026 Option Evergreen Himalaya Shipping Fleet Status Report
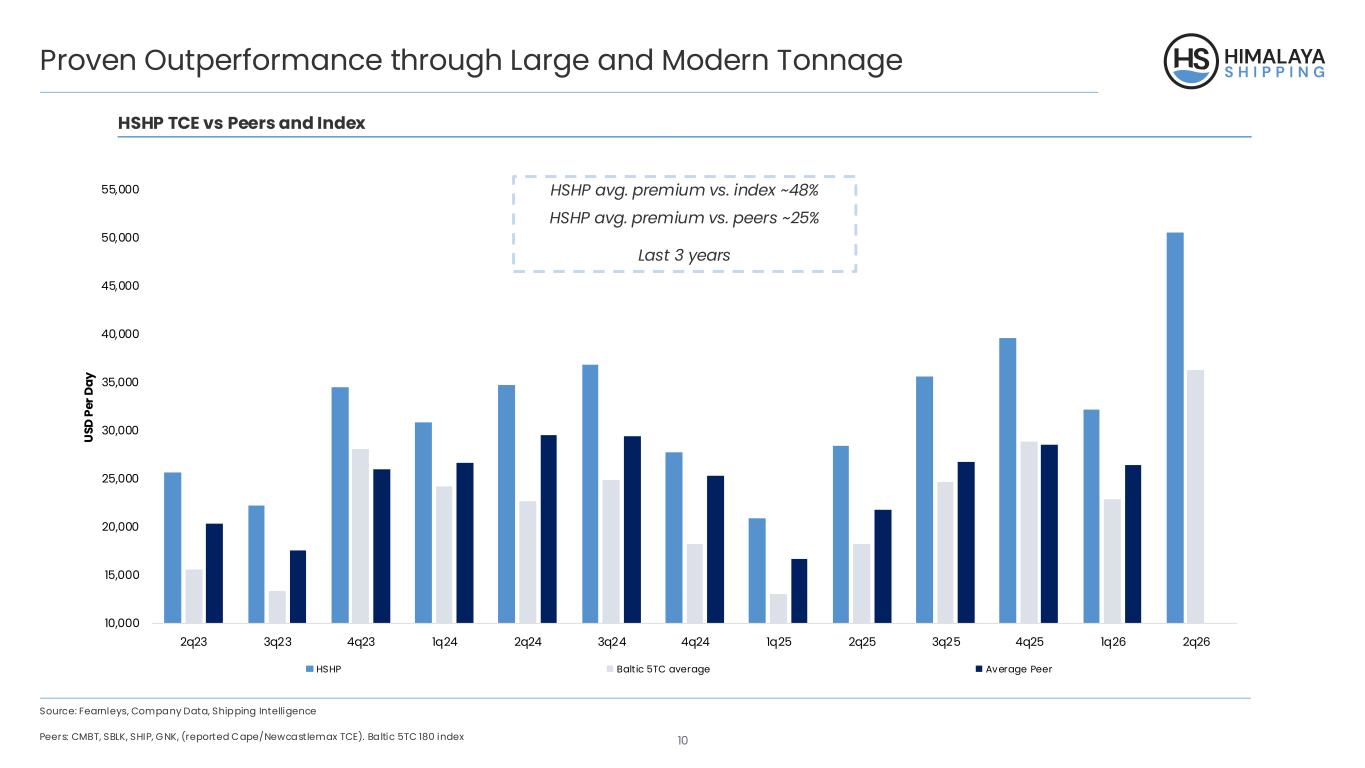
10 10,000 15,000 20,000 25,000 30,000 35,000 40,000 45,000 50,000 55,000 2q23 3q23 4q23 1q24 2q24 3q24 4q24 1q25 2q25 3q25 4q25 1q26 2q26 U SD P er D ay HSHP Baltic 5TC average Average Peer Proven Outperformance through Large and Modern Tonnage HSHP TCE vs Peers and Index Source: Fearnleys, Company Data, Shipping Intelligence Peers: CMBT, SBLK, SHIP, GNK, (reported Cape/Newcastlemax TCE). Baltic 5TC 180 index HSHP avg. premium vs. index ~48% HSHP avg. premium vs. peers ~25% Last 3 years
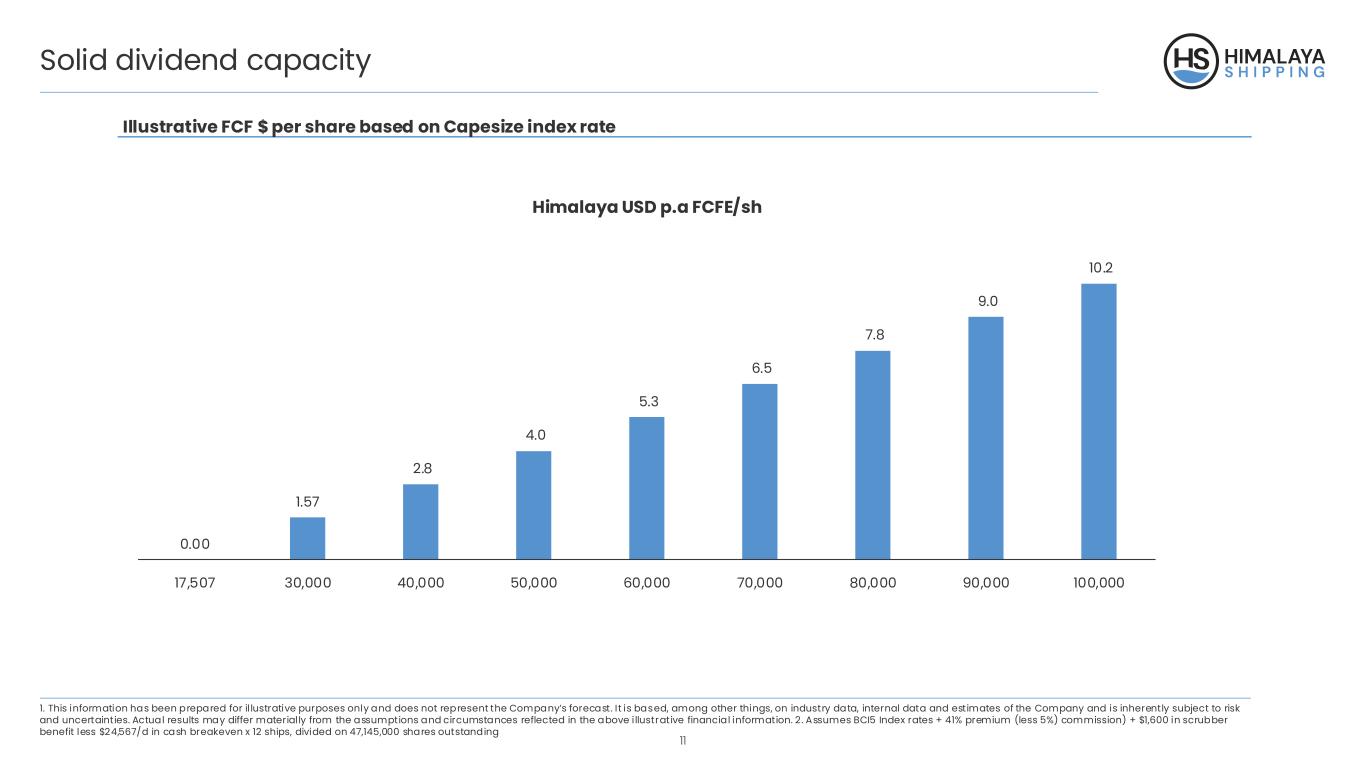
11 Solid dividend capacity Illustrative FCF $ per share based on Capesize index rate 1. This information has been prepared for il lustrative purposes only and does not represent the Company’s forecast. It is based, among other things, on industry data, internal data and estimates of the Company and is inherently subject to risk and uncertainties. Actual results may differ materially from the assumptions and circumstances reflected in the above illustrative financial information. 2. Assumes BCI5 Index rates + 41% premium (less 5%) commission) + $1,600 in scrubber benefit less $24,567/d in cash breakeven x 12 ships, divided on 47,145,000 shares outstanding 0.00 1.57 2.8 4.0 5.3 6.5 7.8 9.0 10.2 17,507 30,000 40,000 50,000 60,000 70,000 80,000 90,000 100,000 Himalaya USD p.a FCFE/sh
12 Market update
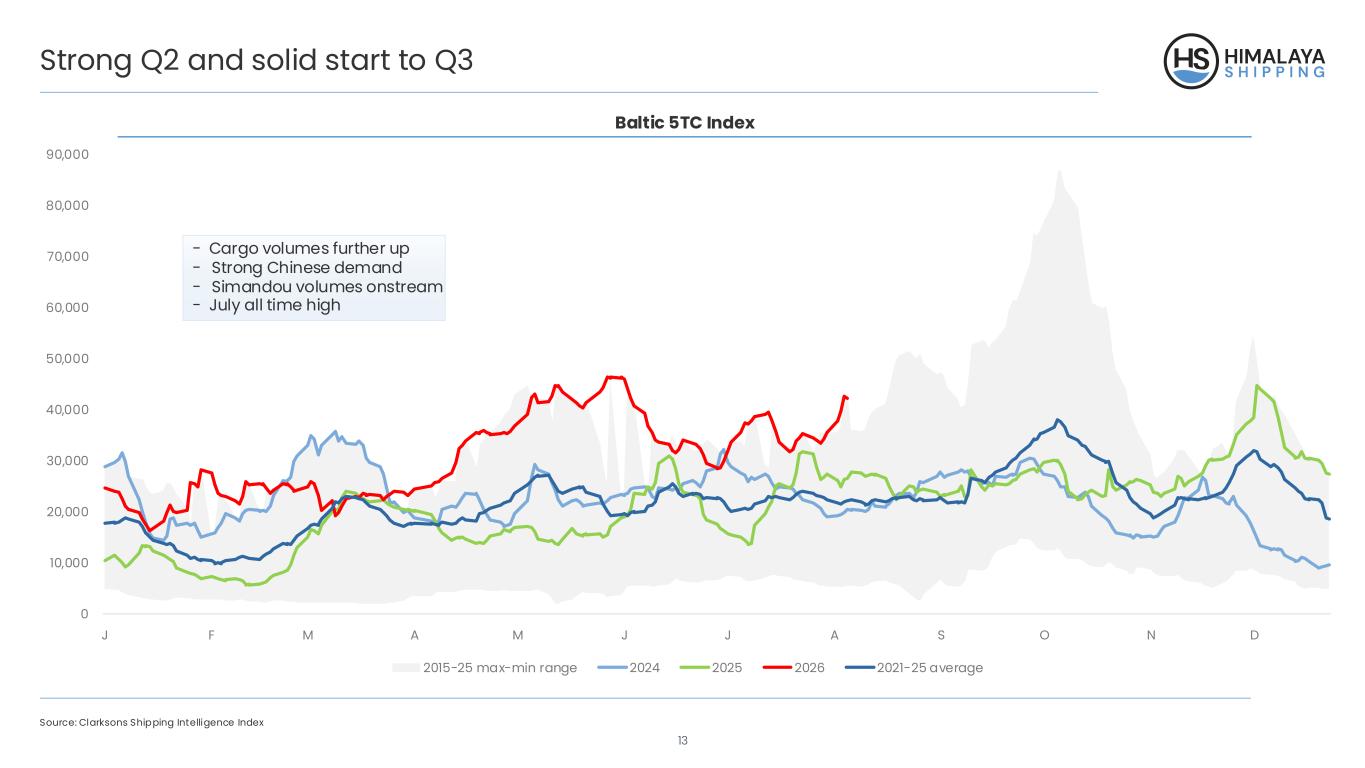
13 Strong Q2 and solid start to Q3 Baltic 5TC Index Source: Clarksons Shipping Intelligence Index 0 10,000 20,000 30,000 40,000 50,000 60,000 70,000 80,000 90,000 J F M A M J J A S O N D 2015-25 max-min range 2024 2025 2026 2021-25 average - Cargo volumes further up - Strong Chinese demand - Simandou volumes onstream - July all time high
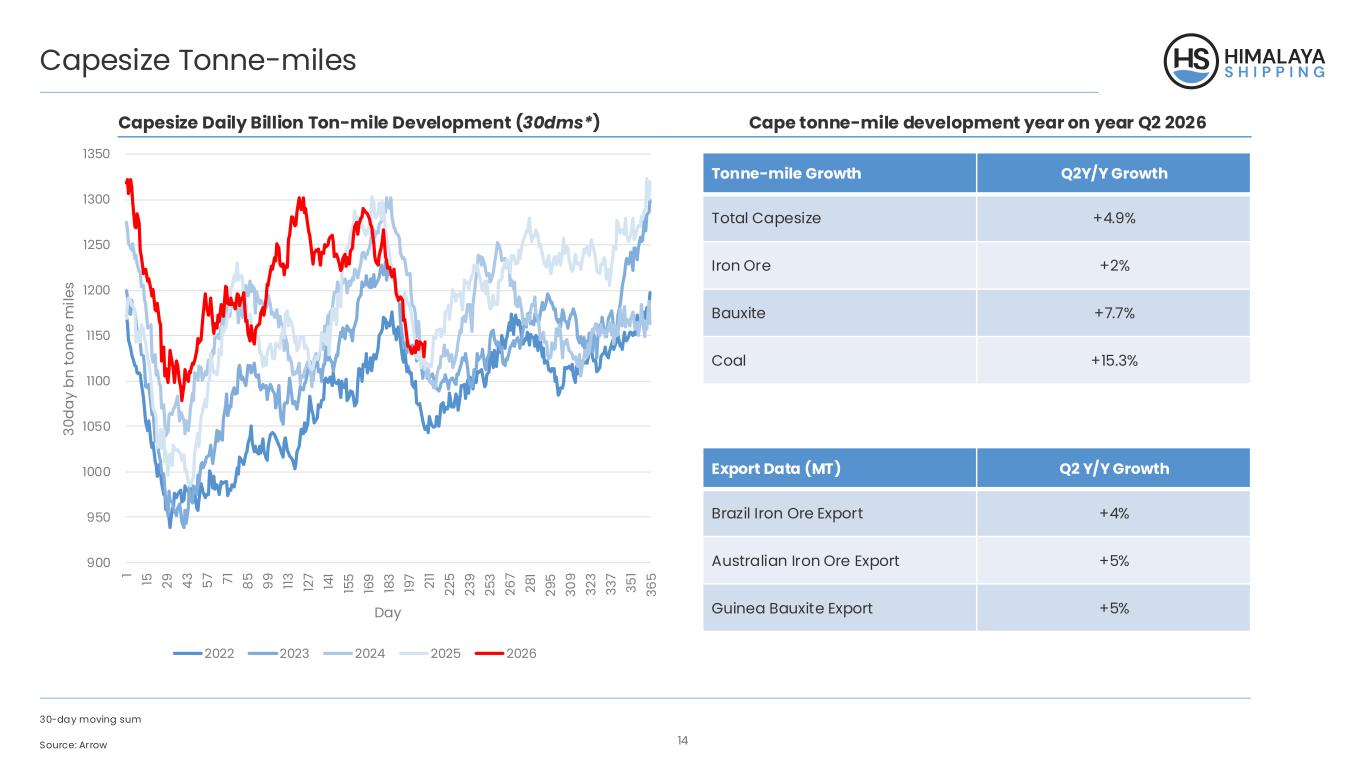
14 Capesize Tonne-miles Capesize Daily Billion Ton-mile Development (30dms*) Cape tonne-mile development year on year Q2 2026 30-day moving sum Source: Arrow Tonne-mile Growth Q2Y/Y Growth Total Capesize +4.9% Iron Ore +2% Bauxite +7.7% Coal +15.3% Export Data (MT) Q2 Y/Y Growth Brazil Iron Ore Export +4% Australian Iron Ore Export +5% Guinea Bauxite Export +5% 900 950 1000 1050 1100 1150 1200 1250 1300 1350 1 15 29 43 57 71 85 99 113 12 7 14 1 15 5 16 9 18 3 19 7 21 1 22 5 23 9 25 3 26 7 28 1 29 5 30 9 32 3 33 7 35 1 36 5 30 da y bn to nn e m ile s Day 2022 2023 2024 2025 2026
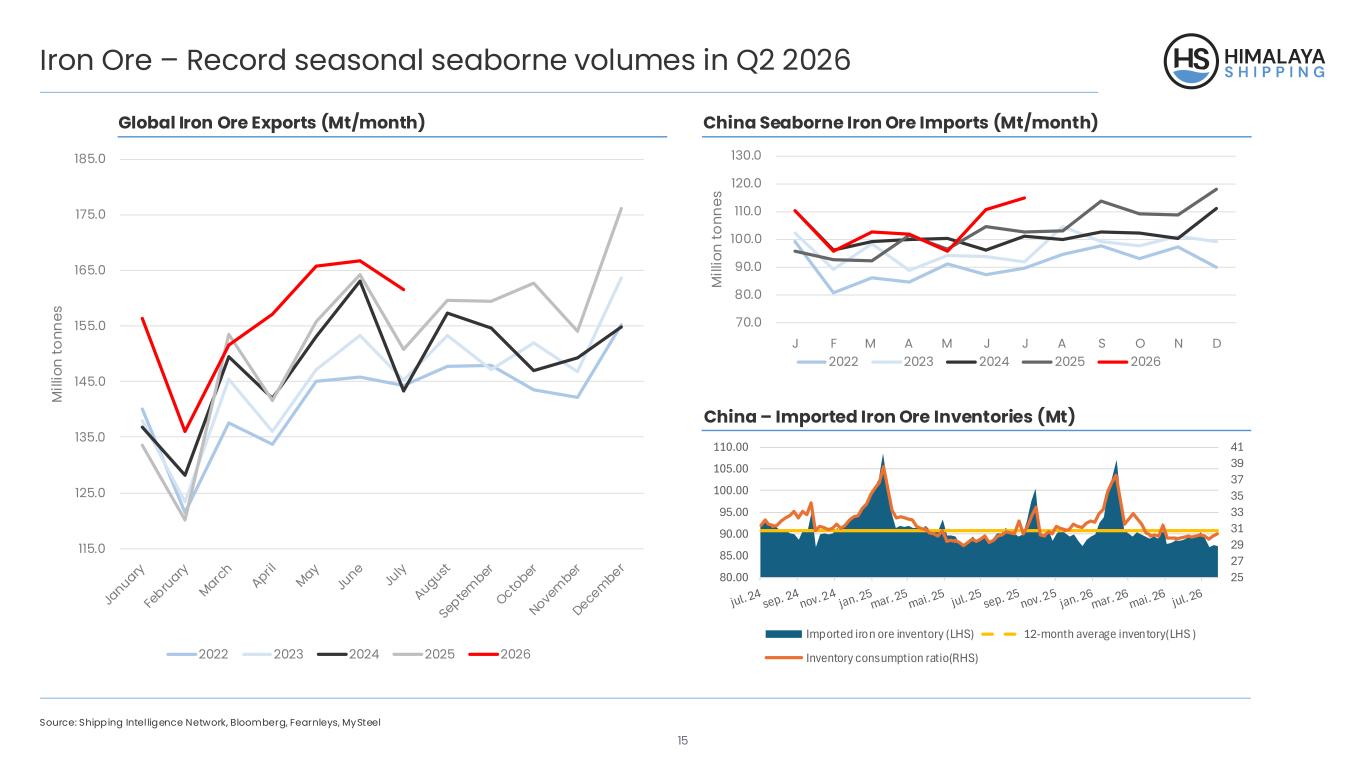
15 Iron Ore – Record seasonal seaborne volumes in Q2 2026 Source: Shipping Intelligence Network, Bloomberg, Fearnleys, MySteel China Seaborne Iron Ore Imports (Mt/month) China – Imported Iron Ore Inventories (Mt) Global Iron Ore Exports (Mt/month) 115.0 125.0 135.0 145.0 155.0 165.0 175.0 185.0 M ill io n to nn es 2022 2023 2024 2025 2026 70.0 80.0 90.0 100.0 110.0 120.0 130.0 J F M A M J J A S O N D M ill io n to nn es 2022 2023 2024 2025 2026 25 27 29 31 33 35 37 39 41 80.00 85.00 90.00 95.00 100.00 105.00 110.00 Imported iron ore inventory (LHS) 12-month average inventory(LHS ) Inventory consumption ratio(RHS)
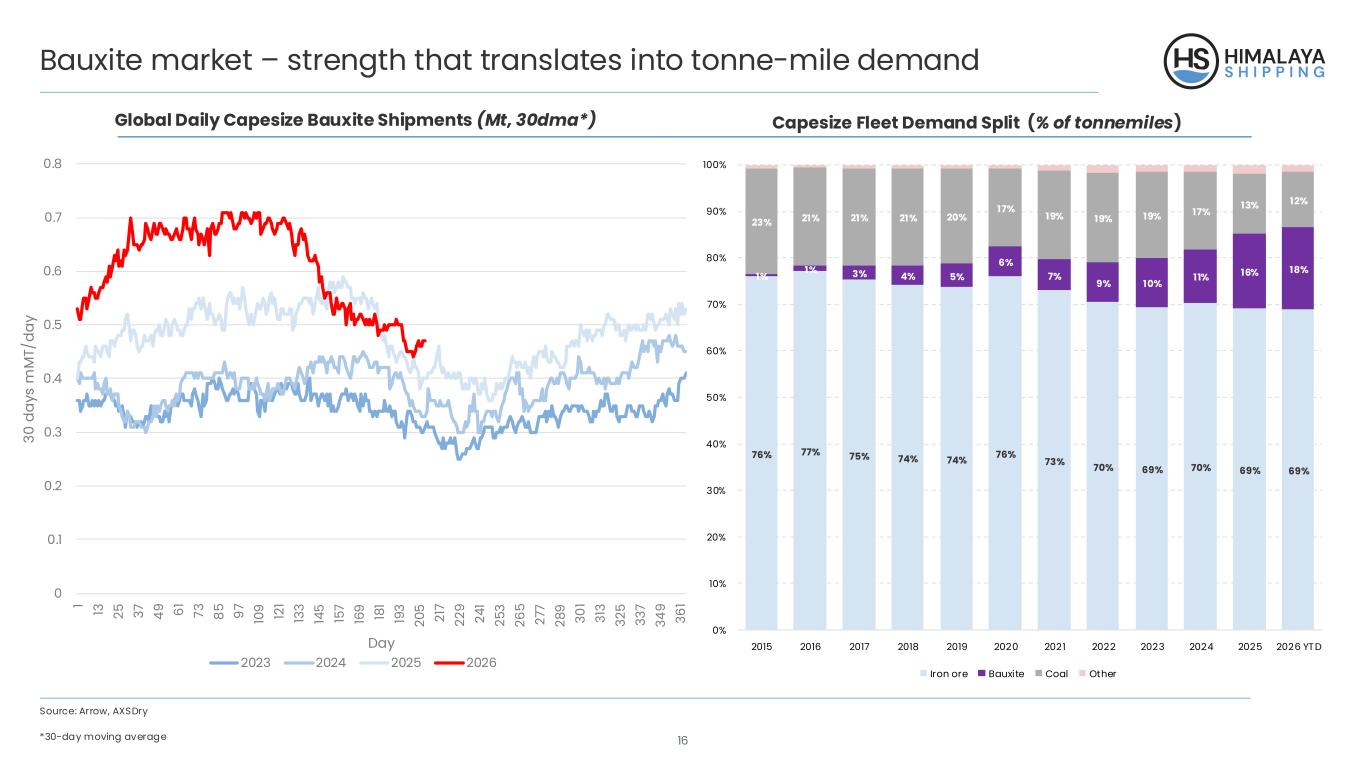
16 Bauxite market – strength that translates into tonne-mile demand Capesize Fleet Demand Split (% of tonnemiles)Global Daily Capesize Bauxite Shipments (Mt, 30dma*) Source: Arrow, AXSDry *30-day moving average 76% 77% 75% 74% 74% 76% 73% 70% 69% 70% 69% 69% 1% 1% 3% 4% 5% 6% 7% 9% 10% 11% 16% 18% 23% 21% 21% 21% 20% 17% 19% 19% 19% 17% 13% 12% 0% 10% 20% 30% 40% 50% 60% 70% 80% 90% 100% 2015 2016 2017 2018 2019 2020 2021 2022 2023 2024 2025 2026 YTD Iron ore Bauxite Coal Other 0 0.1 0.2 0.3 0.4 0.5 0.6 0.7 0.8 1 13 25 37 49 61 73 85 97 10 9 12 1 13 3 14 5 15 7 16 9 18 1 19 3 20 5 21 7 22 9 24 1 25 3 26 5 27 7 28 9 30 1 31 3 32 5 33 7 34 9 36 1 30 d ay s m M T/ da y Day 2023 2024 2025 2026
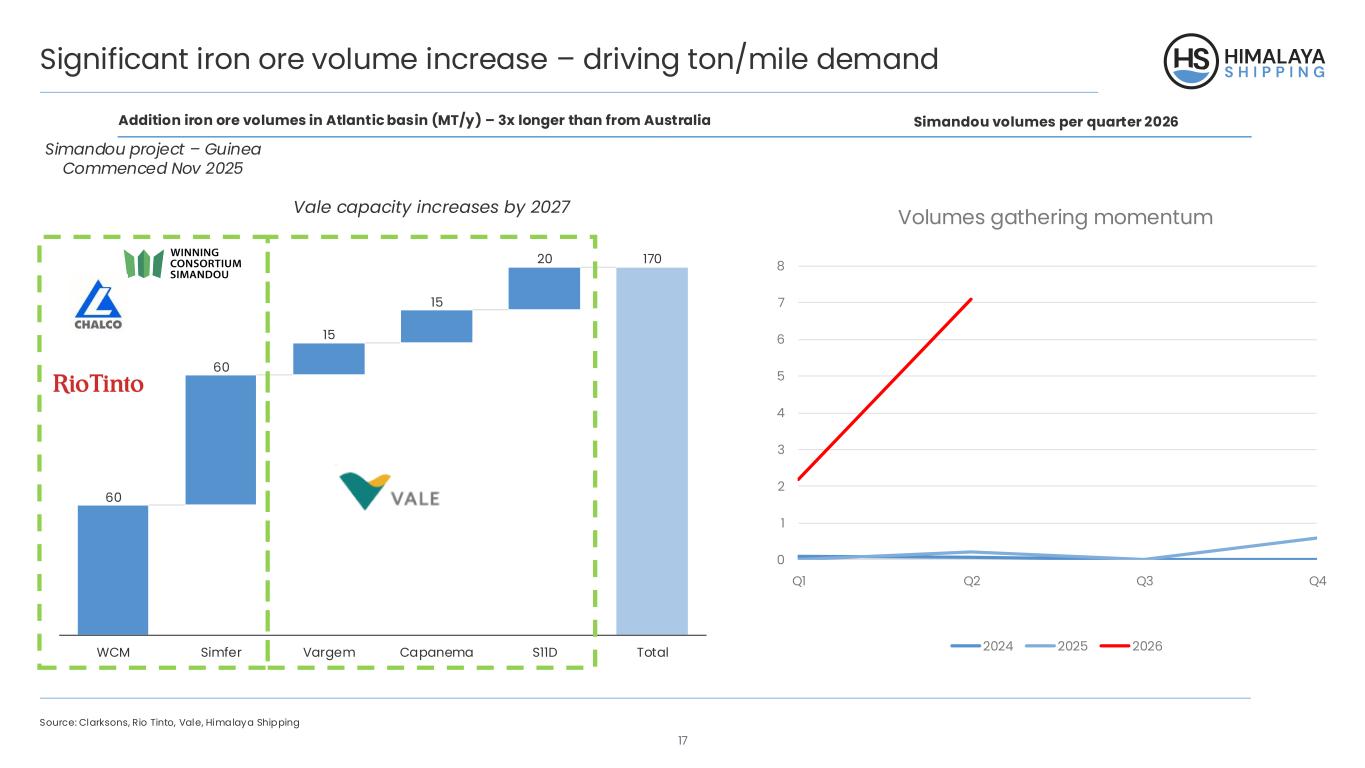
17 60 60 15 15 20 170 WCM Simfer Vargem Capanema S11D Total Significant iron ore volume increase – driving ton/mile demand Addition iron ore volumes in Atlantic basin (MT/y) – 3x longer than from Australia Simandou volumes per quarter 2026 Source: Clarksons, Rio Tinto, Vale, Himalaya Shipping Simandou project – Guinea Commenced Nov 2025 Vale capacity increases by 2027 0 1 2 3 4 5 6 7 8 Q1 Q2 Q3 Q4 Volumes gathering momentum 2024 2025 2026
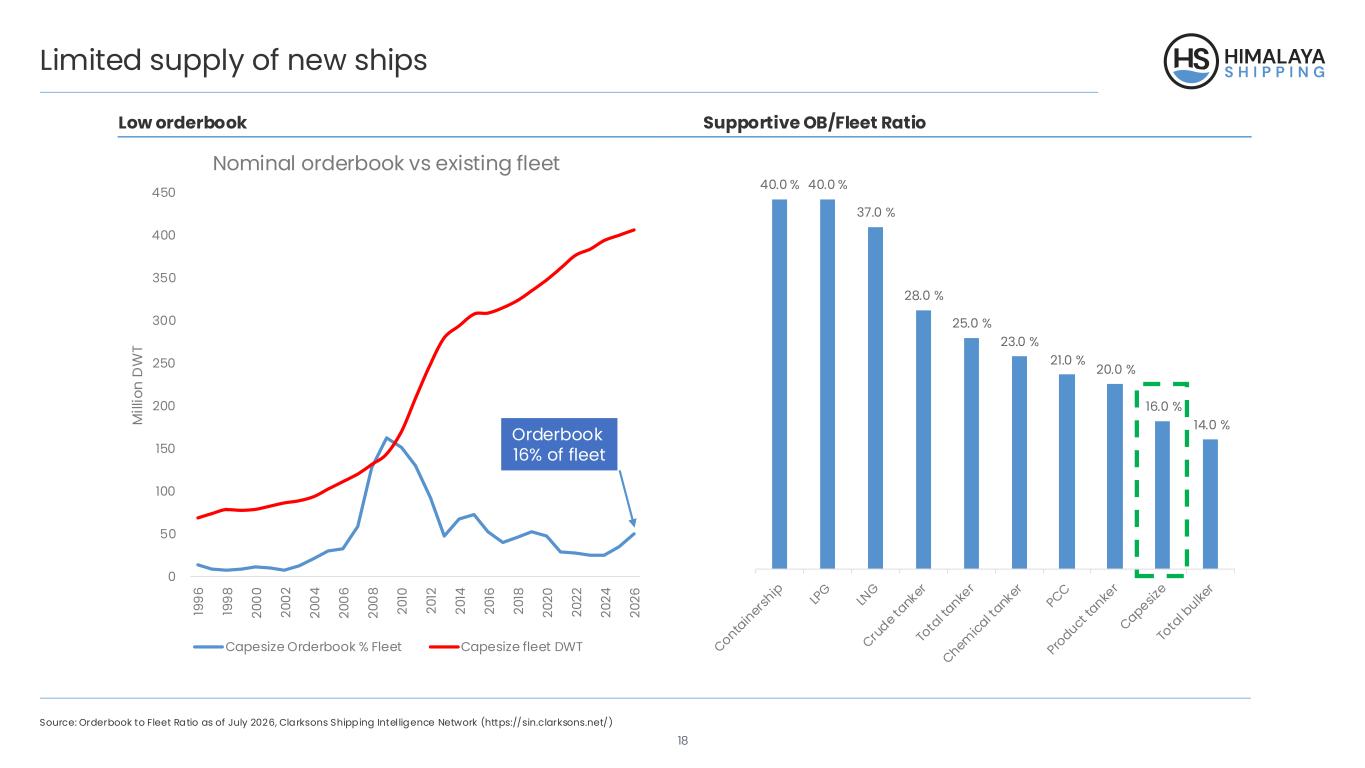
18 40.0 % 40.0 % 37.0 % 28.0 % 25.0 % 23.0 % 21.0 % 20.0 % 16.0 % 14.0 % Limited supply of new ships Low orderbook Supportive OB/Fleet Ratio Source: Orderbook to Fleet Ratio as of July 2026, Clarksons Shipping Intelligence Network (https://sin.clarksons.net/) 0 50 100 150 200 250 300 350 400 450 19 96 19 98 20 00 20 02 20 04 20 06 20 08 20 10 20 12 20 14 20 16 20 18 20 20 20 22 20 24 20 26 M ill io n D W T Nominal orderbook vs existing fleet Capesize Orderbook % Fleet Capesize fleet DWT Orderbook 16% of fleet
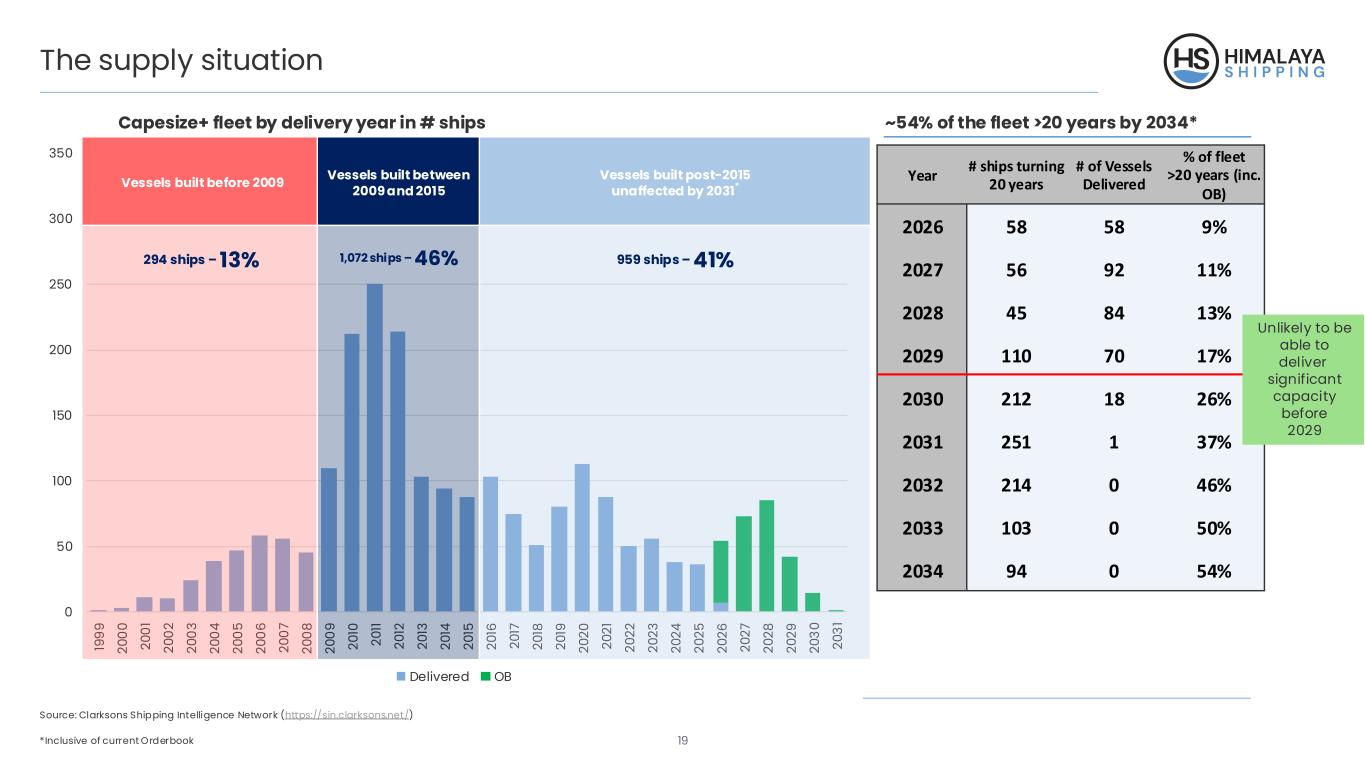
19 The supply situation Capesize+ fleet by delivery year in # ships Source: Clarksons Shipping Intelligence Network (https://sin.clarksons.net/) *Inclusive of current Orderbook ~54% of the fleet >20 years by 2034* Year # ships turning 20 years # of Vessels Delivered % of fleet >20 years (inc. OB) 2026 58 58 9% 2027 56 92 11% 2028 45 84 13% 2029 110 70 17% 2030 212 18 26% 2031 251 1 37% 2032 214 0 46% 2033 103 0 50% 2034 94 0 54% Unlikely to be able to deliver significant capacity before 2029 0 50 100 150 200 250 300 350 19 99 20 00 20 01 20 02 20 03 20 04 20 05 20 06 20 07 20 08 20 09 20 10 20 11 20 12 20 13 20 14 20 15 20 16 20 17 20 18 20 19 20 20 20 21 20 22 20 23 20 24 20 25 20 26 20 27 20 28 20 29 20 30 20 31 Delivered OB Vessels built before 2009 Vessels built between 2009 and 2015 Vessels built post-2015 unaffected by 2031* 294 ships – 13% 1,072 ships – 46% 959 ships – 41%
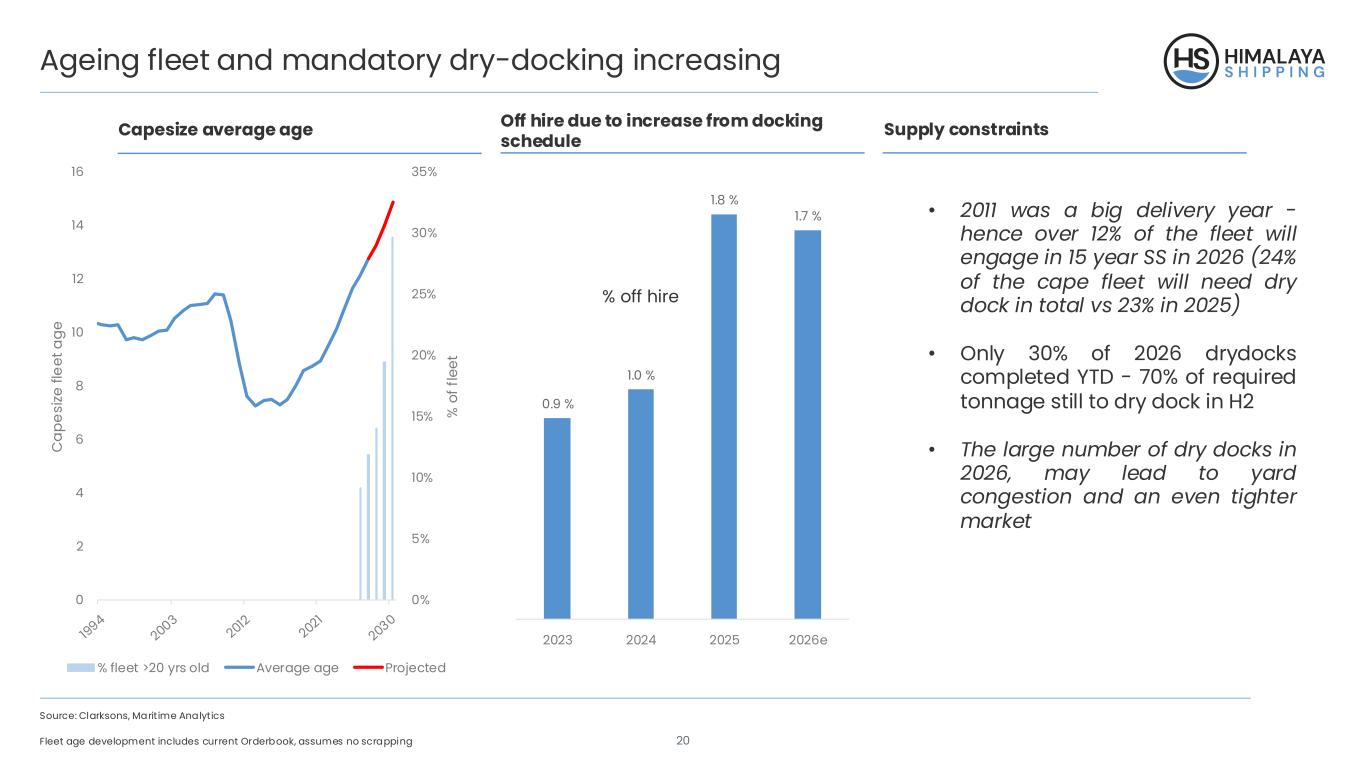
20 Ageing fleet and mandatory dry-docking increasing Capesize average age Supply constraints Source: Clarksons, Maritime Analytics Fleet age development includes current Orderbook, assumes no scrapping Off hire due to increase from docking schedule % off hire • 2011 was a big delivery year - hence over 12% of the fleet will engage in 15 year SS in 2026 (24% of the cape fleet will need dry dock in total vs 23% in 2025) • Only 30% of 2026 drydocks completed YTD - 70% of required tonnage still to dry dock in H2 • The large number of dry docks in 2026, may lead to yard congestion and an even tighter market 0.9 % 1.0 % 1.8 % 1.7 % 2023 2024 2025 2026e 0% 5% 10% 15% 20% 25% 30% 35% 0 2 4 6 8 10 12 14 16 % o f f le et C ap es ize fl ee t a ge % fleet >20 yrs old Average age Projected
21 Thank you