
2026 Second Quarter Results A U G U S T 1 0 , 2 0 2 6
2 Forward-Looking Statements This Presentation contains “forward-looking statements” within the meaning of the Private Securities Litigation Reform Act of 1995. Such forward looking statements involve risks and uncertainties. Forward-looking statements are often identified by words such as “anticipate,” “believe,” “could,” “estimate,” “expect,” “intend,” “may,” “might,” “plan,” “potential,” “predict,” “project,” “should,” “target,” “will,” “would,” and similar expressions, or the negative of these terms or other comparable terminology. These statements include, but are not limited to, statements regarding the Company’s future financial performance, business strategy, market opportunities, anticipated financial position, liquidity and capital needs, and other statements that are not historical facts. These statements are based on various assumptions, whether or not identified in this Presentation, and on the current expectations and assumptions of the Company’s management, which are inherently subject to uncertainties, risks and changes in circumstances that are difficult to predict, including as detailed in our filings with the Securities and Exchange Commission (the "SEC"). Moreover, we operate in a very competitive and rapidly changing environment and new risks emerge from time to time. It is not possible for our management to predict all risks, many of which are outside the control of the Company, nor can we assess the impact of all factors on our business or the extent to which any factor, or combination of factors, may cause actual results to differ materially from those discussed in the forward-looking statements. In light of these risks, uncertainties and assumptions, the future events and trends discussed in this Presentation may not occur and actual results could differ materially and adversely from those anticipated or implied in the forward-looking statements and we cannot guarantee any future performance, conditions or results. We undertake no obligation to update or revise any forward-looking statements, whether as a result of new information, future events or otherwise, except as required by law. Given these risks and uncertainties, readers are cautioned not to place undue reliance on such forward-looking statements. Copies or our filings with the SEC can be found on our investor relations website (investors.pphcompany.com) or on the SEC website (www.sec.gov). Industry Information Market data and estimates used throughout this Presentation are based on information from independent third parties and other publicly available information in addition to management’s internal estimates. Such data involves a number of assumptions and limitations, and you are cautioned not to give undue weight to such estimates. No representations or warranties are made by the Company or any of its affiliates as to the accuracy of any such information. Projections, assumptions and estimates of the future performance of the industry in which the Company operates are necessarily subject to a high degree of uncertainty and risk due to a variety of factors. These and other factors could cause results to differ materially from those expressed in management’s estimates and beliefs and in the estimates prepared by independent parties. Rounding Certain monetary amounts, percentages and other figures included elsewhere in this document have been subject to rounding adjustments. Accordingly, figures shown as totals in certain tables or charts may not be the arithmetic aggregation of the figures that precede them, and figures expressed as percentages in the text may not total 100% or, as applicable, when aggregated may not be the arithmetic aggregation of the percentages that precede them. Disclosures
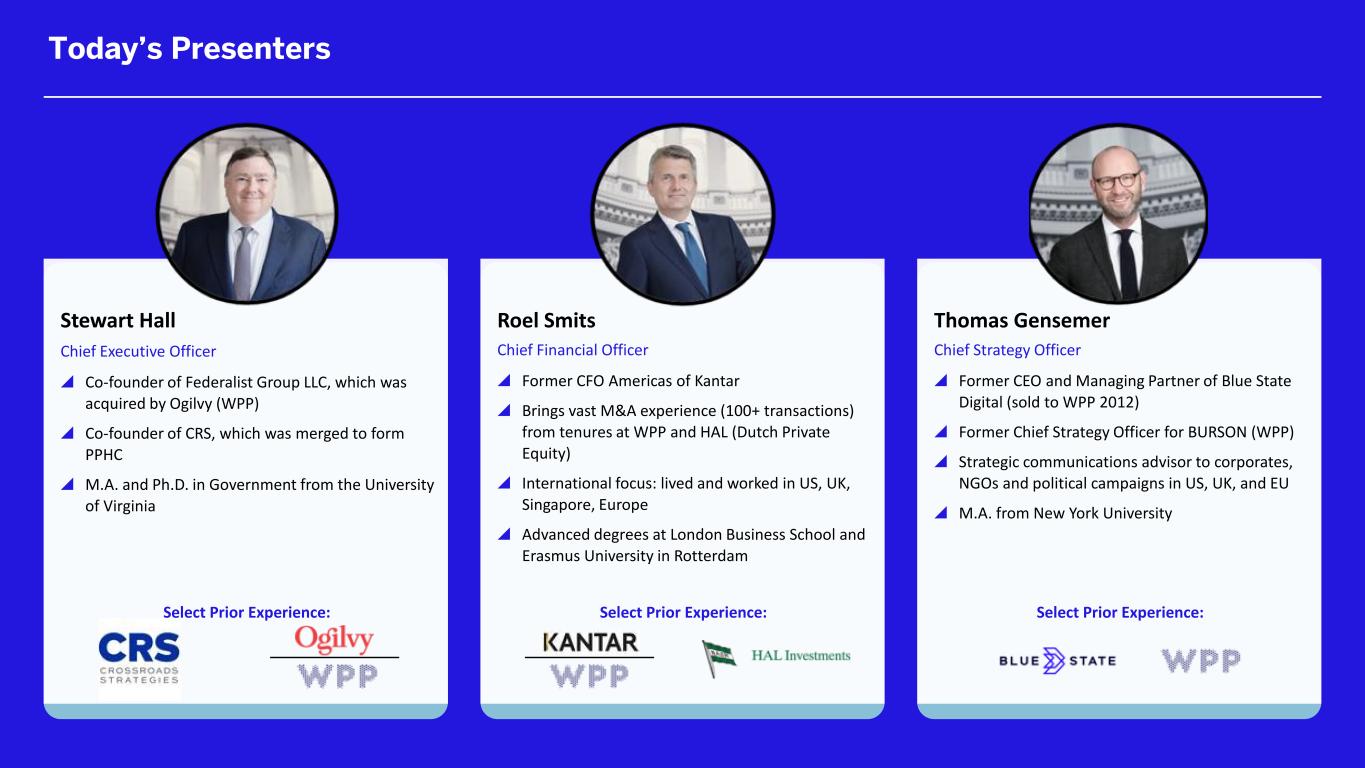
3 Stewart Hall Chief Executive Officer Co-founder of Federalist Group LLC, which was acquired by Ogilvy (WPP) Co-founder of CRS, which was merged to form PPHC M.A. and Ph.D. in Government from the University of Virginia Roel Smits Chief Financial Officer Former CFO Americas of Kantar Brings vast M&A experience (100+ transactions) from tenures at WPP and HAL (Dutch Private Equity) International focus: lived and worked in US, UK, Singapore, Europe Advanced degrees at London Business School and Erasmus University in Rotterdam Thomas Gensemer Chief Strategy Officer Former CEO and Managing Partner of Blue State Digital (sold to WPP 2012) Former Chief Strategy Officer for BURSON (WPP) Strategic communications advisor to corporates, NGOs and political campaigns in US, UK, and EU M.A. from New York University Select Prior Experience: Select Prior Experience: Select Prior Experience: Today’s Presenters
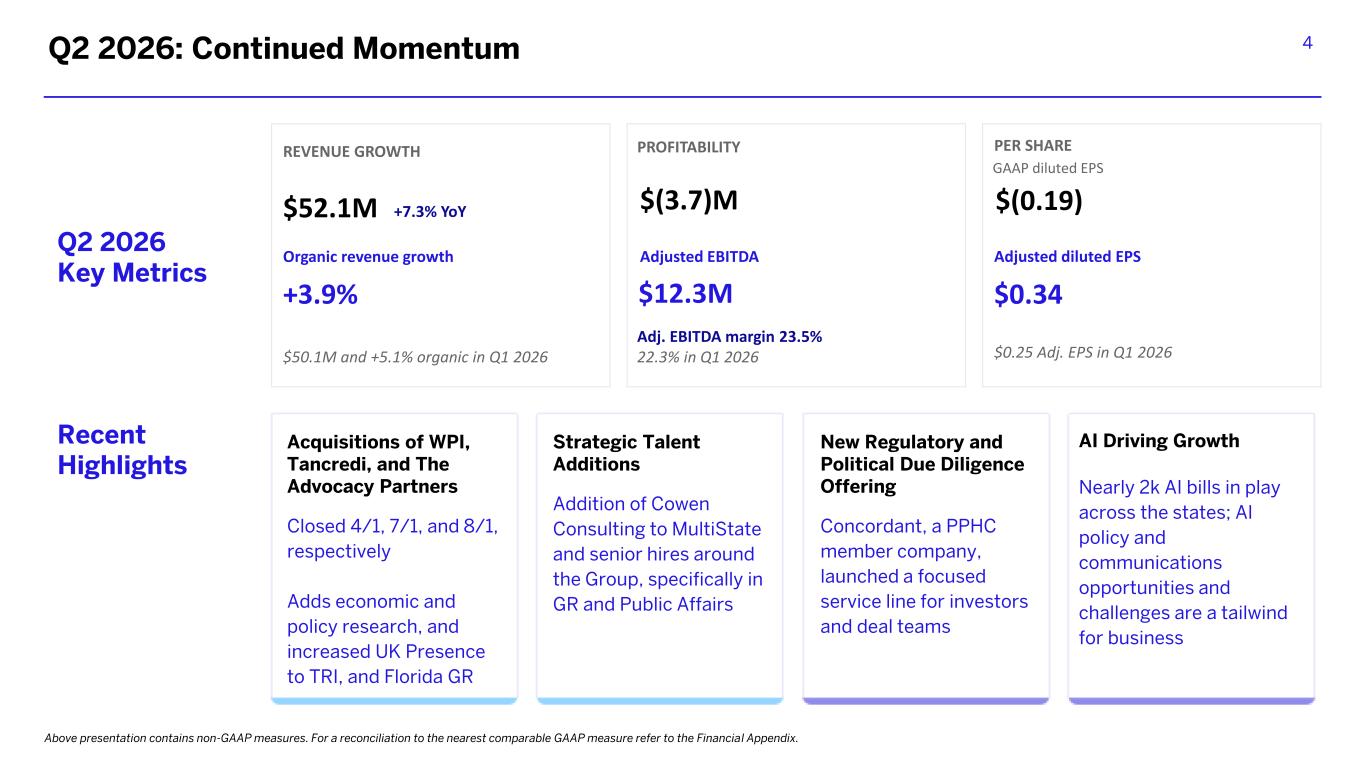
4Q2 2026: Continued Momentum Above presentation contains non-GAAP measures. For a reconciliation to the nearest comparable GAAP measure refer to the Financial Appendix. Q2 2026 Key Metrics Recent Highlights Acquisitions of WPI, Tancredi, and The Advocacy Partners Closed 4/1, 7/1, and 8/1, respectively Adds economic and policy research, and increased UK Presence to TRI, and Florida GR Strategic Talent Additions Addition of Cowen Consulting to MultiState and senior hires around the Group, specifically in GR and Public Affairs New Regulatory and Political Due Diligence Offering Concordant, a PPHC member company, launched a focused service line for investors and deal teams REVENUE GROWTH $52.1M +7.3% YoY $50.1M and +5.1% organic in Q1 2026 PROFITABILITY $(3.7)M Adjusted EBITDA $12.3M Adj. EBITDA margin 23.5% 22.3% in Q1 2026 PER SHARE GAAP diluted EPS $(0.19) Adjusted diluted EPS $0.34 $0.25 Adj. EPS in Q1 2026 Organic revenue growth +3.9% AI Driving Growth Nearly 2k AI bills in play across the states; AI policy and communications opportunities and challenges are a tailwind for business
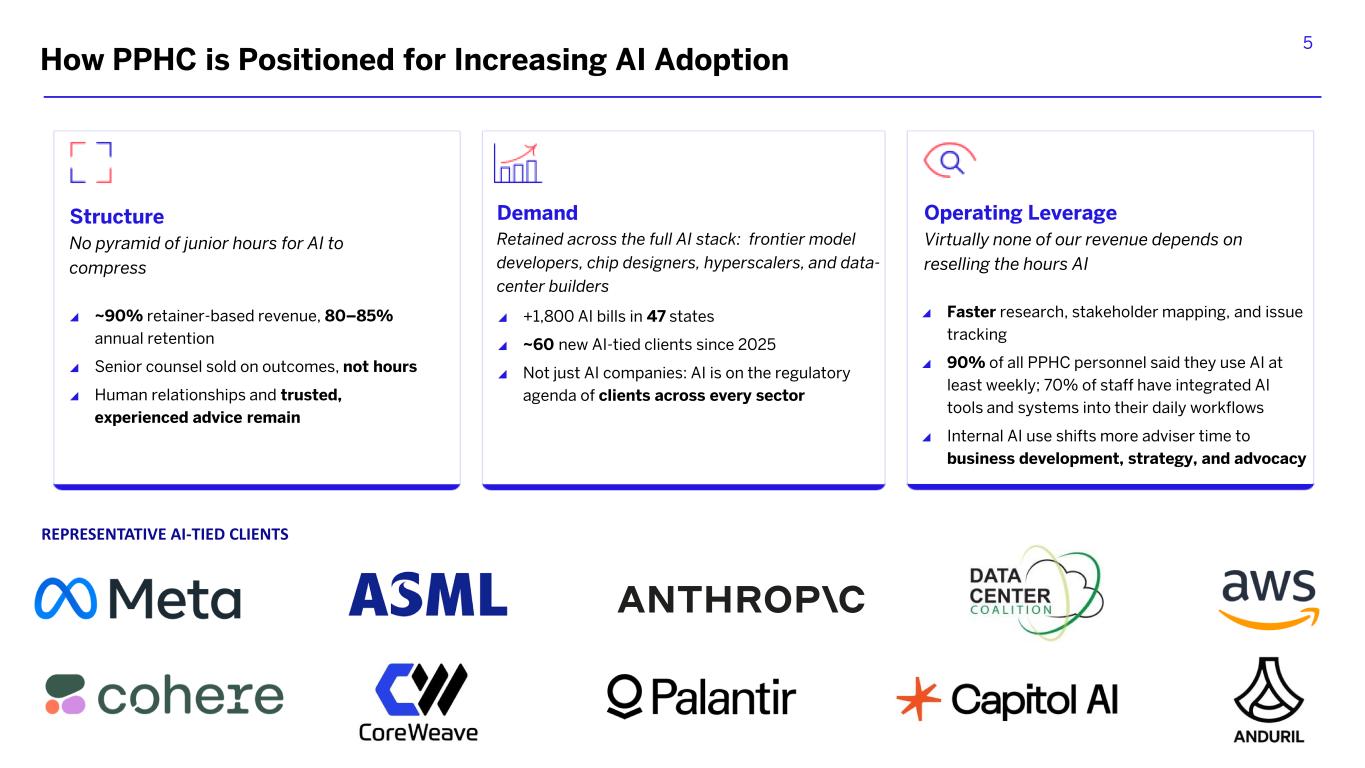
5 Structure No pyramid of junior hours for AI to compress Demand Retained across the full AI stack: frontier model developers, chip designers, hyperscalers, and data- center builders Faster research, stakeholder mapping, and issue tracking 90% of all PPHC personnel said they use AI at least weekly; 70% of staff have integrated AI tools and systems into their daily workflows Internal AI use shifts more adviser time to business development, strategy, and advocacy ~90% retainer-based revenue, 80–85% annual retention Senior counsel sold on outcomes, not hours Human relationships and trusted, experienced advice remain +1,800 AI bills in 47 states ~60 new AI-tied clients since 2025 Not just AI companies: AI is on the regulatory agenda of clients across every sector Operating Leverage Virtually none of our revenue depends on reselling the hours AI REPRESENTATIVE AI-TIED CLIENTS How PPHC is Positioned for Increasing AI Adoption

6 Financial Summary
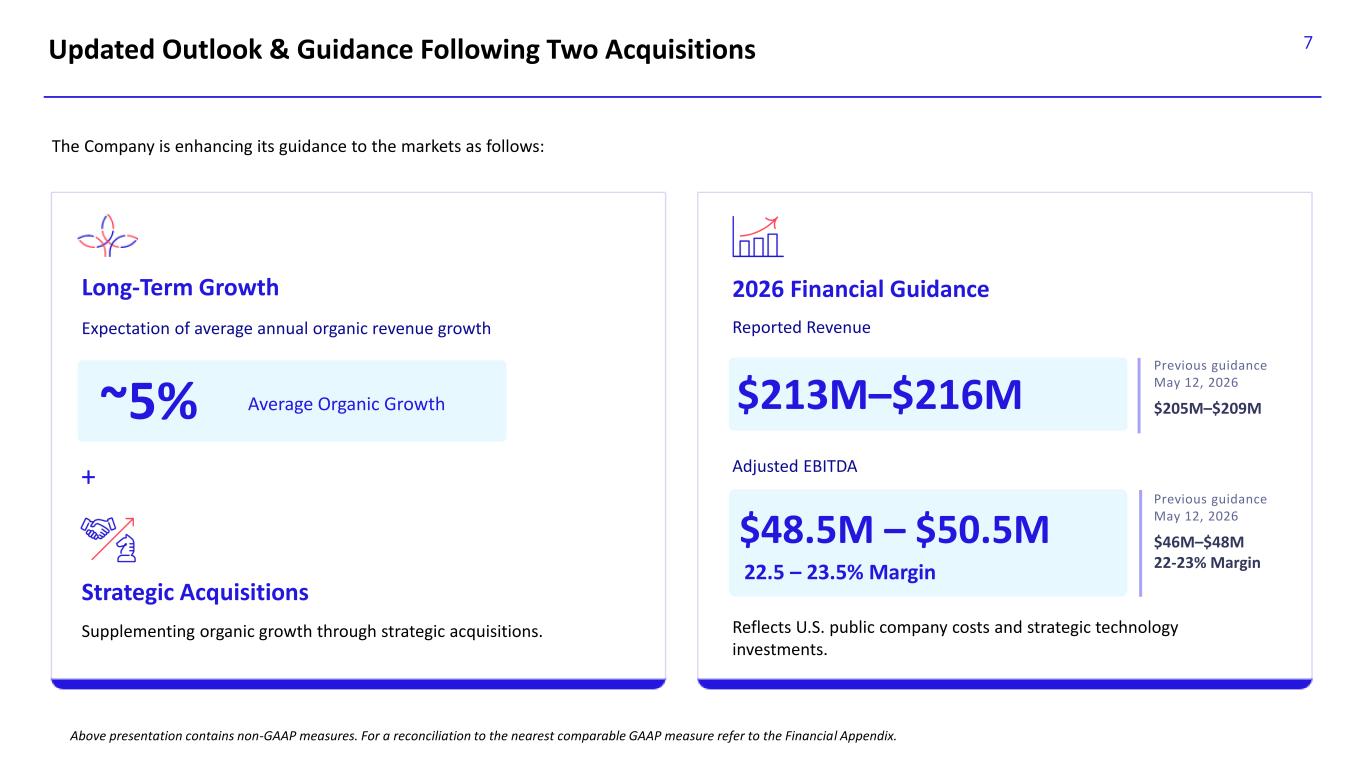
7 Above presentation contains non-GAAP measures. For a reconciliation to the nearest comparable GAAP measure refer to the Financial Appendix. Updated Outlook & Guidance Following Two Acquisitions Long-Term Growth The Company is enhancing its guidance to the markets as follows: 2026 Financial Guidance ~5% Average Organic Growth + $213M–$216M Expectation of average annual organic revenue growth Reported Revenue Supplementing organic growth through strategic acquisitions. Strategic Acquisitions Adjusted EBITDA $48.5M – $50.5M 22.5 – 23.5% Margin Reflects U.S. public company costs and strategic technology investments. Previous guidance May 12, 2026 $205M–$209M Previous guidance May 12, 2026 $46M–$48M 22-23% Margin
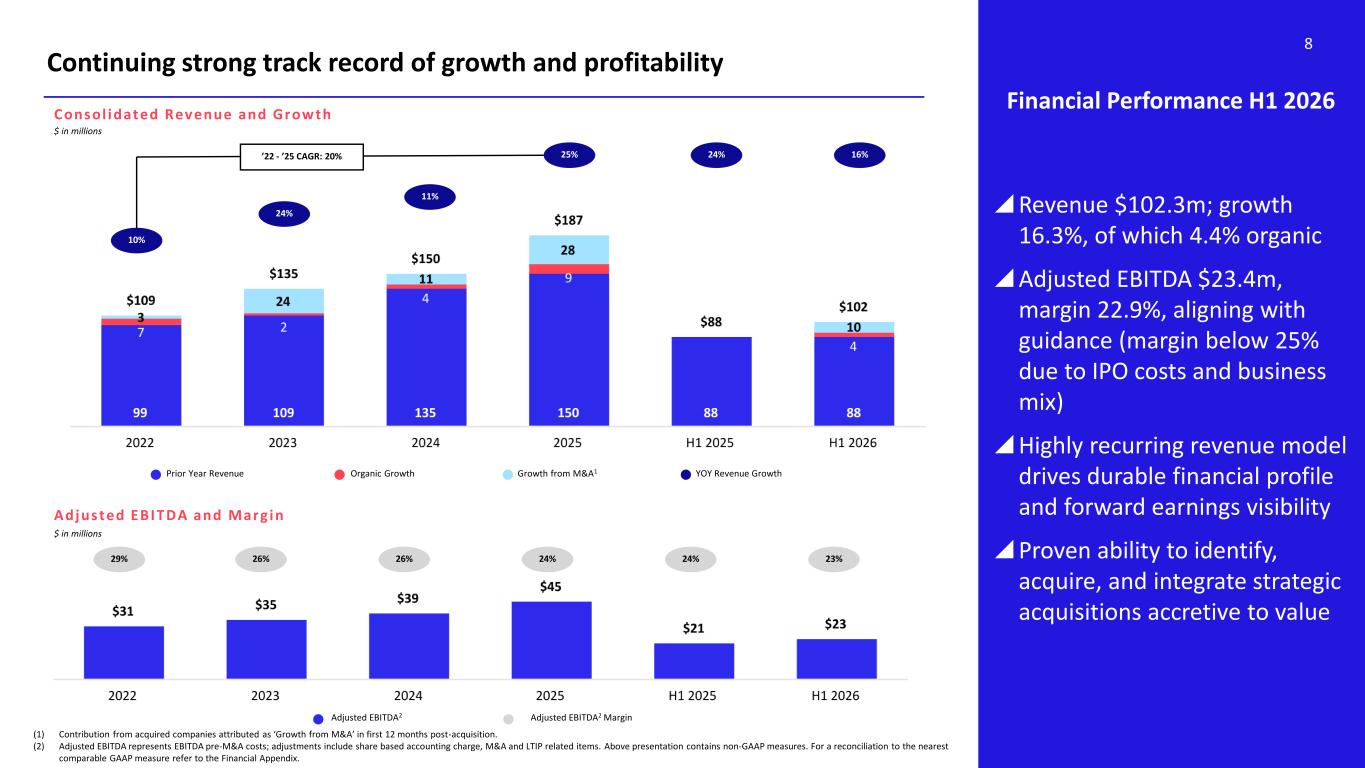
8 Continuing strong track record of growth and profitability Financial Performance H1 2026 Revenue $102.3m; growth 16.3%, of which 4.4% organic Adjusted EBITDA $23.4m, margin 22.9%, aligning with guidance (margin below 25% due to IPO costs and business mix) Highly recurring revenue model drives durable financial profile and forward earnings visibility Proven ability to identify, acquire, and integrate strategic acquisitions accretive to value ’22 - ’25 CAGR: 20% Adjusted EBITDA2 Adjusted EBITDA2 Margin 29% 26% 10% $ in millions Consol idated Revenue and Growth (1) Contribution from acquired companies attributed as ‘Growth from M&A’ in first 12 months post-acquisition. (2) Adjusted EBITDA represents EBITDA pre-M&A costs; adjustments include share based accounting charge, M&A and LTIP related items. Above presentation contains non-GAAP measures. For a reconciliation to the nearest comparable GAAP measure refer to the Financial Appendix. 24% Prior Year Revenue Organic Growth Growth from M&A1 YOY Revenue Growth Adj usted EBITDA and Marg in $ in millions 25% 26% 24% 11% 24% 23% 24% 16%
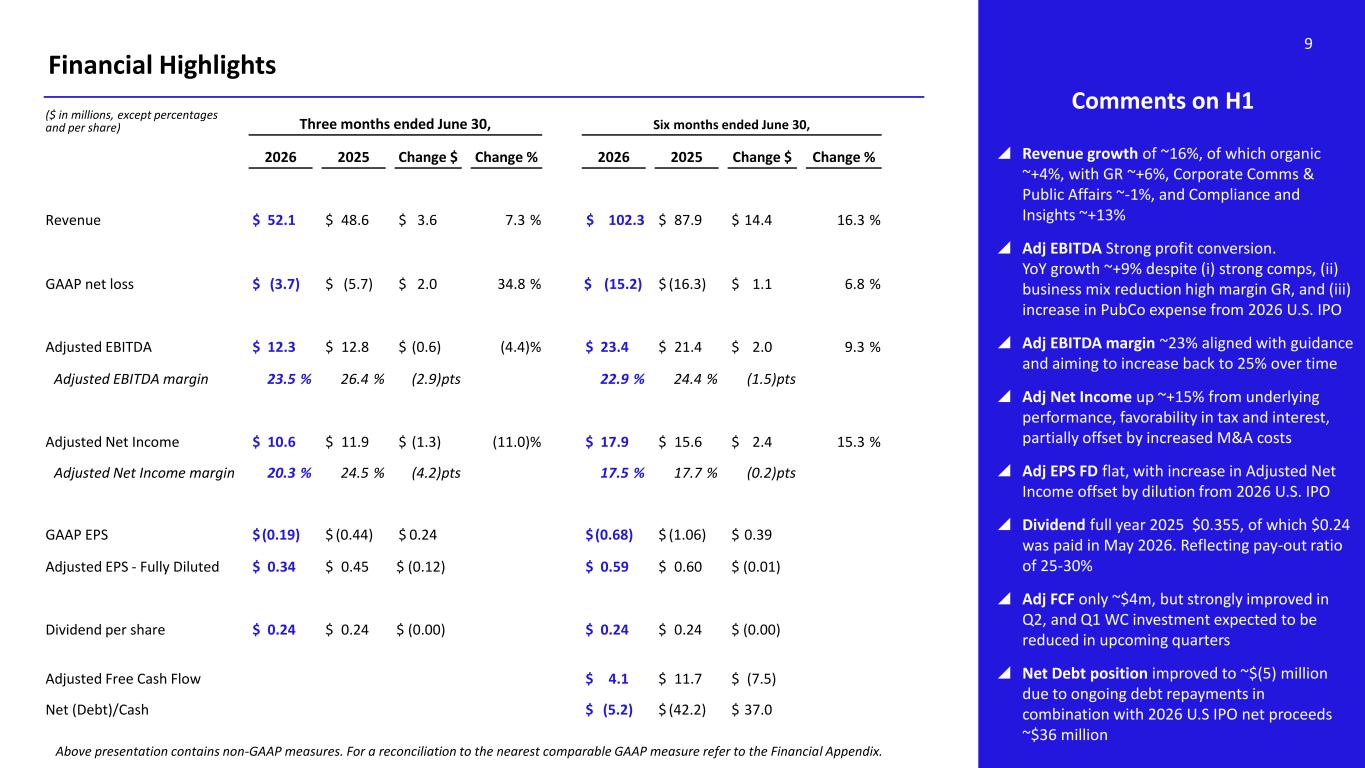
9 Financial Highlights ($ in millions, except percentages and per share) Three months ended June 30, Six months ended June 30, 2026 2025 Change $ Change % 2026 2025 Change $ Change % Revenue $ 52.1 $ 48.6 $ 3.6 7.3 % $ 102.3 $ 87.9 $ 14.4 16.3 % GAAP net loss $ (3.7) $ (5.7) $ 2.0 34.8 % $ (15.2) $ (16.3) $ 1.1 6.8 % Adjusted EBITDA $ 12.3 $ 12.8 $ (0.6) (4.4)% $ 23.4 $ 21.4 $ 2.0 9.3 % Adjusted EBITDA margin 23.5 % 26.4 % (2.9)pts 22.9 % 24.4 % (1.5)pts Adjusted Net Income $ 10.6 $ 11.9 $ (1.3) (11.0)% $ 17.9 $ 15.6 $ 2.4 15.3 % Adjusted Net Income margin 20.3 % 24.5 % (4.2)pts 17.5 % 17.7 % (0.2)pts GAAP EPS $(0.19) $ (0.44) $ 0.24 $(0.68) $ (1.06) $ 0.39 Adjusted EPS - Fully Diluted $ 0.34 $ 0.45 $ (0.12) $ 0.59 $ 0.60 $ (0.01) Dividend per share $ 0.24 $ 0.24 $ (0.00) $ 0.24 $ 0.24 $ (0.00) Adjusted Free Cash Flow $ 4.1 $ 11.7 $ (7.5) Net (Debt)/Cash $ (5.2) $ (42.2) $ 37.0 Comments on H1 Revenue growth of ~16%, of which organic ~+4%, with GR ~+6%, Corporate Comms & Public Affairs ~-1%, and Compliance and Insights ~+13% Adj EBITDA Strong profit conversion. YoY growth ~+9% despite (i) strong comps, (ii) business mix reduction high margin GR, and (iii) increase in PubCo expense from 2026 U.S. IPO Adj EBITDA margin ~23% aligned with guidance and aiming to increase back to 25% over time Adj Net Income up ~+15% from underlying performance, favorability in tax and interest, partially offset by increased M&A costs Adj EPS FD flat, with increase in Adjusted Net Income offset by dilution from 2026 U.S. IPO Dividend full year 2025 $0.355, of which $0.24 was paid in May 2026. Reflecting pay-out ratio of 25-30% Adj FCF only ~$4m, but strongly improved in Q2, and Q1 WC investment expected to be reduced in upcoming quarters Net Debt position improved to ~$(5) million due to ongoing debt repayments in combination with 2026 U.S IPO net proceeds ~$36 million Above presentation contains non-GAAP measures. For a reconciliation to the nearest comparable GAAP measure refer to the Financial Appendix.
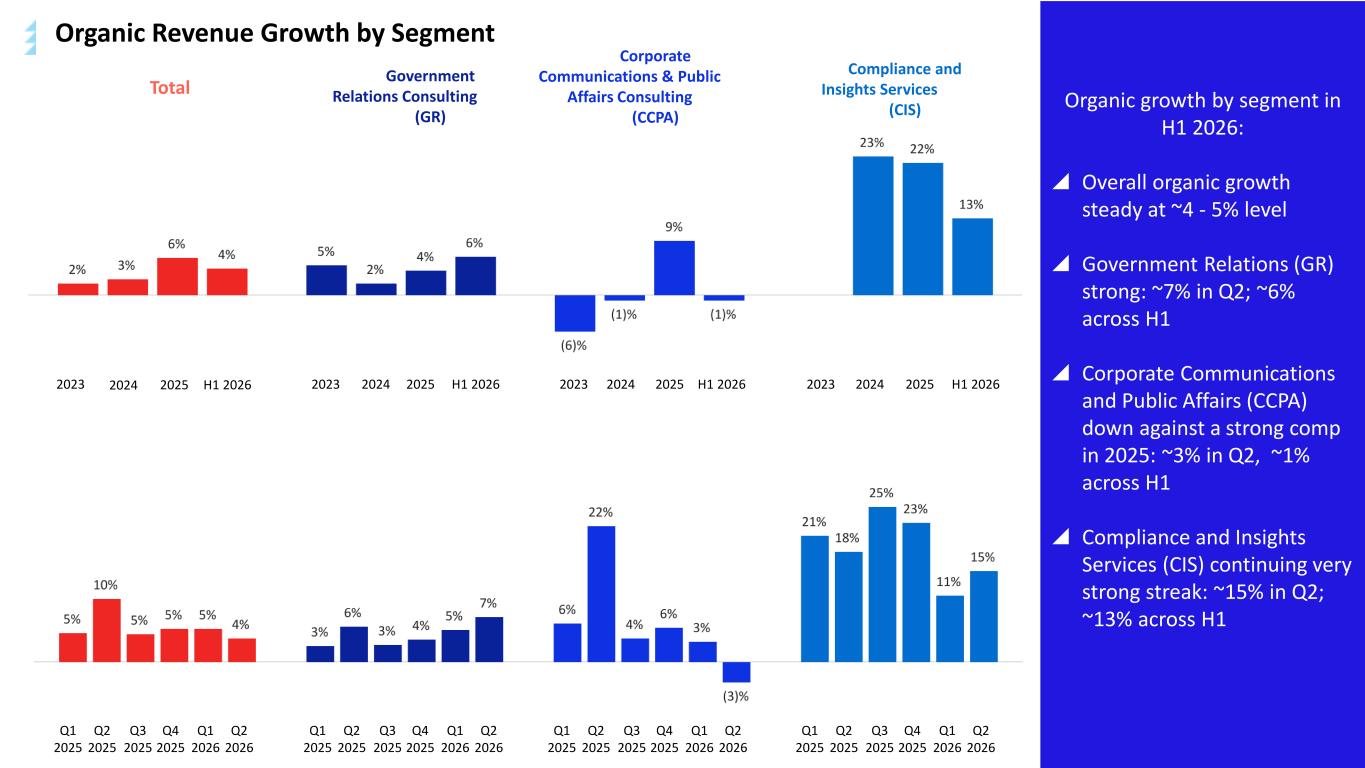
10 Organic growth by segment in H1 2026: Overall organic growth steady at ~4 - 5% level Government Relations (GR) strong: ~7% in Q2; ~6% across H1 Corporate Communications and Public Affairs (CCPA) down against a strong comp in 2025: ~3% in Q2, ~1% across H1 Compliance and Insights Services (CIS) continuing very strong streak: ~15% in Q2; ~13% across H1 Total 2023 2024 2025 H1 2026 Government Relations Consulting (GR) Corporate Communications & Public Affairs Consulting (CCPA) Compliance and Insights Services (CIS) 2023 2024 2025 H1 20262023 2024 2025 H1 20262023 2024 2025 H1 2026 Q1 2025 Q2 2025 Q3 2025 Q4 2025 Q1 2026 Q2 2026 Q1 2025 Q2 2025 Q3 2025 Q4 2025 Q1 2026 Q2 2026 Q1 2025 Q2 2025 Q3 2025 Q4 2025 Q1 2026 Q2 2026 Q1 2025 Q2 2025 Q3 2025 Q4 2025 Q1 2026 Q2 2026 Organic Revenue Growth by Segment
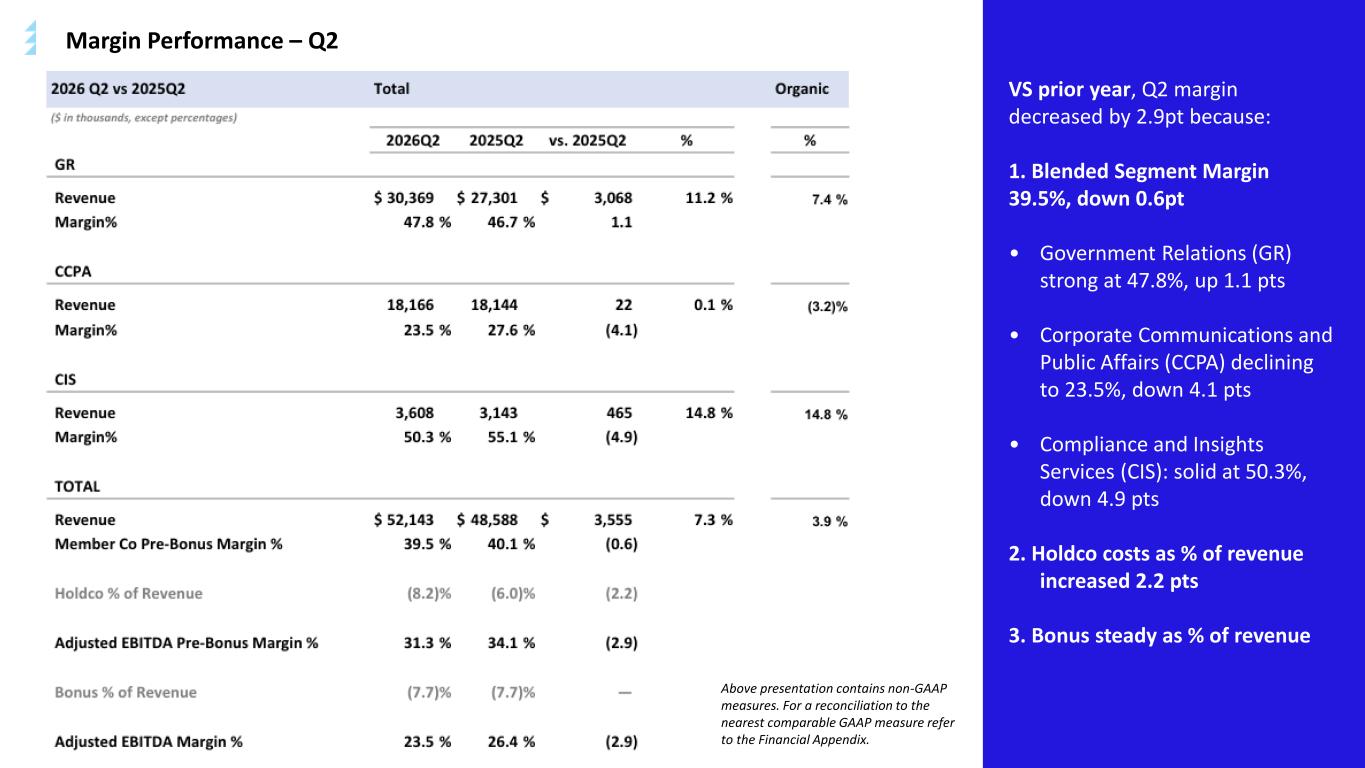
11Margin Performance – Q2 VS prior year, Q2 margin decreased by 2.9pt because: 1. Blended Segment Margin 39.5%, down 0.6pt • Government Relations (GR) strong at 47.8%, up 1.1 pts • Corporate Communications and Public Affairs (CCPA) declining to 23.5%, down 4.1 pts • Compliance and Insights Services (CIS): solid at 50.3%, down 4.9 pts 2. Holdco costs as % of revenue increased 2.2 pts 3. Bonus steady as % of revenue Above presentation contains non-GAAP measures. For a reconciliation to the nearest comparable GAAP measure refer to the Financial Appendix.
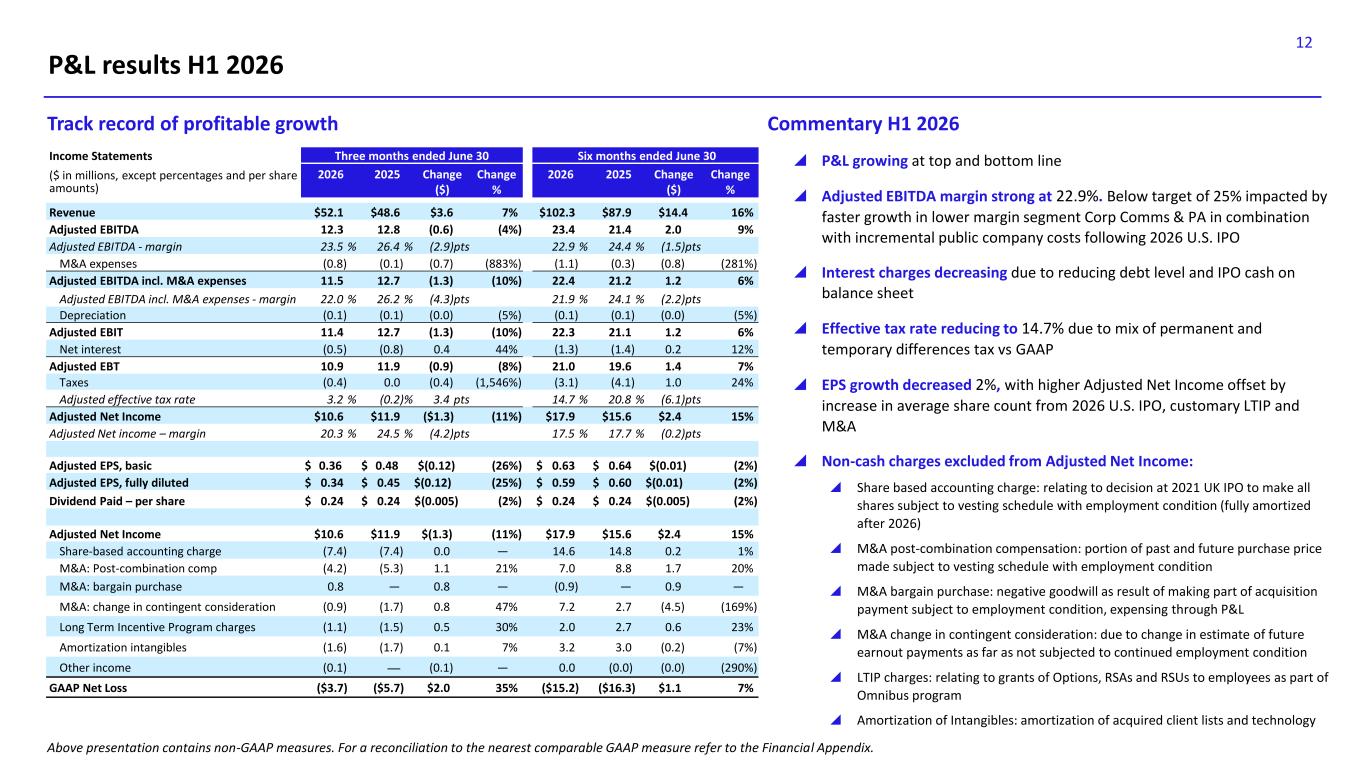
12 P&L results H1 2026 P&L growing at top and bottom line Adjusted EBITDA margin strong at 22.9%. Below target of 25% impacted by faster growth in lower margin segment Corp Comms & PA in combination with incremental public company costs following 2026 U.S. IPO Interest charges decreasing due to reducing debt level and IPO cash on balance sheet Effective tax rate reducing to 14.7% due to mix of permanent and temporary differences tax vs GAAP EPS growth decreased 2%, with higher Adjusted Net Income offset by increase in average share count from 2026 U.S. IPO, customary LTIP and M&A Non-cash charges excluded from Adjusted Net Income: Share based accounting charge: relating to decision at 2021 UK IPO to make all shares subject to vesting schedule with employment condition (fully amortized after 2026) M&A post-combination compensation: portion of past and future purchase price made subject to vesting schedule with employment condition M&A bargain purchase: negative goodwill as result of making part of acquisition payment subject to employment condition, expensing through P&L M&A change in contingent consideration: due to change in estimate of future earnout payments as far as not subjected to continued employment condition LTIP charges: relating to grants of Options, RSAs and RSUs to employees as part of Omnibus program Amortization of Intangibles: amortization of acquired client lists and technology Commentary H1 2026Track record of profitable growth Income Statements Three months ended June 30 Six months ended June 30 ($ in millions, except percentages and per share amounts) 2026 2025 Change ($) Change % 2026 2025 Change ($) Change % Revenue $52.1 $48.6 $3.6 7% $102.3 $87.9 $14.4 16% Adjusted EBITDA 12.3 12.8 (0.6) (4%) 23.4 21.4 2.0 9% Adjusted EBITDA - margin 23.5 % 26.4 % (2.9)pts 22.9 % 24.4 % (1.5)pts M&A expenses (0.8) (0.1) (0.7) (883%) (1.1) (0.3) (0.8) (281%) Adjusted EBITDA incl. M&A expenses 11.5 12.7 (1.3) (10%) 22.4 21.2 1.2 6% Adjusted EBITDA incl. M&A expenses - margin 22.0 % 26.2 % (4.3)pts 21.9 % 24.1 % (2.2)pts Depreciation (0.1) (0.1) (0.0) (5%) (0.1) (0.1) (0.0) (5%) Adjusted EBIT 11.4 12.7 (1.3) (10%) 22.3 21.1 1.2 6% Net interest (0.5) (0.8) 0.4 44% (1.3) (1.4) 0.2 12% Adjusted EBT 10.9 11.9 (0.9) (8%) 21.0 19.6 1.4 7% Taxes (0.4) 0.0 (0.4) (1,546%) (3.1) (4.1) 1.0 24% Adjusted effective tax rate 3.2 % (0.2)% 3.4 pts 14.7 % 20.8 % (6.1)pts Adjusted Net Income $10.6 $11.9 ($1.3) (11%) $17.9 $15.6 $2.4 15% Adjusted Net income – margin 20.3 % 24.5 % (4.2)pts 17.5 % 17.7 % (0.2)pts Adjusted EPS, basic $ 0.36 $ 0.48 $(0.12) (26%) $ 0.63 $ 0.64 $(0.01) (2%) Adjusted EPS, fully diluted $ 0.34 $ 0.45 $(0.12) (25%) $ 0.59 $ 0.60 $(0.01) (2%) Dividend Paid – per share $ 0.24 $ 0.24 $(0.005) (2%) $ 0.24 $ 0.24 $(0.005) (2%) Adjusted Net Income $10.6 $11.9 $(1.3) (11%) $17.9 $15.6 $2.4 15% Share-based accounting charge (7.4) (7.4) 0.0 — 14.6 14.8 0.2 1% M&A: Post-combination comp (4.2) (5.3) 1.1 21% 7.0 8.8 1.7 20% M&A: bargain purchase 0.8 — 0.8 — (0.9) — 0.9 — M&A: change in contingent consideration (0.9) (1.7) 0.8 47% 7.2 2.7 (4.5) (169%) Long Term Incentive Program charges (1.1) (1.5) 0.5 30% 2.0 2.7 0.6 23% Amortization intangibles (1.6) (1.7) 0.1 7% 3.2 3.0 (0.2) (7%) Other income (0.1) — (0.1) — 0.0 (0.0) (0.0) (290%) GAAP Net Loss ($3.7) ($5.7) $2.0 35% ($15.2) ($16.3) $1.1 7% Above presentation contains non-GAAP measures. For a reconciliation to the nearest comparable GAAP measure refer to the Financial Appendix.
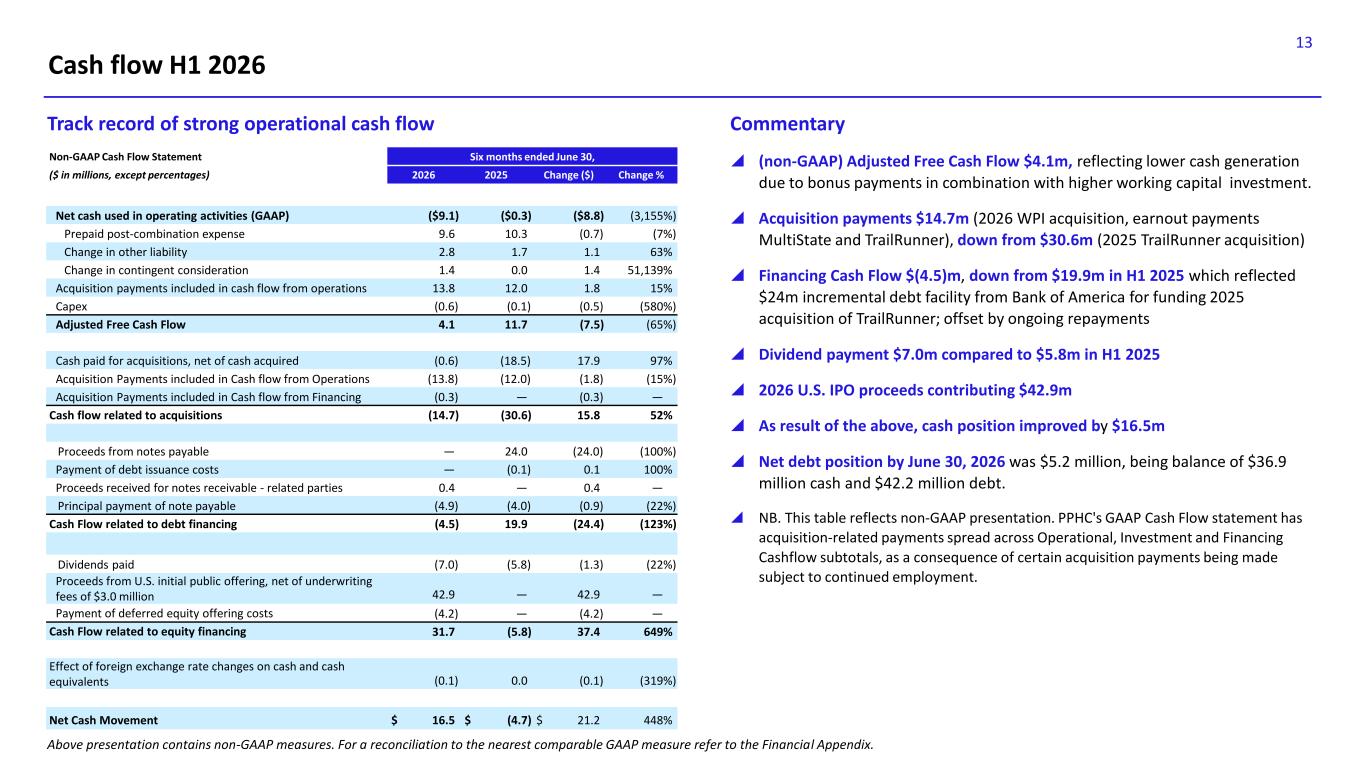
13 Cash flow H1 2026 (non-GAAP) Adjusted Free Cash Flow $4.1m, reflecting lower cash generation due to bonus payments in combination with higher working capital investment. Acquisition payments $14.7m (2026 WPI acquisition, earnout payments MultiState and TrailRunner), down from $30.6m (2025 TrailRunner acquisition) Financing Cash Flow $(4.5)m, down from $19.9m in H1 2025 which reflected $24m incremental debt facility from Bank of America for funding 2025 acquisition of TrailRunner; offset by ongoing repayments Dividend payment $7.0m compared to $5.8m in H1 2025 2026 U.S. IPO proceeds contributing $42.9m As result of the above, cash position improved by $16.5m Net debt position by June 30, 2026 was $5.2 million, being balance of $36.9 million cash and $42.2 million debt. NB. This table reflects non-GAAP presentation. PPHC's GAAP Cash Flow statement has acquisition-related payments spread across Operational, Investment and Financing Cashflow subtotals, as a consequence of certain acquisition payments being made subject to continued employment. Track record of strong operational cash flow Commentary Non-GAAP Cash Flow Statement Six months ended June 30, ($ in millions, except percentages) 2026 2025 Change ($) Change % Net cash used in operating activities (GAAP) ($9.1) ($0.3) ($8.8) (3,155%) Prepaid post-combination expense 9.6 10.3 (0.7) (7%) Change in other liability 2.8 1.7 1.1 63% Change in contingent consideration 1.4 0.0 1.4 51,139% Acquisition payments included in cash flow from operations 13.8 12.0 1.8 15% Capex (0.6) (0.1) (0.5) (580%) Adjusted Free Cash Flow 4.1 11.7 (7.5) (65%) Cash paid for acquisitions, net of cash acquired (0.6) (18.5) 17.9 97% Acquisition Payments included in Cash flow from Operations (13.8) (12.0) (1.8) (15%) Acquisition Payments included in Cash flow from Financing (0.3) — (0.3) — Cash flow related to acquisitions (14.7) (30.6) 15.8 52% Proceeds from notes payable — 24.0 (24.0) (100%) Payment of debt issuance costs — (0.1) 0.1 100% Proceeds received for notes receivable - related parties 0.4 — 0.4 — Principal payment of note payable (4.9) (4.0) (0.9) (22%) Cash Flow related to debt financing (4.5) 19.9 (24.4) (123%) Dividends paid (7.0) (5.8) (1.3) (22%) Proceeds from U.S. initial public offering, net of underwriting fees of $3.0 million 42.9 — 42.9 — Payment of deferred equity offering costs (4.2) — (4.2) — Cash Flow related to equity financing 31.7 (5.8) 37.4 649% Effect of foreign exchange rate changes on cash and cash equivalents (0.1) 0.0 (0.1) (319%) Net Cash Movement $ 16.5 $ (4.7) $ 21.2 448% Above presentation contains non-GAAP measures. For a reconciliation to the nearest comparable GAAP measure refer to the Financial Appendix.
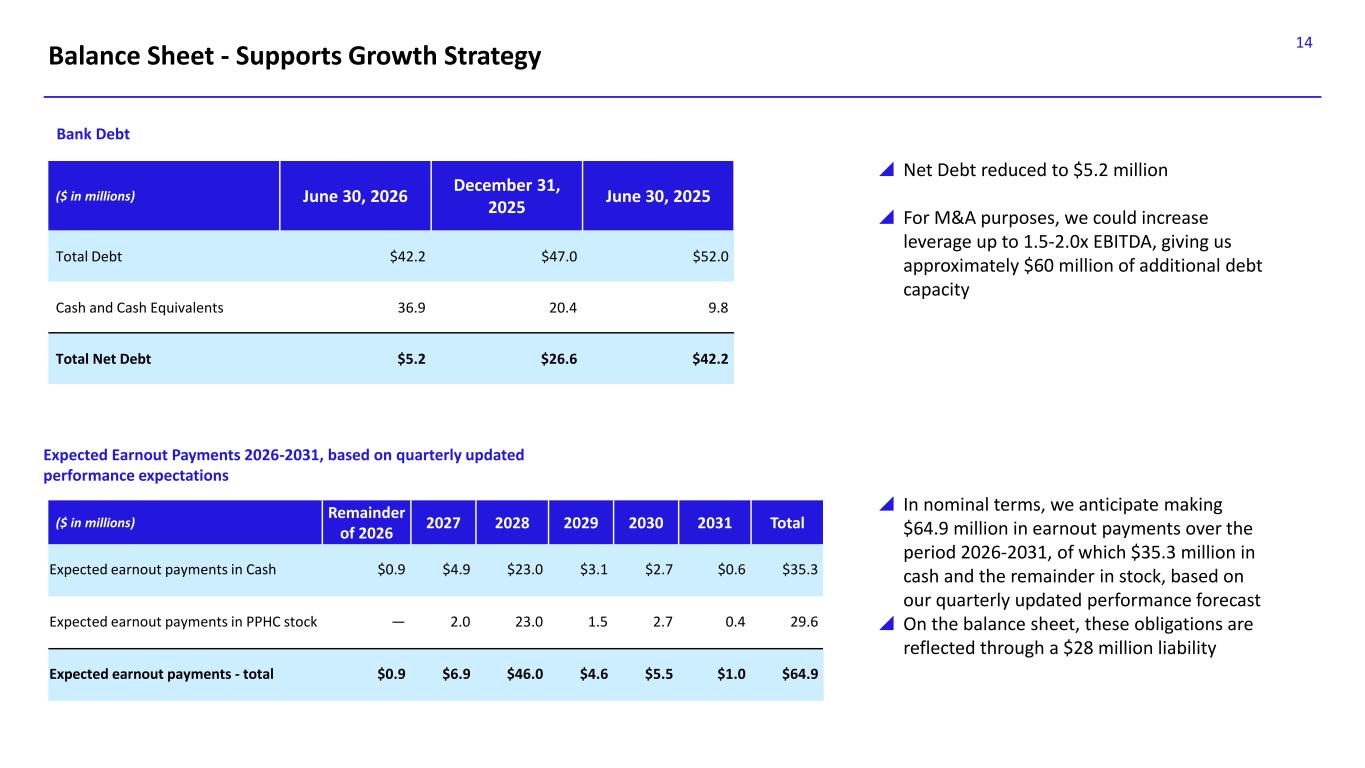
14 Balance Sheet - Supports Growth Strategy ($ in millions) June 30, 2026 December 31, 2025 June 30, 2025 Total Debt $42.2 $47.0 $52.0 Cash and Cash Equivalents 36.9 20.4 9.8 Total Net Debt $5.2 $26.6 $42.2 Net Debt reduced to $5.2 million For M&A purposes, we could increase leverage up to 1.5-2.0x EBITDA, giving us approximately $60 million of additional debt capacity In nominal terms, we anticipate making $64.9 million in earnout payments over the period 2026-2031, of which $35.3 million in cash and the remainder in stock, based on our quarterly updated performance forecast On the balance sheet, these obligations are reflected through a $28 million liability Expected Earnout Payments 2026-2031, based on quarterly updated performance expectations Bank Debt ($ in millions) Remainder of 2026 2027 2028 2029 2030 2031 Total Expected earnout payments in Cash $0.9 $4.9 $23.0 $3.1 $2.7 $0.6 $35.3 Expected earnout payments in PPHC stock — 2.0 23.0 1.5 2.7 0.4 29.6 Expected earnout payments - total $0.9 $6.9 $46.0 $4.6 $5.5 $1.0 $64.9
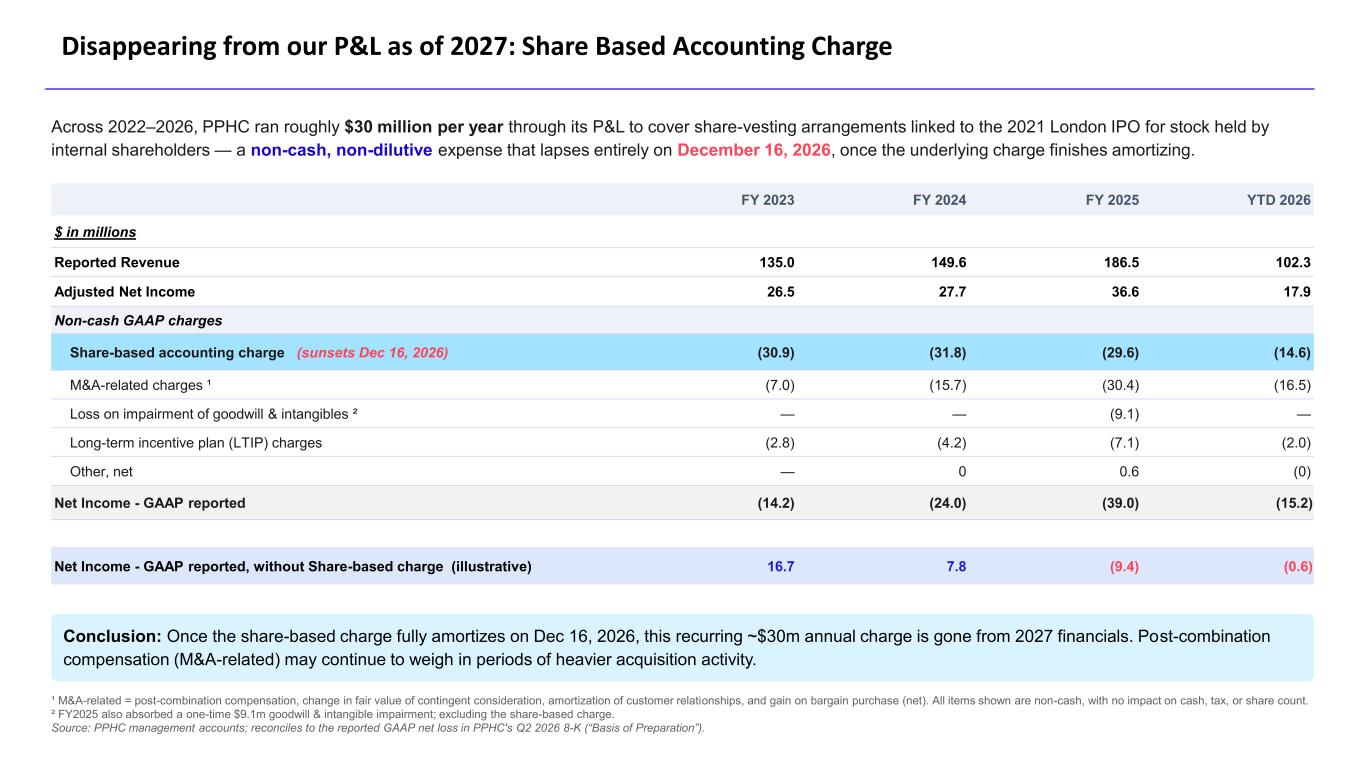
Across 2022–2026, PPHC ran roughly $30 million per year through its P&L to cover share-vesting arrangements linked to the 2021 London IPO for stock held by internal shareholders — a non-cash, non-dilutive expense that lapses entirely on December 16, 2026, once the underlying charge finishes amortizing. FY 2023 FY 2024 FY 2025 YTD 2026 $ in millions Reported Revenue 135.0 149.6 186.5 102.3 Adjusted Net Income 26.5 27.7 36.6 17.9 Non-cash GAAP charges Share-based accounting charge (sunsets Dec 16, 2026) (30.9) (31.8) (29.6) (14.6) M&A-related charges ¹ (7.0) (15.7) (30.4) (16.5) Loss on impairment of goodwill & intangibles ² — — (9.1) — Long-term incentive plan (LTIP) charges (2.8) (4.2) (7.1) (2.0) Other, net — 0 0.6 (0) Net Income - GAAP reported (14.2) (24.0) (39.0) (15.2) Net Income - GAAP reported, without Share-based charge (illustrative) 16.7 7.8 (9.4) (0.6) Conclusion: Once the share-based charge fully amortizes on Dec 16, 2026, this recurring ~$30m annual charge is gone from 2027 financials. Post-combination compensation (M&A-related) may continue to weigh in periods of heavier acquisition activity. ¹ M&A-related = post-combination compensation, change in fair value of contingent consideration, amortization of customer relationships, and gain on bargain purchase (net). All items shown are non-cash, with no impact on cash, tax, or share count. ² FY2025 also absorbed a one-time $9.1m goodwill & intangible impairment; excluding the share-based charge. Source: PPHC management accounts; reconciles to the reported GAAP net loss in PPHC's Q2 2026 8-K (“Basis of Preparation”). Disappearing from our P&L as of 2027: Share Based Accounting Charge

16 Strategy and M&A
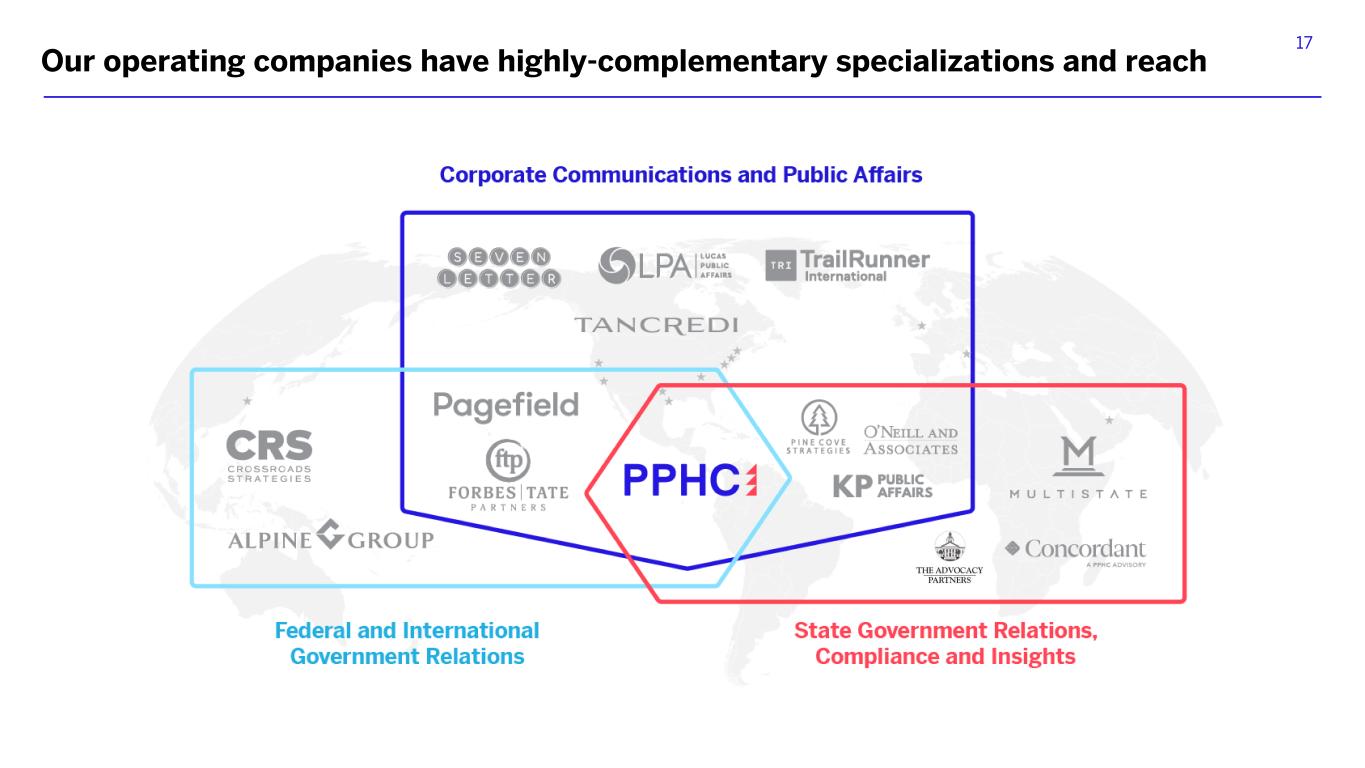
17 Our operating companies have highly-complementary specializations and reach
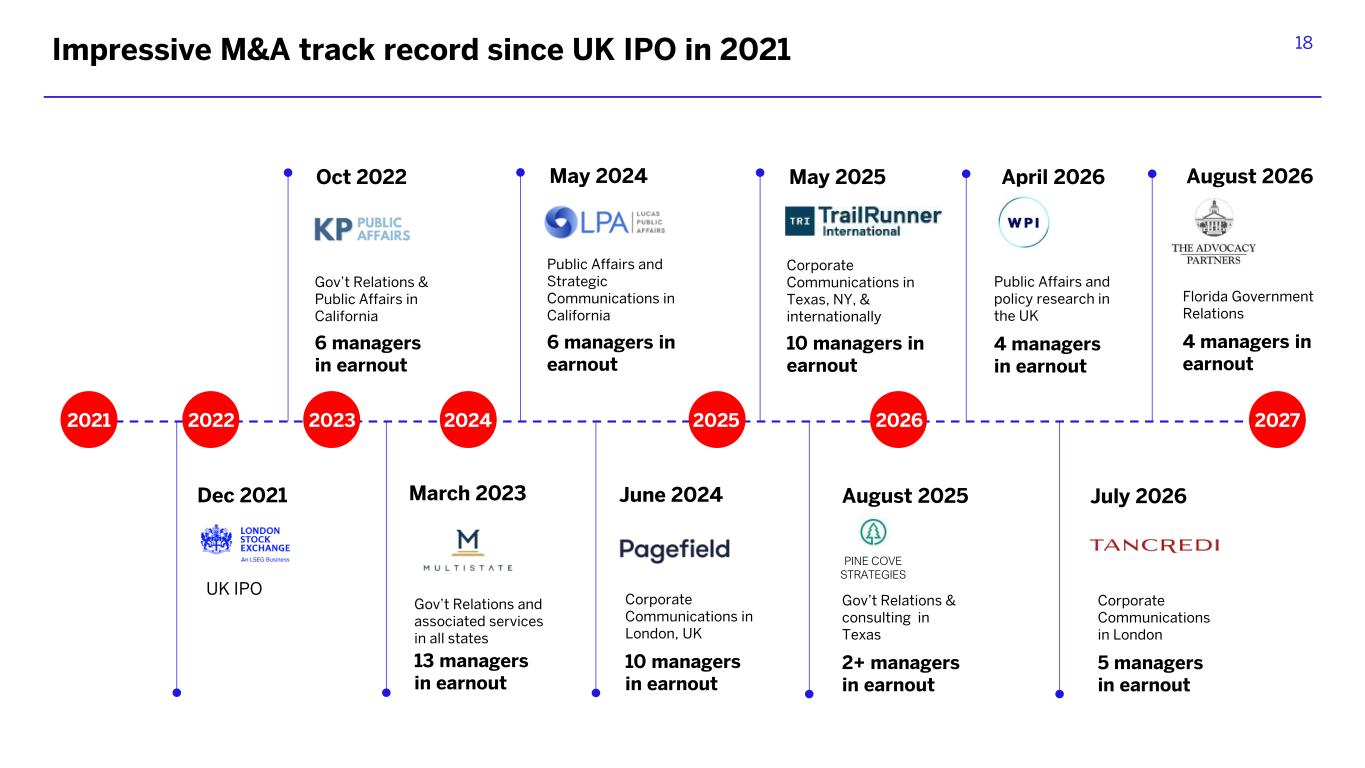
18 2021 2022 2023 2025 2026 2027 Oct 2022 Gov’t Relations & Public Affairs in California 6 managers in earnout Gov’t Relations and associated services in all states 13 managers in earnout March 2023 May 2024 Public Affairs and Strategic Communications in California 6 managers in earnout 2024 Corporate Communications in London, UK 10 managers in earnout June 2024 May 2025 Corporate Communications in Texas, NY, & internationally 10 managers in earnout Gov’t Relations & consulting in Texas 2+ managers in earnout August 2025 July 2026 Corporate Communications 5 managers in earnout Impressive M&A track record since UK IPO in 2021 PINE COVE STRATEGIES July 2026 Corporate Communications in London 5 managers in earnout Apri 2026 Public Affairs nd policy research in the UK 4 managers in earnout August 2026 Florida Government Relations 4 managers in earnout Dec 2021 UK IPO
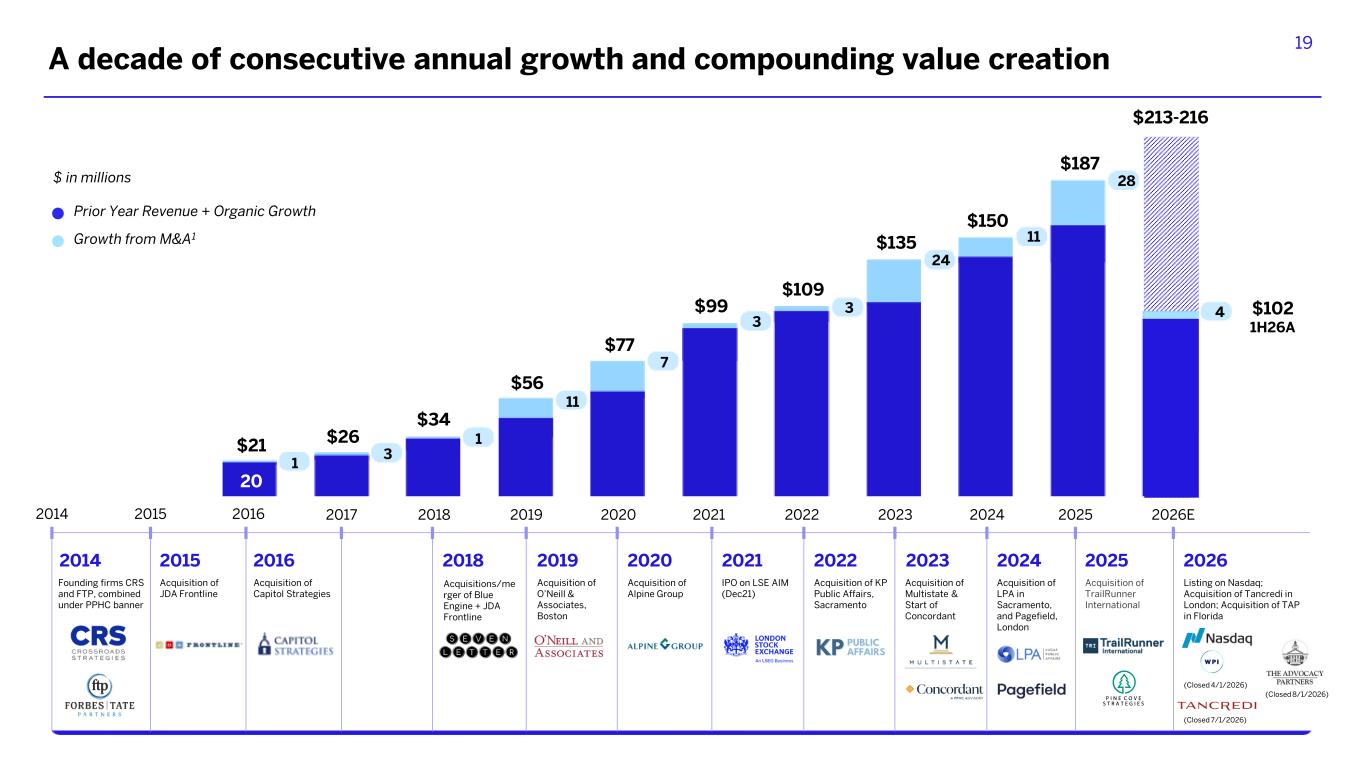
19 2014 2014 Founding firms CRS and FTP, combined under PPHC banner 2015 2016 2017 2018 2019 2020 2021 2022 2023 2024 2025 2018 Acquisitions/me rger of Blue Engine + JDA Frontline 2019 Acquisition of O’Neill & Associates, Boston 2020 Acquisition of Alpine Group 2021 IPO on LSE AIM (Dec21) 2022 Acquisition of KP Public Affairs, Sacramento 2023 Acquisition of Multistate & Start of Concordant 2024 Acquisition of LPA in Sacramento, and Pagefield, London 2025 Acquisition of TrailRunner International A decade of consecutive annual growth and compounding value creation 2015 Acquisition of JDA Frontline 2016 Acquisition of Capitol Strategies 2026E 2026 Listing on Nasdaq; Acquisition of Tancredi in London; Acquisition of TAP in Florida 1 $21 20 $26 $34 $56 $77 $99 $109 $135 $150 $187 $102 1H26A $213-216 3 1 11 7 3 3 24 11 28 4 Prior Year Revenue + Organic Growth $ in millions Growth from M&A1 (Closed 7/1/2026) (Closed 8/1/2026) (Closed 4/1/2026)

20 Conclusion
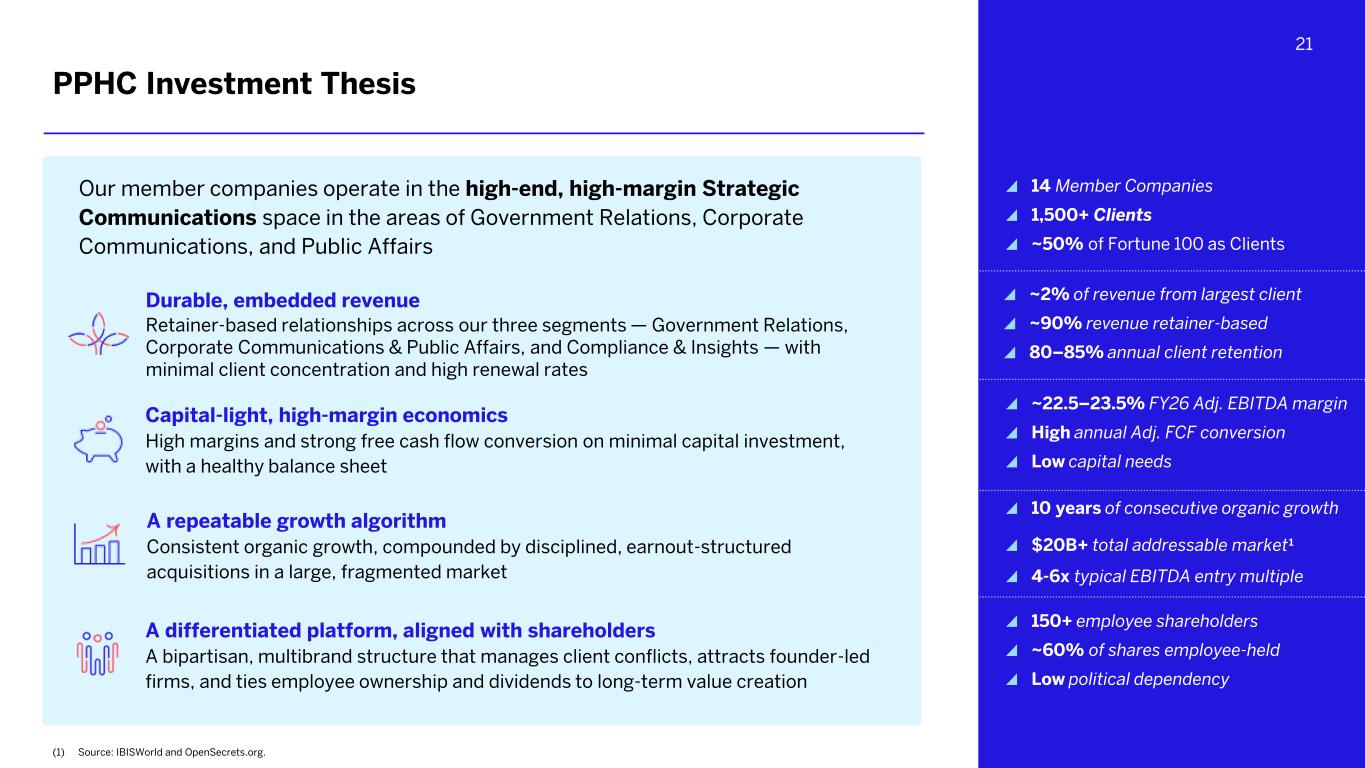
21 PPHC Investment Thesis Capital-light, high-margin economics High margins and strong free cash flow conversion on minimal capital investment, with a healthy balance sheet Durable, embedded revenue Retainer-based relationships across our three segments — Government Relations, Corporate Communications & Public Affairs, and Compliance & Insights — with minimal client concentration and high renewal rates Our member companies operate in the high-end, high-margin Strategic Communications space in the areas of Government Relations, Corporate Communications, and Public Affairs ~2% of revenue from largest client ~90% revenue retainer-based 80–85% annual client retention A differentiated platform, aligned with shareholders A bipartisan, multibrand structure that manages client conflicts, attracts founder-led firms, and ties employee ownership and dividends to long-term value creation ~22.5–23.5% FY26 Adj. EBITDA margin High annual Adj. FCF conversion Low capital needs 150+ employee shareholders ~60% of shares employee-held Low political dependency 14 Member Companies 1,500+ Clients ~50% of Fortune 100 as Clients (1) Source: IBISWorld and OpenSecrets.org. A repeatable growth algorithm Consistent organic growth, compounded by disciplined, earnout-structured acquisitions in a large, fragmented market 10 years of consecutive organic growth $20B+ total addressable market1 4-6x typical EBITDA entry multiple

22 Financial Appendix
23 Non-GAAP Financial Measures Our management uses a variety of financial and operating metrics to analyze our performance. These metrics are significant factors in assessing our operating results and profitability. These financial and operating metrics include Adjusted EBITDA, Adjusted EBITDA margin, Adjusted EBITDA Including M&A expense, Adjusted net income, Adjusted EPS basic, Adjusted EPS fully diluted, Organic Revenue Growth, and Adjusted Free Cash Flow which are financial measures not recognized under U.S. GAAP. These non-GAAP financial measures are used by management to measure our operating performance, but may not be directly comparable to similar measures, such as EBITDA or Adjusted EBITDA, relied on or reported by other companies, including other companies in our industry. We believe excluding items that neither relate to the ordinary course of business nor reflect our underlying business operating performance, such as equity-based compensation, the amortization of acquired intangible assets, acquisition-related post-combination compensation and contingent consideration, gains on bargain purchase price, interest and tax enables meaningful period-to-period comparisons of our operating performance. We also use these non-GAAP financial measures when publicly providing our business outlook, for internal management purposes, and as a basis for evaluating potential acquisitions and dispositions. We believe that the exclusion of equity-based compensation expense such as stock options, RSAs, RSUs and equity-based compensation related to retained Pre-UK IPO shares granted in relation to our listing on the London Stock Exchange, is appropriate because it eliminates the impact of non-cash expenses for equity-based compensation costs that are based upon valuation methodologies and assumptions that can vary significantly over time due to factors that are (i) unrelated to our core operating performance, and (ii) can be outside of our control. Although we exclude equity-based compensation expenses from our non-GAAP measures, equity compensation has been, and will continue to be, an important part of our future compensation and retention strategy and a significant component of our future expenses that may increase in future periods. Additionally, we believe the exclusion of compensation expense related to share appreciation rights, which are cash settled, is unrelated to our core operating performance in addition to the fact that share appreciation rights are no longer part of our compensation plans going forward. Disclosures
24 Non-GAAP Financial Measures We define Adjusted EBITDA, which is a non-GAAP financial measure, as consolidated net loss before depreciation, interest income, interest expense, income tax expense, mergers and acquisitions (“M&A”) expenses, long-term incentive program charges, share-based accounting charges, post-combination compensation charges, impairment, change in fair value of contingent consideration, gain on bargain purchase price net of deferred taxes and amortization of intangible assets. Adjusted EBITDA Incl. M&A expense we define as net loss before depreciation, interest income, interest expense, income tax expense, long-term incentive program charges, share-based accounting charges, post-combination compensation charges, change in fair value of contingent consideration, gain on bargain purchase price net of deferred taxes and amortization of intangible assets. We define Adjusted EBITDA Margin as Adjusted EBITDA divided by revenue. We believe that these non-GAAP financial measures, when considered together with our GAAP financial results and GAAP financial measures, provide management and investors with a more complete understanding of our operating results, including underlying trends. While our Adjusted EBITDA may not be directly comparable to the EBITDA or other measures used by others, we believe it helps provide a clearer picture of the underlying performance of the business by removing certain expenses tied to specific historical acquisitions, including post-combination compensation charges, as well as non-cash charges such as depreciation and amortization of intangibles. Additionally, we believe that Adjusted EBITDA provides investors and management with operating results that reflect our core operating activity of serving clients by removing the highly variable M&A costs expenditure. We define Adjusted Net Income, which is a non-GAAP financial measure, as consolidated net loss before long-term incentive program charges, share-based accounting charges, post- combination compensation charges, change in fair value of contingent consideration, impairment, gain on bargain purchase price net of deferred taxes, other income, and amortization of intangible assets. We use Adjusted Net Income for the purpose of calculating Adjusted Earnings per Share ("Adjusted EPS", being referenced as either "Adjusted EPS, basic" or "Adjusted EPS, fully diluted"). Management uses Adjusted EPS diluted to assess total group operating performance on a consistent basis. We define Adjusted Net Income as net income excluding the impact of long-term incentive program charges, share-based accounting charges, post-combination compensation charges, change in fair value of contingent consideration, gain on bargain purchase price net of deferred taxes and amortization of intangible assets. We believe that these non-GAAP financial measures, when considered together with our GAAP financial results and GAAP financial measures, provide management and investors with a clearer picture of our underlying business operating results. We define Adjusted Free Cash Flow, which is a non-GAAP financial measure, as net cash provided by (used in) operating activities less cash payments for purchases of property and equipment and less acquisition related payouts classified in operating cash flows specifically changes in prepaid post combination payments, changes in other liability (liability classified earnout obligations) and changes in contingent consideration. We believe this non-GAAP financial measure, when considered together with our GAAP financial results, provides management and investors with useful supplemental information on our ability to generate cash for ongoing business operations and capital deployment. We define Net Cash (Debt) as total unrestricted cash and cash equivalents less the total principal amount of debt outstanding. The total principal amount of debt outstanding is comprised of the long-term debt and current maturities of long-term debt as presented in our consolidated balance sheets adding back any debt issuance costs. We believe that the presentation of Net Cash (Debt) provides useful information to investors because our management reviews Net Cash (Debt) as part of our oversight of overall liquidity, financial flexibility and leverage. We define Organic Revenue Growth as the year-over-year revenue growth excluding revenues from acquired businesses for the first twelve months following the date of acquisition. For purposes of this calculation, the revenue of an acquired business is classified as acquired revenue and excluded from Organic Revenue Growth until the thirteenth month following the acquisition date. Beginning in the thirteenth month, the revenue from that acquisition is included in the Organic Revenue Growth comparison against the corresponding prior-year period. This approach ensures comparability by aligning revenue bases year-over-year and isolating the performance of our ongoing operations. We believe that Organic Revenue Growth is a useful supplemental metric for investors and management, as it provides a clearer view of underlying revenue trends excluding the impact of acquisition-related growth. Disclosures
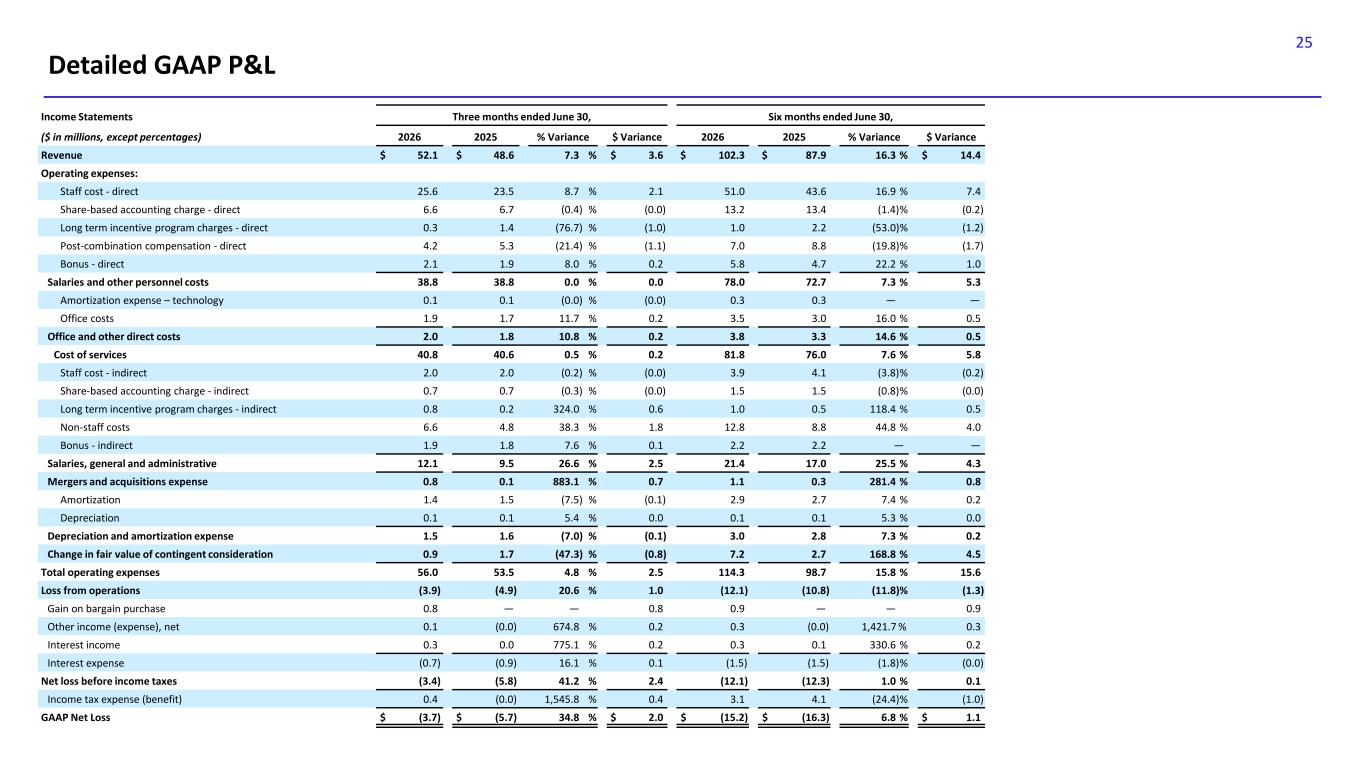
25 Detailed GAAP P&L Income Statements Three months ended June 30, Six months ended June 30, ($ in millions, except percentages) 2026 2025 % Variance $ Variance 2026 2025 % Variance $ Variance Revenue $ 52.1 $ 48.6 7.3 % $ 3.6 $ 102.3 $ 87.9 16.3 % $ 14.4 Operating expenses: Staff cost - direct 25.6 23.5 8.7 % 2.1 51.0 43.6 16.9 % 7.4 Share-based accounting charge - direct 6.6 6.7 (0.4) % (0.0) 13.2 13.4 (1.4)% (0.2) Long term incentive program charges - direct 0.3 1.4 (76.7) % (1.0) 1.0 2.2 (53.0)% (1.2) Post-combination compensation - direct 4.2 5.3 (21.4) % (1.1) 7.0 8.8 (19.8)% (1.7) Bonus - direct 2.1 1.9 8.0 % 0.2 5.8 4.7 22.2 % 1.0 Salaries and other personnel costs 38.8 38.8 0.0 % 0.0 78.0 72.7 7.3 % 5.3 Amortization expense – technology 0.1 0.1 (0.0) % (0.0) 0.3 0.3 — — Office costs 1.9 1.7 11.7 % 0.2 3.5 3.0 16.0 % 0.5 Office and other direct costs 2.0 1.8 10.8 % 0.2 3.8 3.3 14.6 % 0.5 Cost of services 40.8 40.6 0.5 % 0.2 81.8 76.0 7.6 % 5.8 Staff cost - indirect 2.0 2.0 (0.2) % (0.0) 3.9 4.1 (3.8)% (0.2) Share-based accounting charge - indirect 0.7 0.7 (0.3) % (0.0) 1.5 1.5 (0.8)% (0.0) Long term incentive program charges - indirect 0.8 0.2 324.0 % 0.6 1.0 0.5 118.4 % 0.5 Non-staff costs 6.6 4.8 38.3 % 1.8 12.8 8.8 44.8 % 4.0 Bonus - indirect 1.9 1.8 7.6 % 0.1 2.2 2.2 — — Salaries, general and administrative 12.1 9.5 26.6 % 2.5 21.4 17.0 25.5 % 4.3 Mergers and acquisitions expense 0.8 0.1 883.1 % 0.7 1.1 0.3 281.4 % 0.8 Amortization 1.4 1.5 (7.5) % (0.1) 2.9 2.7 7.4 % 0.2 Depreciation 0.1 0.1 5.4 % 0.0 0.1 0.1 5.3 % 0.0 Depreciation and amortization expense 1.5 1.6 (7.0) % (0.1) 3.0 2.8 7.3 % 0.2 Change in fair value of contingent consideration 0.9 1.7 (47.3) % (0.8) 7.2 2.7 168.8 % 4.5 Total operating expenses 56.0 53.5 4.8 % 2.5 114.3 98.7 15.8 % 15.6 Loss from operations (3.9) (4.9) 20.6 % 1.0 (12.1) (10.8) (11.8)% (1.3) Gain on bargain purchase 0.8 — — 0.8 0.9 — — 0.9 Other income (expense), net 0.1 (0.0) 674.8 % 0.2 0.3 (0.0) 1,421.7 % 0.3 Interest income 0.3 0.0 775.1 % 0.2 0.3 0.1 330.6 % 0.2 Interest expense (0.7) (0.9) 16.1 % 0.1 (1.5) (1.5) (1.8)% (0.0) Net loss before income taxes (3.4) (5.8) 41.2 % 2.4 (12.1) (12.3) 1.0 % 0.1 Income tax expense (benefit) 0.4 (0.0) 1,545.8 % 0.4 3.1 4.1 (24.4)% (1.0) GAAP Net Loss $ (3.7) $ (5.7) 34.8 % $ 2.0 $ (15.2) $ (16.3) 6.8 % $ 1.1
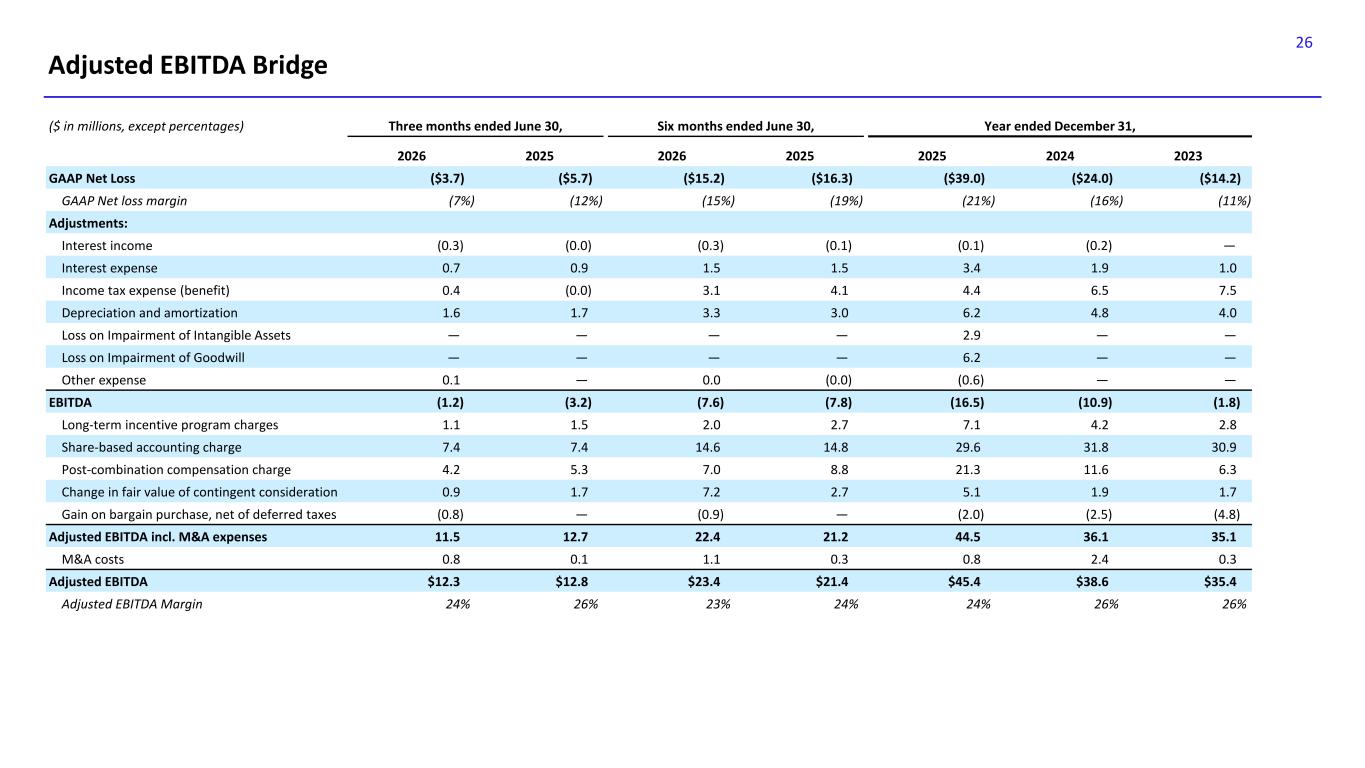
26 Adjusted EBITDA Bridge ($ in millions, except percentages) Three months ended June 30, Six months ended June 30, Year ended December 31, 2026 2025 2026 2025 2025 2024 2023 GAAP Net Loss ($3.7) ($5.7) ($15.2) ($16.3) ($39.0) ($24.0) ($14.2) GAAP Net loss margin (7%) (12%) (15%) (19%) (21%) (16%) (11%) Adjustments: Interest income (0.3) (0.0) (0.3) (0.1) (0.1) (0.2) — Interest expense 0.7 0.9 1.5 1.5 3.4 1.9 1.0 Income tax expense (benefit) 0.4 (0.0) 3.1 4.1 4.4 6.5 7.5 Depreciation and amortization 1.6 1.7 3.3 3.0 6.2 4.8 4.0 Loss on Impairment of Intangible Assets — — — — 2.9 — — Loss on Impairment of Goodwill — — — — 6.2 — — Other expense 0.1 — 0.0 (0.0) (0.6) — — EBITDA (1.2) (3.2) (7.6) (7.8) (16.5) (10.9) (1.8) Long-term incentive program charges 1.1 1.5 2.0 2.7 7.1 4.2 2.8 Share-based accounting charge 7.4 7.4 14.6 14.8 29.6 31.8 30.9 Post-combination compensation charge 4.2 5.3 7.0 8.8 21.3 11.6 6.3 Change in fair value of contingent consideration 0.9 1.7 7.2 2.7 5.1 1.9 1.7 Gain on bargain purchase, net of deferred taxes (0.8) — (0.9) — (2.0) (2.5) (4.8) Adjusted EBITDA incl. M&A expenses 11.5 12.7 22.4 21.2 44.5 36.1 35.1 M&A costs 0.8 0.1 1.1 0.3 0.8 2.4 0.3 Adjusted EBITDA $12.3 $12.8 $23.4 $21.4 $45.4 $38.6 $35.4 Adjusted EBITDA Margin 24% 26% 23% 24% 24% 26% 26%
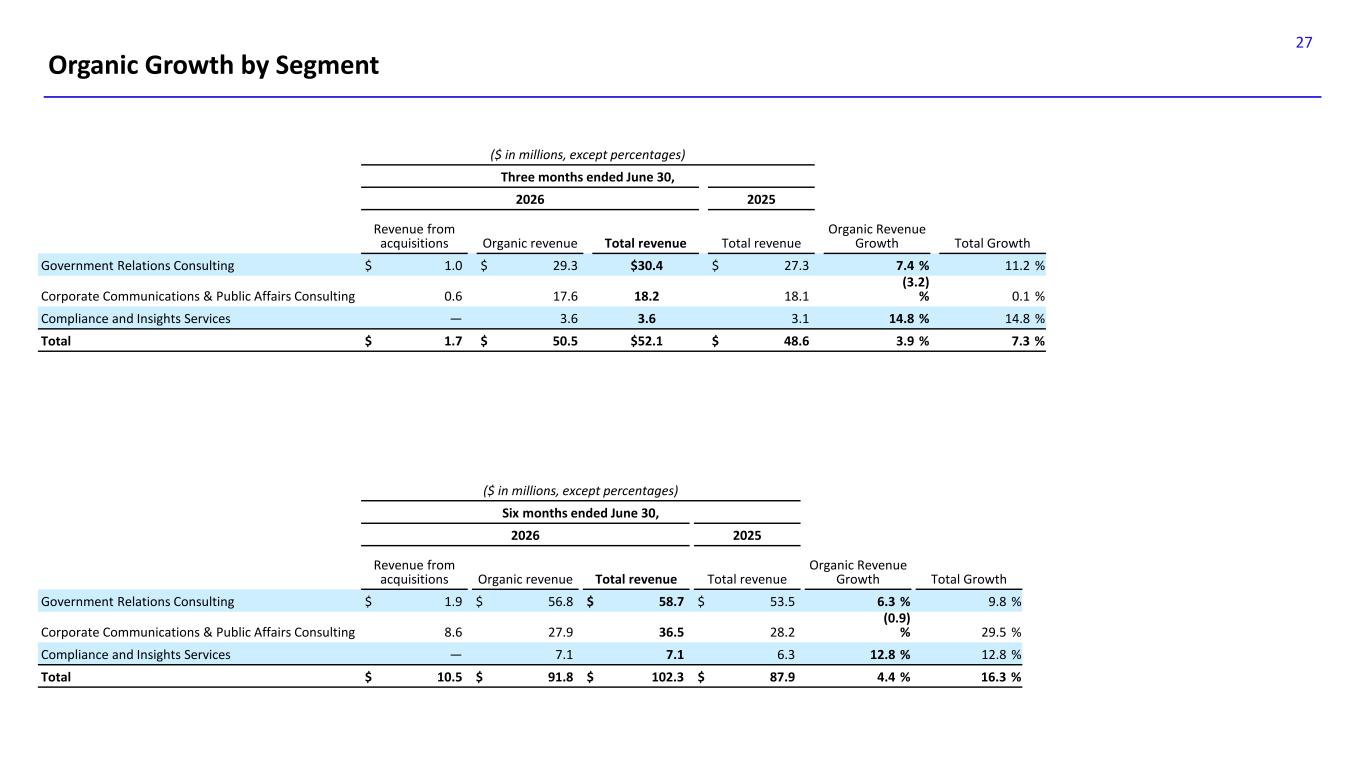
27 Organic Growth by Segment ($ in millions, except percentages) Six months ended June 30, 2026 2025 Revenue from acquisitions Organic revenue Total revenue Total revenue Organic Revenue Growth Total Growth Government Relations Consulting $ 1.9 $ 56.8 $ 58.7 $ 53.5 6.3 % 9.8 % Corporate Communications & Public Affairs Consulting 8.6 27.9 36.5 28.2 (0.9) % 29.5 % Compliance and Insights Services — 7.1 7.1 6.3 12.8 % 12.8 % Total $ 10.5 $ 91.8 $ 102.3 $ 87.9 4.4 % 16.3 % ($ in millions, except percentages) Three months ended June 30, 2026 2025 Revenue from acquisitions Organic revenue Total revenue Total revenue Organic Revenue Growth Total Growth Government Relations Consulting $ 1.0 $ 29.3 $30.4 $ 27.3 7.4 % 11.2 % Corporate Communications & Public Affairs Consulting 0.6 17.6 18.2 18.1 (3.2) % 0.1 % Compliance and Insights Services — 3.6 3.6 3.1 14.8 % 14.8 % Total $ 1.7 $ 50.5 $52.1 $ 48.6 3.9 % 7.3 %
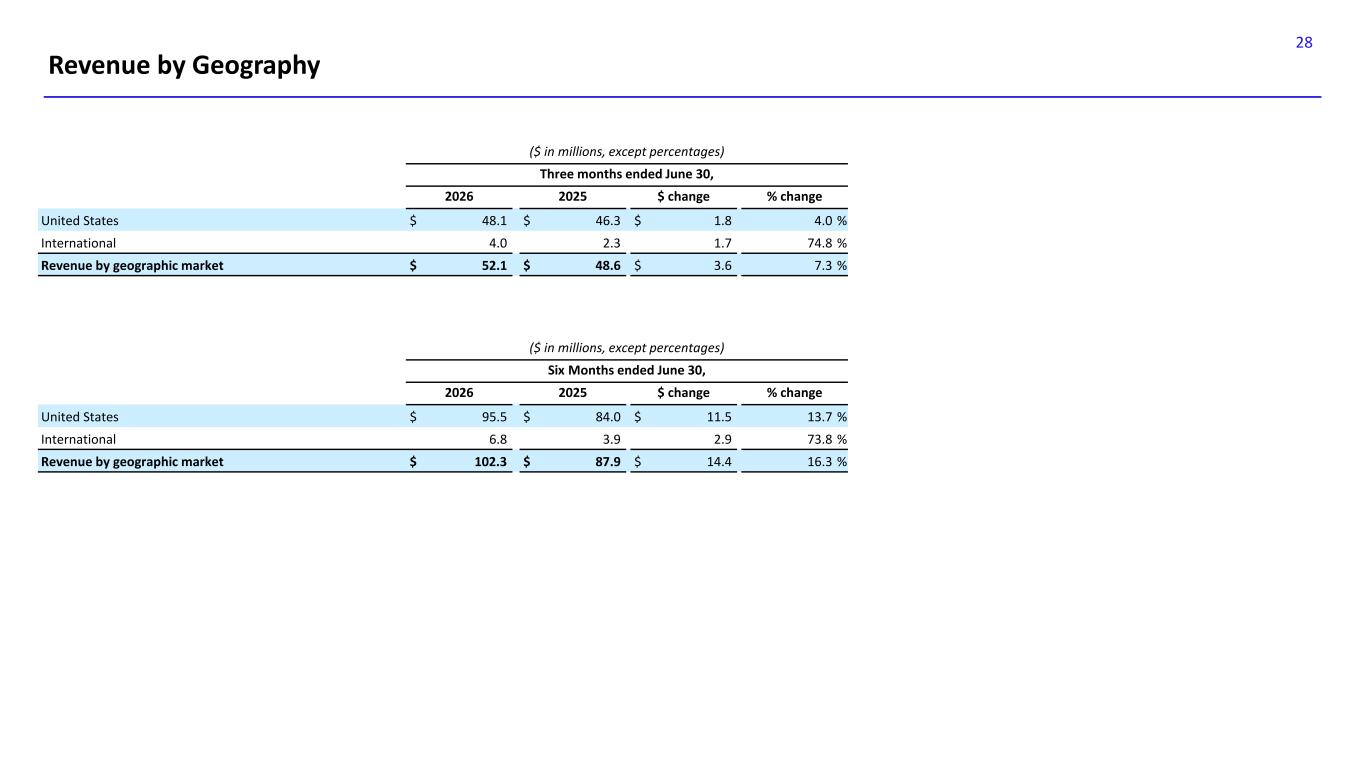
28 Revenue by Geography ($ in millions, except percentages) Six Months ended June 30, 2026 2025 $ change % change United States $ 95.5 $ 84.0 $ 11.5 13.7 % International 6.8 3.9 2.9 73.8 % Revenue by geographic market $ 102.3 $ 87.9 $ 14.4 16.3 % ($ in millions, except percentages) Three months ended June 30, 2026 2025 $ change % change United States $ 48.1 $ 46.3 $ 1.8 4.0 % International 4.0 2.3 1.7 74.8 % Revenue by geographic market $ 52.1 $ 48.6 $ 3.6 7.3 %
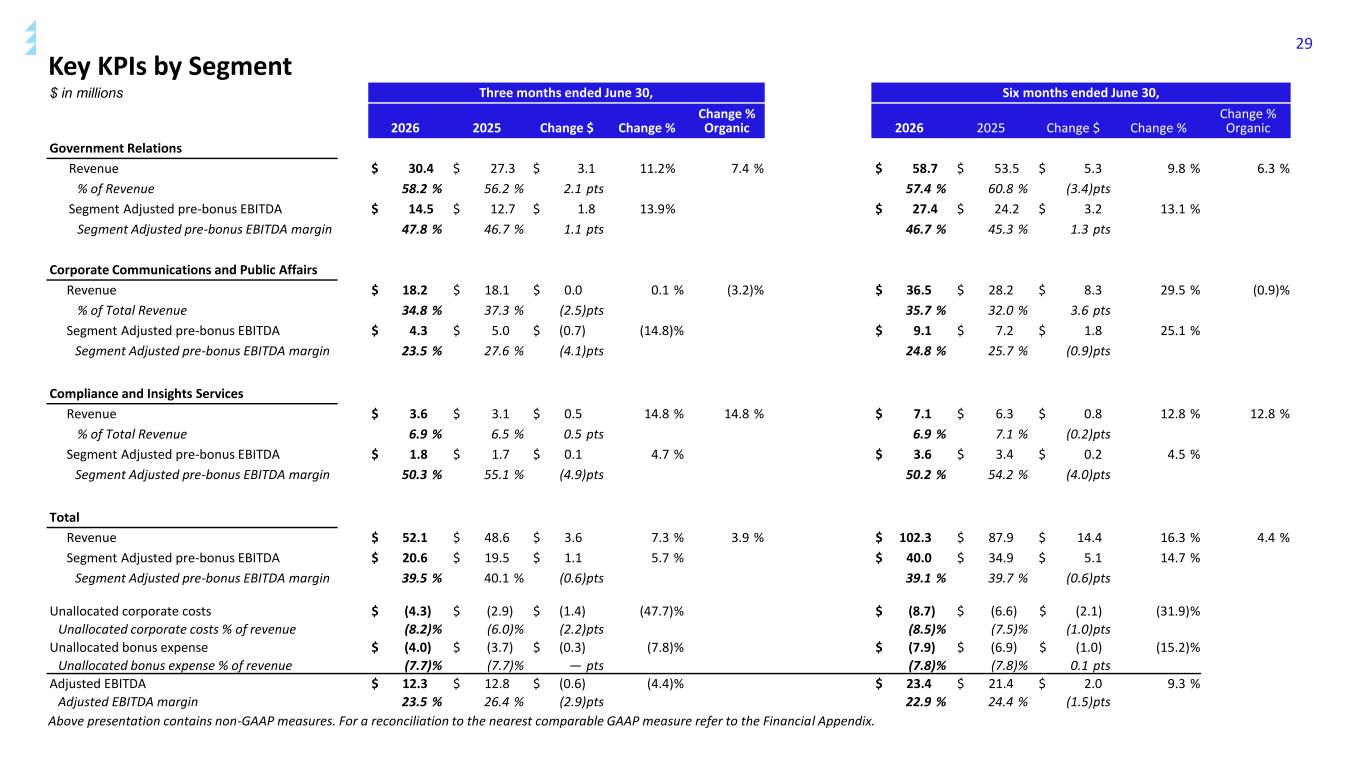
29 Key KPIs by Segment $ in millions Three months ended June 30, Six months ended June 30, 2026 2025 Change $ Change % Change % Organic 2026 2025 Change $ Change % Change % Organic Government Relations Revenue $ 30.4 $ 27.3 $ 3.1 11.2% 7.4 % $ 58.7 $ 53.5 $ 5.3 9.8 % 6.3 % % of Revenue 58.2 % 56.2 % 2.1 pts 57.4 % 60.8 % (3.4)pts Segment Adjusted pre-bonus EBITDA $ 14.5 $ 12.7 $ 1.8 13.9% $ 27.4 $ 24.2 $ 3.2 13.1 % Segment Adjusted pre-bonus EBITDA margin 47.8 % 46.7 % 1.1 pts 46.7 % 45.3 % 1.3 pts Corporate Communications and Public Affairs Revenue $ 18.2 $ 18.1 $ 0.0 0.1 % (3.2)% $ 36.5 $ 28.2 $ 8.3 29.5 % (0.9)% % of Total Revenue 34.8 % 37.3 % (2.5)pts 35.7 % 32.0 % 3.6 pts Segment Adjusted pre-bonus EBITDA $ 4.3 $ 5.0 $ (0.7) (14.8)% $ 9.1 $ 7.2 $ 1.8 25.1 % Segment Adjusted pre-bonus EBITDA margin 23.5 % 27.6 % (4.1)pts 24.8 % 25.7 % (0.9)pts Compliance and Insights Services Revenue $ 3.6 $ 3.1 $ 0.5 14.8 % 14.8 % $ 7.1 $ 6.3 $ 0.8 12.8 % 12.8 % % of Total Revenue 6.9 % 6.5 % 0.5 pts 6.9 % 7.1 % (0.2)pts Segment Adjusted pre-bonus EBITDA $ 1.8 $ 1.7 $ 0.1 4.7 % $ 3.6 $ 3.4 $ 0.2 4.5 % Segment Adjusted pre-bonus EBITDA margin 50.3 % 55.1 % (4.9)pts 50.2 % 54.2 % (4.0)pts Total Revenue $ 52.1 $ 48.6 $ 3.6 7.3 % 3.9 % $ 102.3 $ 87.9 $ 14.4 16.3 % 4.4 % Segment Adjusted pre-bonus EBITDA $ 20.6 $ 19.5 $ 1.1 5.7 % $ 40.0 $ 34.9 $ 5.1 14.7 % Segment Adjusted pre-bonus EBITDA margin 39.5 % 40.1 % (0.6)pts 39.1 % 39.7 % (0.6)pts Unallocated corporate costs $ (4.3) $ (2.9) $ (1.4) (47.7)% $ (8.7) $ (6.6) $ (2.1) (31.9)% Unallocated corporate costs % of revenue (8.2)% (6.0)% (2.2)pts (8.5)% (7.5)% (1.0)pts Unallocated bonus expense $ (4.0) $ (3.7) $ (0.3) (7.8)% $ (7.9) $ (6.9) $ (1.0) (15.2)% Unallocated bonus expense % of revenue (7.7)% (7.7)% — pts (7.8)% (7.8)% 0.1 pts Adjusted EBITDA $ 12.3 $ 12.8 $ (0.6) (4.4)% $ 23.4 $ 21.4 $ 2.0 9.3 % Adjusted EBITDA margin 23.5 % 26.4 % (2.9)pts 22.9 % 24.4 % (1.5)pts Above presentation contains non-GAAP measures. For a reconciliation to the nearest comparable GAAP measure refer to the Financial Appendix.
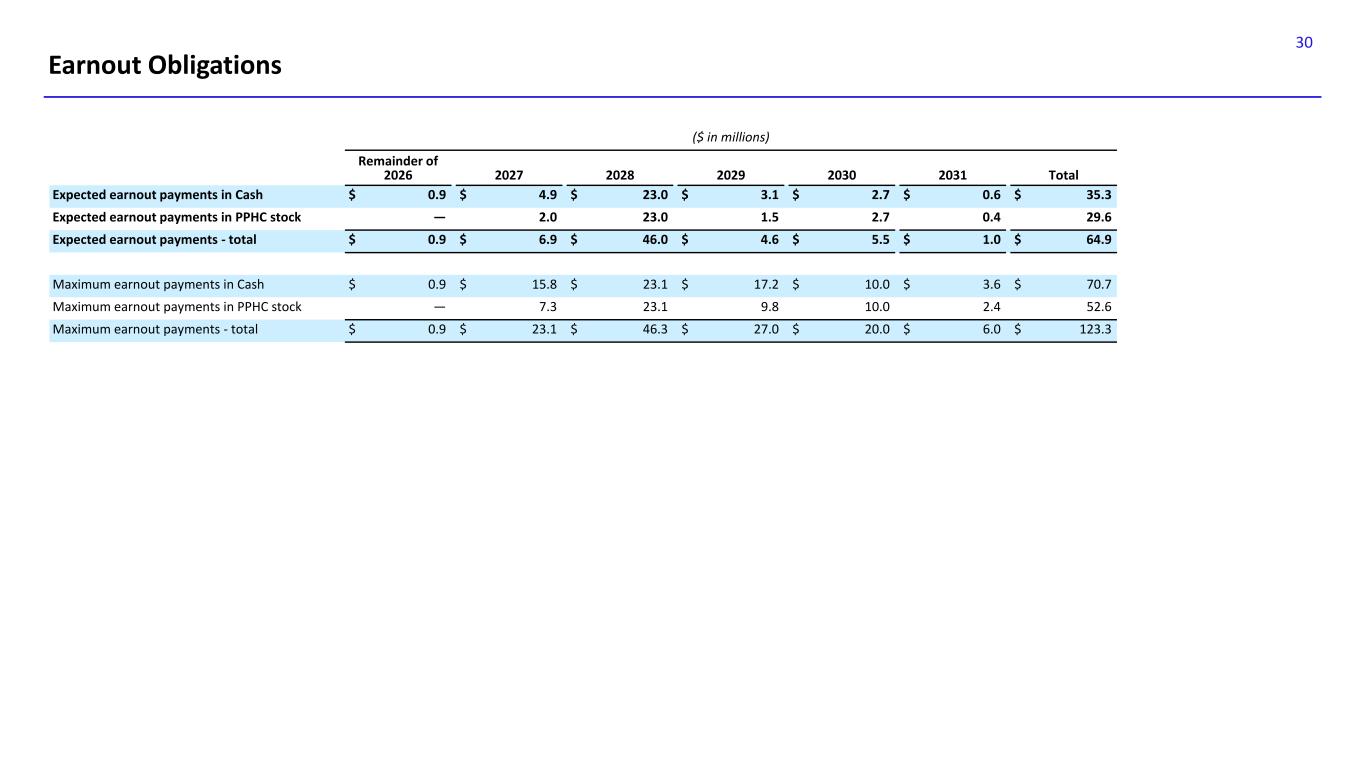
30 Earnout Obligations ($ in millions) Remainder of 2026 2027 2028 2029 2030 2031 Total Expected earnout payments in Cash $ 0.9 $ 4.9 $ 23.0 $ 3.1 $ 2.7 $ 0.6 $ 35.3 Expected earnout payments in PPHC stock — 2.0 23.0 1.5 2.7 0.4 29.6 Expected earnout payments - total $ 0.9 $ 6.9 $ 46.0 $ 4.6 $ 5.5 $ 1.0 $ 64.9 Maximum earnout payments in Cash $ 0.9 $ 15.8 $ 23.1 $ 17.2 $ 10.0 $ 3.6 $ 70.7 Maximum earnout payments in PPHC stock — 7.3 23.1 9.8 10.0 2.4 52.6 Maximum earnout payments - total $ 0.9 $ 23.1 $ 46.3 $ 27.0 $ 20.0 $ 6.0 $ 123.3
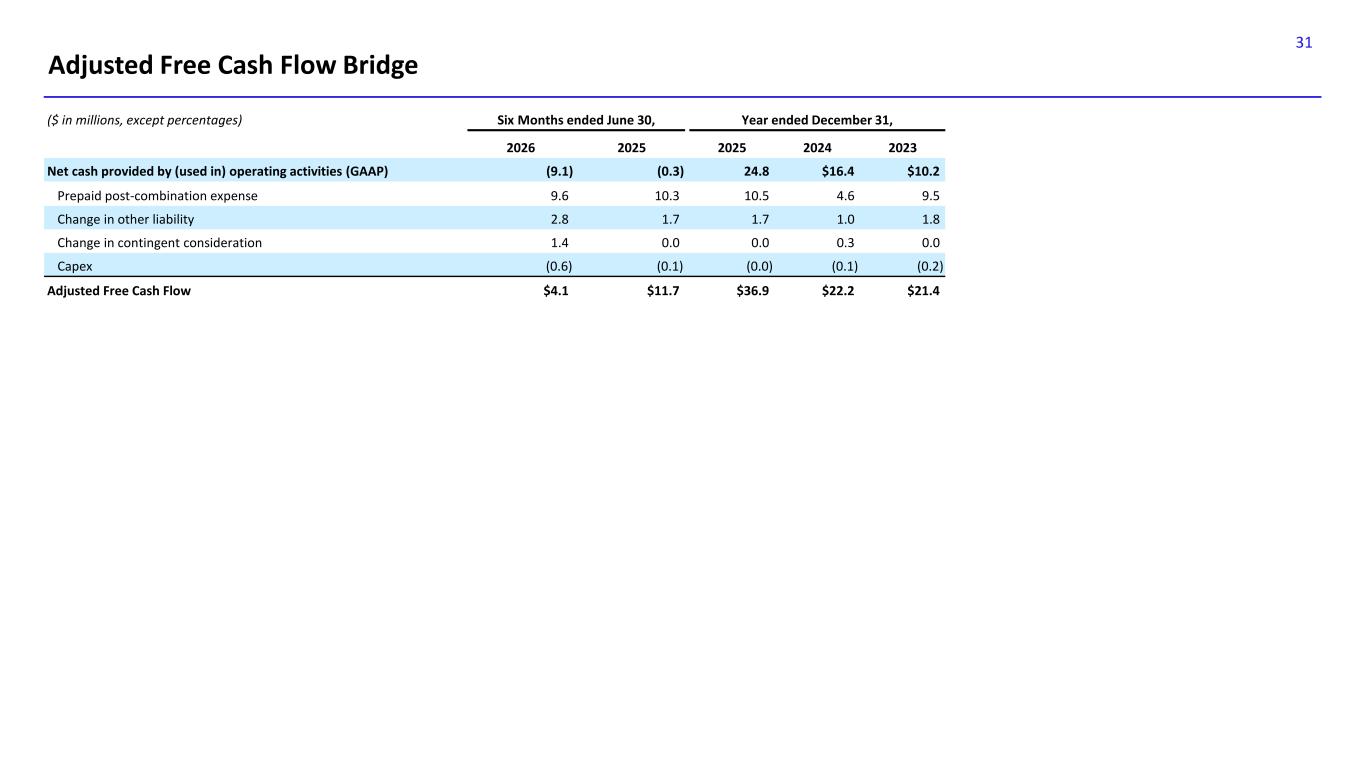
31 Adjusted Free Cash Flow Bridge ($ in millions, except percentages) Six Months ended June 30, Year ended December 31, 2026 2025 2025 2024 2023 Net cash provided by (used in) operating activities (GAAP) (9.1) (0.3) 24.8 $16.4 $10.2 Prepaid post-combination expense 9.6 10.3 10.5 4.6 9.5 Change in other liability 2.8 1.7 1.7 1.0 1.8 Change in contingent consideration 1.4 0.0 0.0 0.3 0.0 Capex (0.6) (0.1) (0.0) (0.1) (0.2) Adjusted Free Cash Flow $4.1 $11.7 $36.9 $22.2 $21.4
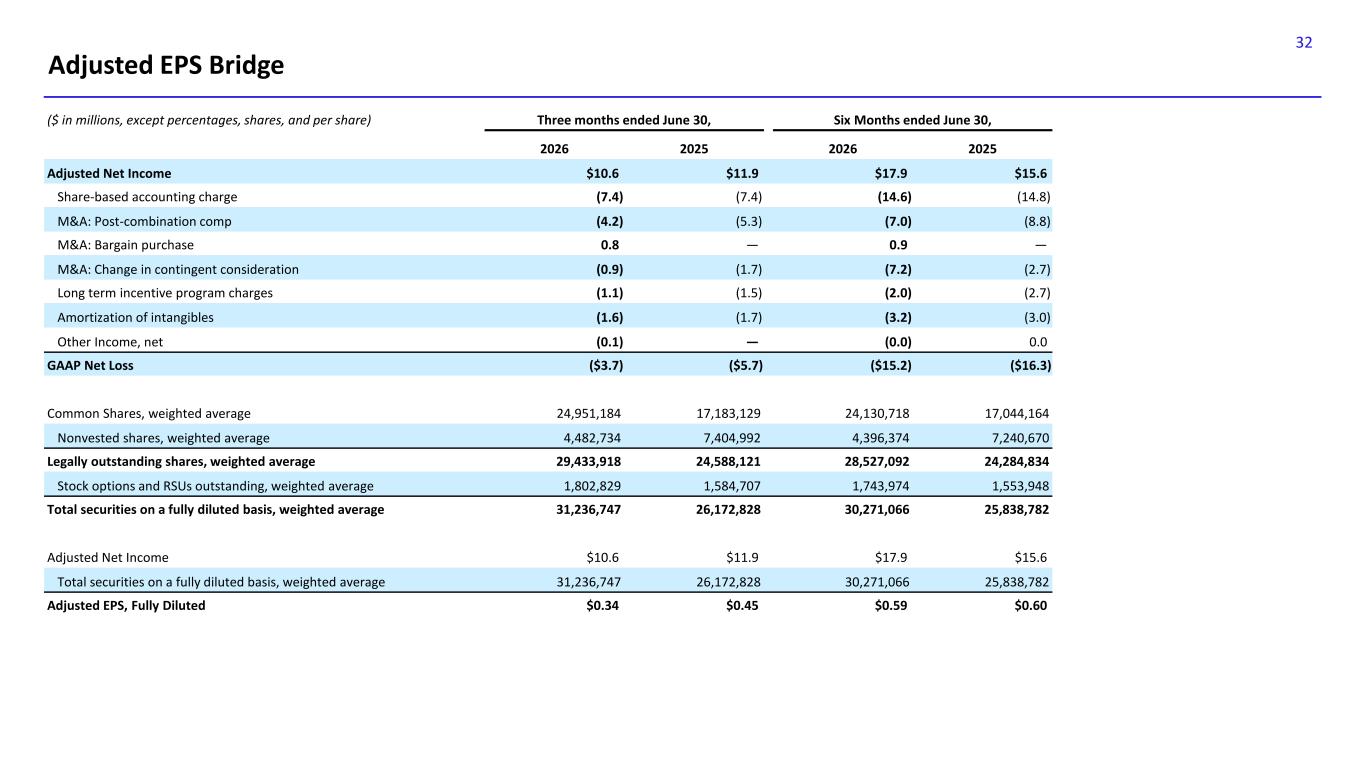
32 Adjusted EPS Bridge ($ in millions, except percentages, shares, and per share) Three months ended June 30, Six Months ended June 30, 2026 2025 2026 2025 Adjusted Net Income $10.6 $11.9 $17.9 $15.6 Share-based accounting charge (7.4) (7.4) (14.6) (14.8) M&A: Post-combination comp (4.2) (5.3) (7.0) (8.8) M&A: Bargain purchase 0.8 — 0.9 — M&A: Change in contingent consideration (0.9) (1.7) (7.2) (2.7) Long term incentive program charges (1.1) (1.5) (2.0) (2.7) Amortization of intangibles (1.6) (1.7) (3.2) (3.0) Other Income, net (0.1) — (0.0) 0.0 GAAP Net Loss ($3.7) ($5.7) ($15.2) ($16.3) Common Shares, weighted average 24,951,184 17,183,129 24,130,718 17,044,164 Nonvested shares, weighted average 4,482,734 7,404,992 4,396,374 7,240,670 Legally outstanding shares, weighted average 29,433,918 24,588,121 28,527,092 24,284,834 Stock options and RSUs outstanding, weighted average 1,802,829 1,584,707 1,743,974 1,553,948 Total securities on a fully diluted basis, weighted average 31,236,747 26,172,828 30,271,066 25,838,782 Adjusted Net Income $10.6 $11.9 $17.9 $15.6 Total securities on a fully diluted basis, weighted average 31,236,747 26,172,828 30,271,066 25,838,782 Adjusted EPS, Fully Diluted $0.34 $0.45 $0.59 $0.60
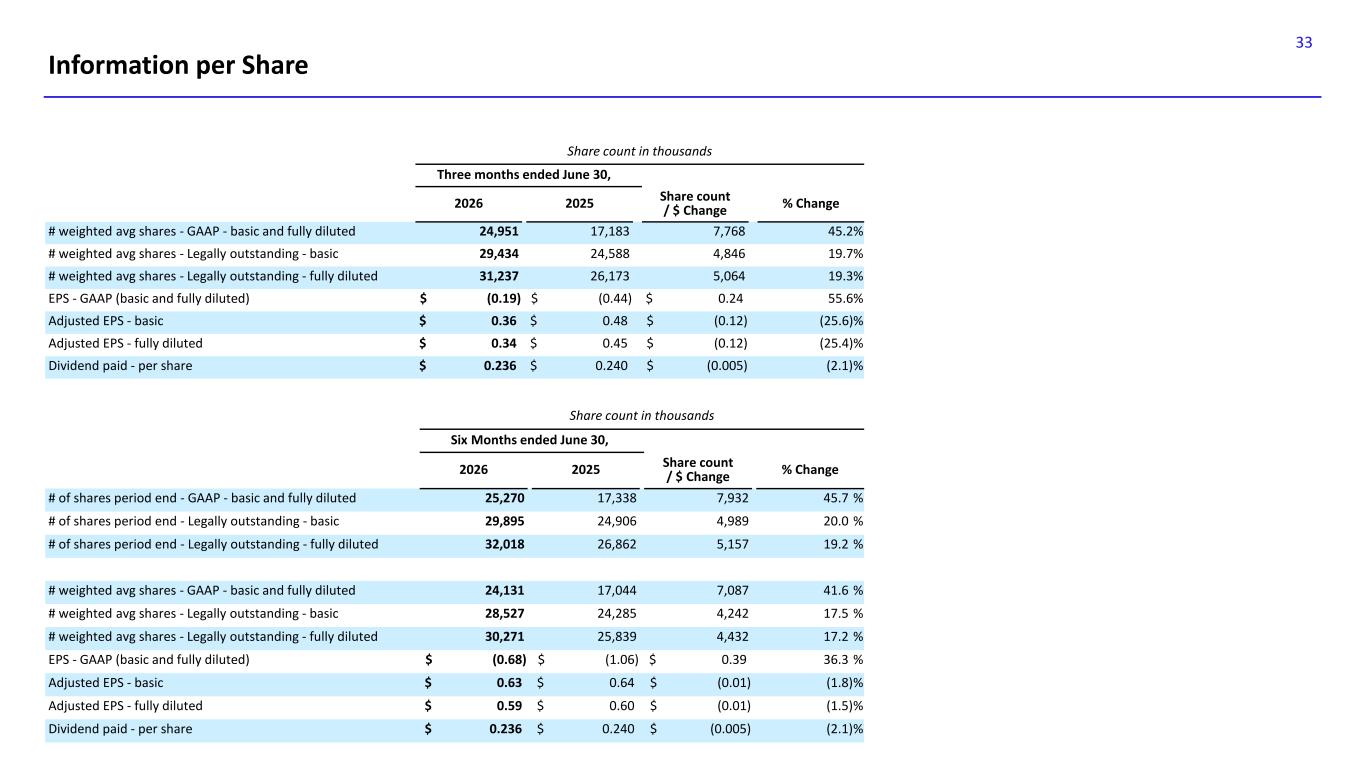
33 Information per Share Share count in thousands Three months ended June 30, 2026 2025 Share count / $ Change % Change # weighted avg shares - GAAP - basic and fully diluted 24,951 17,183 7,768 45.2% # weighted avg shares - Legally outstanding - basic 29,434 24,588 4,846 19.7% # weighted avg shares - Legally outstanding - fully diluted 31,237 26,173 5,064 19.3% EPS - GAAP (basic and fully diluted) $ (0.19) $ (0.44) $ 0.24 55.6% Adjusted EPS - basic $ 0.36 $ 0.48 $ (0.12) (25.6)% Adjusted EPS - fully diluted $ 0.34 $ 0.45 $ (0.12) (25.4)% Dividend paid - per share $ 0.236 $ 0.240 $ (0.005) (2.1)% Share count in thousands Six Months ended June 30, 2026 2025 Share count / $ Change % Change # of shares period end - GAAP - basic and fully diluted 25,270 17,338 7,932 45.7 % # of shares period end - Legally outstanding - basic 29,895 24,906 4,989 20.0 % # of shares period end - Legally outstanding - fully diluted 32,018 26,862 5,157 19.2 % # weighted avg shares - GAAP - basic and fully diluted 24,131 17,044 7,087 41.6 % # weighted avg shares - Legally outstanding - basic 28,527 24,285 4,242 17.5 % # weighted avg shares - Legally outstanding - fully diluted 30,271 25,839 4,432 17.2 % EPS - GAAP (basic and fully diluted) $ (0.68) $ (1.06) $ 0.39 36.3 % Adjusted EPS - basic $ 0.63 $ 0.64 $ (0.01) (1.8)% Adjusted EPS - fully diluted $ 0.59 $ 0.60 $ (0.01) (1.5)% Dividend paid - per share $ 0.236 $ 0.240 $ (0.005) (2.1)%

34