Q2 2026 Earnings Presentation Quanterix Corporation: (NASDAQ: QTRX) August 10th, 2026 Everett Cunningham, Chief Executive Officer Jason Faessler, Chief Financial Officer
Legal Information CAUTIONARY STATEMENT REGARDING FORWARD-LOOKING STATEMENTS Statements included in this presentation that are not historical in nature or do not relate to current facts are intended to be, and are hereby identified as, forward-looking statements for purposes of the safe harbor provided by Section 27A of the Securities Act of 1933, as amended, and Section 21E of the Securities Exchange Act of 1934, as amended. Forward-looking statements include, among other things, statements about Quanterix’s future business outlook, operations, strategy and financial performance, including statements related to our expectations about consistent profitable revenue growth and achieving cash flow breakeven performance, the development and commercialization of our products, and under the header “2026 Business Outlook.”. Words and phrases such as “may,” “approximately,” “continue,” “should,” “expects,” “projects,” “anticipates,” “is likely,” “look ahead,” “look forward,” “believes,” “will,” “intends,” “estimates,” “strategy,” “plan,” “could,” “potential,” “possible” and variations of such words and similar expressions are intended to identify such forwardlooking statements. Forward-looking statements are subject to certain risks and uncertainties that are difficult to predict with regard to, among other things, timing, extent, likelihood and degree of occurrence, which could cause actual results to differ materially from anticipated results. Such risks and uncertainties include, among others, the following possibilities with respect to Quanterix’s future business, operations, strategy and financial performance: risks related to the impact of changes in U.S. government policies, including impacts of tariffs and reductions in federal research funding; risks associated with the anticipated timing for launch of, and features of, Quanterix’s next-generation instruments to upgrade its existing platforms; risks related to Quanterix’s ability to improve existing diagnostics and develop new diagnostic tests and tools; risks related to Quanterix’s ability to successfully penetrate the diagnostics market; risks related to Quanterix’s ability to retain and expand its customer base and achieve sufficient market acceptance of its products; risks related to the ability of Quanterix’s contract manufacturers and suppliers to reliably and consistently manufacture and supply our instruments; risks that Quanterix may fail to realize the anticipated benefits from its recent acquisitions of Emission, Inc. and Akoya Biosciences, Inc.; risks that Quanterix’s estimates regarding expenses, future revenues, capital requirements, and needs for additional financing could be incorrect; risks related to Quanterix’s ability to maintain effective internal control over financial reporting and disclosure controls and procedures; and risks related to defects or other quality issues in Quanterix’s products that could lead to unforeseen costs, product recalls, adverse regulatory actions, negative publicity and litigation. Additional factors that could cause results to differ materially from those described above can be found in the periodic reports filed by Quanterix with the SEC, including the “Risk Factors” sections contained therein, which are available on the SEC’s website at www.sec.gov. All forward-looking statements, expressed or implied, included in this presentation are expressly qualified in their entirety by the cautionary statements contained or referred to herein. If one or more events related to these or other risks or uncertainties materialize, or if Quanterix’s underlying assumptions prove to be incorrect, actual results may differ materially from what Quanterix anticipates. Quanterix cautions the audience not to place undue reliance on any such forward-looking statements, which speak only as of the date they are made and are based on information available at that time. Quanterix does not assume any obligation to update or otherwise revise any forward-looking statements to reflect circumstances or events that occur after the date the forward-looking statements were made or to reflect the occurrence of unanticipated events except as required by federal securities laws. USE OF NON-GAAP FINANCIAL MEASURES To supplement Quanterix's preliminary financial information presented on a U.S. GAAP basis, Quanterix has provided certain non-GAAP financial measures, including adjusted EBITDA, adjusted EBITDA margin, adjusted cash usage, adjusted gross profit, adjusted gross margin, adjusted total operating expenses, and adjusted loss from operations. Management uses these non-GAAP financial measures to evaluate the Company's operating performance in a manner that allows for meaningful period-to-period comparison and analysis of trends in our business and our competitors. Management believes that presentation of these non- GAAP financial measures provides useful information to investors in assessing our operating performance within our industry and in order to allow comparability to the presentation of other companies in our industry. The non-GAAP financial measures presented herein should be considered in conjunction with, and not as a substitute for, the financial information presented in accordance with U.S. GAAP. For example, adjusted EBITDA excludes a number of expense items that are included in net loss and adjusted cash usage excludes certain actual cash payments. As a result, positive adjusted EBITDA or positive adjusted cash usage may be achieved even where we record a significant net loss or reduction in our cash and marketable securities balances in accordance with U.S. GAAP. Investors are encouraged to review the reconciliation of these non-GAAP financial measures to their most directly comparable GAAP financial measures set forth herein. The Company makes certain forward-looking statements about Quanterix's future financial performance that include non-GAAP financial measures, which are difficult to predict for future periods because the nature of the adjustments pertains to events that have not yet occurred. Quanterix does not forecast many of the excluded items for internal use and therefore information reconciling forward-looking non-GAAP financial measures to U.S. GAAP financial measures is not available without unreasonable effort and is not provided. The occurrence, timing, and amount of any of the items excluded from U.S. GAAP to calculate non-GAAP financial measures could significantly impact our U.S. GAAP results. Please refer to our second quarter 2026 earnings release for additional discussion of non-GAAP financial measures. Unless otherwise specified, all information contained herein is provided as of June 30, 2026. 2
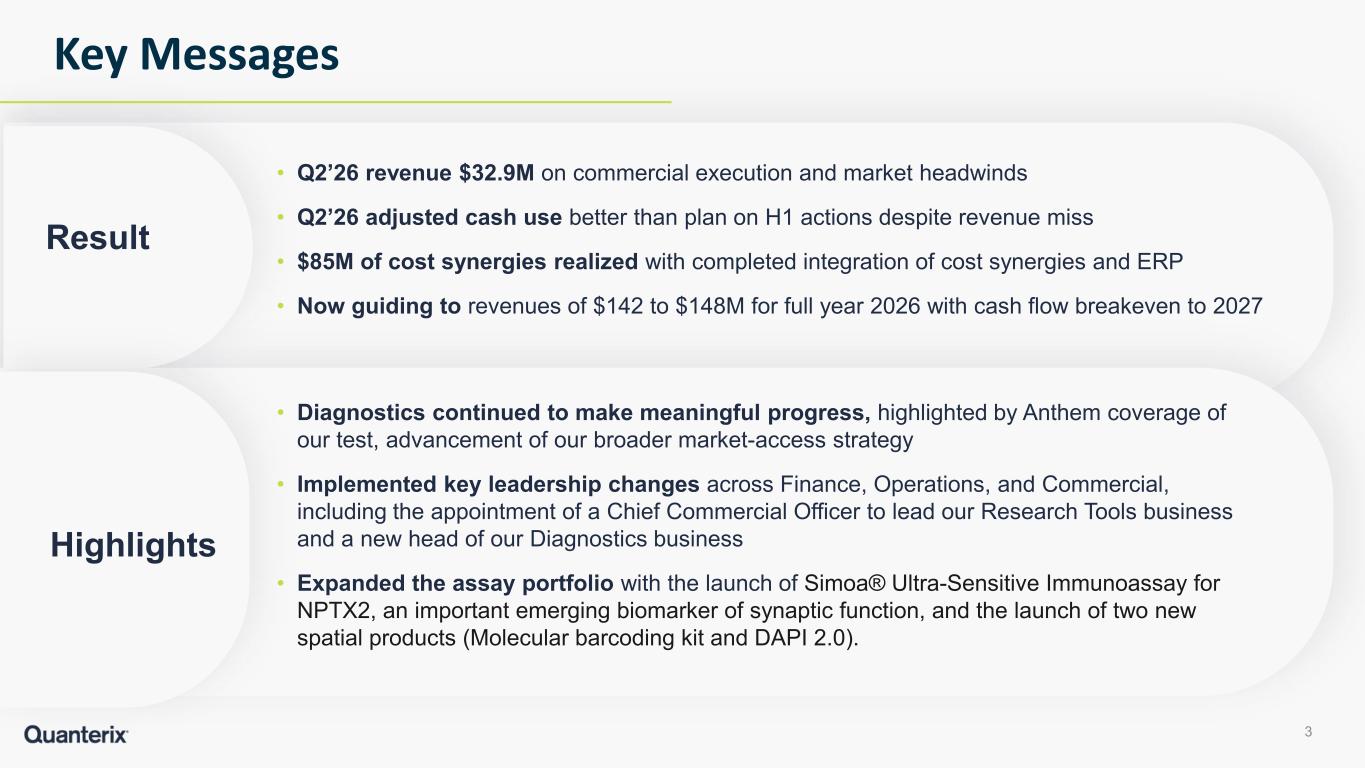
• Q2’26 revenue $32.9M on commercial execution and market headwinds • Q2’26 adjusted cash use better than plan on H1 actions despite revenue miss • $85M of cost synergies realized with completed integration of cost synergies and ERP • Now guiding to revenues of $142 to $148M for full year 2026 with cash flow breakeven to 2027 Key Messages 3 Result • Diagnostics continued to make meaningful progress, highlighted by Anthem coverage of our test, advancement of our broader market-access strategy • Implemented key leadership changes across Finance, Operations, and Commercial, including the appointment of a Chief Commercial Officer to lead our Research Tools business and a new head of our Diagnostics business • Expanded the assay portfolio with the launch of Simoa® Ultra-Sensitive Immunoassay for NPTX2, an important emerging biomarker of synaptic function, and the launch of two new spatial products (Molecular barcoding kit and DAPI 2.0). Highlights
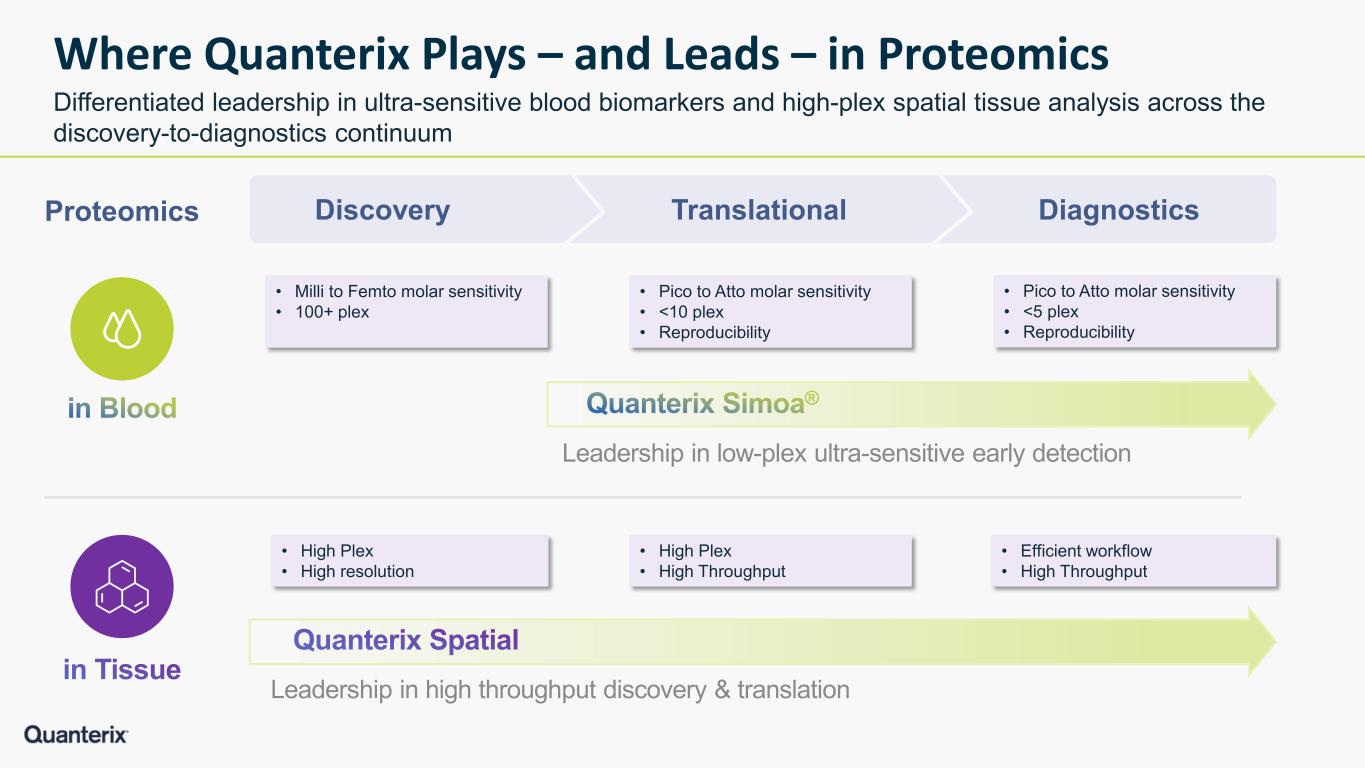
Where Quanterix Plays – and Leads – in Proteomics Differentiated leadership in ultra-sensitive blood biomarkers and high-plex spatial tissue analysis across the discovery-to-diagnostics continuum DiagnosticsTranslationalDiscovery • Milli to Femto molar sensitivity • 100+ plex • Pico to Atto molar sensitivity • <10 plex • Reproducibility • Pico to Atto molar sensitivity • <5 plex • Reproducibility Leadership in low-plex ultra-sensitive early detection • High Plex • High resolution • High Plex • High Throughput • Efficient workflow • High Throughput Leadership in high throughput discovery & translation Proteomics
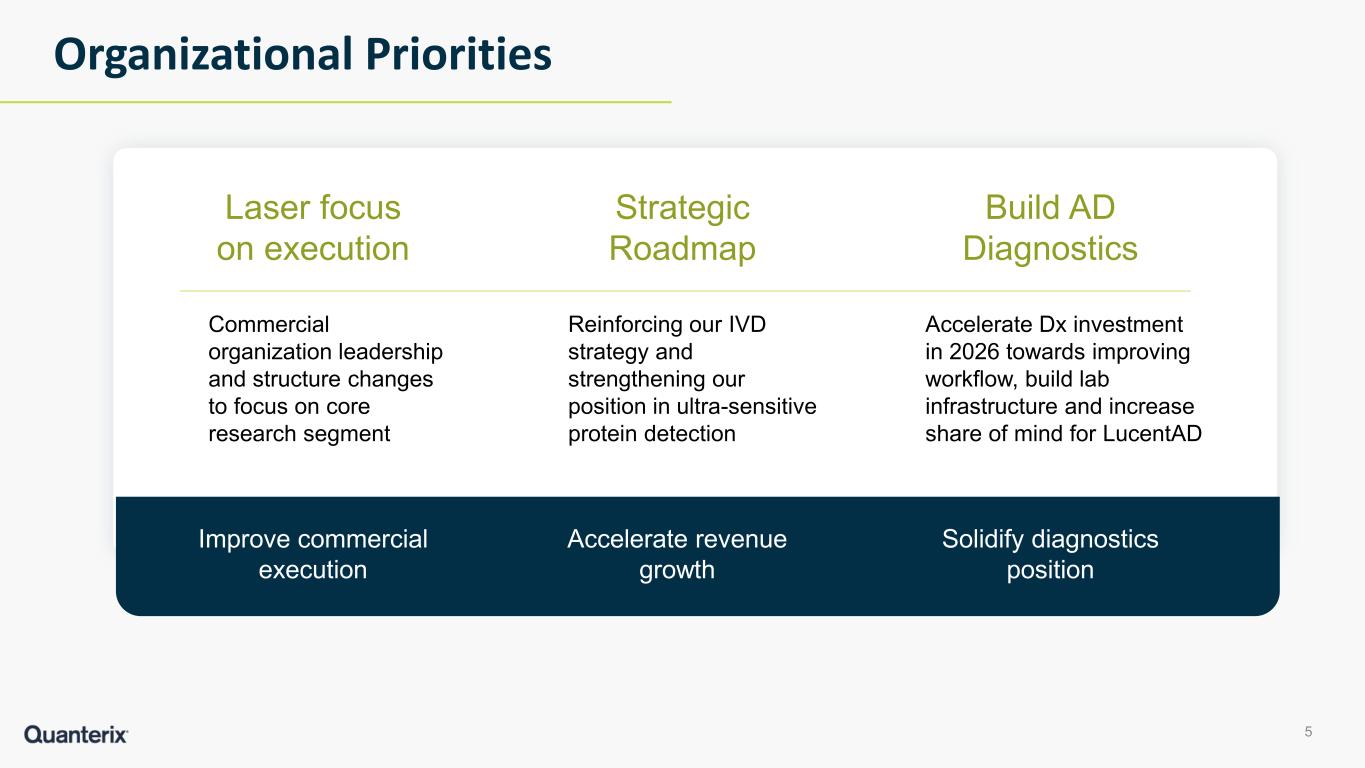
Organizational Priorities Laser focus on execution Commercial organization leadership and structure changes to focus on core research segment Strategic Roadmap Reinforcing our IVD strategy and strengthening our position in ultra-sensitive protein detection Build AD Diagnostics Accelerate Dx investment in 2026 towards improving workflow, build lab infrastructure and increase share of mind for LucentAD Improve commercial execution Solidify diagnostics position Accelerate revenue growth 5
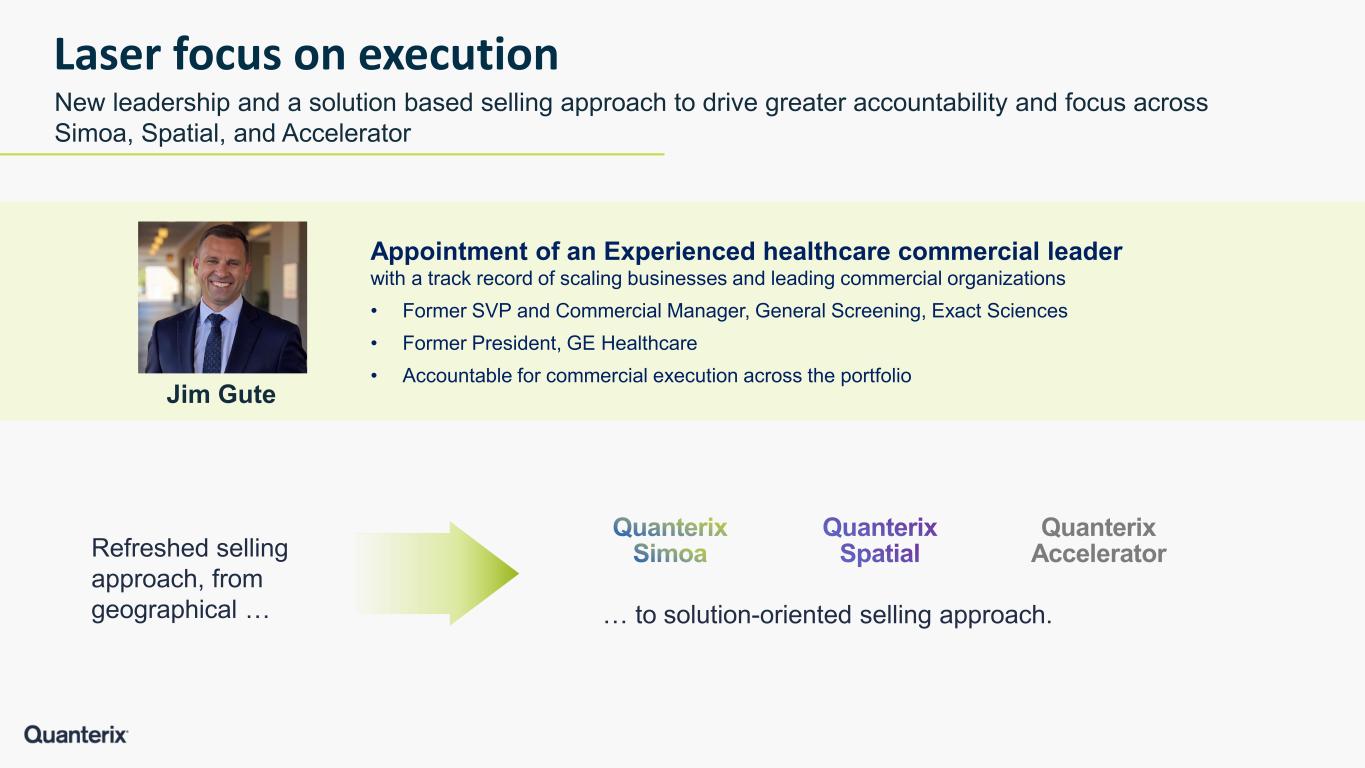
Appointment of an Experienced healthcare commercial leader with a track record of scaling businesses and leading commercial organizations • Former SVP and Commercial Manager, General Screening, Exact Sciences • Former President, GE Healthcare • Accountable for commercial execution across the portfolio Laser focus on execution New leadership and a solution based selling approach to drive greater accountability and focus across Simoa, Spatial, and Accelerator Quanterix Accelerator Jim Gute Refreshed selling approach, from geographical … … to solution-oriented selling approach.
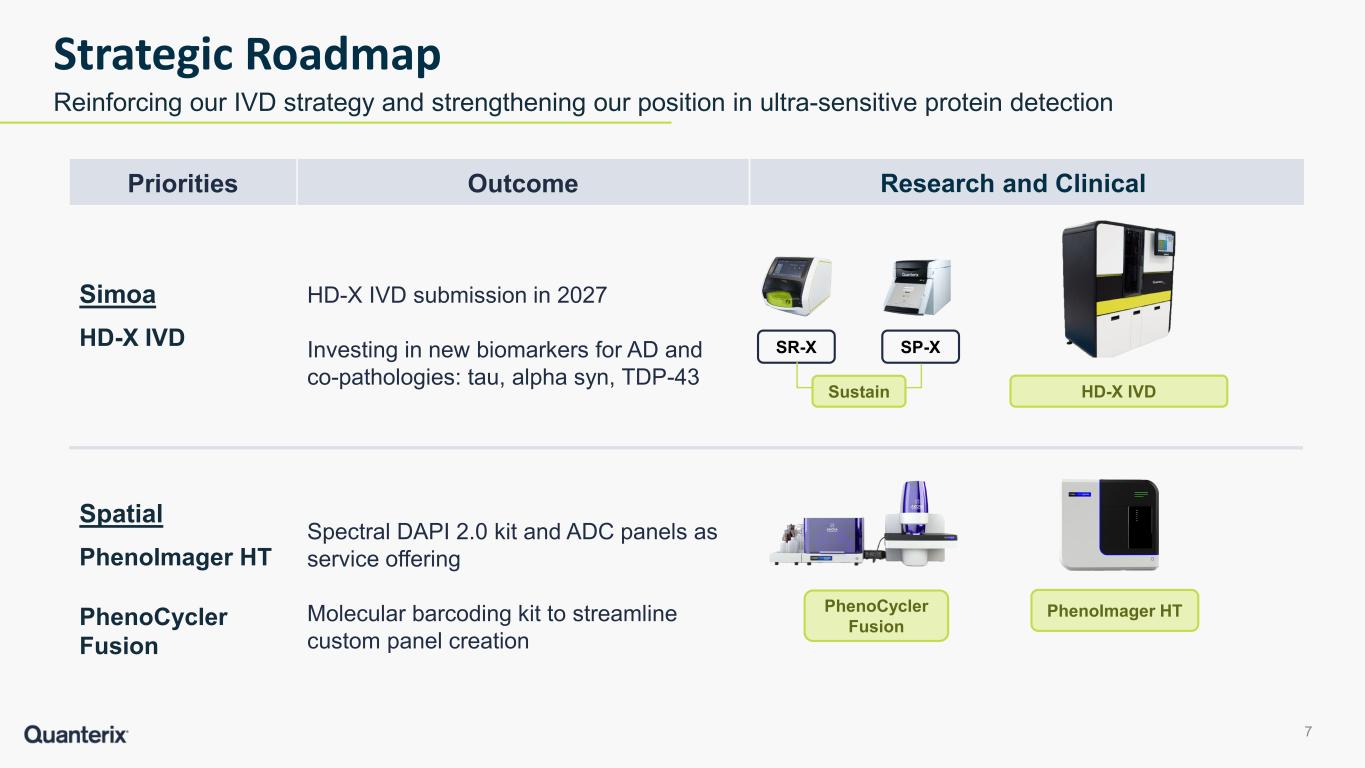
7 Strategic Roadmap Reinforcing our IVD strategy and strengthening our position in ultra-sensitive protein detection HD-X IVD SP-XSR-X Priorities Outcome Simoa HD-X IVD HD-X IVD submission in 2027 Investing in new biomarkers for AD and co-pathologies: tau, alpha syn, TDP-43 Spatial PhenoImager HT PhenoCycler Fusion Spectral DAPI 2.0 kit and ADC panels as service offering Molecular barcoding kit to streamline custom panel creation Research and Clinical PhenoImager HTPhenoCycler Fusion Sustain
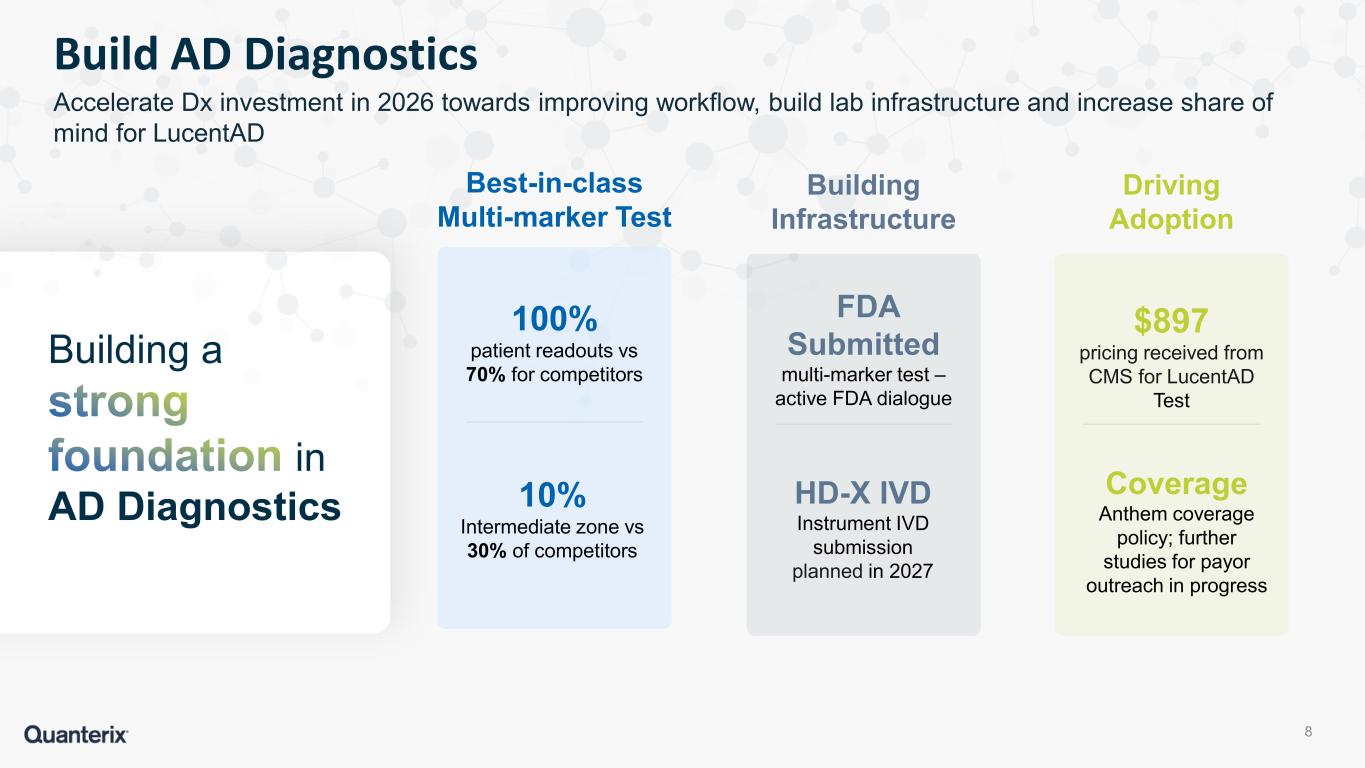
Best-in-class Multi-marker Test Building Infrastructure 100% patient readouts vs 70% for competitors 10% Intermediate zone vs 30% of competitors HD-X IVD Instrument IVD submission planned in 2027 Driving Adoption $897 pricing received from CMS for LucentAD Test Coverage Anthem coverage policy; further studies for payor outreach in progress FDA Submitted multi-marker test – active FDA dialogue Building a in AD Diagnostics 8 Build AD Diagnostics Accelerate Dx investment in 2026 towards improving workflow, build lab infrastructure and increase share of mind for LucentAD
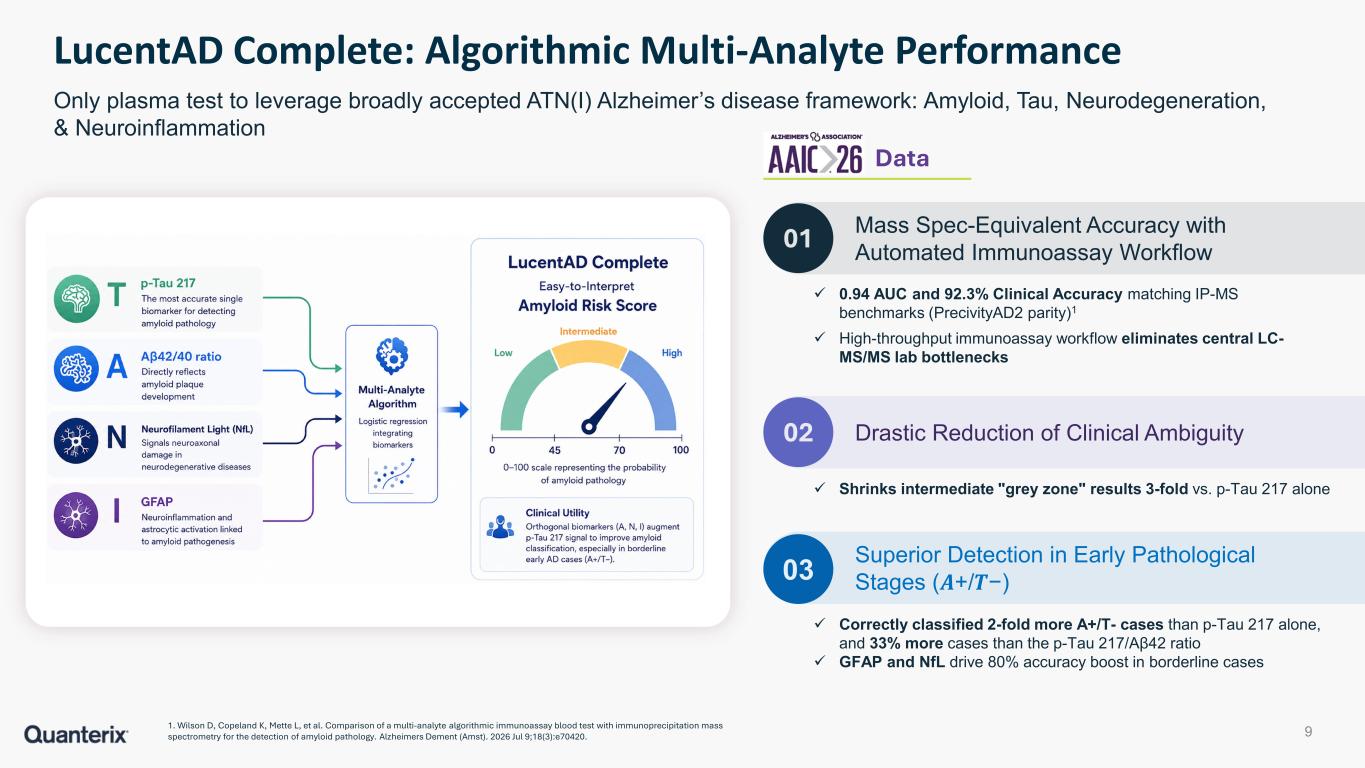
9 LucentAD Complete: Algorithmic Multi-Analyte Performance Only plasma test to leverage broadly accepted ATN(I) Alzheimer’s disease framework: Amyloid, Tau, Neurodegeneration, & Neuroinflammation 01 02 0.94 AUC and 92.3% Clinical Accuracy matching IP-MS benchmarks (PrecivityAD2 parity)1 High-throughput immunoassay workflow eliminates central LC- MS/MS lab bottlenecks Mass Spec-Equivalent Accuracy with Automated Immunoassay Workflow Drastic Reduction of Clinical Ambiguity Shrinks intermediate "grey zone" results 3-fold vs. p-Tau 217 alone 03 Superior Detection in Early Pathological Stages (𝑨𝑨+/𝑻𝑻−) Correctly classified 2-fold more A+/T- cases than p-Tau 217 alone, and 33% more cases than the p-Tau 217/Aβ42 ratio GFAP and NfL drive 80% accuracy boost in borderline cases Data 1. Wilson D, Copeland K, Mette L, et al. Comparison of a multi-analyte algorithmic immunoassay blood test with immunoprecipitation mass spectrometry for the detection of amyloid pathology. Alzheimers Dement (Amst). 2026 Jul 9;18(3):e70420.
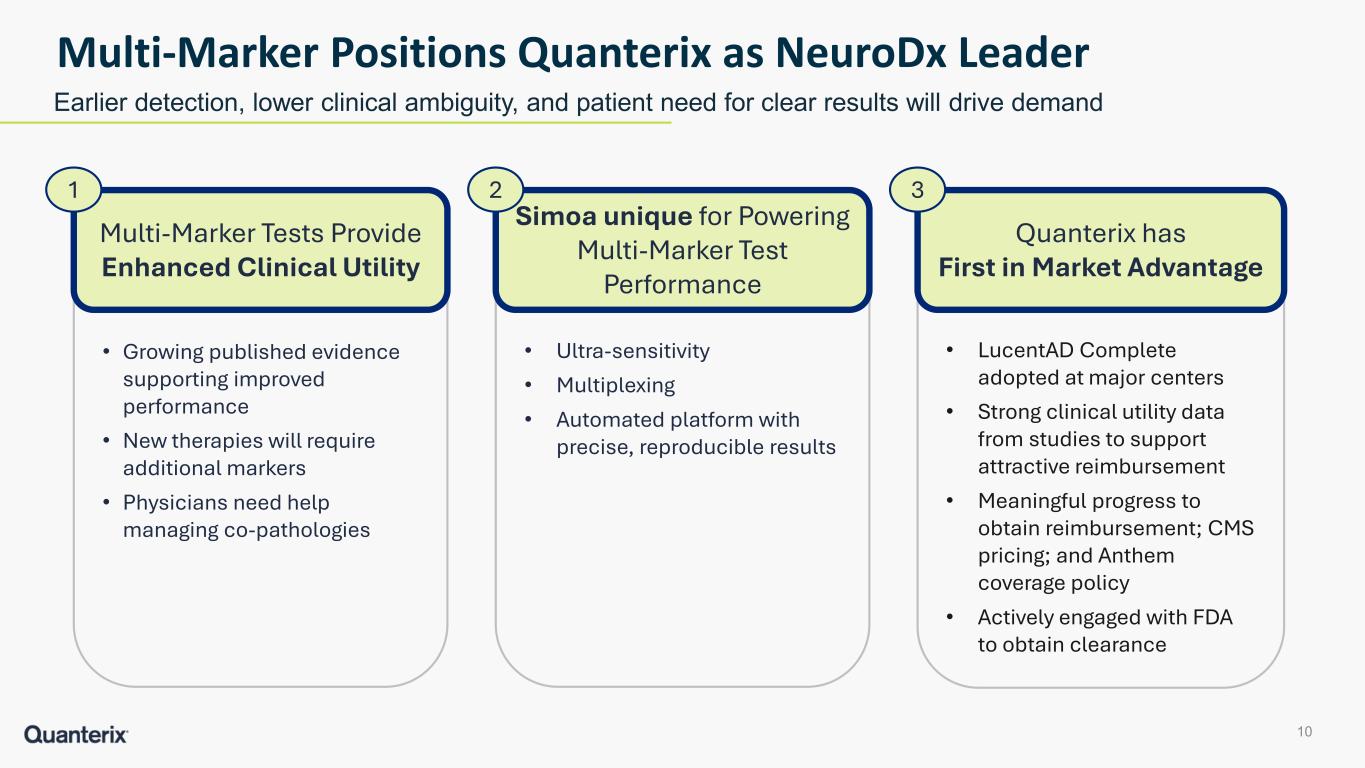
• Growing published evidence supporting improved performance • New therapies will require additional markers • Physicians need help managing co-pathologies 10 Multi-Marker Positions Quanterix as NeuroDx Leader Earlier detection, lower clinical ambiguity, and patient need for clear results will drive demand Multi-Marker Tests Provide Enhanced Clinical Utility 1 • Ultra-sensitivity • Multiplexing • Automated platform with precise, reproducible results Simoa unique for Powering Multi-Marker Test Performance 2 • LucentAD Complete adopted at major centers • Strong clinical utility data from studies to support attractive reimbursement • Meaningful progress to obtain reimbursement; CMS pricing; and Anthem coverage policy • Actively engaged with FDA to obtain clearance Quanterix has First in Market Advantage 3
Q2’26 Financial Update
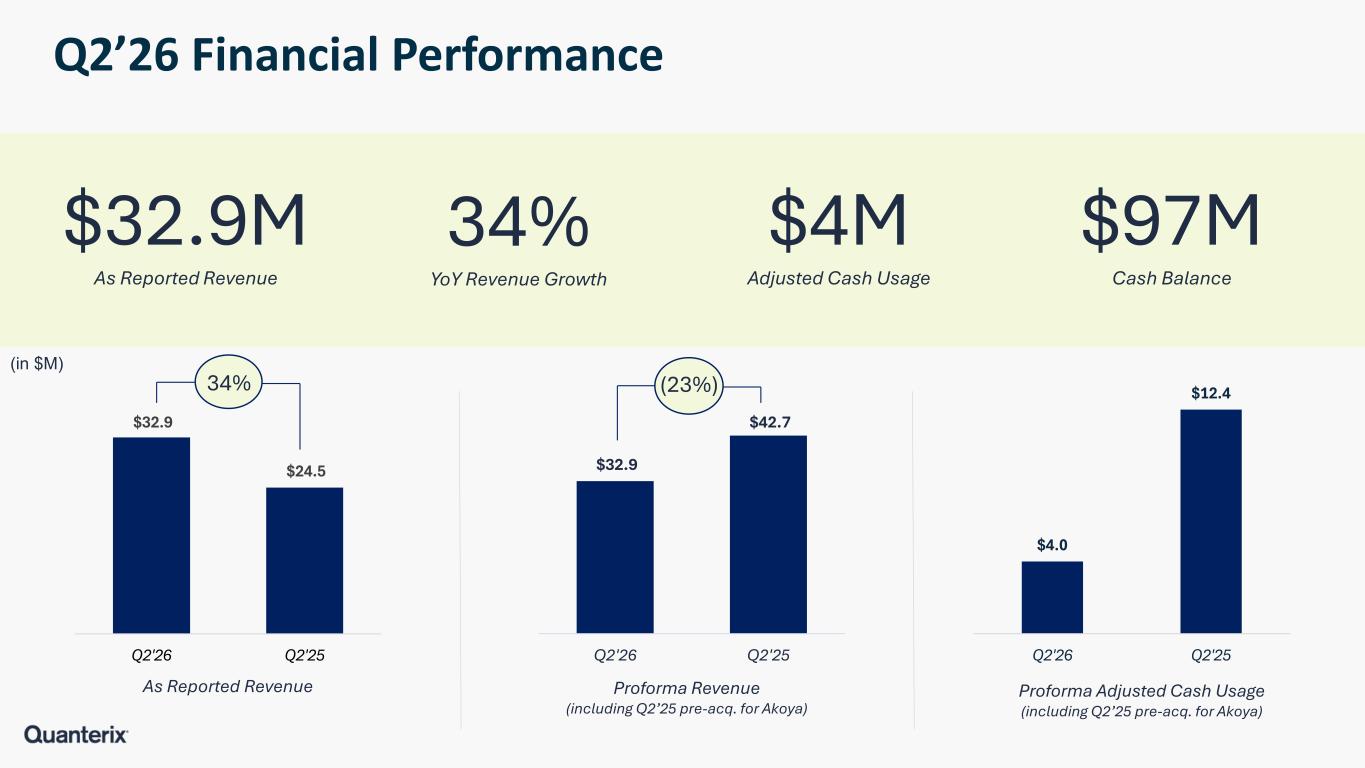
Q2’26 Financial Performance (in $M) $32.9M As Reported Revenue 34% YoY Revenue Growth $4M Adjusted Cash Usage $97M Cash Balance $32.9 $24.5 Q2'26 Q2'25 As Reported Revenue $32.9 $42.7 Q2'26 Q2'25 Proforma Revenue (including Q2’25 pre-acq. for Akoya) Proforma Adjusted Cash Usage (including Q2’25 pre-acq. for Akoya) (23%)34% $4.0 $12.4 Q2'26 Q2'25
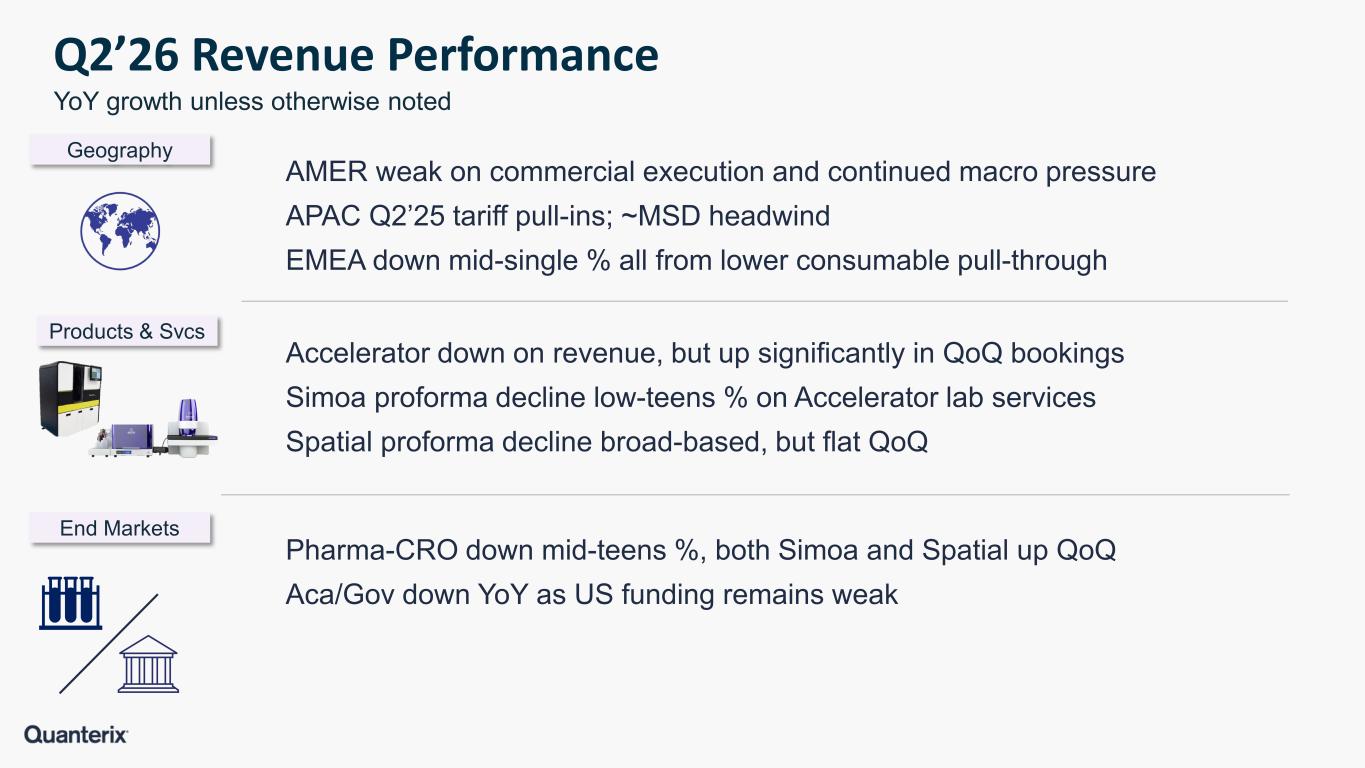
Q2’26 Revenue Performance AMER weak on commercial execution and continued macro pressure APAC Q2’25 tariff pull-ins; ~MSD headwind EMEA down mid-single % all from lower consumable pull-through Accelerator down on revenue, but up significantly in QoQ bookings Simoa proforma decline low-teens % on Accelerator lab services Spatial proforma decline broad-based, but flat QoQ Pharma-CRO down mid-teens %, both Simoa and Spatial up QoQ Aca/Gov down YoY as US funding remains weak Products & Svcs Geography End Markets YoY growth unless otherwise noted
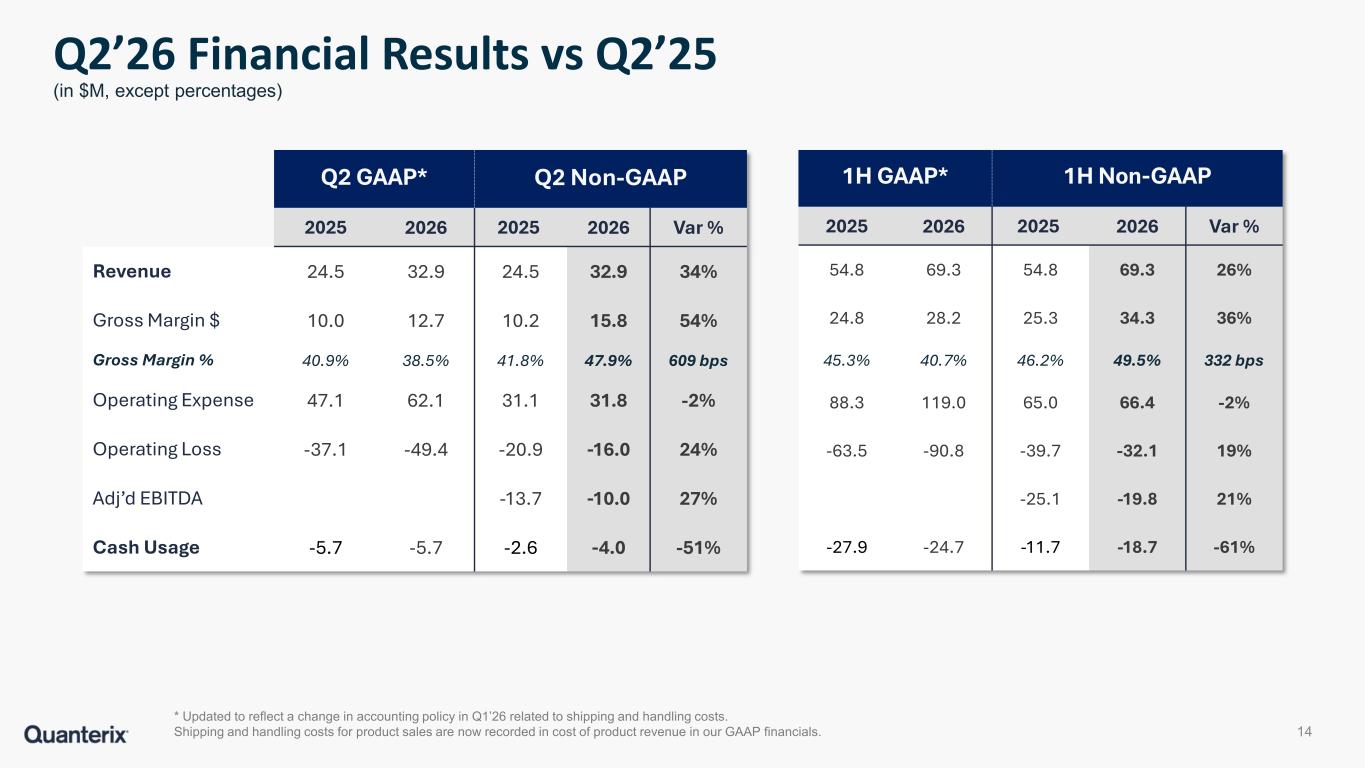
Q2 GAAP* Q2 Non-GAAP 2025 2026 2025 2026 Var % Revenue 24.5 32.9 24.5 32.9 34% Gross Margin $ 10.0 12.7 10.2 15.8 54% Gross Margin % 40.9% 38.5% 41.8% 47.9% 609 bps Operating Expense 47.1 62.1 31.1 31.8 -2% Operating Loss -37.1 -49.4 -20.9 -16.0 24% Adj’d EBITDA -13.7 -10.0 27% Cash Usage -5.7 -5.7 -2.6 -4.0 -51% * Updated to reflect a change in accounting policy in Q1’26 related to shipping and handling costs. Shipping and handling costs for product sales are now recorded in cost of product revenue in our GAAP financials. Q2’26 Financial Results vs Q2’25 (in $M, except percentages) 14 1H GAAP* 1H Non-GAAP 2025 2026 2025 2026 Var % 54.8 69.3 54.8 69.3 26% 24.8 28.2 25.3 34.3 36% 45.3% 40.7% 46.2% 49.5% 332 bps 88.3 119.0 65.0 66.4 -2% -63.5 -90.8 -39.7 -32.1 19% -25.1 -19.8 21% -27.9 -24.7 -11.7 -18.7 -61%
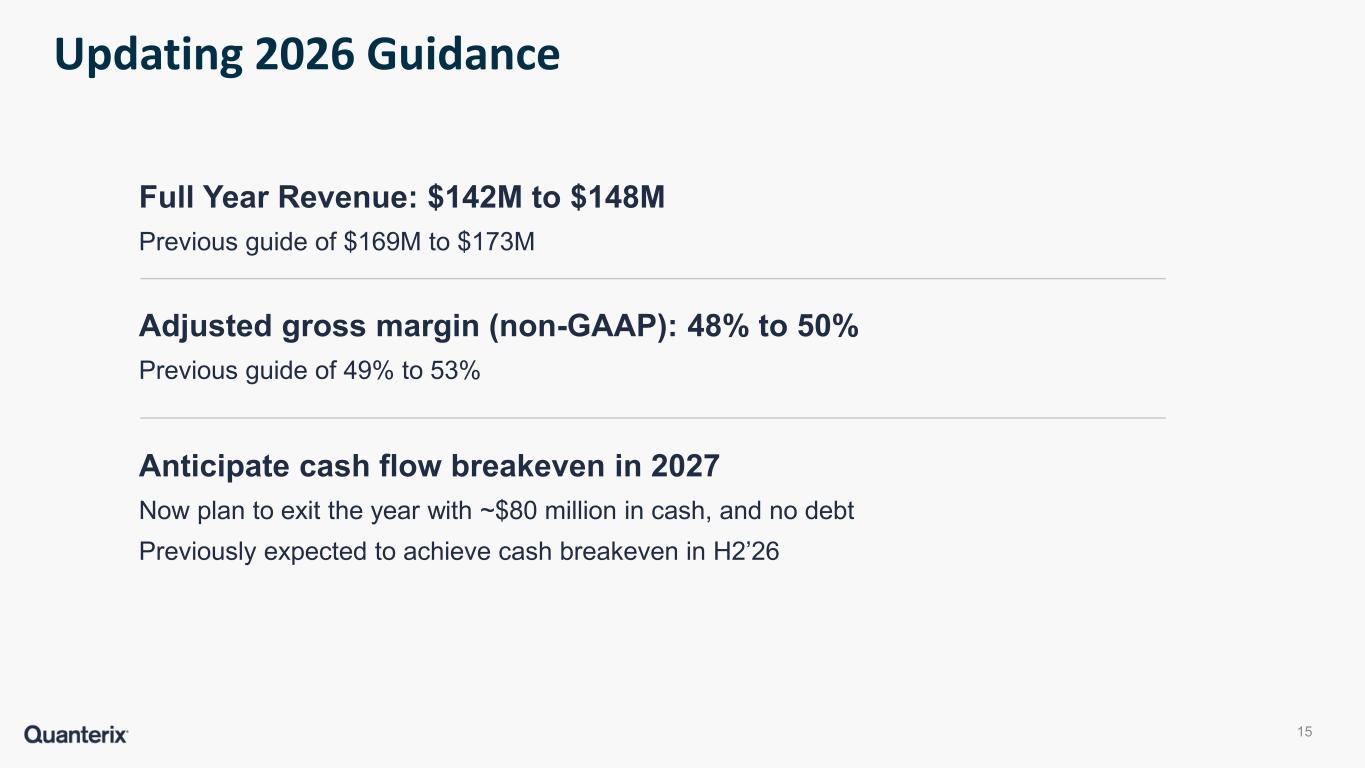
Full Year Revenue: $142M to $148M Previous guide of $169M to $173M Adjusted gross margin (non-GAAP): 48% to 50% Previous guide of 49% to 53% Anticipate cash flow breakeven in 2027 Now plan to exit the year with ~$80 million in cash, and no debt Previously expected to achieve cash breakeven in H2’26 Updating 2026 Guidance 15

Appendix
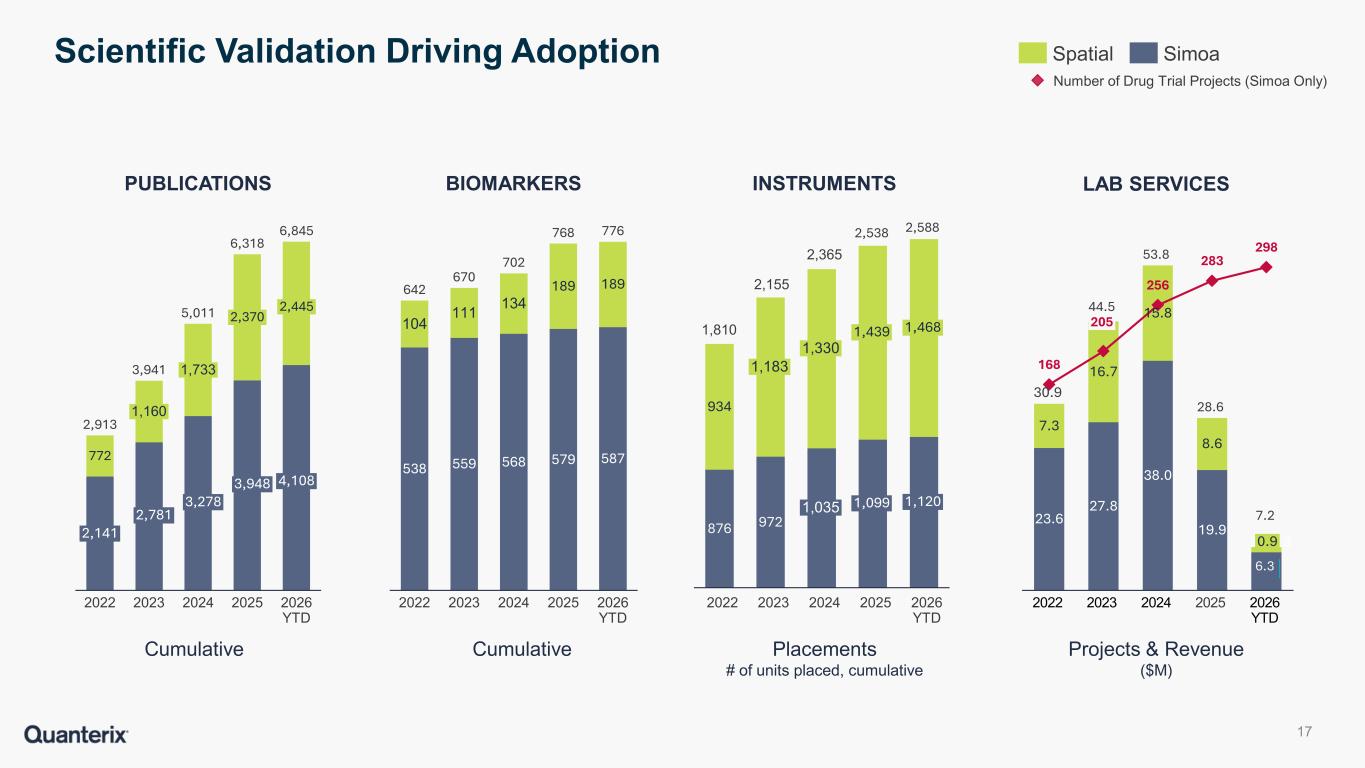
Spatial Simoa Number of Drug Trial Projects (Simoa Only) PUBLICATIONS BIOMARKERS INSTRUMENTS LAB SERVICES CumulativeCumulative Projects & Revenue ($M) Placements # of units placed, cumulative Scientific Validation Driving Adoption 17 772 2,141 2022 1,160 2023 1,733 2024 2,370 2025 2,445 4,108 2026 YTD 2,913 3,941 5,011 6,318 6,845 538 559 568 579 587 104 111 134 189 189 2022 2023 2024 2025 2026 YTD 642 670 702 768 776 2022 2023 2024 2025 2026 YTD 23.6 27.8 38.0 19.9 6.3 7.3 16.7 15.8 8.6 168 256 283 298 2022 205 2023 2024 2025 0.9 2026 YTD 30.9 44.5 53.8 28.6 6.3 2,781 3,278 3,948 876 972 934 1,183 1,330 1,035 1,439 1,099 1,468 1,120 1,810 2,155 2,365 2,538 2,588 7.2
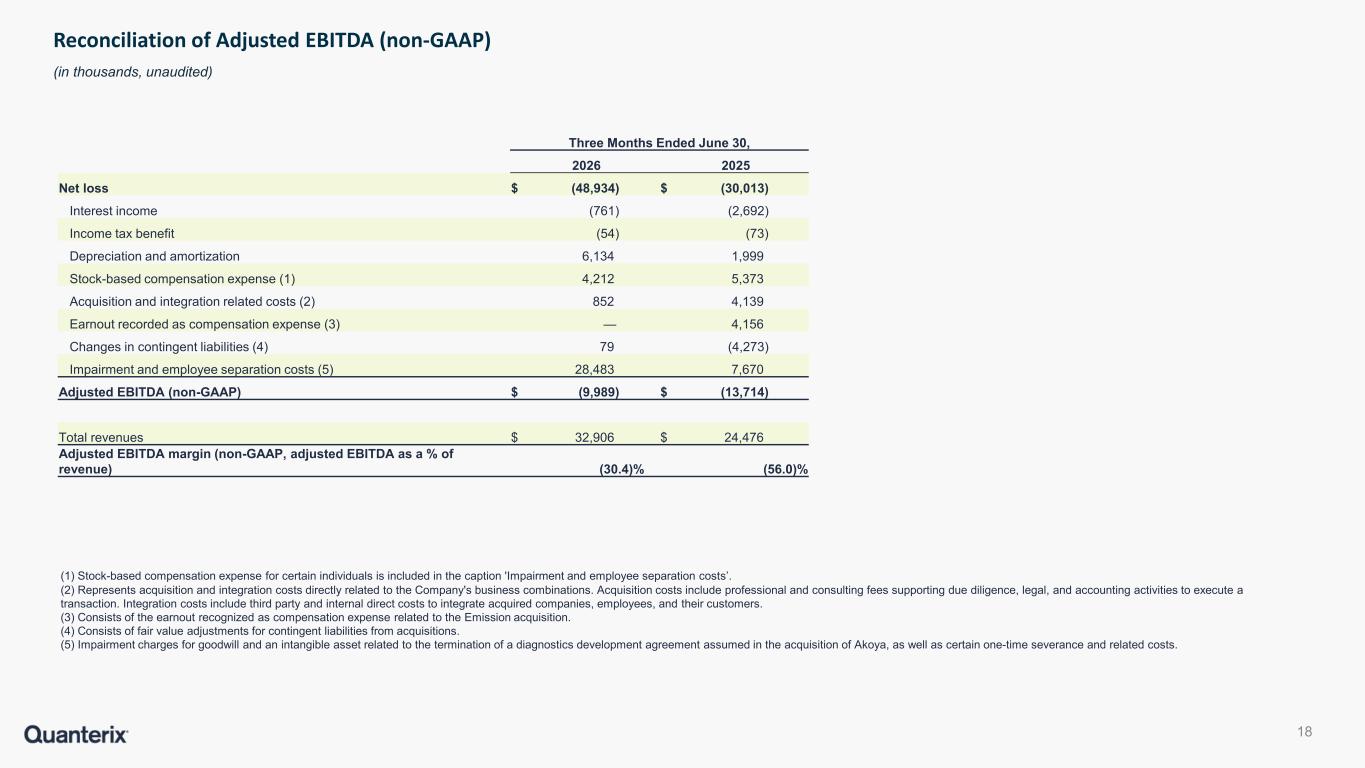
(1) Stock-based compensation expense for certain individuals is included in the caption 'Impairment and employee separation costs’. (2) Represents acquisition and integration costs directly related to the Company's business combinations. Acquisition costs include professional and consulting fees supporting due diligence, legal, and accounting activities to execute a transaction. Integration costs include third party and internal direct costs to integrate acquired companies, employees, and their customers. (3) Consists of the earnout recognized as compensation expense related to the Emission acquisition. (4) Consists of fair value adjustments for contingent liabilities from acquisitions. (5) Impairment charges for goodwill and an intangible asset related to the termination of a diagnostics development agreement assumed in the acquisition of Akoya, as well as certain one-time severance and related costs. Reconciliation of Adjusted EBITDA (non-GAAP) (in thousands, unaudited) 18 Three Months Ended June 30, 2026 2025 Net loss $ (48,934) $ (30,013) Interest income (761) (2,692) Income tax benefit (54) (73) Depreciation and amortization 6,134 1,999 Stock-based compensation expense (1) 4,212 5,373 Acquisition and integration related costs (2) 852 4,139 Earnout recorded as compensation expense (3) — 4,156 Changes in contingent liabilities (4) 79 (4,273) Impairment and employee separation costs (5) 28,483 7,670 Adjusted EBITDA (non-GAAP) $ (9,989) $ (13,714) Total revenues $ 32,906 $ 24,476 Adjusted EBITDA margin (non-GAAP, adjusted EBITDA as a % of revenue) (30.4)% (56.0)%
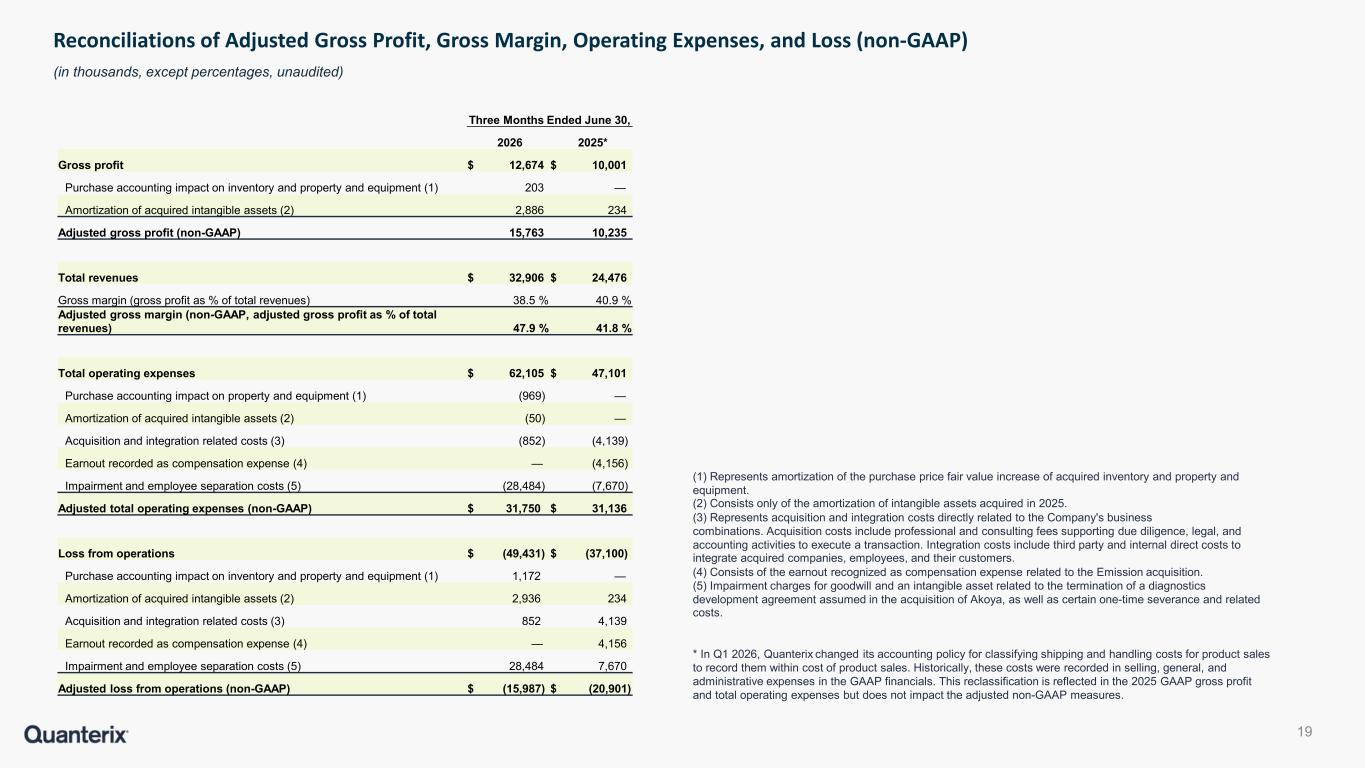
(1) Represents amortization of the purchase price fair value increase of acquired inventory and property and equipment. (2) Consists only of the amortization of intangible assets acquired in 2025. (3) Represents acquisition and integration costs directly related to the Company's business combinations. Acquisition costs include professional and consulting fees supporting due diligence, legal, and accounting activities to execute a transaction. Integration costs include third party and internal direct costs to integrate acquired companies, employees, and their customers. (4) Consists of the earnout recognized as compensation expense related to the Emission acquisition. (5) Impairment charges for goodwill and an intangible asset related to the termination of a diagnostics development agreement assumed in the acquisition of Akoya, as well as certain one-time severance and related costs. * In Q1 2026, Quanterix changed its accounting policy for classifying shipping and handling costs for product sales to record them within cost of product sales. Historically, these costs were recorded in selling, general, and administrative expenses in the GAAP financials. This reclassification is reflected in the 2025 GAAP gross profit and total operating expenses but does not impact the adjusted non-GAAP measures. Reconciliations of Adjusted Gross Profit, Gross Margin, Operating Expenses, and Loss (non-GAAP) (in thousands, except percentages, unaudited) 19 Three Months Ended June 30, 2026 2025* Gross profit $ 12,674 $ 10,001 Purchase accounting impact on inventory and property and equipment (1) 203 — Amortization of acquired intangible assets (2) 2,886 234 Adjusted gross profit (non-GAAP) 15,763 10,235 Total revenues $ 32,906 $ 24,476 Gross margin (gross profit as % of total revenues) 38.5 % 40.9 % Adjusted gross margin (non-GAAP, adjusted gross profit as % of total revenues) 47.9 % 41.8 % Total operating expenses $ 62,105 $ 47,101 Purchase accounting impact on property and equipment (1) (969) — Amortization of acquired intangible assets (2) (50) — Acquisition and integration related costs (3) (852) (4,139) Earnout recorded as compensation expense (4) — (4,156) Impairment and employee separation costs (5) (28,484) (7,670) Adjusted total operating expenses (non-GAAP) $ 31,750 $ 31,136 Loss from operations $ (49,431) $ (37,100) Purchase accounting impact on inventory and property and equipment (1) 1,172 — Amortization of acquired intangible assets (2) 2,936 234 Acquisition and integration related costs (3) 852 4,139 Earnout recorded as compensation expense (4) — 4,156 Impairment and employee separation costs (5) 28,484 7,670 Adjusted loss from operations (non-GAAP) $ (15,987) $ (20,901)
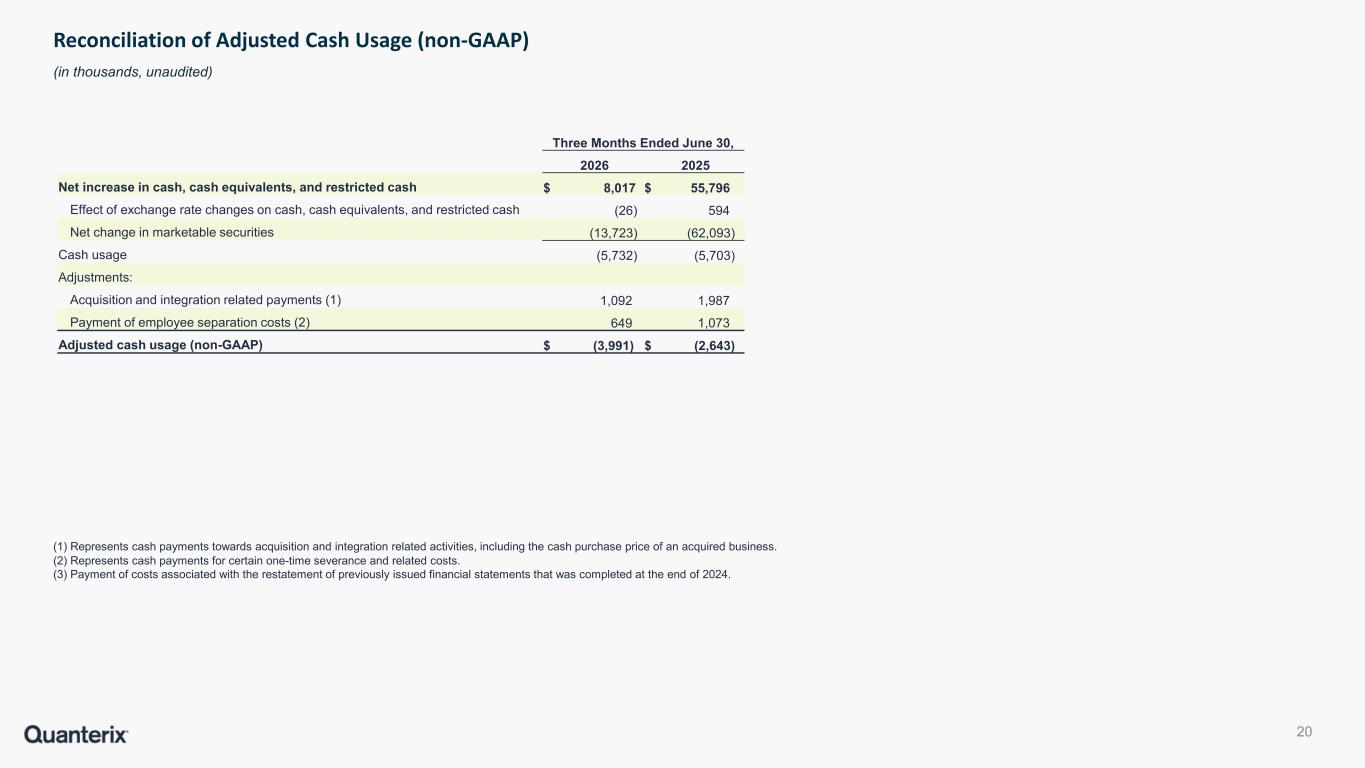
(1) Represents cash payments towards acquisition and integration related activities, including the cash purchase price of an acquired business. (2) Represents cash payments for certain one-time severance and related costs. (3) Payment of costs associated with the restatement of previously issued financial statements that was completed at the end of 2024. Reconciliation of Adjusted Cash Usage (non-GAAP) (in thousands, unaudited) 20 Three Months Ended June 30, 2026 2025 Net increase in cash, cash equivalents, and restricted cash $ 8,017 $ 55,796 Effect of exchange rate changes on cash, cash equivalents, and restricted cash (26) 594 Net change in marketable securities (13,723) (62,093) Cash usage (5,732) (5,703) Adjustments: Acquisition and integration related payments (1) 1,092 1,987 Payment of employee separation costs (2) 649 1,073 Adjusted cash usage (non-GAAP) $ (3,991) $ (2,643)

Contact Us General inquiries 900 Middlesex Turnpike, Billerica, MA 01821 USA 617.301.9400 info@quanterix.com www.quanterix.com