Shareholder Report
May 31, 2026
USD ($)
Holding
| [1] | Annualized |
| [2] | Annualized |
| [3] | Annualized |
| [4] | Annualized |
| [5] | Annualized |
| [6] | Annualized |
| [7] | Annualized |
Shareholder Report |
6 Months Ended | |||||||||||||||||||||||||||||||||||||||||||||||||||||||||||||
|---|---|---|---|---|---|---|---|---|---|---|---|---|---|---|---|---|---|---|---|---|---|---|---|---|---|---|---|---|---|---|---|---|---|---|---|---|---|---|---|---|---|---|---|---|---|---|---|---|---|---|---|---|---|---|---|---|---|---|---|---|---|---|
|
May 31, 2026
USD ($)
Holding
| ||||||||||||||||||||||||||||||||||||||||||||||||||||||||||||||
| Shareholder Report [Line Items] | ||||||||||||||||||||||||||||||||||||||||||||||||||||||||||||||
| Document Type | N-CSRS | |||||||||||||||||||||||||||||||||||||||||||||||||||||||||||||
| Amendment Flag | false | |||||||||||||||||||||||||||||||||||||||||||||||||||||||||||||
| Registrant Name | Copeland Trust | |||||||||||||||||||||||||||||||||||||||||||||||||||||||||||||
| Entity Central Index Key | 0001502745 | |||||||||||||||||||||||||||||||||||||||||||||||||||||||||||||
| Entity Investment Company Type | N-1A | |||||||||||||||||||||||||||||||||||||||||||||||||||||||||||||
| Document Period End Date | May 31, 2026 | |||||||||||||||||||||||||||||||||||||||||||||||||||||||||||||
| Shareholder Report Annual or Semi-Annual | Semi-Annual Shareholder Report | |||||||||||||||||||||||||||||||||||||||||||||||||||||||||||||
| C000233044 | ||||||||||||||||||||||||||||||||||||||||||||||||||||||||||||||
| Shareholder Report [Line Items] | ||||||||||||||||||||||||||||||||||||||||||||||||||||||||||||||
| Fund Name | Copeland International Small Cap Fund | |||||||||||||||||||||||||||||||||||||||||||||||||||||||||||||
| Class Name | Class A | |||||||||||||||||||||||||||||||||||||||||||||||||||||||||||||
| Trading Symbol | CISAX | |||||||||||||||||||||||||||||||||||||||||||||||||||||||||||||
| Additional Information Phone Number | 1-888-926-7352 | |||||||||||||||||||||||||||||||||||||||||||||||||||||||||||||
| Expenses [Text Block] | What were the Fund’s costs for the last six months?(based on a hypothetical $10,000 investment)
|
|||||||||||||||||||||||||||||||||||||||||||||||||||||||||||||
| Expenses Paid, Amount | $ 64 | |||||||||||||||||||||||||||||||||||||||||||||||||||||||||||||
| Expense Ratio, Percent | 1.23% | [1] | ||||||||||||||||||||||||||||||||||||||||||||||||||||||||||||
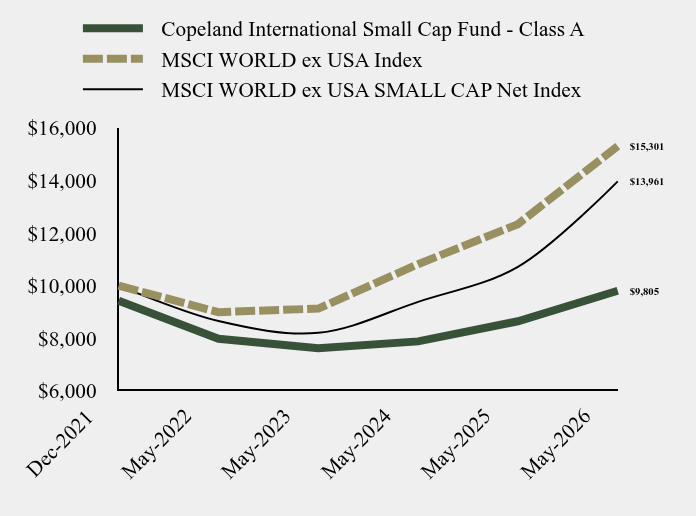
| Factors Affecting Performance [Text Block] | How did the Fund perform during the reporting period?During the six-month period ending May 31, 2026, Class A shares of the Fund delivered a return of 10.18%, trailing the 14.99% gain of the MSCI World ex USA Small Cap Net Index and the 12.66% return of the MSCI World ex USA Index. The period was marked by a preference for higher‑momentum, lower‑profitability stocks, which created a headwind for the Fund’s quality‑ and dividend‑growth‑oriented approach. Stock selection in the Industrials and Consumer Discretionary sectors contributed positively to performance, while selections in Technology and Materials detracted from performance.
Within Industrials, TFI International (TFI‑CA, 1.7% of holdings at period end) was a top contributor, delivering a 78% total return. TFI is a diversified trucking‑services provider operating across North America through less‑than‑truckload (LTL), truckload, and logistics segments. Shares re‑rated off cyclical trough levels as freight‑market data stabilized and investors began to price in a tighter supply/demand environment, supported by progress in turning around the U.S. LTL business and accretion from a recent acquisition. Despite earnings per share declining in 2025, the company raised its quarterly dividend, underscoring its focus on shareholder returns.
In Consumer Discretionary, Asics Corporation (7936‑JP, 1.7% of holdings at period end) delivered a 27% return. The Japanese athletic‑footwear company gained market share and secured a leading position in the U.S. running‑specialty channel, while growth in its Onitsuka Tiger brand supported earnings and dividend growth.
In Technology, Rakus Co., Ltd. (3923‑JP, 0.8% of holdings at period end), a Japan‑based SaaS provider of expense‑management and e‑invoicing software to small and medium‑sized enterprises, was a detractor with a −19% return. The company grew, with sales and profitability improving as it monetized prior marketing investments and enhanced cost controls, but sentiment toward SaaS companies weakened amid concerns about AI‑driven competition and the stock de‑rated. We are monitoring Rakus for evidence that it can sustain margin and revenue growth.
Within Materials, Westgold Resources Ltd. (WGX‑ASX, 1.3% of holdings at period end) generated a −10% return. The Australian gold miner is correlated with gold prices, which retreated as higher interest rates and a stronger U.S. dollar weighed on the metal and reduced investor appetite, leading to a larger decline in gold‑mining equities. We believe the company retains an earnings‑ and dividend‑growth outlook supported by rising production. |
|||||||||||||||||||||||||||||||||||||||||||||||||||||||||||||
| Line Graph [Table Text Block] |
|
|||||||||||||||||||||||||||||||||||||||||||||||||||||||||||||
| Average Annual Return [Table Text Block] |
|
|||||||||||||||||||||||||||||||||||||||||||||||||||||||||||||
| Performance Inception Date | Dec. 28, 2021 | |||||||||||||||||||||||||||||||||||||||||||||||||||||||||||||
| AssetsNet | $ 811,089 | |||||||||||||||||||||||||||||||||||||||||||||||||||||||||||||
| Holdings Count | Holding | 77 | |||||||||||||||||||||||||||||||||||||||||||||||||||||||||||||
| Advisory Fees Paid, Amount | $ 0 | |||||||||||||||||||||||||||||||||||||||||||||||||||||||||||||
| InvestmentCompanyPortfolioTurnover | 29.00% | |||||||||||||||||||||||||||||||||||||||||||||||||||||||||||||
| Additional Fund Statistics [Text Block] | Fund Statistics
|
|||||||||||||||||||||||||||||||||||||||||||||||||||||||||||||
| Holdings [Text Block] | Sector Weighting (% of net assets)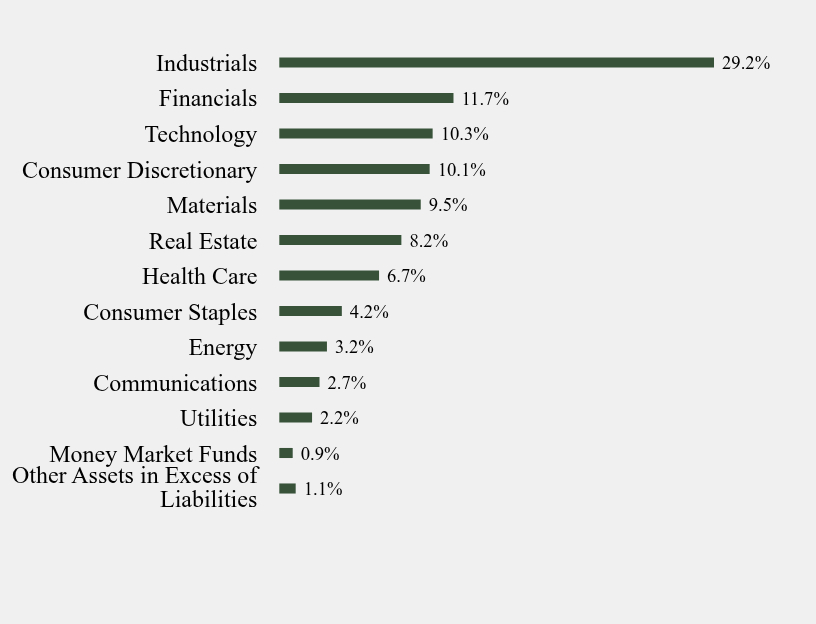
Asset Weighting (% of total investments)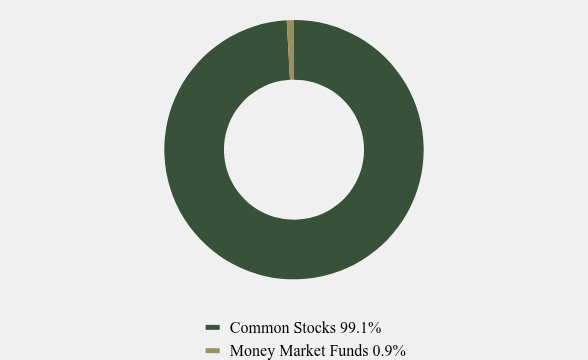
Country Weighting (% of net assets)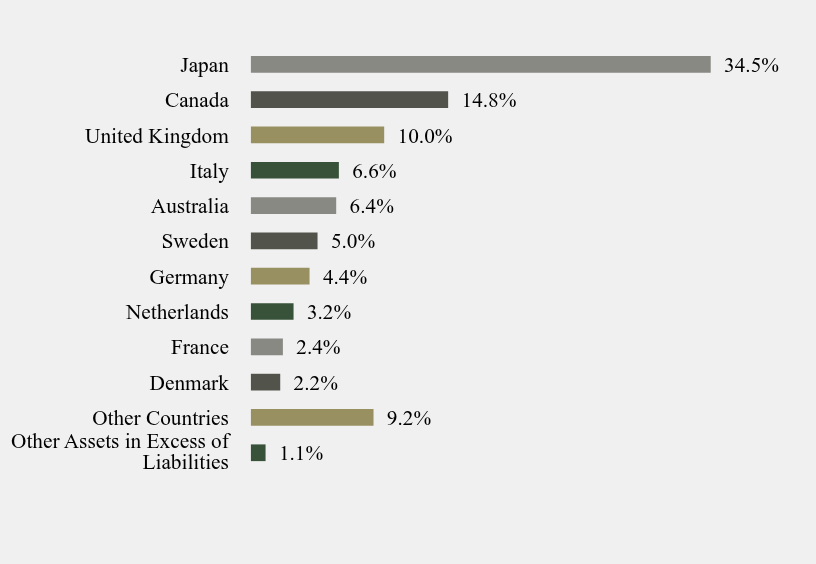
|
|||||||||||||||||||||||||||||||||||||||||||||||||||||||||||||
| Largest Holdings [Text Block] | Top 10 Holdings (% of net assets)
|
|||||||||||||||||||||||||||||||||||||||||||||||||||||||||||||
| Material Fund Change [Text Block] | Material Fund ChangesNo material changes occurred during the six months ended May 31, 2026. |
|||||||||||||||||||||||||||||||||||||||||||||||||||||||||||||
| C000233045 | ||||||||||||||||||||||||||||||||||||||||||||||||||||||||||||||
| Shareholder Report [Line Items] | ||||||||||||||||||||||||||||||||||||||||||||||||||||||||||||||
| Fund Name | Copeland International Small Cap Fund | |||||||||||||||||||||||||||||||||||||||||||||||||||||||||||||
| Class Name | Class I | |||||||||||||||||||||||||||||||||||||||||||||||||||||||||||||
| Trading Symbol | CSIIX | |||||||||||||||||||||||||||||||||||||||||||||||||||||||||||||
| Additional Information Phone Number | 1-888-926-7352 | |||||||||||||||||||||||||||||||||||||||||||||||||||||||||||||
| Expenses [Text Block] | What were the Fund’s costs for the last six months?(based on a hypothetical $10,000 investment)
|
|||||||||||||||||||||||||||||||||||||||||||||||||||||||||||||
| Expenses Paid, Amount | $ 51 | |||||||||||||||||||||||||||||||||||||||||||||||||||||||||||||
| Expense Ratio, Percent | 0.98% | [2] | ||||||||||||||||||||||||||||||||||||||||||||||||||||||||||||
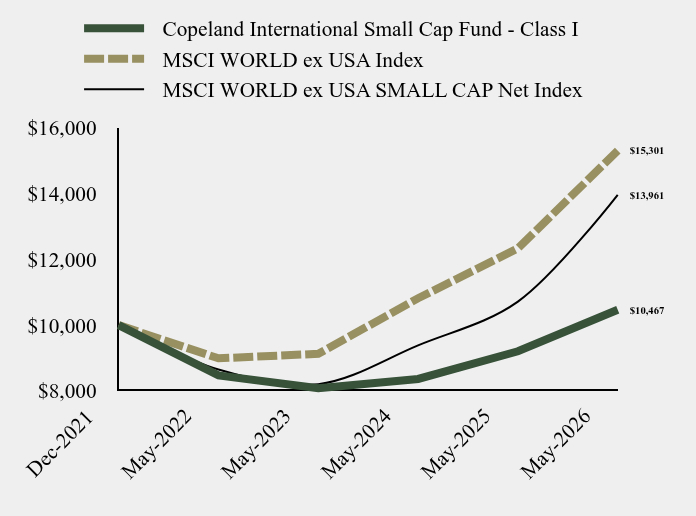
| Factors Affecting Performance [Text Block] | How did the Fund perform during the reporting period?During the six-month period ending May 31, 2026, Class I shares of the Fund delivered a return of 10.24%, trailing the 14.99% gain of the MSCI World ex USA Small Cap Net Index and the 12.66% return of the MSCI World ex USA Index. The period was marked by a preference for higher‑momentum, lower‑profitability stocks, which created a headwind for the Fund’s quality‑ and dividend‑growth‑oriented approach. Stock selection in the Industrials and Consumer Discretionary sectors contributed positively to performance, while selections in Technology and Materials detracted from performance.
Within Industrials, TFI International (TFI‑CA, 1.7% of holdings at period end) was a top contributor, delivering a 78% total return. TFI is a diversified trucking‑services provider operating across North America through less‑than‑truckload (LTL), truckload, and logistics segments. Shares re‑rated off cyclical trough levels as freight‑market data stabilized and investors began to price in a tighter supply/demand environment, supported by progress in turning around the U.S. LTL business and accretion from a recent acquisition. Despite earnings per share declining in 2025, the company raised its quarterly dividend, underscoring its focus on shareholder returns.
In Consumer Discretionary, Asics Corporation (7936‑JP, 1.7% of holdings at period end) delivered a 27% return. The Japanese athletic‑footwear company gained market share and secured a leading position in the U.S. running‑specialty channel, while growth in its Onitsuka Tiger brand supported earnings and dividend growth.
In Technology, Rakus Co., Ltd. (3923‑JP, 0.8% of holdings at period end), a Japan‑based SaaS provider of expense‑management and e‑invoicing software to small and medium‑sized enterprises, was a detractor with a −19% return. The company grew, with sales and profitability improving as it monetized prior marketing investments and enhanced cost controls, but sentiment toward SaaS companies weakened amid concerns about AI‑driven competition and the stock de‑rated. We are monitoring Rakus for evidence that it can sustain margin and revenue growth.
Within Materials, Westgold Resources Ltd. (WGX‑ASX, 1.3% of holdings at period end) generated a −10% return. The Australian gold miner is correlated with gold prices, which retreated as higher interest rates and a stronger U.S. dollar weighed on the metal and reduced investor appetite, leading to a larger decline in gold‑mining equities. We believe the company retains an earnings‑ and dividend‑growth outlook supported by rising production. |
|||||||||||||||||||||||||||||||||||||||||||||||||||||||||||||
| Line Graph [Table Text Block] |
|
|||||||||||||||||||||||||||||||||||||||||||||||||||||||||||||
| Average Annual Return [Table Text Block] |
|
|||||||||||||||||||||||||||||||||||||||||||||||||||||||||||||
| Performance Inception Date | Dec. 28, 2021 | |||||||||||||||||||||||||||||||||||||||||||||||||||||||||||||
| AssetsNet | $ 811,089 | |||||||||||||||||||||||||||||||||||||||||||||||||||||||||||||
| Holdings Count | Holding | 77 | |||||||||||||||||||||||||||||||||||||||||||||||||||||||||||||
| Advisory Fees Paid, Amount | $ 0 | |||||||||||||||||||||||||||||||||||||||||||||||||||||||||||||
| InvestmentCompanyPortfolioTurnover | 29.00% | |||||||||||||||||||||||||||||||||||||||||||||||||||||||||||||
| Additional Fund Statistics [Text Block] | Fund Statistics
|
|||||||||||||||||||||||||||||||||||||||||||||||||||||||||||||
| Holdings [Text Block] | Sector Weighting (% of net assets)
Asset Weighting (% of total investments)
Country Weighting (% of net assets)
|
|||||||||||||||||||||||||||||||||||||||||||||||||||||||||||||
| Largest Holdings [Text Block] | Top 10 Holdings (% of net assets)
|
|||||||||||||||||||||||||||||||||||||||||||||||||||||||||||||
| Material Fund Change [Text Block] | Material Fund ChangesNo material changes occurred during the six months ended May 31, 2026. |
|||||||||||||||||||||||||||||||||||||||||||||||||||||||||||||
| C000095114 | ||||||||||||||||||||||||||||||||||||||||||||||||||||||||||||||
| Shareholder Report [Line Items] | ||||||||||||||||||||||||||||||||||||||||||||||||||||||||||||||
| Fund Name | Copeland Dividend Growth Fund | |||||||||||||||||||||||||||||||||||||||||||||||||||||||||||||
| Class Name | Class A | |||||||||||||||||||||||||||||||||||||||||||||||||||||||||||||
| Trading Symbol | CDGRX | |||||||||||||||||||||||||||||||||||||||||||||||||||||||||||||
| Additional Information Phone Number | 1-888-926-7352 | |||||||||||||||||||||||||||||||||||||||||||||||||||||||||||||
| Expenses [Text Block] | What were the Fund’s costs for the last six months?(based on a hypothetical $10,000 investment)
|
|||||||||||||||||||||||||||||||||||||||||||||||||||||||||||||
| Expenses Paid, Amount | $ 61 | |||||||||||||||||||||||||||||||||||||||||||||||||||||||||||||
| Expense Ratio, Percent | 1.20% | [3] | ||||||||||||||||||||||||||||||||||||||||||||||||||||||||||||
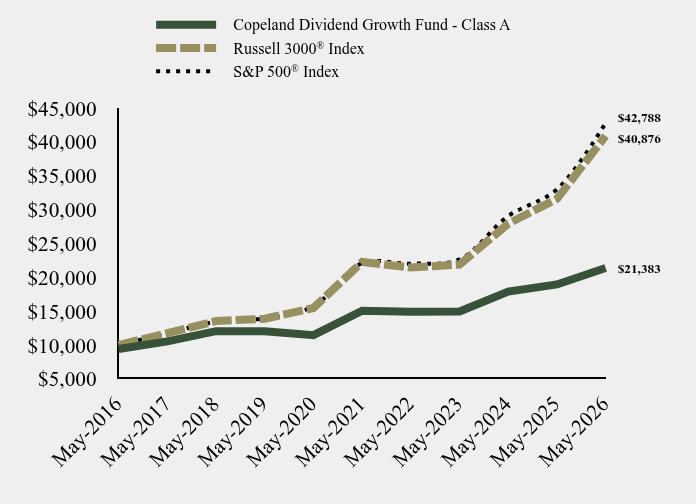
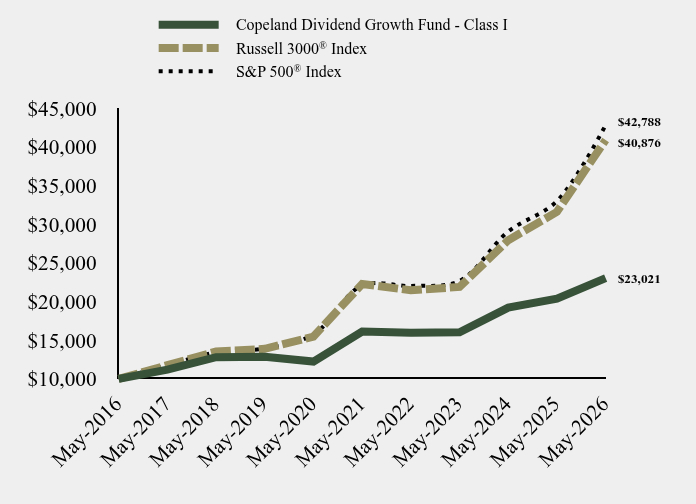
| Factors Affecting Performance [Text Block] | How did the Fund perform during the reporting period?During the six-month period ending May 31, 2026, Class A shares of the Fund rose 3.98% versus the 11.18% gain registered by the Russell 3000 Index and the 11.34% advance posted by the S&P 500 Index. Our performance shortfall relative to the benchmark was primarily attributable to an underweight position in the Technology sector versus the over 30% weight in the Russell 3000 Index to such sector. Exacerbating the situation was market exuberance around the more volatile equities within the technology sector. To wit, over fifty technology stocks rose in excess of 100% during the period, providing a challenging backdrop for the more staid dividend growth equities held in the Fund.
Our stock selection in the Consumer Staples sector bolstered Fund returns. At the individual stock level, wafer fabrication equipment supplier to the semiconductor industry, Lam Research (LRCX, 2.6% of holdings at period end), soared 104% during the period. AI-driven demand fueled revenue and earnings growth of 26% and 47%, respectively, over the past year. Industrials sector constituent Vertiv (VRT, 2.1% of holdings at period end), leapt 79% during the period. The preeminent manufacturer of power management, thermal management, and IT systems for the burgeoning data center industry, continues to post growth.
Our stock selection in the Technology sector was a drag on Fund returns. Reflecting our relative underperformance, Fund holding Intuit (INTU, 1.1% of holdings at period end), was the worst performer in the Fund, falling 47% during the period. The provider of small business and tax preparation software has been punished by fears that artificial intelligence (AI) may erode the company’s pricing power and relevance. A recent deceleration in its revenue growth to 11%, from the traditional 15 to 20%, has only served to exacerbate concerns.
Consumer Discretionary sector constituent Wingstop (WING, 0.7% of holdings at period end) dipped 38% during the period. The chicken wings-focused restaurant chain registered a decline in same-store sales of over 8% during the first quarter of 2026. While the company expects future results to improve, it still forecasted a modest contraction in the full-year comparison. Ultimately, an elevated forward earnings multiple of over fifty times left the restaurant franchise vulnerable to the multiple contraction witnessed during the period. |
|||||||||||||||||||||||||||||||||||||||||||||||||||||||||||||
| Line Graph [Table Text Block] |
|
|||||||||||||||||||||||||||||||||||||||||||||||||||||||||||||
| Average Annual Return [Table Text Block] |
|
|||||||||||||||||||||||||||||||||||||||||||||||||||||||||||||
| AssetsNet | $ 25,777,257 | |||||||||||||||||||||||||||||||||||||||||||||||||||||||||||||
| Holdings Count | Holding | 65 | |||||||||||||||||||||||||||||||||||||||||||||||||||||||||||||
| Advisory Fees Paid, Amount | $ 0 | |||||||||||||||||||||||||||||||||||||||||||||||||||||||||||||
| InvestmentCompanyPortfolioTurnover | 38.00% | |||||||||||||||||||||||||||||||||||||||||||||||||||||||||||||
| Additional Fund Statistics [Text Block] | Fund Statistics
|
|||||||||||||||||||||||||||||||||||||||||||||||||||||||||||||
| Holdings [Text Block] | Asset Weighting (% of total investments)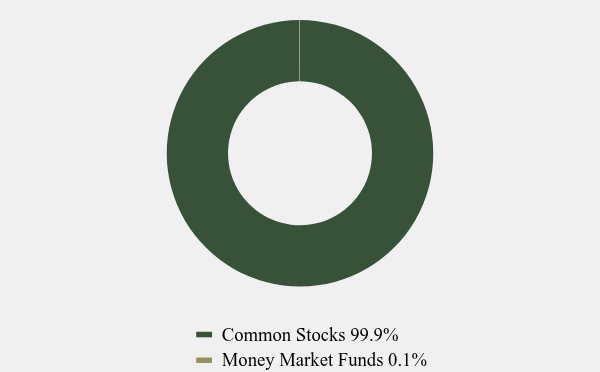
Sector Weighting (% of net assets)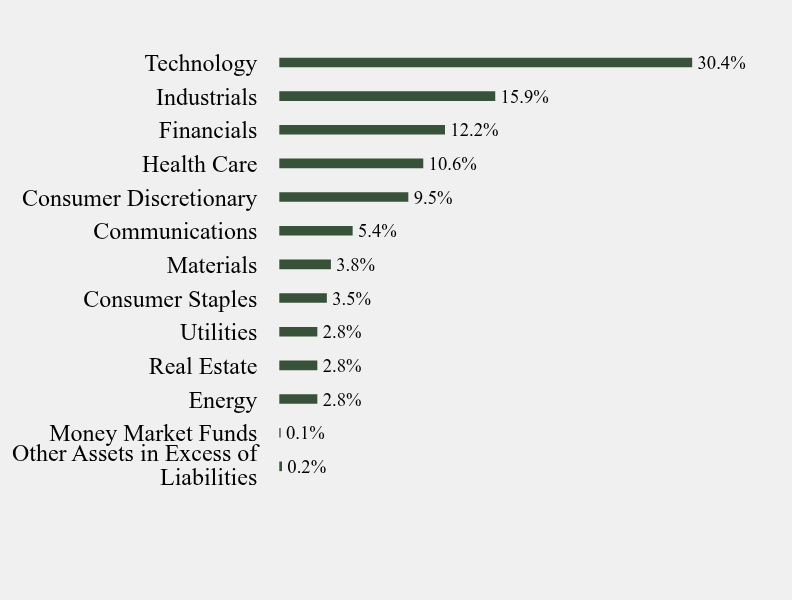
|
|||||||||||||||||||||||||||||||||||||||||||||||||||||||||||||
| Largest Holdings [Text Block] | Top 10 Holdings (% of net assets)
|
|||||||||||||||||||||||||||||||||||||||||||||||||||||||||||||
| Material Fund Change [Text Block] | Material Fund ChangesNo material changes occurred during the six months ended May 31, 2026. |
|||||||||||||||||||||||||||||||||||||||||||||||||||||||||||||
| C000109647 | ||||||||||||||||||||||||||||||||||||||||||||||||||||||||||||||
| Shareholder Report [Line Items] | ||||||||||||||||||||||||||||||||||||||||||||||||||||||||||||||
| Fund Name | Copeland Dividend Growth Fund | |||||||||||||||||||||||||||||||||||||||||||||||||||||||||||||
| Class Name | Class C | |||||||||||||||||||||||||||||||||||||||||||||||||||||||||||||
| Trading Symbol | CDCRX | |||||||||||||||||||||||||||||||||||||||||||||||||||||||||||||
| Additional Information Phone Number | 1-888-926-7352 | |||||||||||||||||||||||||||||||||||||||||||||||||||||||||||||
| Expenses [Text Block] | What were the Fund’s costs for the last six months?(based on a hypothetical $10,000 investment)
|
|||||||||||||||||||||||||||||||||||||||||||||||||||||||||||||
| Expenses Paid, Amount | $ 99 | |||||||||||||||||||||||||||||||||||||||||||||||||||||||||||||
| Expense Ratio, Percent | 1.95% | [4] | ||||||||||||||||||||||||||||||||||||||||||||||||||||||||||||
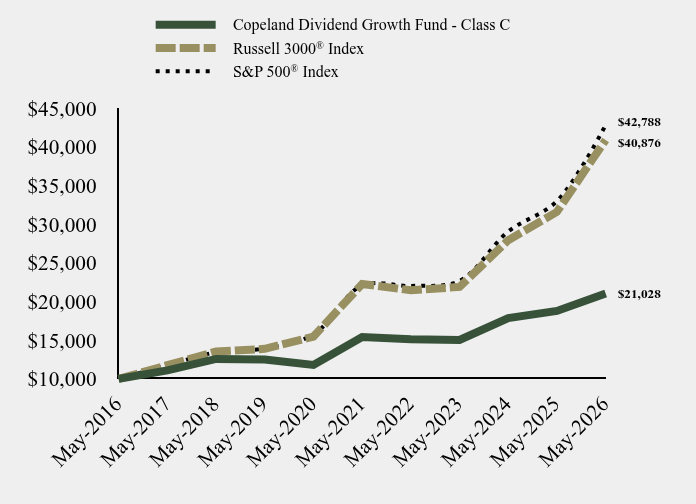
| Factors Affecting Performance [Text Block] | How did the Fund perform during the reporting period?During the six-month period ending May 31, 2026, Class C shares of the Fund rose 3.59% versus the 11.18% gain registered by the Russell 3000 Index and the 11.34% advance posted by the S&P 500 Index. Our performance shortfall relative to the benchmark was primarily attributable to an underweight position in the Technology sector versus the over 30% weight in the Russell 3000 Index to such sector. Exacerbating the situation was market exuberance around the more volatile equities within the technology sector. To wit, over fifty technology stocks rose in excess of 100% during the period, providing a challenging backdrop for the more staid dividend growth equities held in the Fund.
Our stock selection in the Consumer Staples sector bolstered Fund returns. At the individual stock level, wafer fabrication equipment supplier to the semiconductor industry, Lam Research (LRCX, 2.6% of holdings at period end), soared 104% during the period. AI-driven demand fueled revenue and earnings growth of 26% and 47%, respectively, over the past year. Industrials sector constituent Vertiv (VRT, 2.1% of holdings at period end), leapt 79% during the period. The preeminent manufacturer of power management, thermal management, and IT systems for the burgeoning data center industry, continues to post growth.
Our stock selection in the Technology sector was a drag on Fund returns. Reflecting our relative underperformance, Fund holding Intuit (INTU, 1.1% of holdings at period end), was the worst performer in the Fund, falling 47% during the period. The provider of small business and tax preparation software has been punished by fears that artificial intelligence (AI) may erode the company’s pricing power and relevance. A recent deceleration in its revenue growth to 11%, from the traditional 15 to 20%, has only served to exacerbate concerns.
Consumer Discretionary sector constituent Wingstop (WING, 0.7% of holdings at period end) dipped 38% during the period. The chicken wings-focused restaurant chain registered a decline in same-store sales of over 8% during the first quarter of 2026. While the company expects future results to improve, it still forecasted a modest contraction in the full-year comparison. Ultimately, an elevated forward earnings multiple of over fifty times left the restaurant franchise vulnerable to the multiple contraction witnessed during the period. |
|||||||||||||||||||||||||||||||||||||||||||||||||||||||||||||
| Line Graph [Table Text Block] |
|
|||||||||||||||||||||||||||||||||||||||||||||||||||||||||||||
| Average Annual Return [Table Text Block] |
|
|||||||||||||||||||||||||||||||||||||||||||||||||||||||||||||
| AssetsNet | $ 25,777,257 | |||||||||||||||||||||||||||||||||||||||||||||||||||||||||||||
| Holdings Count | Holding | 65 | |||||||||||||||||||||||||||||||||||||||||||||||||||||||||||||
| Advisory Fees Paid, Amount | $ 0 | |||||||||||||||||||||||||||||||||||||||||||||||||||||||||||||
| InvestmentCompanyPortfolioTurnover | 38.00% | |||||||||||||||||||||||||||||||||||||||||||||||||||||||||||||
| Additional Fund Statistics [Text Block] | Fund Statistics
|
|||||||||||||||||||||||||||||||||||||||||||||||||||||||||||||
| Holdings [Text Block] | Asset Weighting (% of total investments)
Sector Weighting (% of net assets)
|
|||||||||||||||||||||||||||||||||||||||||||||||||||||||||||||
| Largest Holdings [Text Block] | Top 10 Holdings (% of net assets)
|
|||||||||||||||||||||||||||||||||||||||||||||||||||||||||||||
| Material Fund Change [Text Block] | Material Fund ChangesNo material changes occurred during the six months ended May 31, 2026. |
|||||||||||||||||||||||||||||||||||||||||||||||||||||||||||||
| C000124573 | ||||||||||||||||||||||||||||||||||||||||||||||||||||||||||||||
| Shareholder Report [Line Items] | ||||||||||||||||||||||||||||||||||||||||||||||||||||||||||||||
| Fund Name | Copeland Dividend Growth Fund | |||||||||||||||||||||||||||||||||||||||||||||||||||||||||||||
| Class Name | Class I | |||||||||||||||||||||||||||||||||||||||||||||||||||||||||||||
| Trading Symbol | CDIVX | |||||||||||||||||||||||||||||||||||||||||||||||||||||||||||||
| Additional Information Phone Number | 1-888-926-7352 | |||||||||||||||||||||||||||||||||||||||||||||||||||||||||||||
| Expenses [Text Block] | What were the Fund’s costs for the last six months?(based on a hypothetical $10,000 investment)
|
|||||||||||||||||||||||||||||||||||||||||||||||||||||||||||||
| Expenses Paid, Amount | $ 53 | |||||||||||||||||||||||||||||||||||||||||||||||||||||||||||||
| Expense Ratio, Percent | 1.05% | [5] | ||||||||||||||||||||||||||||||||||||||||||||||||||||||||||||
| Factors Affecting Performance [Text Block] | How did the Fund perform during the reporting period?During the six-month period ending May 31, 2026, Class I shares of the Fund rose 4.05% versus the 11.18% gain registered by the Russell 3000 Index and the 11.34% advance posted by the S&P 500 Index. Our performance shortfall relative to the benchmark was primarily attributable to an underweight position in the Technology sector versus the over 30% weight in the Russell 3000 Index to such sector. Exacerbating the situation was market exuberance around the more volatile equities within the technology sector. To wit, over fifty technology stocks rose in excess of 100% during the period, providing a challenging backdrop for the more staid dividend growth equities held in the Fund.
Our stock selection in the Consumer Staples sector bolstered Fund returns. At the individual stock level, wafer fabrication equipment supplier to the semiconductor industry, Lam Research (LRCX, 2.6% of holdings at period end), soared 104% during the period. AI-driven demand fueled revenue and earnings growth of 26% and 47%, respectively, over the past year. Industrials sector constituent Vertiv (VRT, 2.1% of holdings at period end), leapt 79% during the period. The preeminent manufacturer of power management, thermal management, and IT systems for the burgeoning data center industry, continues to post growth.
Our stock selection in the Technology sector was a drag on Fund returns. Reflecting our relative underperformance, Fund holding Intuit (INTU, 1.1% of holdings at period end), was the worst performer in the Fund, falling 47% during the period. The provider of small business and tax preparation software has been punished by fears that artificial intelligence (AI) may erode the company’s pricing power and relevance. A recent deceleration in its revenue growth to 11%, from the traditional 15 to 20%, has only served to exacerbate concerns.
Consumer Discretionary sector constituent Wingstop (WING, 0.7% of holdings at period end) dipped 38% during the period. The chicken wings-focused restaurant chain registered a decline in same-store sales of over 8% during the first quarter of 2026. While the company expects future results to improve, it still forecasted a modest contraction in the full-year comparison. Ultimately, an elevated forward earnings multiple of over fifty times left the restaurant franchise vulnerable to the multiple contraction witnessed during the period. |
|||||||||||||||||||||||||||||||||||||||||||||||||||||||||||||
| Line Graph [Table Text Block] |
|
|||||||||||||||||||||||||||||||||||||||||||||||||||||||||||||
| Average Annual Return [Table Text Block] |
|
|||||||||||||||||||||||||||||||||||||||||||||||||||||||||||||
| AssetsNet | $ 25,777,257 | |||||||||||||||||||||||||||||||||||||||||||||||||||||||||||||
| Holdings Count | Holding | 65 | |||||||||||||||||||||||||||||||||||||||||||||||||||||||||||||
| Advisory Fees Paid, Amount | $ 0 | |||||||||||||||||||||||||||||||||||||||||||||||||||||||||||||
| InvestmentCompanyPortfolioTurnover | 38.00% | |||||||||||||||||||||||||||||||||||||||||||||||||||||||||||||
| Additional Fund Statistics [Text Block] | Fund Statistics
|
|||||||||||||||||||||||||||||||||||||||||||||||||||||||||||||
| Holdings [Text Block] | Asset Weighting (% of total investments)
Sector Weighting (% of net assets)
|
|||||||||||||||||||||||||||||||||||||||||||||||||||||||||||||
| Largest Holdings [Text Block] | Top 10 Holdings (% of net assets)
|
|||||||||||||||||||||||||||||||||||||||||||||||||||||||||||||
| Material Fund Change [Text Block] | Material Fund ChangesNo material changes occurred during the six months ended May 31, 2026. |
|||||||||||||||||||||||||||||||||||||||||||||||||||||||||||||
| C000209896 | ||||||||||||||||||||||||||||||||||||||||||||||||||||||||||||||
| Shareholder Report [Line Items] | ||||||||||||||||||||||||||||||||||||||||||||||||||||||||||||||
| Fund Name | Copeland SMID Cap Dividend Growth Fund | |||||||||||||||||||||||||||||||||||||||||||||||||||||||||||||
| Class Name | Class A | |||||||||||||||||||||||||||||||||||||||||||||||||||||||||||||
| Trading Symbol | CSDGX | |||||||||||||||||||||||||||||||||||||||||||||||||||||||||||||
| Additional Information Phone Number | 1-888-926-7352 | |||||||||||||||||||||||||||||||||||||||||||||||||||||||||||||
| Expenses [Text Block] | What were the Fund’s costs for the last six months?(based on a hypothetical $10,000 investment)
|
|||||||||||||||||||||||||||||||||||||||||||||||||||||||||||||
| Expenses Paid, Amount | $ 63 | |||||||||||||||||||||||||||||||||||||||||||||||||||||||||||||
| Expense Ratio, Percent | 1.20% | [6] | ||||||||||||||||||||||||||||||||||||||||||||||||||||||||||||
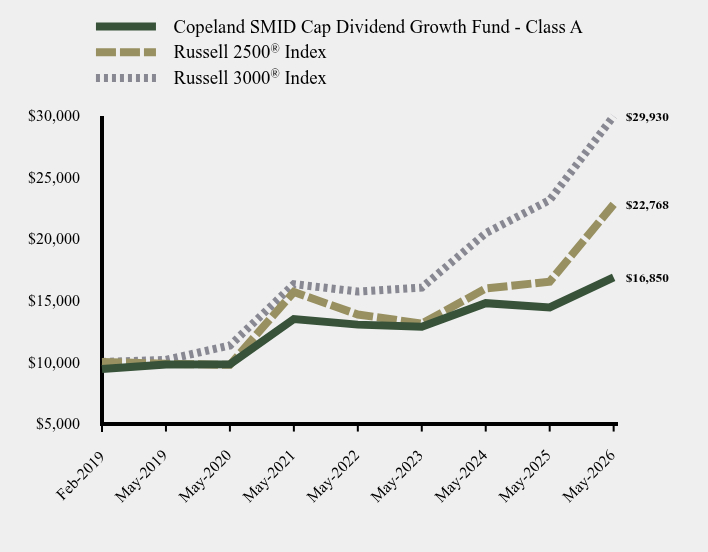
| Factors Affecting Performance [Text Block] | How did the Fund perform during the reporting period?During the six-month period ending May 31, 2026, Class A shares of the Fund rose 9.76% versus the 18.46% gain registered by the Russell 2500 Index and the 11.18% advance posted by the Russell 3000 Index. Our performance shortfall relative to the Russell 2500 Index (commonly referred to as "SMID cap") benchmark was primarily attributable to the outperformance of lower quality, lower profitability and higher volatility stocks during a period of market exuberance in the technology sector, particularly for stocks with exposure to the artificial intelligence (AI) theme. During the period, dozens of technology stocks rose in excess of 100%, providing a challenging backdrop for the steady dividend growth equities held in the Fund.
Our significant exposure to the Technology sector contributed most significantly to returns, with the Fund’s average stock in the sector rising 53%. Kulicke & Soffa Industries (KLIC, 2.4% of holdings at period end) led semiconductor holdings higher as sales and earnings inflected upward when customers ordered advanced packaging tools, and investor interest increased as the company launched new tools to support high-growth memory and AI-related companies.
Stock selection was most favorable in the Staples sector, led by a strong rise in the shares of PriceSmart, Inc. (PSMT, 2.1% of holdings at period end), a warehouse club operator in the Caribbean and Central America. Investors bid up the shares as earnings growth accelerated from mid-single-digit to double-digit rates, supported by improved execution and consistent same-store sales growth near 8% over the past year.
Meanwhile, despite strong absolute returns in the Technology sector, stock selection was a headwind to performance. Universal Display Corporation (OLED, 1.2% of holdings at period end) declined as the maker of light emitting diode technologies faced a weak consumer electronics environment. Sales of cell phones by major customers that utilize OLED screens were curtailed as rising memory chip prices pushed up device costs.
Stock selection was also a headwind in the Consumer Discretionary sector as higher oil prices and interest rates slowed sales for restaurants, consumer goods and housing-related businesses. Same-store sales at chicken wings-focused restaurant Wingstop (WING, 1.0% of holdings at period end) slowed materially even as new units were opened at a high-teens rate, though we believe sales to stabilize and recover as energy prices normalize and consumer health improves. |
|||||||||||||||||||||||||||||||||||||||||||||||||||||||||||||
| Line Graph [Table Text Block] |
|
|||||||||||||||||||||||||||||||||||||||||||||||||||||||||||||
| Average Annual Return [Table Text Block] |
|
|||||||||||||||||||||||||||||||||||||||||||||||||||||||||||||
| Performance Inception Date | Feb. 11, 2019 | |||||||||||||||||||||||||||||||||||||||||||||||||||||||||||||
| AssetsNet | $ 138,858,768 | |||||||||||||||||||||||||||||||||||||||||||||||||||||||||||||
| Holdings Count | Holding | 71 | |||||||||||||||||||||||||||||||||||||||||||||||||||||||||||||
| Advisory Fees Paid, Amount | $ 193,545 | |||||||||||||||||||||||||||||||||||||||||||||||||||||||||||||
| InvestmentCompanyPortfolioTurnover | 28.00% | |||||||||||||||||||||||||||||||||||||||||||||||||||||||||||||
| Additional Fund Statistics [Text Block] | Fund Statistics
|
|||||||||||||||||||||||||||||||||||||||||||||||||||||||||||||
| Holdings [Text Block] | Asset Weighting (% of total investments)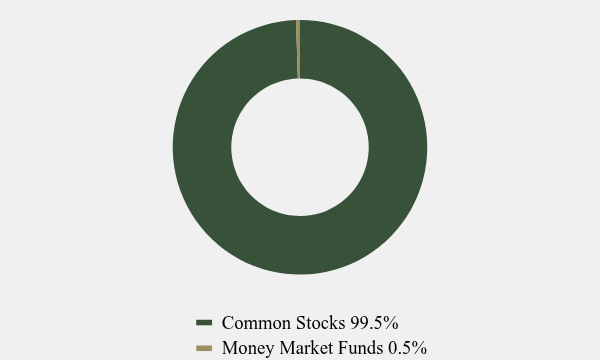
Sector Weighting (% of net assets)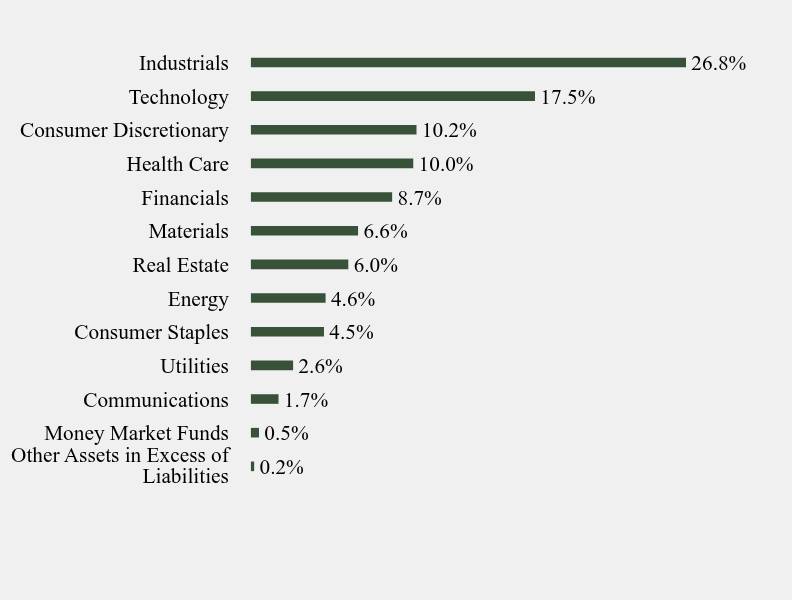
|
|||||||||||||||||||||||||||||||||||||||||||||||||||||||||||||
| Largest Holdings [Text Block] | Top 10 Holdings (% of net assets)
|
|||||||||||||||||||||||||||||||||||||||||||||||||||||||||||||
| Material Fund Change [Text Block] | Material Fund ChangesNo material changes occurred during the six months ended May 31, 2026. |
|||||||||||||||||||||||||||||||||||||||||||||||||||||||||||||
| C000178802 | ||||||||||||||||||||||||||||||||||||||||||||||||||||||||||||||
| Shareholder Report [Line Items] | ||||||||||||||||||||||||||||||||||||||||||||||||||||||||||||||
| Fund Name | Copeland SMID Cap Dividend Growth Fund | |||||||||||||||||||||||||||||||||||||||||||||||||||||||||||||
| Class Name | Class I | |||||||||||||||||||||||||||||||||||||||||||||||||||||||||||||
| Trading Symbol | CSMDX | |||||||||||||||||||||||||||||||||||||||||||||||||||||||||||||
| Additional Information Phone Number | 1-888-926-7352 | |||||||||||||||||||||||||||||||||||||||||||||||||||||||||||||
| Expenses [Text Block] | What were the Fund’s costs for the last six months?(based on a hypothetical $10,000 investment)
|
|||||||||||||||||||||||||||||||||||||||||||||||||||||||||||||
| Expenses Paid, Amount | $ 50 | |||||||||||||||||||||||||||||||||||||||||||||||||||||||||||||
| Expense Ratio, Percent | 0.95% | [7] | ||||||||||||||||||||||||||||||||||||||||||||||||||||||||||||
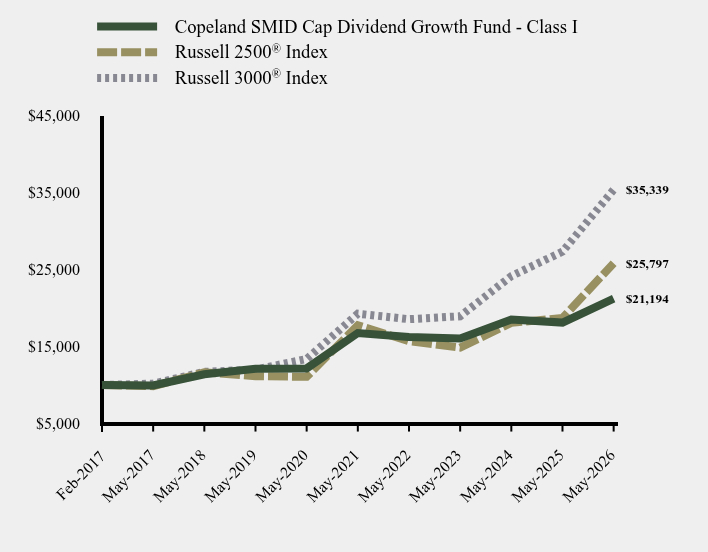
| Factors Affecting Performance [Text Block] | How did the Fund perform during the reporting period?During the six-month period ending May 31, 2026, Class I shares of the Fund rose 9.86% versus the 18.46% gain registered by the Russell 2500 Index and the 11.18% advance posted by the Russell 3000 Index. Our performance shortfall relative to the Russell 2500 Index (commonly referred to as "SMID cap") benchmark was primarily attributable to the outperformance of lower quality, lower profitability and higher volatility stocks during a period of market exuberance in the technology sector, particularly for stocks with exposure to the artificial intelligence (AI) theme. During the period, dozens of technology stocks rose in excess of 100%, providing a challenging backdrop for the steady dividend growth equities held in the Fund.
Our significant exposure to the Technology sector contributed most significantly to returns, with the Fund’s average stock in the sector rising 53%. Kulicke & Soffa Industries (KLIC, 2.4% of holdings at period end) led semiconductor holdings higher as sales and earnings inflected upward when customers ordered advanced packaging tools, and investor interest increased as the company launched new tools to support high-growth memory and AI-related companies.
Stock selection was most favorable in the Staples sector, led by a strong rise in the shares of PriceSmart, Inc. (PSMT, 2.1% of holdings at period end), a warehouse club operator in the Caribbean and Central America. Investors bid up the shares as earnings growth accelerated from mid-single-digit to double-digit rates, supported by improved execution and consistent same-store sales growth near 8% over the past year.
Meanwhile, despite strong absolute returns in the Technology sector, stock selection was a headwind to performance. Universal Display Corporation (OLED, 1.2% of holdings at period end) declined as the maker of light emitting diode technologies faced a weak consumer electronics environment. Sales of cell phones by major customers that utilize OLED screens were curtailed as rising memory chip prices pushed up device costs.
Stock selection was also a headwind in the Consumer Discretionary sector as higher oil prices and interest rates slowed sales for restaurants, consumer goods and housing-related businesses. Same-store sales at chicken wings-focused restaurant Wingstop (WING, 1.0% of holdings at period end) slowed materially even as new units were opened at a high-teens rate, though we believe sales to stabilize and recover as energy prices normalize and consumer health improves. |
|||||||||||||||||||||||||||||||||||||||||||||||||||||||||||||
| Line Graph [Table Text Block] |
|
|||||||||||||||||||||||||||||||||||||||||||||||||||||||||||||
| Average Annual Return [Table Text Block] |
|
|||||||||||||||||||||||||||||||||||||||||||||||||||||||||||||
| Performance Inception Date | Feb. 27, 2017 | |||||||||||||||||||||||||||||||||||||||||||||||||||||||||||||
| AssetsNet | $ 138,858,768 | |||||||||||||||||||||||||||||||||||||||||||||||||||||||||||||
| Holdings Count | Holding | 71 | |||||||||||||||||||||||||||||||||||||||||||||||||||||||||||||
| Advisory Fees Paid, Amount | $ 193,545 | |||||||||||||||||||||||||||||||||||||||||||||||||||||||||||||
| InvestmentCompanyPortfolioTurnover | 28.00% | |||||||||||||||||||||||||||||||||||||||||||||||||||||||||||||
| Additional Fund Statistics [Text Block] | Fund Statistics
|
|||||||||||||||||||||||||||||||||||||||||||||||||||||||||||||
| Holdings [Text Block] | Asset Weighting (% of total investments)
Sector Weighting (% of net assets)
|
|||||||||||||||||||||||||||||||||||||||||||||||||||||||||||||
| Largest Holdings [Text Block] | Top 10 Holdings (% of net assets)
|
|||||||||||||||||||||||||||||||||||||||||||||||||||||||||||||
| Material Fund Change [Text Block] | Material Fund ChangesNo material changes occurred during the six months ended May 31, 2026. |
|||||||||||||||||||||||||||||||||||||||||||||||||||||||||||||
| ||||||||||||||||||||||||||||||||||||||||||||||||||||||||||||||
| X | ||||||||||
- Definition Boolean flag that is true when the XBRL content amends previously-filed or accepted submission. No definition available.
|
| X | ||||||||||
- Definition For the EDGAR submission types of Form 8-K: the date of the report, the date of the earliest event reported; for the EDGAR submission types of Form N-1A: the filing date; for all other submission types: the end of the reporting or transition period. The format of the date is YYYY-MM-DD. No definition available.
|
| X | ||||||||||
- Definition The type of document being provided (such as 10-K, 10-Q, 485BPOS, etc). The document type is limited to the same value as the supporting SEC submission type, or the word 'Other'. No definition available.
|
| X | ||||||||||
- Definition A unique 10-digit SEC-issued value to identify entities that have filed disclosures with the SEC. It is commonly abbreviated as CIK. Reference 1: http://www.xbrl.org/2003/role/presentationRef
|
| X | ||||||||||
- Definition One of: N-1A (Mutual Fund), N-1 (Open-End Separate Account with No Variable Annuities), N-2 (Closed-End Investment Company), N-3 (Separate Account Registered as Open-End Management Investment Company), N-4 (Variable Annuity UIT Separate Account), N-5 (Small Business Investment Company), N-6 (Variable Life UIT Separate Account), S-1 or S-3 (Face Amount Certificate Company), S-6 (UIT, Non-Insurance Product). Reference 1: http://www.xbrl.org/2003/role/presentationRef
|
| X | ||||||||||
- Definition The exact name of the entity filing the report as specified in its charter, which is required by forms filed with the SEC. Reference 1: http://www.xbrl.org/2003/role/presentationRef
|
| X | ||||||||||
- Definition Trading symbol of an instrument as listed on an exchange. No definition available.
|
| X | ||||||||||
- References Reference 1: http://www.xbrl.org/2003/role/presentationRef
|
| X | ||||||||||
- References Reference 1: http://www.xbrl.org/2003/role/presentationRef
|
| X | ||||||||||
- References Reference 1: http://www.xbrl.org/2003/role/presentationRef
|
| X | ||||||||||
- References Reference 1: http://www.xbrl.org/2003/role/presentationRef
|
| X | ||||||||||
- References Reference 1: http://www.xbrl.org/2003/role/presentationRef
|
| X | ||||||||||
- References Reference 1: http://www.xbrl.org/2003/role/presentationRef
|
| X | ||||||||||
- References Reference 1: http://www.xbrl.org/2003/role/presentationRef
|
| X | ||||||||||
- References Reference 1: http://www.xbrl.org/2003/role/presentationRef
|
| X | ||||||||||
- References Reference 1: http://www.xbrl.org/2003/role/presentationRef
|
| X | ||||||||||
- References Reference 1: http://www.xbrl.org/2003/role/presentationRef
|
| X | ||||||||||
- References Reference 1: http://www.xbrl.org/2003/role/presentationRef
|
| X | ||||||||||
- References Reference 1: http://www.xbrl.org/2003/role/presentationRef
|
| X | ||||||||||
- References Reference 1: http://www.xbrl.org/2003/role/presentationRef
|
| X | ||||||||||
- References Reference 1: http://www.xbrl.org/2003/role/presentationRef
|
| X | ||||||||||
- References Reference 1: http://www.xbrl.org/2003/role/presentationRef
|
| X | ||||||||||
- References Reference 1: http://www.xbrl.org/2003/role/presentationRef
|
| X | ||||||||||
- References Reference 1: http://www.xbrl.org/2003/role/presentationRef
|
| X | ||||||||||
- References Reference 1: http://www.xbrl.org/2003/role/presentationRef
|
| X | ||||||||||
- Definition Amount of net assets (liabilities). Reference 1: http://fasb.org/us-gaap/role/ref/legacyRef
|
| X | ||||||||||
- Definition Percentage of lesser of purchase or sale of portfolio securities to average value of portfolio securities owned. Reference 1: http://www.xbrl.org/2009/role/commonPracticeRef
|
| X | ||||||||||
- Details
|
| X | ||||||||||
- Details
|
| X | ||||||||||
- Details
|
| X | ||||||||||
- Details
|
| X | ||||||||||
- Details
|
| X | ||||||||||
- Details
|
| X | ||||||||||
- Details
|