ADDITIONAL INFORMATION
This contains important information about the Tarkio Fund - TARKX (the “Fund”) for the period June 1, 2025 to May 31, 2026.
You can find additional information about the Fund at https://tarkiofund.com. You can also request this information by contacting us at 1-866-738-3629.
What were the Fund costs for the past year?
(based on a hypothetical $10,000 investment)
| Fund Name | Costs of a $10,000 investment | Costs paid as a percentage of a $10,000 investment * |
| Tarkio Fund | $133 | 1.00% |
*Annualized
managment’s discussion of fund performance
The Tarkio Fund (the “Fund”) seeks to identify companies whose leaders and cultures create long term competitive advantage by engaging employees, delighting customers, adapting and innovating, and continuously improving. Our criteria focus on six attributes: (1) Humility, Integrity, and Trust; (2) Long Term Focus; (3) Purpose and Passion; (4) Teamwork—Cooperation, Not Competition; (5) Employee Empowerment—Driving Fear Out of the Organization; and (6) Disciplined Capital Allocation. We reduce or exit positions only when a company’s culture or leadership drifts from these principles; otherwise, our intention is to hold through short term economic cycles and geopolitical or macroeconomic events.
For the 1 year period ending May 31, 2026, the S&P 500 Index rose 29.78%. The Tarkio Fund increased 65.07% over the same period. Performance was meaningfully aided by several long held optical communications companies, including Lumentum (LITE, +1027.02%), Ciena (CIEN, +609.76%), Coherent (COHR, +370.79%), and Corning (GLW, +214.12%). During the period, we aggressively pared back these positions to reallocate capital toward newer holdings discussed in recent quarterly letters. These companies—Azenta, Baxter, Enovis, International Paper, HNI Corp., and Gentherm—are in early stages of Lean cultural transformation and currently trade at significantly lower valuations than the companies we have been trimming. As a result, the average valuation of the overall portfolio has been reduced by a meaningful amount.
The Fund’s weakest performers for the same period were International Paper (IP, –29.09%), ESAB Corp. (ESAB, –24.37%), and Enovis (ENOV, –23.51%). We believe these price movements primarily reflected short term reactions to temporary geopolitical and macroeconomic conditions rather than changes in long term business quality. In response, we purchased substantial additional shares in what we believe to be high quality holdings at prices that represent compelling Lean turnaround opportunities.
We are very comfortable with the current composition of the Fund and believe it is well positioned to continue compounding meaningful wealth for our long term partners. Our focus remains on investing in organizations whose cultures are improving and whose leaders are committed to long term value creation.
We thank you for your investment in the Tarkio Fund.
HOW DID THE FUND PERFORM DURING THE LAST TEN YEARS?
AVERAGE ANNUAL RETURNS
| 1 Year | 5 Years | 10 Years | |
| Tarkio Fund | 65.07% | 11.19% | 15.33% |
| S&P 500 ® Index | 29.78% | 14.16% | 15.65% |
Cumulative Performance Comparison of $10,000 Investment
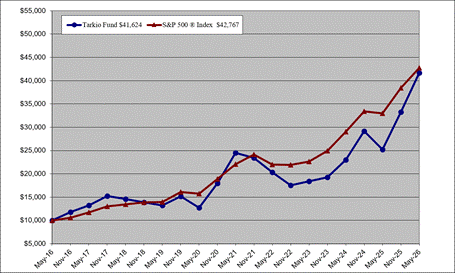
Past performance is not a good predictor of future performance. The returns shown do not reflect taxes that a shareholder would pay on Fund distributions or on the redemption of Fund shares. Updated performance data current to the most recent month-end can be obtained by calling 1-866-738-3629.
Fund statistics
| PORTFOLIO | PORTFOLIO | ADVISORY FEES | |
| NET ASSETS: | HOLDINGS: | TURNOVER: | PAID BY FUND: |
| $257,789,059 | 36 | 24.43% | $1,564,632 |
WHAT ARE THE FUND’S HOLDINGS?
PORTFOLIO ILLUSTRATION
The following chart gives a visual breakdown of the Fund by the sectors the underlying securities represent as a percentage of the portfolio of investments.
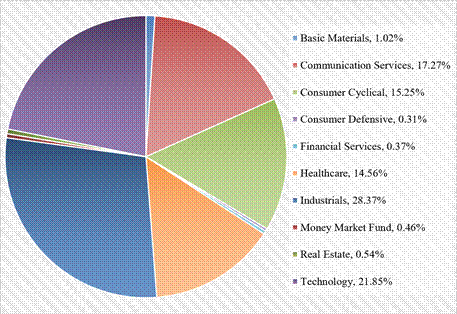
Sectors are categorized using Morningstar® classifications
TOP TEN HOLDINGS (% OF NET ASSETS)
| 1. | Lumen Technologies, Inc. | 17.27% |
| 2. | Cognex Corp. | 11.22% |
| 3. | General Electric Co. | 9.98% |
| 4. | The Manitowoc Company, Inc. | 5.98% |
| 5. | GE Vernova, LLC | 5.68% |
| 6. | Modine Manufacturing Co. | 4.89% |
| 7. | International Paper Co. | 4.30% |
| 8. | Baxter International, Inc. | 4.29% |
| 9. | Azenta, Inc. | 4.26% |
| 10. | Coherent Corp. | 3.28% |
| Total % of Net Assets | 71.15% |