Q2 2026 Earnings Presentation August 10, 2026
This presentation (the “Presentation”) of OppFi Inc. (“OppFi” or the “Company”) is for information purposes only. Certain information contained herein has been derived from sources prepared by third parties. While such information is believed to be reliable for the purposes used herein, the Company makes no representation or warranty with respect to the accuracy of such information. Trademarks and trade names referred to in this Presentation are the property of their respective owners. The information contained herein does not purport to be all-inclusive. This Presentation does not constitute investment, tax, or legal advice. No representation or warranty, express or implied, is or will be given by the Company or any of its respective affiliates, directors, officers, employees or advisers or any other person as to the accuracy or completeness of the information in this Presentation, and no responsibility or liability whatsoever is accepted for the accuracy or sufficiency thereof or for any errors, omissions or misstatements, negligent or otherwise, relating thereto. The information contained in this Presentation is preliminary in nature and is subject to change, and any such changes may be material. The Company disclaims any duty to update the information contained in this Presentation, which information is given only as of the date of this Presentation unless otherwise stated herein. Forward-Looking Statements This Presentation includes “forward-looking statements” within the meaning of the “safe harbor” provisions of the Private Securities Litigation Reform Act of 1995, Section 27A of the Securities Act of 1933, as amended, and Section 21E of the Securities Exchange Act of 1934, as amended. OppFi’s actual results may differ from its expectations, estimates and projections and consequently, you should not rely on these forward-looking statements as predictions of future events. Words such as “expect,” “estimate,” “project,” “budget,” “forecast,” “opportunity,” “anticipate,” “intend,” “plan,” “may,” “will,” “could,” “should,” “believes,” “predicts,” “potential,” “possible,” “continue,” “positions,” and similar expressions may identify forward-looking statements, but the absence of these words does not mean that a statement is not forward-looking. These forward-looking statements include, without limitation, OppFi’s expectations with respect to its full year 2026 guidance, the future performance of OppFi’s platform and underwriting models, the anticipated launch and performance of its new line of credit product, statements regarding OppFi’s proposed acquisition of BNCC, including the anticipated timing, structure, benefits and strategic rationale of the transaction, OppFi’s expectations with respect to the geographic expansion and product diversification that may come from the acquisition, and expectations for OppFi’s growth and future financial performance. These forward-looking statements are based on OppFi’s current expectations and assumptions about future events and are based on currently available information as to the outcome and timing of future events. These forward-looking statements involve significant risks and uncertainties that could cause the actual results to differ materially from the expected results. Most of these factors are outside OppFi’s control and are difficult to predict. Factors that may cause such differences include, but are not limited to, the impact of general economic conditions, including economic slowdowns, inflation, interest rate changes, recessions, the impact of tariffs, and tightening of credit markets on OppFi’s business; the impact of challenging macroeconomic and marketplace conditions; the impact of stimulus or other government programs; risks related to the proposed acquisition of BNCC including the risk that the transactions may not be completed in a timely manner or at all, the failure to satisfy closing conditions or obtain required regulatory approvals, the impact of the transaction on OppFi’s governance structure, integration or execution challenges, and adverse reactions from customers or stockholders; whether OppFi will be successful in obtaining declaratory relief against the Commissioner of the Department of Financial Protection and Innovation for the State of California; whether OppFi will be subject to AB 539; whether OppFi’s bank partners will continue to lend in California and whether OppFi’s financing sources will continue to finance the purchase of participation rights in loans originated by OppFi’s bank partners in California; OppFi’s ability to scale and grow the Bitty business; the impact that events involving financial institutions or the financial services industry generally, such as actual concerns or events involving liquidity, defaults, or non-performance, may have on OppFi’s business; risks related to any material weakness in OppFi’s internal controls over financial reporting; the ability of OppFi to grow and manage growth profitably and retain its key employees; risks related to new products; risks related to evaluating and potentially consummating acquisitions; concentration risk; risks related to OppFi’s ability to comply with various covenants in its corporate and warehouse credit facilities; risks related to potential litigation; changes in applicable laws or regulations, including, but not limited to, impacts from the One Big Beautiful Bill Act; the possibility that OppFi may be adversely affected by other economic, business, and/or competitive factors; and other risks and uncertainties indicated from time to time in OppFi’s filings with the United States Securities and Exchange Commission, in particular, contained in the section captioned “Risk Factors.” OppFi cautions that the foregoing list of factors is not exclusive, and readers should not place undue reliance upon any forward-looking statements, which speak only as of the date made. OppFi does not undertake or accept any obligation or undertaking to release publicly any updates or revisions to any forward-looking statements to reflect any change in its expectations or any change in events, conditions or circumstances on which any such statement is based. Non-GAAP Financial Measures This Presentation includes certain non-GAAP financial measures that are unaudited and do not conform to GAAP, such as Adjusted EBT, Adjusted Net Income and margin thereof, Adjusted EPS, and Free Cash Flow. Adjusted EBT is defined as Net Income, adjusted for (1) income tax expense; (2) change in fair value of warrant liabilities; (3) other adjustments, net; and (4) other income. Adjusted Net Income is defined as Adjusted EBT as defined above, adjusted for taxes assuming a tax rate for each period presented that reflects the U.S. federal statutory rate of 21% and a blended statutory rate for state income taxes, in order to allow for a comparison with other publicly traded companies. Adjusted Net Income Margin is defined as Adjusted Net Income as defined above divided by Total Revenue. Adjusted EPS is defined as Adjusted Net Income as defined above, divided by weighted average diluted shares outstanding, which represents shares of both classes of common stock outstanding and includes the impact of dilutive securities, such as restricted stock units, performance stock units, and stock options. Free Cash Flow is defined as net cash provided by operating activities minus net cash used in investing activities. These non-GAAP financial measures have not been prepared in accordance with accounting principles generally accepted in the United States and may be different from non-GAAP financial measures used by other companies. OppFi believes that the use of these non-GAAP financial measures provides an additional tool for investors to use in evaluating ongoing operating results and trends. These non-GAAP measures with comparable names should not be considered in isolation from, or as an alternative to, financial measures determined in accordance with GAAP. See “Reconciliation of Non-GAAP Financial Measures” below for reconciliations for OppFi’s non-GAAP financial measures to the most directly comparable GAAP financial measures. A reconciliation of projected full year 2026 Adjusted Net Income and Adjusted EPS to the most directly comparable GAAP financial measures is not included in this Presentation because, without unreasonable efforts, the Company is unable to predict with reasonable certainty the amount or timing of non-GAAP adjustments that are used to calculate these measures. Important Additional Information and Where to Find It In connection with the proposed transaction between OppFi and BNCCORP, Inc. (“BNCC”), OppFi has filed with the U.S. Securities and Exchange Commission (the “SEC”) a registration statement on Form S-4 (File No. 333-297733) (the “registration statement”), which includes a proxy statement of BNCC and a prospectus of OppFi (the “proxy statement/prospectus”), and OppFi may file with the SEC other relevant documents regarding the proposed transaction. INVESTORS AND SECURITY HOLDERS ARE URGED TO READ THE REGISTRATION STATEMENT AND THE PROXY STATEMENT/PROSPECTUS CAREFULLY AND IN THEIR ENTIRETY AND ANY OTHER RELEVANT DOCUMENTS FILED WITH THE SEC BY OPPFI, AS WELL AS ANY AMENDMENTS OR SUPPLEMENTS TO THOSE DOCUMENTS, BECAUSE THEY CONTAIN OR WILL CONTAIN IMPORTANT INFORMATION ABOUT OPPFI, BNCC, BNC NATIONAL BANK AND THE PROPOSED TRANSACTION. A definitive copy of the proxy statement/prospectus has been mailed to stockholders of BNCC. Investors and security holders will be able to obtain the registration statement and the proxy statement/prospectus, as well as other filings containing information about OppFi, free of charge from OppFi or from the SEC’s website. The documents filed by OppFi with the SEC may be obtained free of charge at OppFi’s website, at https://investors.oppfi.com/financials/sec-filings/default.aspx, or by requesting them by mail at 130 E. Randolph Street, Suite 3400, Chicago, IL 60601 or by email at corporate.secretary@oppfi.com. Participants in a Solicitation This Presentation is not a solicitation of a proxy from any security holder of BNCC or OppFi. However, OppFi, BNCC and certain of their respective directors and executive officers may be deemed to be participants in a solicitation of proxies from the stockholders of BNCC in respect of the proposed transaction. Information about OppFi’s directors and executive officers is available in its Annual Report on Form 10-K for the year ended December 31, 2025 and other documents filed by OppFi with the SEC. Information regarding the persons who may, under the rules of the SEC, be deemed participants in the proxy solicitation and a description of their direct and indirect interests, by security holdings or otherwise, is contained in the registration statement and in the proxy statement/prospectus and other relevant materials to be filed with the SEC. Free copies of these documents may be obtained as described in the preceding paragraph. This Presentation shall not constitute an offer to sell or the solicitation of an offer to buy any securities of OppFi or a solicitation of any vote or approval with respect to the proposed transaction by OppFi or BNCC, nor shall there be any sale of securities in any jurisdiction in which such offer, solicitation or sale would be unlawful prior to registration or qualification under the securities laws of any such jurisdiction. No offering of securities shall be made except by means of a prospectus meeting the requirements of Section 10 of the U.S. Securities Act of 1933, as amended. Website This Presentation contains reproductions and references to the Company’s website and mobile content. Website and mobile content are not incorporated into this Presentation. Any references to URLs for the websites are intended to be inactive textual references only. Disclaimer 2
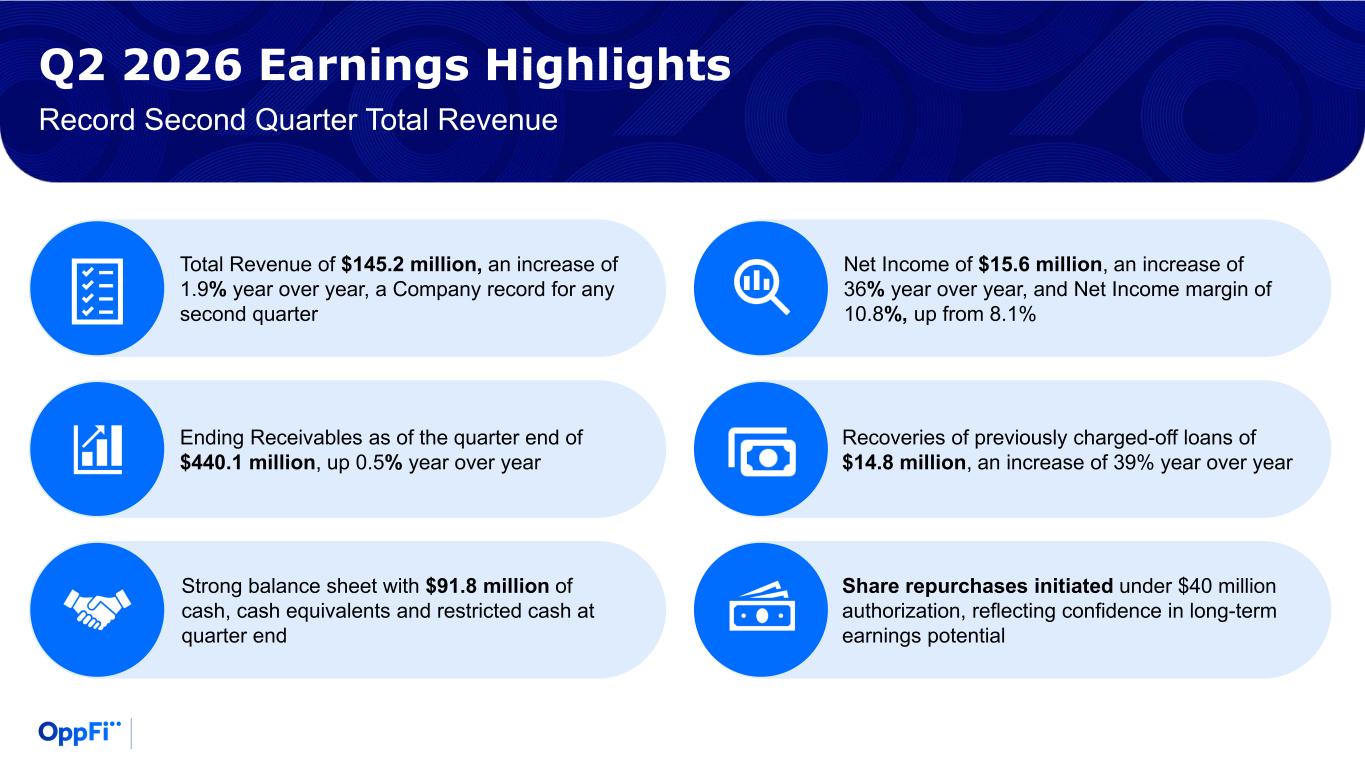
Q2 2026 Earnings Highlights Total Revenue of $145.2 million, an increase of 1.9% year over year, a Company record for any second quarter Ending Receivables as of the quarter end of $440.1 million, up 0.5% year over year Strong balance sheet with $91.8 million of cash, cash equivalents and restricted cash at quarter end Net Income of $15.6 million, an increase of 36% year over year, and Net Income margin of 10.8%, up from 8.1% Recoveries of previously charged-off loans of $14.8 million, an increase of 39% year over year Share repurchases initiated under $40 million authorization, reflecting confidence in long-term earnings potential Record Second Quarter Total Revenue
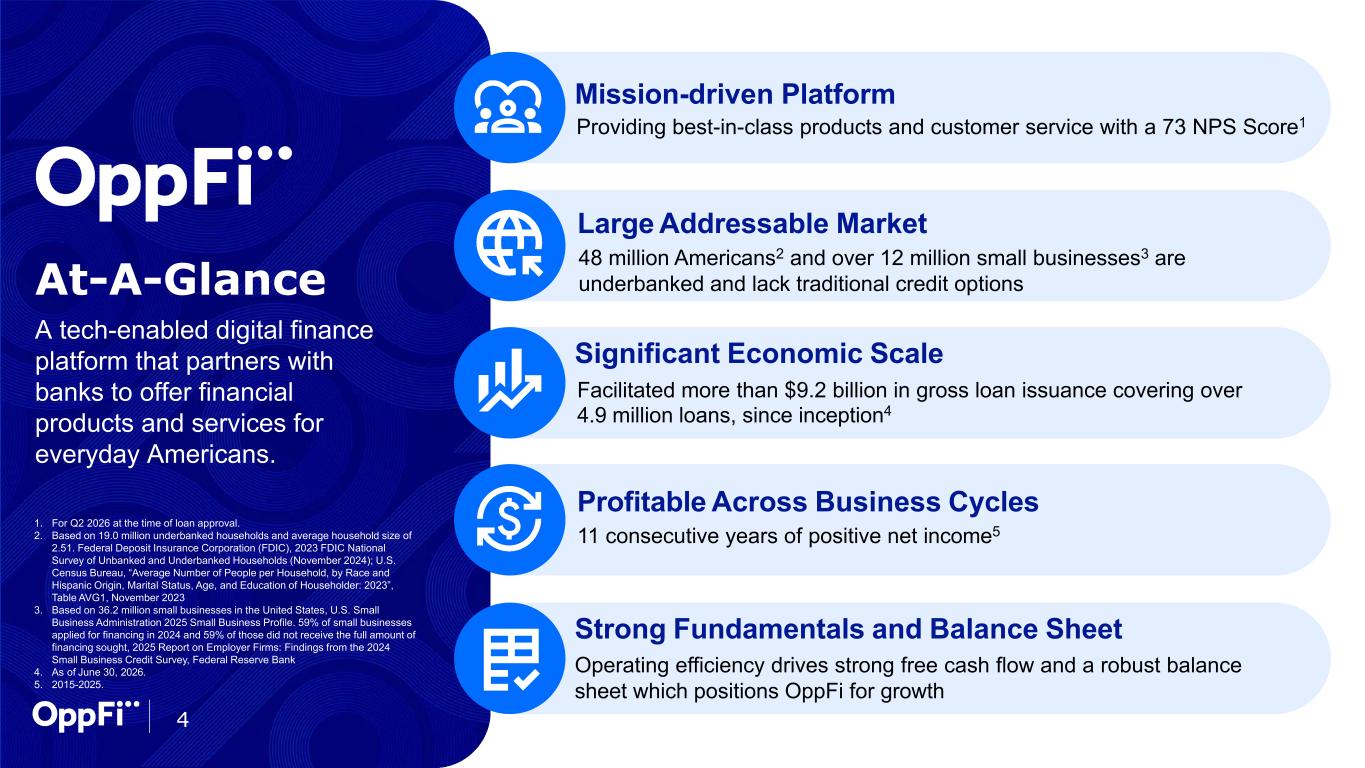
4 A tech-enabled digital finance platform that partners with banks to offer financial products and services for everyday Americans. At-A-Glance 1. For Q2 2026 at the time of loan approval. 2. Based on 19.0 million underbanked households and average household size of 2.51. Federal Deposit Insurance Corporation (FDIC), 2023 FDIC National Survey of Unbanked and Underbanked Households (November 2024); U.S. Census Bureau, “Average Number of People per Household, by Race and Hispanic Origin, Marital Status, Age, and Education of Householder: 2023”, Table AVG1, November 2023 3. Based on 36.2 million small businesses in the United States, U.S. Small Business Administration 2025 Small Business Profile. 59% of small businesses applied for financing in 2024 and 59% of those did not receive the full amount of financing sought, 2025 Report on Employer Firms: Findings from the 2024 Small Business Credit Survey, Federal Reserve Bank 4. As of June 30, 2026. 5. 2015-2025. Mission-driven Platform Significant Economic Scale Strong Fundamentals and Balance Sheet Providing best-in-class products and customer service with a 73 NPS Score1 Profitable Across Business Cycles Large Addressable Market Facilitated more than $9.2 billion in gross loan issuance covering over 4.9 million loans, since inception4 Operating efficiency drives strong free cash flow and a robust balance sheet which positions OppFi for growth 11 consecutive years of positive net income5 48 million Americans2 and over 12 million small businesses3 are underbanked and lack traditional credit options

Financial Highlights
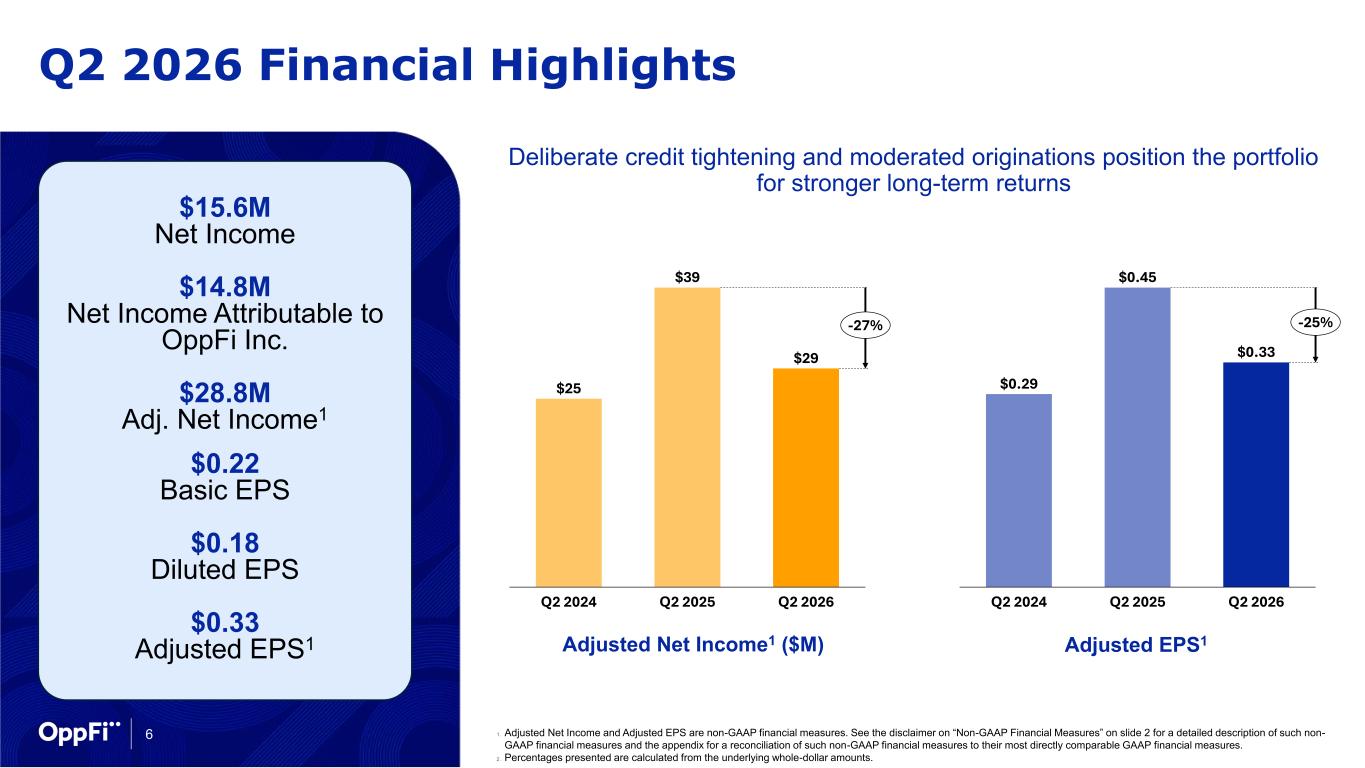
6 Q2 2026 Financial Highlights Adjusted Net Income1 ($M) Adjusted EPS1 Deliberate credit tightening and moderated originations position the portfolio for stronger long-term returns $15.6M Net Income $14.8M Net Income Attributable to OppFi Inc. $28.8M Adj. Net Income1 $0.22 Basic EPS $0.18 Diluted EPS $0.33 Adjusted EPS1 1. Adjusted Net Income and Adjusted EPS are non-GAAP financial measures. See the disclaimer on “Non-GAAP Financial Measures” on slide 2 for a detailed description of such non- GAAP financial measures and the appendix for a reconciliation of such non-GAAP financial measures to their most directly comparable GAAP financial measures. 2. Percentages presented are calculated from the underlying whole-dollar amounts. $25 $39 $29 Q2 2024 Q2 2025 Q2 2026 -27% $0.29 $0.45 $0.33 Q2 2024 Q2 2025 Q2 2026 -25%
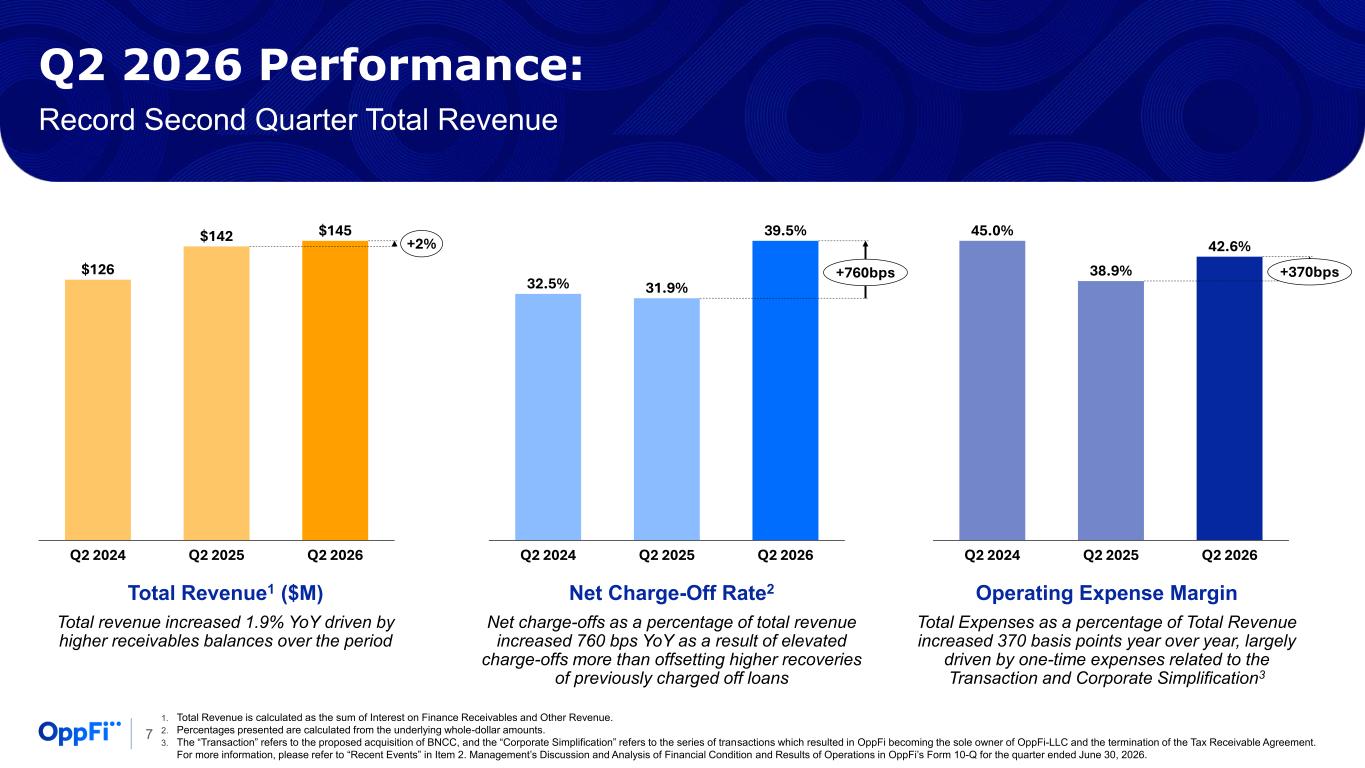
Total Revenue1 ($M) Total revenue increased 1.9% YoY driven by higher receivables balances over the period 7 Net Charge-Off Rate2 Net charge-offs as a percentage of total revenue increased 760 bps YoY as a result of elevated charge-offs more than offsetting higher recoveries of previously charged off loans Operating Expense Margin Total Expenses as a percentage of Total Revenue increased 370 basis points year over year, largely driven by one-time expenses related to the Transaction and Corporate Simplification3 Q2 2026 Performance: Record Second Quarter Total Revenue 1. Total Revenue is calculated as the sum of Interest on Finance Receivables and Other Revenue. 2. Percentages presented are calculated from the underlying whole-dollar amounts. 3. The “Transaction” refers to the proposed acquisition of BNCC, and the “Corporate Simplification” refers to the series of transactions which resulted in OppFi becoming the sole owner of OppFi-LLC and the termination of the Tax Receivable Agreement. For more information, please refer to “Recent Events” in Item 2. Management’s Discussion and Analysis of Financial Condition and Results of Operations in OppFi’s Form 10-Q for the quarter ended June 30, 2026. $126 $142 $145 Q2 2024 Q2 2025 Q2 2026 +2% 32.5% 31.9% 39.5% Q2 2024 Q2 2025 Q2 2026 +760bps 45.0% 38.9% 42.6% Q2 2024 Q2 2025 Q2 2026 +370bps
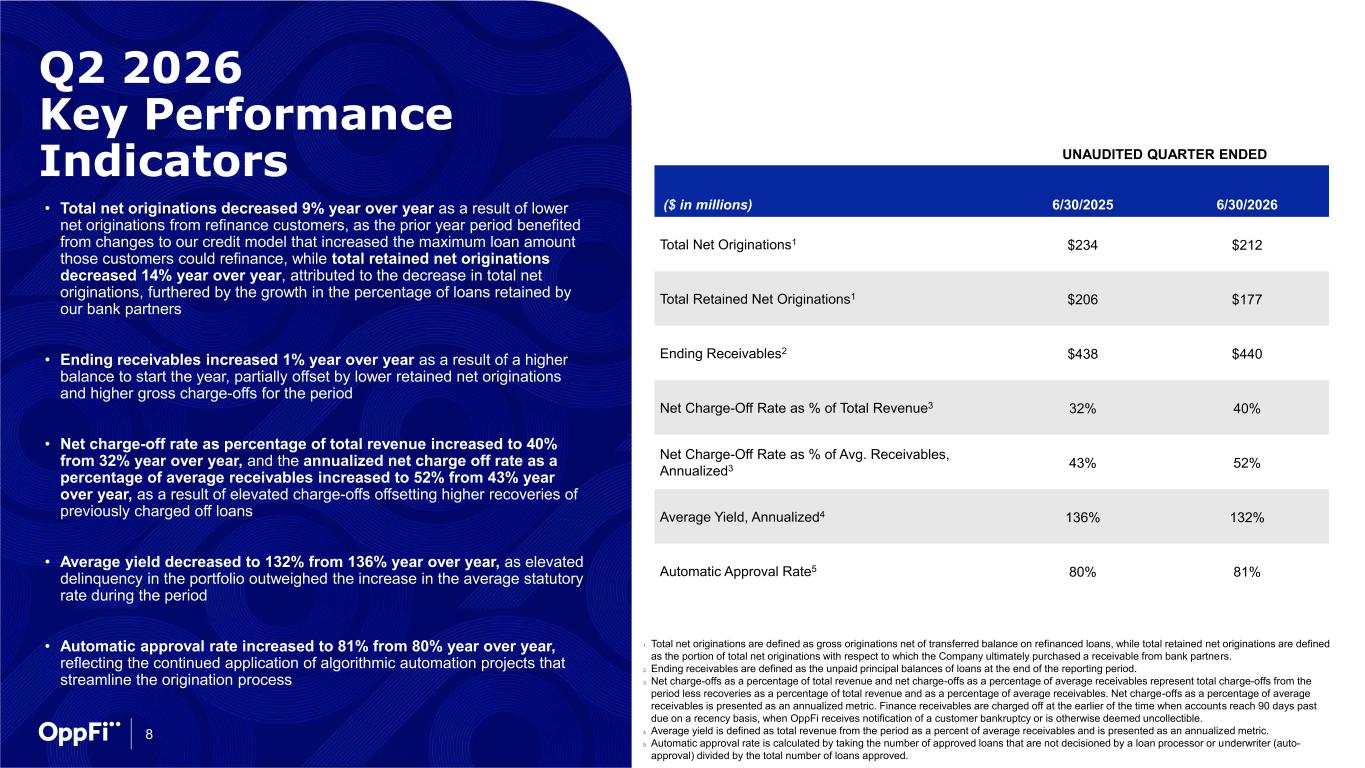
UNAUDITED QUARTER ENDED ($ in millions) 6/30/2025 6/30/2026 Total Net Originations1 $234 $212 Total Retained Net Originations1 $206 $177 Ending Receivables2 $438 $440 Net Charge-Off Rate as % of Total Revenue3 32% 40% Net Charge-Off Rate as % of Avg. Receivables, Annualized3 43% 52% Average Yield, Annualized4 136% 132% Automatic Approval Rate5 80% 81% Q2 2026 Key Performance Indicators • Total net originations decreased 9% year over year as a result of lower net originations from refinance customers, as the prior year period benefited from changes to our credit model that increased the maximum loan amount those customers could refinance, while total retained net originations decreased 14% year over year, attributed to the decrease in total net originations, furthered by the growth in the percentage of loans retained by our bank partners • Ending receivables increased 1% year over year as a result of a higher balance to start the year, partially offset by lower retained net originations and higher gross charge-offs for the period • Net charge-off rate as percentage of total revenue increased to 40% from 32% year over year, and the annualized net charge off rate as a percentage of average receivables increased to 52% from 43% year over year, as a result of elevated charge-offs offsetting higher recoveries of previously charged off loans • Average yield decreased to 132% from 136% year over year, as elevated delinquency in the portfolio outweighed the increase in the average statutory rate during the period • Automatic approval rate increased to 81% from 80% year over year, reflecting the continued application of algorithmic automation projects that streamline the origination process 1. Total net originations are defined as gross originations net of transferred balance on refinanced loans, while total retained net originations are defined as the portion of total net originations with respect to which the Company ultimately purchased a receivable from bank partners. 2. Ending receivables are defined as the unpaid principal balances of loans at the end of the reporting period. 3. Net charge-offs as a percentage of total revenue and net charge-offs as a percentage of average receivables represent total charge-offs from the period less recoveries as a percentage of total revenue and as a percentage of average receivables. Net charge-offs as a percentage of average receivables is presented as an annualized metric. Finance receivables are charged off at the earlier of the time when accounts reach 90 days past due on a recency basis, when OppFi receives notification of a customer bankruptcy or is otherwise deemed uncollectible. 4. Average yield is defined as total revenue from the period as a percent of average receivables and is presented as an annualized metric. 5. Automatic approval rate is calculated by taking the number of approved loans that are not decisioned by a loan processor or underwriter (auto- approval) divided by the total number of loans approved. 8
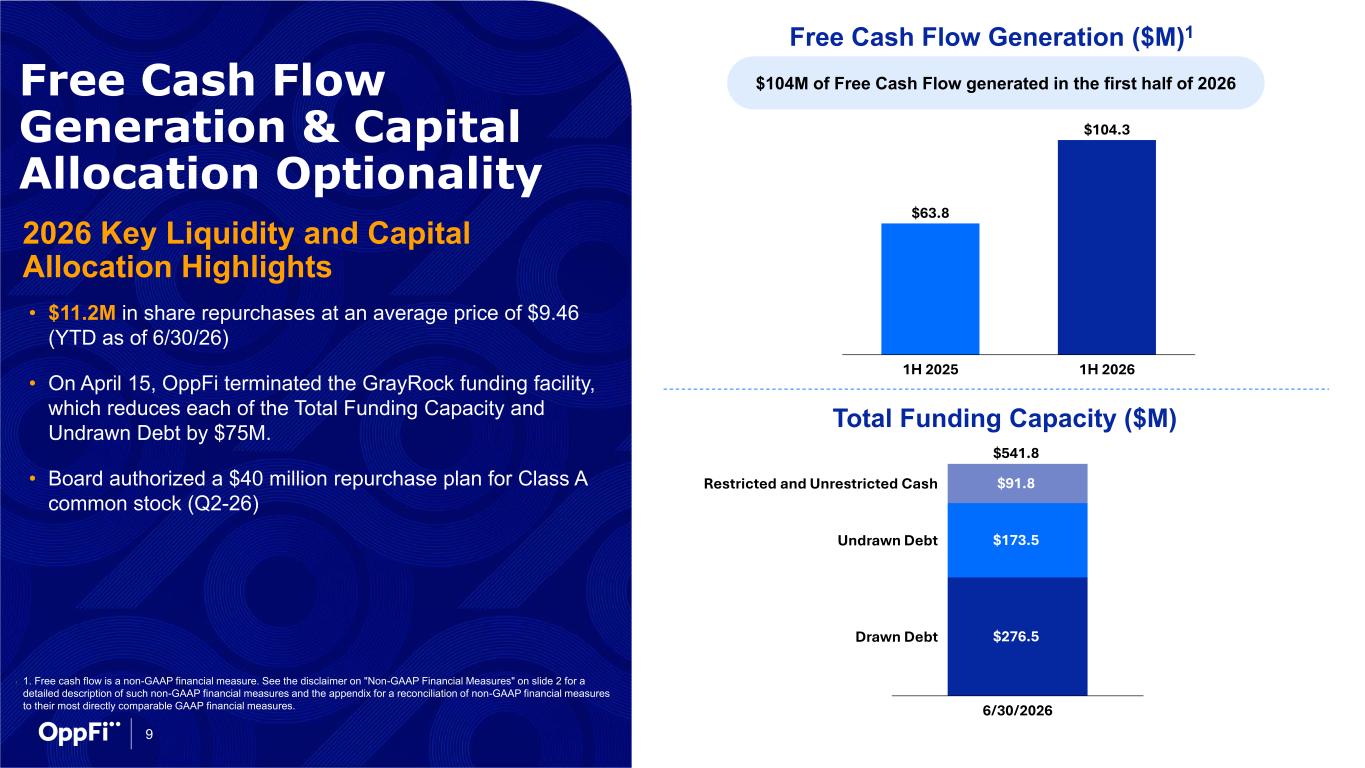
9 Free Cash Flow Generation & Capital Allocation Optionality 2026 Key Liquidity and Capital Allocation Highlights • $11.2M in share repurchases at an average price of $9.46 (YTD as of 6/30/26) • On April 15, OppFi terminated the GrayRock funding facility, which reduces each of the Total Funding Capacity and Undrawn Debt by $75M. • Board authorized a $40 million repurchase plan for Class A common stock (Q2-26) 1. 1. Free cash flow is a non-GAAP financial measure. See the disclaimer on "Non-GAAP Financial Measures" on slide 2 for a detailed description of such non-GAAP financial measures and the appendix for a reconciliation of non-GAAP financial measures to their most directly comparable GAAP financial measures. Free Cash Flow Generation ($M)1 $104M of Free Cash Flow generated in the first half of 2026 Total Funding Capacity ($M) $276.5 $173.5 $91.8 6/30/2026 Restricted and Unrestricted Cash Undrawn Debt Drawn Debt $541.8 $63.8 $104.3 1H 2025 1H 2026
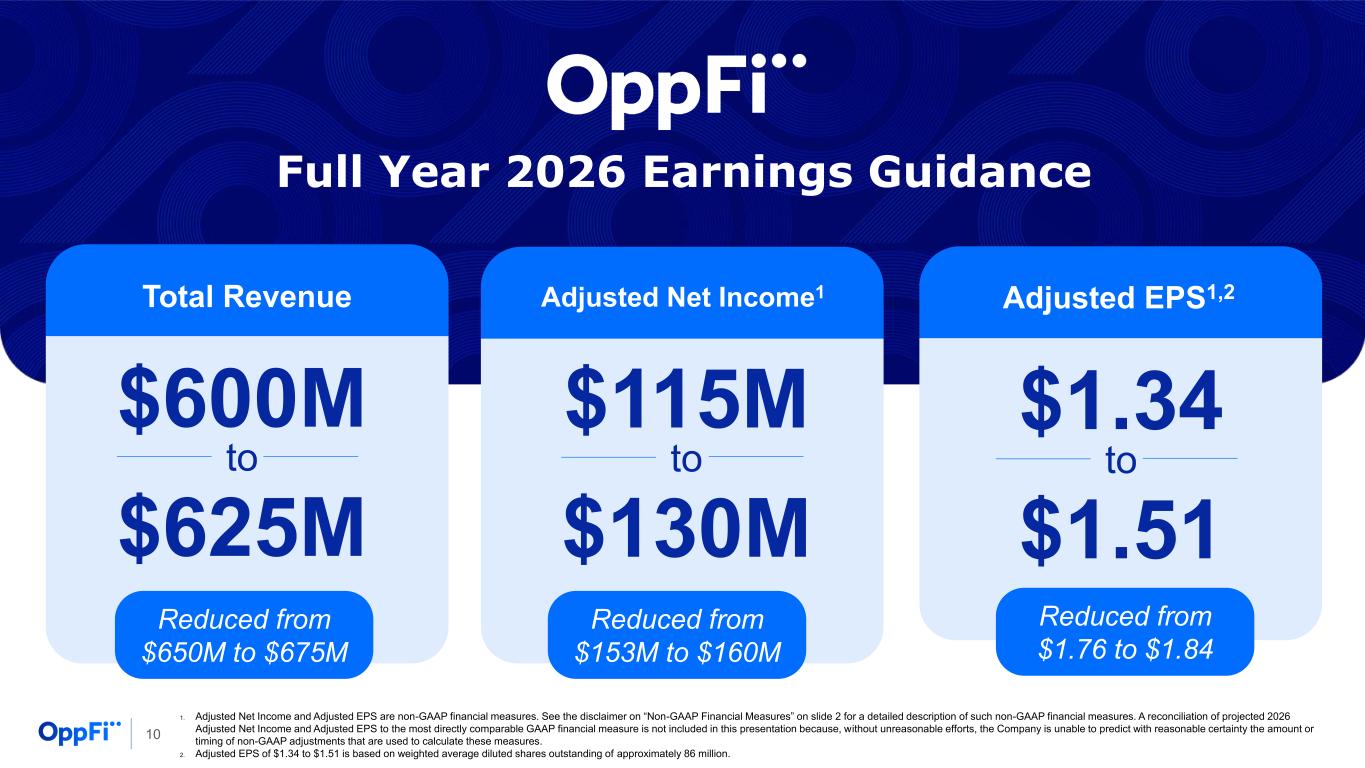
10 Full Year 2026 Earnings Guidance $600M $625M to Total Revenue Adjusted Net Income1 Adjusted EPS1,2 $115M $130M to $1.34 $1.51 to Reduced from $650M to $675M Reduced from $153M to $160M Reduced from $1.76 to $1.84 1. Adjusted Net Income and Adjusted EPS are non-GAAP financial measures. See the disclaimer on “Non-GAAP Financial Measures” on slide 2 for a detailed description of such non-GAAP financial measures. A reconciliation of projected 2026 Adjusted Net Income and Adjusted EPS to the most directly comparable GAAP financial measure is not included in this presentation because, without unreasonable efforts, the Company is unable to predict with reasonable certainty the amount or timing of non-GAAP adjustments that are used to calculate these measures. 2. Adjusted EPS of $1.34 to $1.51 is based on weighted average diluted shares outstanding of approximately 86 million.

Appendix
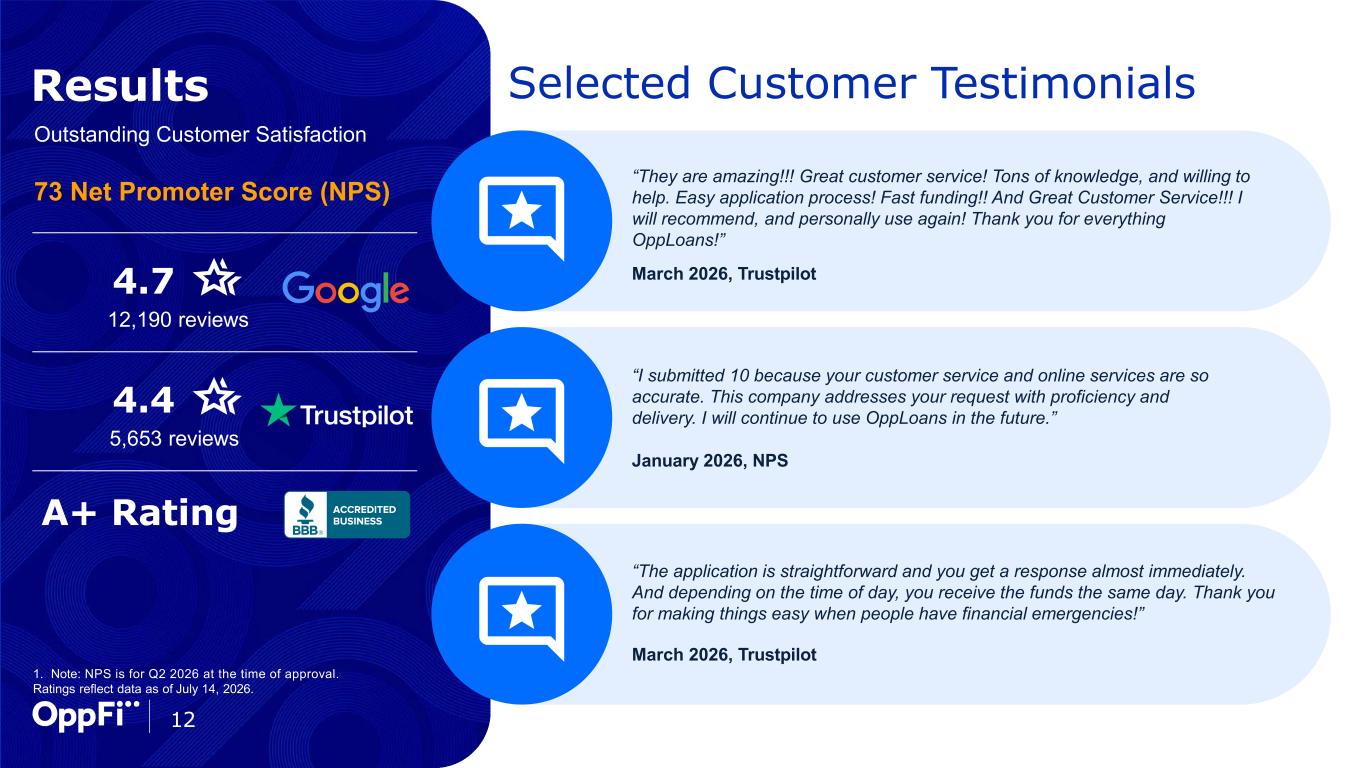
12 Outstanding Customer Satisfaction 73 Net Promoter Score (NPS) Results Selected Customer Testimonials “They are amazing!!! Great customer service! Tons of knowledge, and willing to help. Easy application process! Fast funding!! And Great Customer Service!!! I will recommend, and personally use again! Thank you for everything OppLoans!” March 2026, Trustpilot “I submitted 10 because your customer service and online services are so accurate. This company addresses your request with proficiency and delivery. I will continue to use OppLoans in the future.” January 2026, NPS “The application is straightforward and you get a response almost immediately. And depending on the time of day, you receive the funds the same day. Thank you for making things easy when people have financial emergencies!” March 2026, Trustpilot 4.7 12,190 reviews 4.4 5,653 reviews A+ Rating 1. Note: NPS is for Q2 2026 at the time of approval. Ratings reflect data as of July 14, 2026.
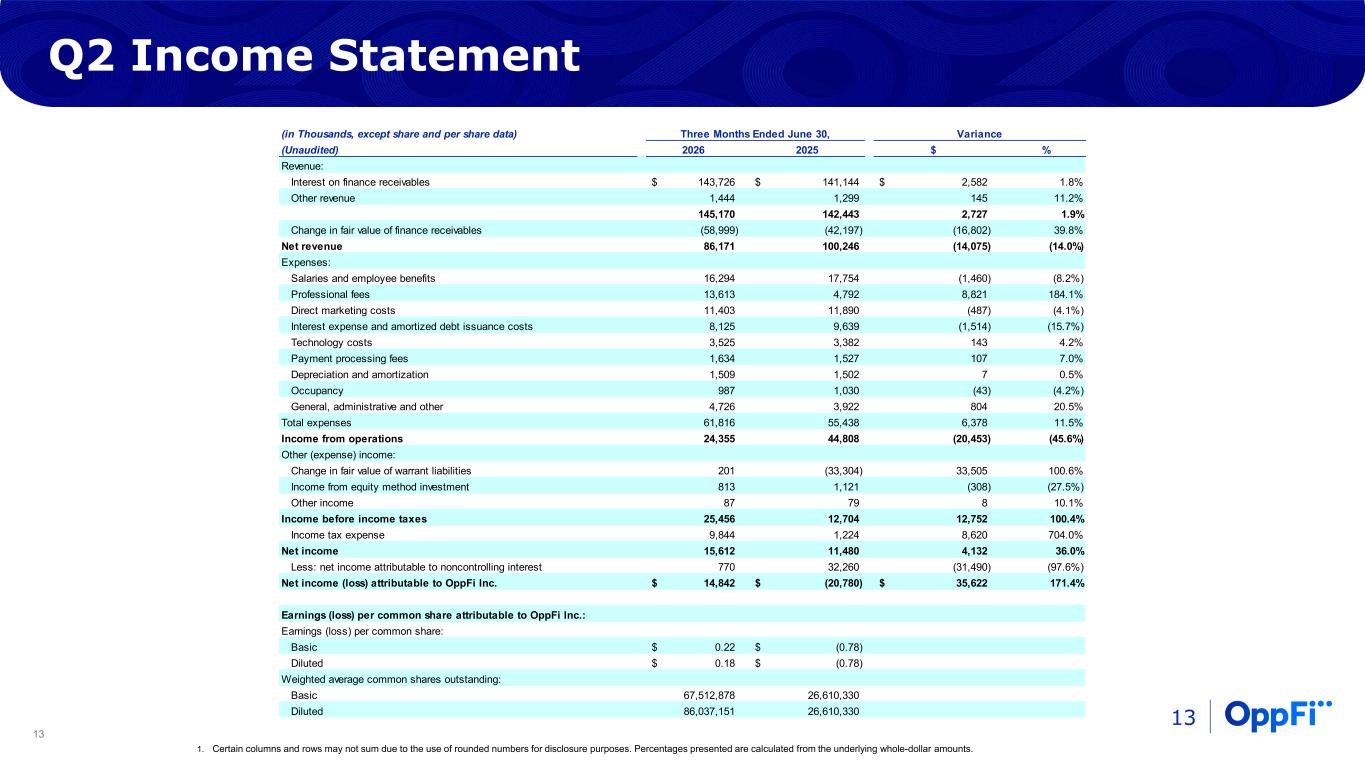
13 (in Thousands, except share and per share data) (Unaudited) 2026 2025 $ % Revenue: Interest on finance receivables 143,726$ 141,144$ 2,582$ 1.8% Other revenue 1,444 1,299 145 11.2% 145,170 142,443 2,727 1.9% Change in fair value of finance receivables (58,999) (42,197) (16,802) 39.8% Net revenue 86,171 100,246 (14,075) (14.0%) Expenses: Salaries and employee benefits 16,294 17,754 (1,460) (8.2%) Professional fees 13,613 4,792 8,821 184.1% Direct marketing costs 11,403 11,890 (487) (4.1%) Interest expense and amortized debt issuance costs 8,125 9,639 (1,514) (15.7%) Technology costs 3,525 3,382 143 4.2% Payment processing fees 1,634 1,527 107 7.0% Depreciation and amortization 1,509 1,502 7 0.5% Occupancy 987 1,030 (43) (4.2%) General, administrative and other 4,726 3,922 804 20.5% Total expenses 61,816 55,438 6,378 11.5% Income from operations 24,355 44,808 (20,453) (45.6%) Other (expense) income: Change in fair value of warrant liabilities 201 (33,304) 33,505 100.6% Income from equity method investment 813 1,121 (308) (27.5%) Other income 87 79 8 10.1% Income before income taxes 25,456 12,704 12,752 100.4% Income tax expense 9,844 1,224 8,620 704.0% Net income 15,612 11,480 4,132 36.0% Less: net income attributable to noncontrolling interest 770 32,260 (31,490) (97.6%) Net income (loss) attributable to OppFi Inc. 14,842$ (20,780)$ 35,622$ 171.4% Earnings (loss) per common share attributable to OppFi Inc.: Earnings (loss) per common share: Basic 0.22$ (0.78)$ Diluted 0.18$ (0.78)$ Weighted average common shares outstanding: Basic 67,512,878 26,610,330 Diluted 86,037,151 26,610,330 Three Months Ended June 30, Variance Q2 Income Statement 13 1. Certain columns and rows may not sum due to the use of rounded numbers for disclosure purposes. Percentages presented are calculated from the underlying whole-dollar amounts.
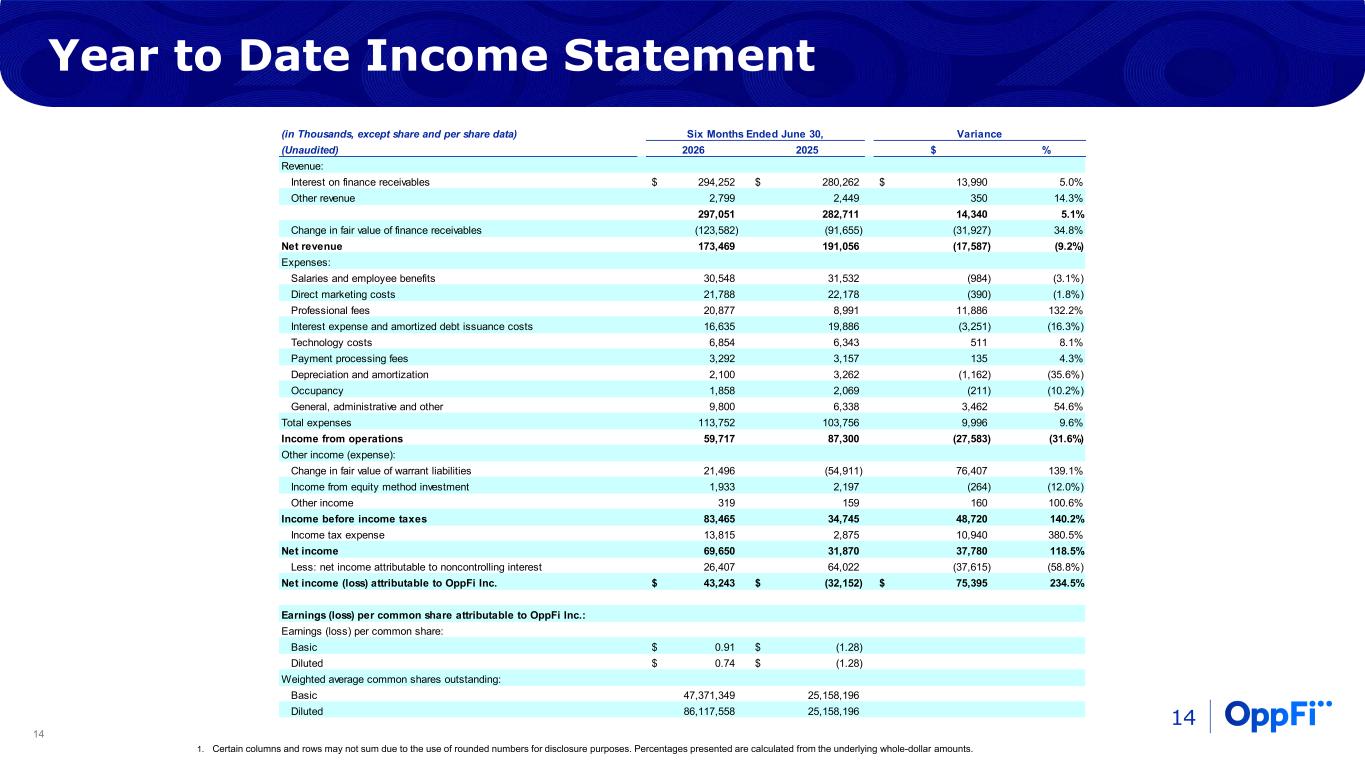
14 (in Thousands, except share and per share data) (Unaudited) 2026 2025 $ % Revenue: Interest on finance receivables 294,252$ 280,262$ 13,990$ 5.0% Other revenue 2,799 2,449 350 14.3% 297,051 282,711 14,340 5.1% Change in fair value of finance receivables (123,582) (91,655) (31,927) 34.8% Net revenue 173,469 191,056 (17,587) (9.2%) Expenses: Salaries and employee benefits 30,548 31,532 (984) (3.1%) Direct marketing costs 21,788 22,178 (390) (1.8%) Professional fees 20,877 8,991 11,886 132.2% Interest expense and amortized debt issuance costs 16,635 19,886 (3,251) (16.3%) Technology costs 6,854 6,343 511 8.1% Payment processing fees 3,292 3,157 135 4.3% Depreciation and amortization 2,100 3,262 (1,162) (35.6%) Occupancy 1,858 2,069 (211) (10.2%) General, administrative and other 9,800 6,338 3,462 54.6% Total expenses 113,752 103,756 9,996 9.6% Income from operations 59,717 87,300 (27,583) (31.6%) Other income (expense): Change in fair value of warrant liabilities 21,496 (54,911) 76,407 139.1% Income from equity method investment 1,933 2,197 (264) (12.0%) Other income 319 159 160 100.6% Income before income taxes 83,465 34,745 48,720 140.2% Income tax expense 13,815 2,875 10,940 380.5% Net income 69,650 31,870 37,780 118.5% Less: net income attributable to noncontrolling interest 26,407 64,022 (37,615) (58.8%) Net income (loss) attributable to OppFi Inc. 43,243$ (32,152)$ 75,395$ 234.5% Earnings (loss) per common share attributable to OppFi Inc.: Earnings (loss) per common share: Basic 0.91$ (1.28)$ Diluted 0.74$ (1.28)$ Weighted average common shares outstanding: Basic 47,371,349 25,158,196 Diluted 86,117,558 25,158,196 Six Months Ended June 30, Variance Year to Date Income Statement 14 1. Certain columns and rows may not sum due to the use of rounded numbers for disclosure purposes. Percentages presented are calculated from the underlying whole-dollar amounts.
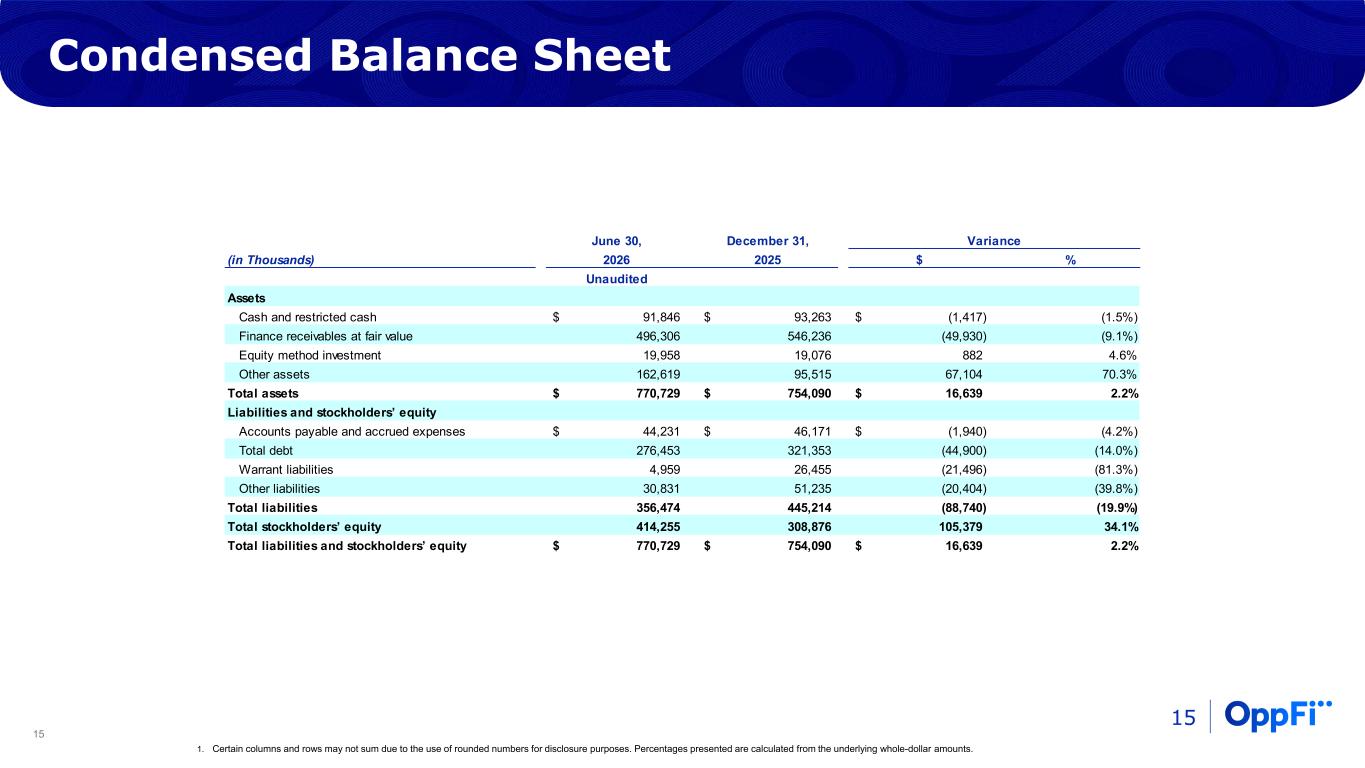
15 June 30, December 31, (in Thousands) 2026 2025 $ % Unaudited Assets Cash and restricted cash 91,846$ 93,263$ (1,417)$ (1.5%) Finance receivables at fair value 496,306 546,236 (49,930) (9.1%) Equity method investment 19,958 19,076 882 4.6% Other assets 162,619 95,515 67,104 70.3% Total assets 770,729$ 754,090$ 16,639$ 2.2% Liabilities and stockholders’ equity Accounts payable and accrued expenses 44,231$ 46,171$ (1,940)$ (4.2%) Total debt 276,453 321,353 (44,900) (14.0%) Warrant liabilities 4,959 26,455 (21,496) (81.3%) Other liabilities 30,831 51,235 (20,404) (39.8%) Total liabilities 356,474 445,214 (88,740) (19.9%) Total stockholders’ equity 414,255 308,876 105,379 34.1% Total liabilities and stockholders’ equity 770,729$ 754,090$ 16,639$ 2.2% Variance Condensed Balance Sheet 15 1. Certain columns and rows may not sum due to the use of rounded numbers for disclosure purposes. Percentages presented are calculated from the underlying whole-dollar amounts.
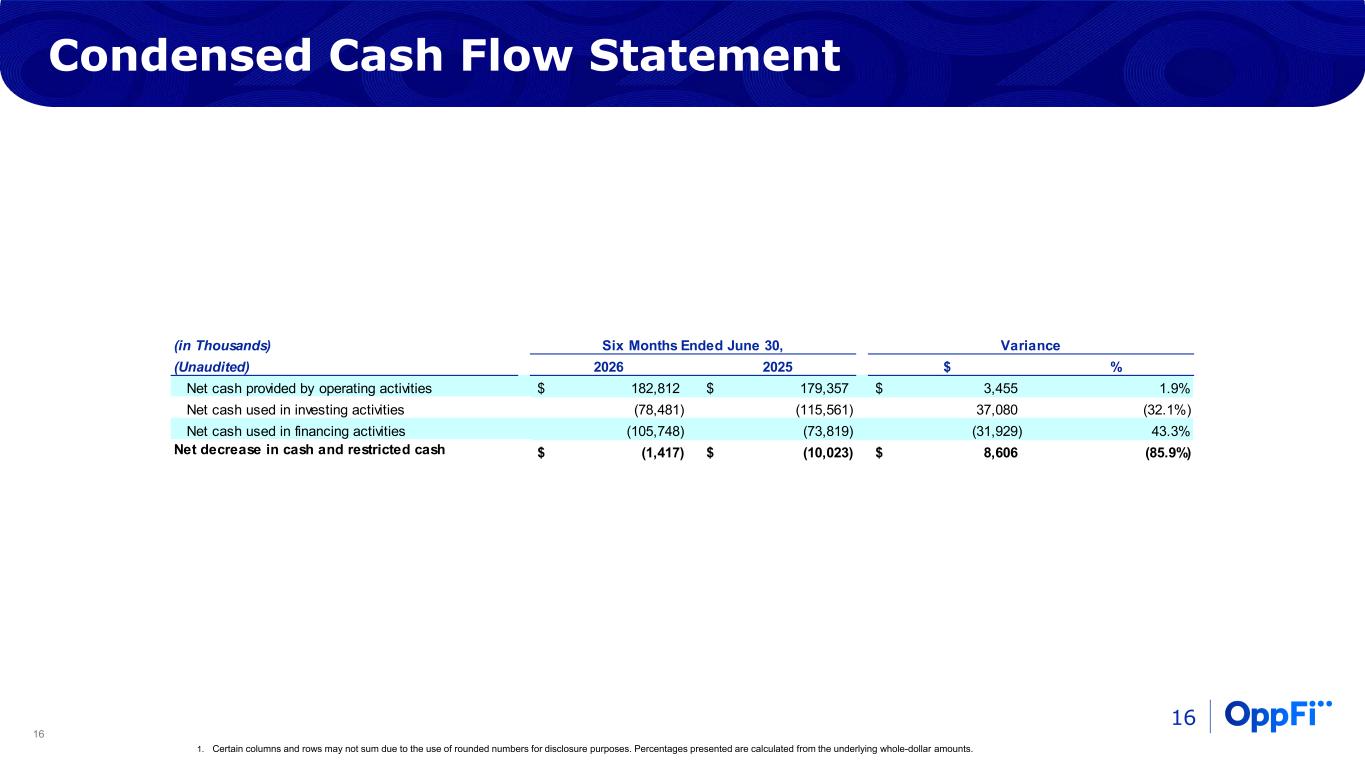
16 (in Thousands) (Unaudited) 2026 2025 $ % Net cash provided by operating activities 182,812$ 179,357$ 3,455$ 1.9% Net cash used in investing activities (78,481) (115,561) 37,080 (32.1%) Net cash used in financing activities (105,748) (73,819) (31,929) 43.3% Net decrease in cash and restricted cash (1,417)$ (10,023)$ 8,606$ (85.9%) Six Months Ended June 30, Variance Condensed Cash Flow Statement 16 1. Certain columns and rows may not sum due to the use of rounded numbers for disclosure purposes. Percentages presented are calculated from the underlying whole-dollar amounts.
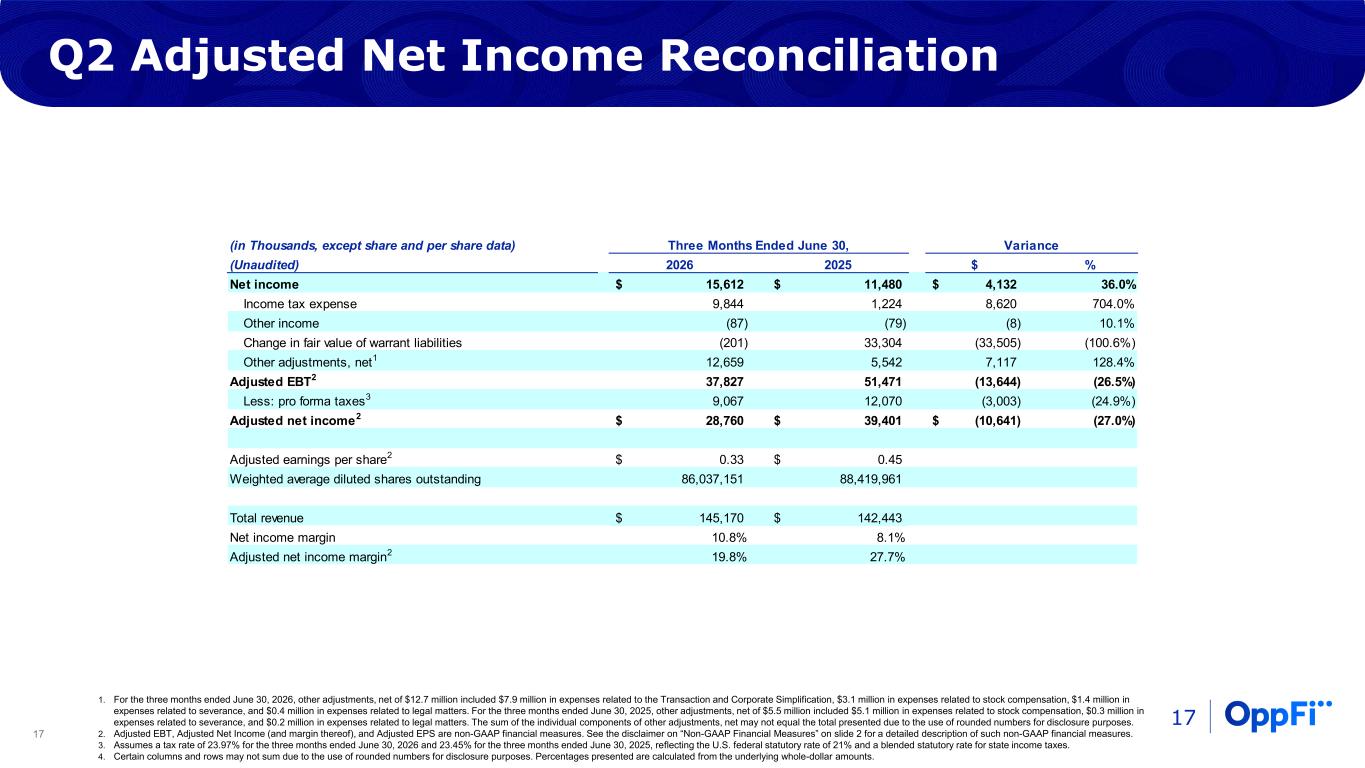
17 Q2 Adjusted Net Income Reconciliation 17 1. For the three months ended June 30, 2026, other adjustments, net of $12.7 million included $7.9 million in expenses related to the Transaction and Corporate Simplification, $3.1 million in expenses related to stock compensation, $1.4 million in expenses related to severance, and $0.4 million in expenses related to legal matters. For the three months ended June 30, 2025, other adjustments, net of $5.5 million included $5.1 million in expenses related to stock compensation, $0.3 million in expenses related to severance, and $0.2 million in expenses related to legal matters. The sum of the individual components of other adjustments, net may not equal the total presented due to the use of rounded numbers for disclosure purposes. 2. Adjusted EBT, Adjusted Net Income (and margin thereof), and Adjusted EPS are non-GAAP financial measures. See the disclaimer on “Non-GAAP Financial Measures” on slide 2 for a detailed description of such non-GAAP financial measures. 3. Assumes a tax rate of 23.97% for the three months ended June 30, 2026 and 23.45% for the three months ended June 30, 2025, reflecting the U.S. federal statutory rate of 21% and a blended statutory rate for state income taxes. 4. Certain columns and rows may not sum due to the use of rounded numbers for disclosure purposes. Percentages presented are calculated from the underlying whole-dollar amounts. (in Thousands, except share and per share data) (Unaudited) 2026 2025 $ % Net income 15,612$ 11,480$ 4,132$ 36.0% Income tax expense 9,844 1,224 8,620 704.0% Other income (87) (79) (8) 10.1% Change in fair value of warrant liabilities (201) 33,304 (33,505) (100.6%) Other adjustments, net1 12,659 5,542 7,117 128.4% Adjusted EBT2 37,827 51,471 (13,644) (26.5%) Less: pro forma taxes3 9,067 12,070 (3,003) (24.9%) Adjusted net income2 28,760$ 39,401$ (10,641)$ (27.0%) Adjusted earnings per share2 0.33$ 0.45$ Weighted average diluted shares outstanding 86,037,151 88,419,961 Total revenue 145,170$ 142,443$ Net income margin 10.8% 8.1% Adjusted net income margin2 19.8% 27.7% Three Months Ended June 30, Variance
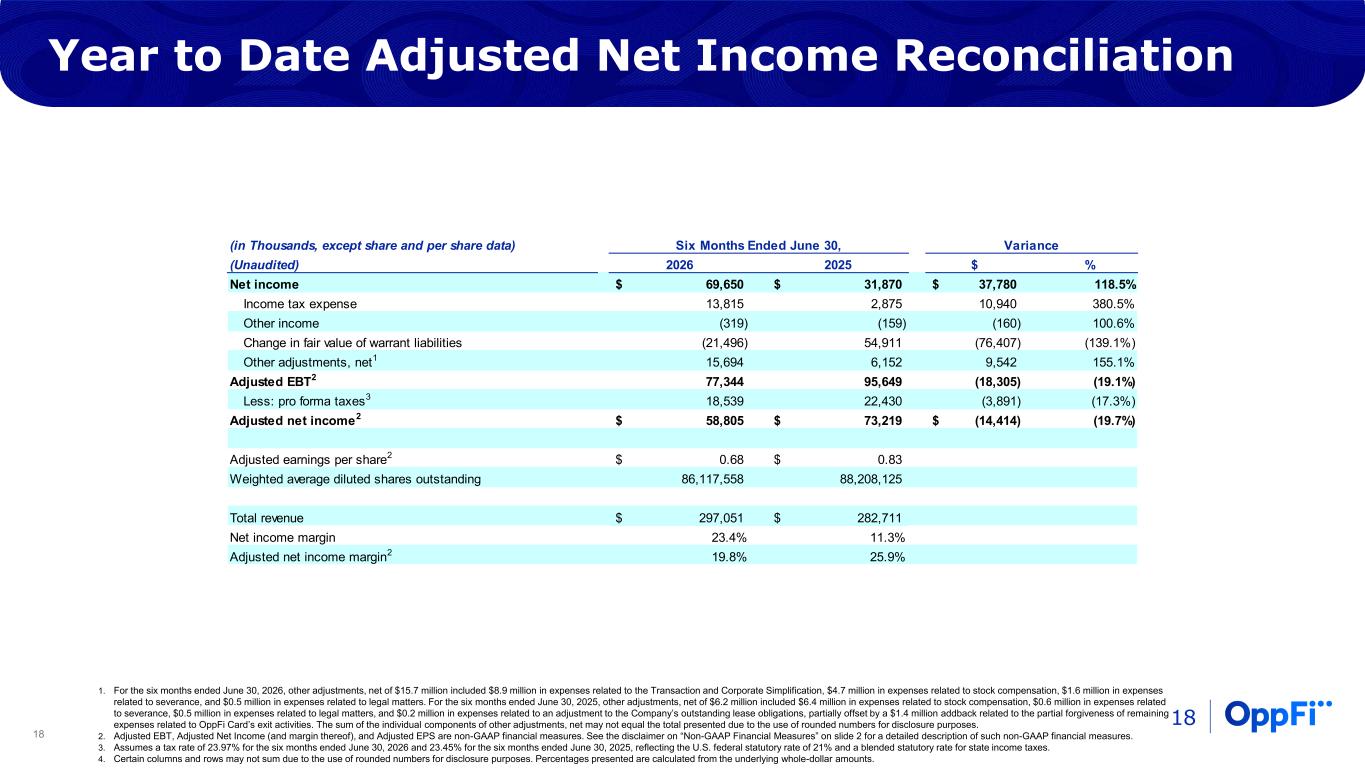
18 (in Thousands, except share and per share data) (Unaudited) 2026 2025 $ % Net income 69,650$ 31,870$ 37,780$ 118.5% Income tax expense 13,815 2,875 10,940 380.5% Other income (319) (159) (160) 100.6% Change in fair value of warrant liabilities (21,496) 54,911 (76,407) (139.1%) Other adjustments, net1 15,694 6,152 9,542 155.1% Adjusted EBT2 77,344 95,649 (18,305) (19.1%) Less: pro forma taxes3 18,539 22,430 (3,891) (17.3%) Adjusted net income2 58,805$ 73,219$ (14,414)$ (19.7%) Adjusted earnings per share2 0.68$ 0.83$ Weighted average diluted shares outstanding 86,117,558 88,208,125 Total revenue 297,051$ 282,711$ Net income margin 23.4% 11.3% Adjusted net income margin2 19.8% 25.9% Six Months Ended June 30, Variance Year to Date Adjusted Net Income Reconciliation 18 1. For the six months ended June 30, 2026, other adjustments, net of $15.7 million included $8.9 million in expenses related to the Transaction and Corporate Simplification, $4.7 million in expenses related to stock compensation, $1.6 million in expenses related to severance, and $0.5 million in expenses related to legal matters. For the six months ended June 30, 2025, other adjustments, net of $6.2 million included $6.4 million in expenses related to stock compensation, $0.6 million in expenses related to severance, $0.5 million in expenses related to legal matters, and $0.2 million in expenses related to an adjustment to the Company’s outstanding lease obligations, partially offset by a $1.4 million addback related to the partial forgiveness of remaining expenses related to OppFi Card’s exit activities. The sum of the individual components of other adjustments, net may not equal the total presented due to the use of rounded numbers for disclosure purposes. 2. Adjusted EBT, Adjusted Net Income (and margin thereof), and Adjusted EPS are non-GAAP financial measures. See the disclaimer on “Non-GAAP Financial Measures” on slide 2 for a detailed description of such non-GAAP financial measures. 3. Assumes a tax rate of 23.97% for the six months ended June 30, 2026 and 23.45% for the six months ended June 30, 2025, reflecting the U.S. federal statutory rate of 21% and a blended statutory rate for state income taxes. 4. Certain columns and rows may not sum due to the use of rounded numbers for disclosure purposes. Percentages presented are calculated from the underlying whole-dollar amounts.
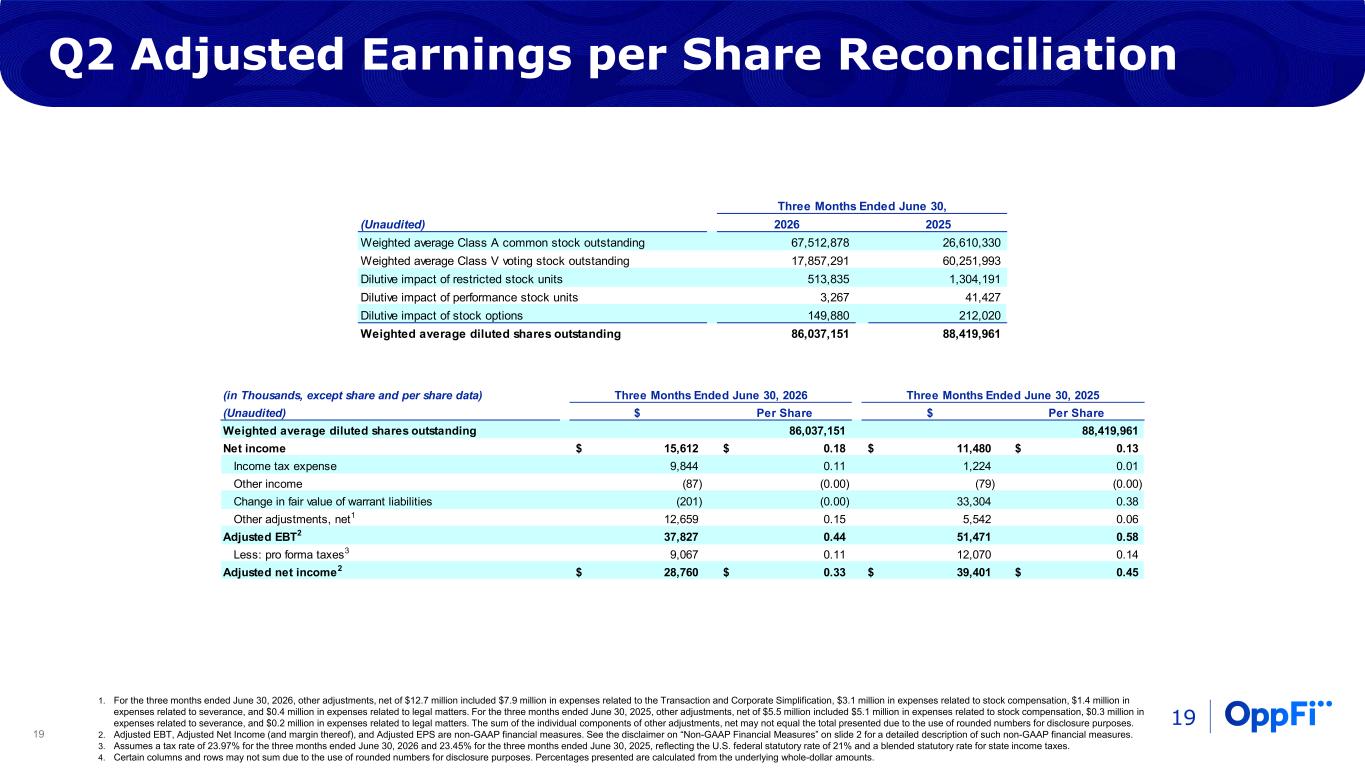
19 (in Thousands, except share and per share data) (Unaudited) $ Per Share $ Per Share Weighted average diluted shares outstanding 86,037,151 88,419,961 Net income 15,612$ 0.18$ 11,480$ 0.13$ Income tax expense 9,844 0.11 1,224 0.01 Other income (87) (0.00) (79) (0.00) Change in fair value of warrant liabilities (201) (0.00) 33,304 0.38 Other adjustments, net1 12,659 0.15 5,542 0.06 Adjusted EBT2 37,827 0.44 51,471 0.58 Less: pro forma taxes3 9,067 0.11 12,070 0.14 Adjusted net income2 28,760$ 0.33$ 39,401$ 0.45$ Three Months Ended June 30, 2025Three Months Ended June 30, 2026 (Unaudited) 2026 2025 Weighted average Class A common stock outstanding 67,512,878 26,610,330 Weighted average Class V voting stock outstanding 17,857,291 60,251,993 Dilutive impact of restricted stock units 513,835 1,304,191 Dilutive impact of performance stock units 3,267 41,427 Dilutive impact of stock options 149,880 212,020 Weighted average diluted shares outstanding 86,037,151 88,419,961 Three Months Ended June 30, Q2 Adjusted Earnings per Share Reconciliation 19 1. For the three months ended June 30, 2026, other adjustments, net of $12.7 million included $7.9 million in expenses related to the Transaction and Corporate Simplification, $3.1 million in expenses related to stock compensation, $1.4 million in expenses related to severance, and $0.4 million in expenses related to legal matters. For the three months ended June 30, 2025, other adjustments, net of $5.5 million included $5.1 million in expenses related to stock compensation, $0.3 million in expenses related to severance, and $0.2 million in expenses related to legal matters. The sum of the individual components of other adjustments, net may not equal the total presented due to the use of rounded numbers for disclosure purposes. 2. Adjusted EBT, Adjusted Net Income (and margin thereof), and Adjusted EPS are non-GAAP financial measures. See the disclaimer on “Non-GAAP Financial Measures” on slide 2 for a detailed description of such non-GAAP financial measures. 3. Assumes a tax rate of 23.97% for the three months ended June 30, 2026 and 23.45% for the three months ended June 30, 2025, reflecting the U.S. federal statutory rate of 21% and a blended statutory rate for state income taxes. 4. Certain columns and rows may not sum due to the use of rounded numbers for disclosure purposes. Percentages presented are calculated from the underlying whole-dollar amounts.
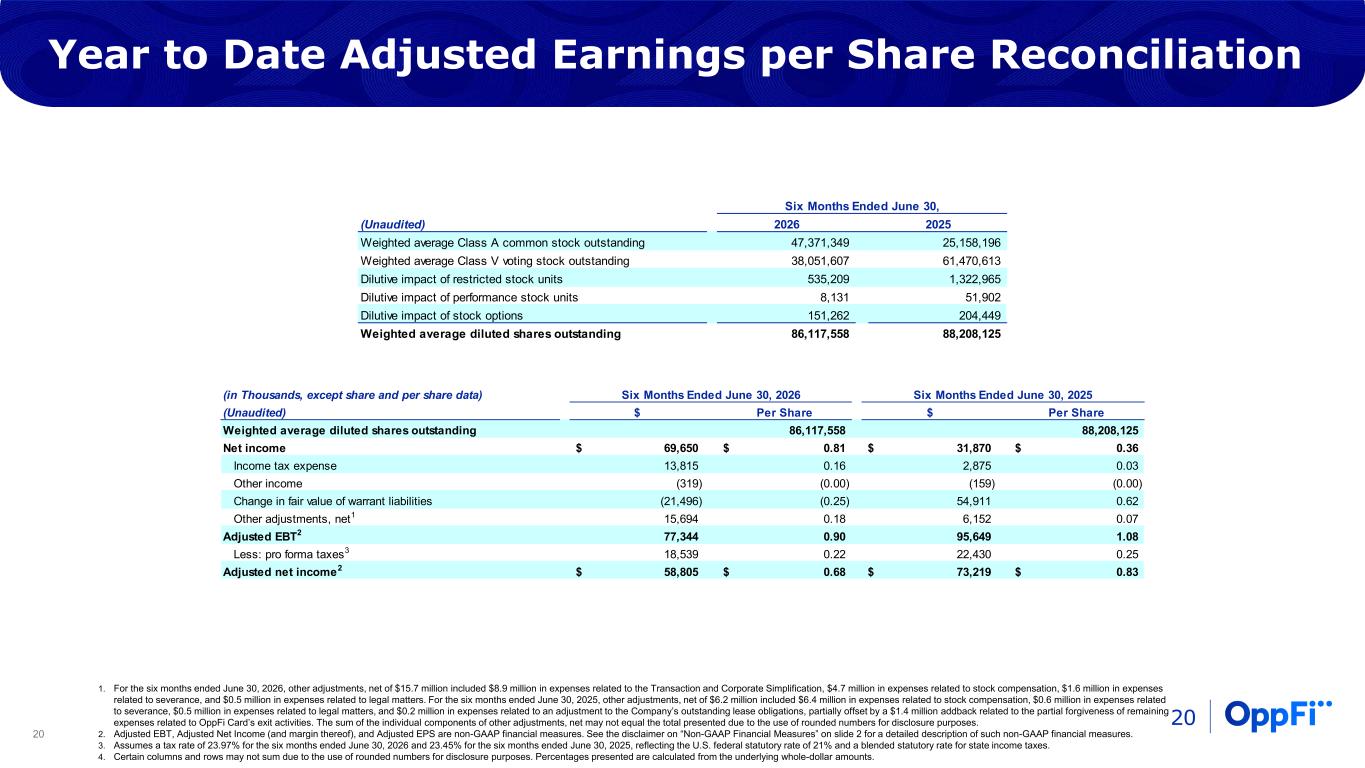
20 (in Thousands, except share and per share data) (Unaudited) $ Per Share $ Per Share Weighted average diluted shares outstanding 86,117,558 88,208,125 Net income 69,650$ 0.81$ 31,870$ 0.36$ Income tax expense 13,815 0.16 2,875 0.03 Other income (319) (0.00) (159) (0.00) Change in fair value of warrant liabilities (21,496) (0.25) 54,911 0.62 Other adjustments, net1 15,694 0.18 6,152 0.07 Adjusted EBT2 77,344 0.90 95,649 1.08 Less: pro forma taxes3 18,539 0.22 22,430 0.25 Adjusted net income2 58,805$ 0.68$ 73,219$ 0.83$ Six Months Ended June 30, 2026 Six Months Ended June 30, 2025 (Unaudited) 2026 2025 Weighted average Class A common stock outstanding 47,371,349 25,158,196 Weighted average Class V voting stock outstanding 38,051,607 61,470,613 Dilutive impact of restricted stock units 535,209 1,322,965 Dilutive impact of performance stock units 8,131 51,902 Dilutive impact of stock options 151,262 204,449 Weighted average diluted shares outstanding 86,117,558 88,208,125 Six Months Ended June 30, Year to Date Adjusted Earnings per Share Reconciliation 20 1. For the six months ended June 30, 2026, other adjustments, net of $15.7 million included $8.9 million in expenses related to the Transaction and Corporate Simplification, $4.7 million in expenses related to stock compensation, $1.6 million in expenses related to severance, and $0.5 million in expenses related to legal matters. For the six months ended June 30, 2025, other adjustments, net of $6.2 million included $6.4 million in expenses related to stock compensation, $0.6 million in expenses related to severance, $0.5 million in expenses related to legal matters, and $0.2 million in expenses related to an adjustment to the Company’s outstanding lease obligations, partially offset by a $1.4 million addback related to the partial forgiveness of remaining expenses related to OppFi Card’s exit activities. The sum of the individual components of other adjustments, net may not equal the total presented due to the use of rounded numbers for disclosure purposes. 2. Adjusted EBT, Adjusted Net Income (and margin thereof), and Adjusted EPS are non-GAAP financial measures. See the disclaimer on “Non-GAAP Financial Measures” on slide 2 for a detailed description of such non-GAAP financial measures. 3. Assumes a tax rate of 23.97% for the six months ended June 30, 2026 and 23.45% for the six months ended June 30, 2025, reflecting the U.S. federal statutory rate of 21% and a blended statutory rate for state income taxes. 4. Certain columns and rows may not sum due to the use of rounded numbers for disclosure purposes. Percentages presented are calculated from the underlying whole-dollar amounts.
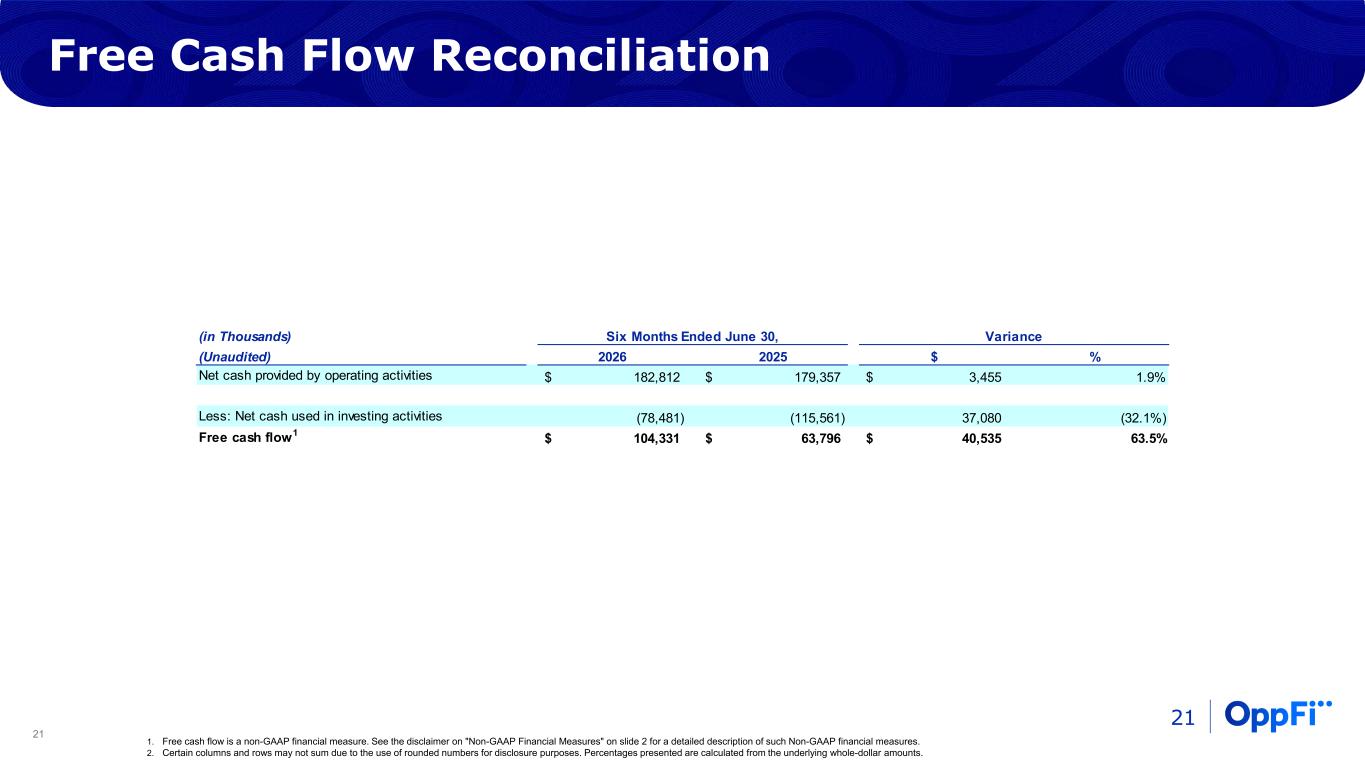
21 (in Thousands) (Unaudited) 2026 2025 $ % Net cash provided by operating activities 182,812$ 179,357$ 3,455$ 1.9% Less: Net cash used in investing activities (78,481) (115,561) 37,080 (32.1%) Free cash flow1 104,331$ 63,796$ 40,535$ 63.5% Six Months Ended June 30, Variance Free Cash Flow Reconciliation 21 1. Free cash flow is a non-GAAP financial measure. See the disclaimer on "Non-GAAP Financial Measures" on slide 2 for a detailed description of such Non-GAAP financial measures. 2. Certain columns and rows may not sum due to the use of rounded numbers for disclosure purposes. Percentages presented are calculated from the underlying whole-dollar amounts.

Thank You