This disclosure has been prepared in accordance with the SEC's pay versus performance rules in Item 402(v) of Regulation S-K under the 1934 Act (Item 402(v)) and does not necessarily reflect value actually realized by the NEOs or how the Compensation Committee evaluates compensation decisions in light of Company or individual performance. For discussion of how the Compensation Committee seeks to align pay with performance when making compensation decisions, please review the Compensation Discussion and Analysis beginning on page 49.
The following tables and related disclosures provide information about (i) the total compensation (SCT Total) of our principal executive officer (PEO) and our non-PEO Named Executive Officers (collectively, the Other NEOs) as presented in the Summary Compensation Table on page 66, (ii) the “compensation actually paid” (CAP) to our PEO and our Other NEOs, as calculated pursuant to Item 402(v), (iii) certain financial performance measures, and (iv) the relationship of the CAP to those financial performance measures for fiscal years 2022, 2023, 2024, 2025, and 2026:
|
|
|
|
|
|
|
|
|
|
|
|
|
|
|
|||
|
|
|
|
|
|
|
|
|
|
Value of Initial Fixed $100 |
|
|
|
|
|
||
|
|
|
|
|
|
|
|
|
|
|
|
|
|
|
|
|
|
Year(1) |
|
Summary |
|
Compensation Actually Paid to PEO (3) |
|
Average |
|
Average |
|
Total |
|
Peer |
|
Net Income |
|
Adjusted |
|
|
|
|
|
|
|
|
|
|
|
|
|
|
|
|
|
|
|
(a) |
|
(b) |
|
(c) |
|
(d) |
|
(e) |
|
(f) |
|
(g) |
|
(h) |
|
(i) |
|
2026 |
|
34,815,979 |
|
34,835,170 |
|
4,028,759 |
|
3,333,605 |
|
167.89 |
|
140.02 |
|
1,206.7 |
|
10.64 |
|
2025 |
|
13,995,870 |
|
31,605,527 |
|
3,721,506 |
|
6,930,068 |
|
162.94 |
|
121.94 |
|
1,049.6 |
|
9.55 |
|
2024 |
|
12,004,427 |
|
6,594,758 |
|
3,657,728 |
|
1,906,365 |
|
113.94 |
|
101.59 |
|
1,027.6 |
|
8.88 |
|
2023 |
|
8,500,029 |
|
15,246,533 |
|
3,205,321 |
|
5,905,006 |
|
120.36 |
|
87.89 |
|
981.9 |
|
8.00 |
|
2022 |
|
11,891,841 |
|
8,852,886 |
|
3,517,201 |
|
2,886,390 |
|
90.76 |
|
88.99 |
|
952.8 |
|
7.40 |
|
(1) “Year” means the fiscal year.
(2) PEO means:
Fiscal 2026 |
|
Ricardo Cardenas |
Fiscal 2025 |
|
Ricardo Cardenas |
Fiscal 2024 |
|
Ricardo Cardenas |
Fiscal 2023 |
|
Ricardo Cardenas |
Fiscal 2022 |
|
Eugene I. Lee, Jr. |
(3) Adjustments to Calculate Compensation Actually Paid to PEO (Column (c)):
Items Adjusted |
|
2026 |
|
|
2025 |
|
|
2024 |
|
|
2023 |
|
|
2022 |
|
|
|||||
|
|
|
|
|
|
|
|
|
|
|
|
|
|
|
|
|
|||||
Reported Summary Compensation Table |
|
|
34,815,979 |
|
|
|
13,995,870 |
|
|
|
12,004,427 |
|
|
|
8,500,029 |
|
|
|
11,891,841 |
|
|
|
|
|
|
|
|
|
|
|
|
|
|
|
|
|
|
|
|||||
|
|
|
|
|
|
|
|
|
|
|
|
|
|
|
|
|
|||||
Reported Value Equity Awards |
|
|
(28,259,248 |
) |
|
|
(10,298,173 |
) |
|
|
(8,696,601 |
) |
|
|
(5,562,526 |
) |
|
|
(5,982,682 |
) |
|
|
|
|
|
|
|
|
|
|
|
|
|
|
|
|
|
|
|||||
|
|
|
|
|
|
|
|
|
|
|
|
|
|
|
|
|
|||||
Year-End Fair Value of Outstanding Equity Awards Granted in Year |
|
|
30,223,839 |
|
|
|
19,505,238 |
|
|
|
6,203,936 |
|
|
|
9,961,422 |
|
|
|
5,163,812 |
|
|
|
|
|
|
|
|
|
|
|
|
|
|
|
|
|
|
|
|||||
|
|
|
|
|
|
|
|
|
|
|
|
|
|
|
|
|
|||||
Year Over Year Change in Fair Value of Outstanding Unvested Equity Granted in Prior Years |
|
|
(3,906,925 |
) |
|
|
7,450,520 |
|
|
|
(3,763,992 |
) |
|
|
2,219,441 |
|
|
|
(2,838,468 |
) |
|
|
|
|
|
|
|
|
|
|
|
|
|
|
|
|
|
|
|||||
|
|
|
|
|
|
|
|
|
|
|
|
|
|
|
|
|
|||||
Year Over Year Change in Fair Value of Equity Granted in Prior Years and Vested in Year |
|
|
(11,070 |
) |
|
|
(133,299 |
) |
|
|
157,113 |
|
|
|
(181,368 |
) |
|
|
(167,098 |
) |
|
|
|
|
|
|
|
|
|
|
|
|
|
|
|
|
|
|
|||||
|
|
|
|
|
|
|
|
|
|
|
|
|
|
|
|
|
|||||
Value of Dividends Paid on Unvested Equity |
|
|
1,972,594 |
|
|
|
1,085,371 |
|
|
|
689,875 |
|
|
|
309,535 |
|
|
|
785,481 |
|
|
|
|
|
|
|
|
|
|
|
|
|
|
|
|
|
|
|
|||||
|
|
|
|
|
|
|
|
|
|
|
|
|
|
|
|
|
|||||
Compensation Actually Paid |
|
|
34,835,170 |
|
|
|
31,605,527 |
|
|
|
6,594,758 |
|
|
|
15,246,533 |
|
|
|
8,852,886 |
|
|
|
|
|
|
|
|
|
|
|
|
|
|
|
|
|
|
|
|||||
4) Non-PEO NEOs include:
Fiscal 2026 |
|
Matthew R. Broad, Todd A. Burrowes, Sarah H. King, M. John Martin, Rajesh Vennam |
Fiscal 2025 |
|
Todd A. Burrowes, Daniel J. Kiernan, Matthew R. Broad, Rajesh Vennam |
Fiscal 2024 |
|
Todd A. Burrowes, Daniel J. Kiernan, M. John Martin, Rajesh Vennam |
Fiscal 2023 |
|
Todd A. Burrowes, Ricardo Cardenas, M. John Martin, Rajesh Vennam |
Fiscal 2022 |
|
Todd A. Burrowes, Ricardo Cardenas, M. John Martin, Rajesh Vennam |
(5) Adjustments to Calculate Average Compensation Actually Paid to Other NEOs (Column (e)):
Items Adjusted |
|
2026 |
|
2025 |
|
|
2024 |
|
|
2023 |
|
|
2022 |
|
|
|||||
|
|
|
|
|
|
|
|
|
|
|
|
|
|
|
|
|||||
Reported Summary Compensation Table |
|
|
4,028,759 |
|
|
3,721,506 |
|
|
|
3,657,728 |
|
|
|
3,205,321 |
|
|
|
3,517,201 |
|
|
|
|
|
|
|
|
|
|
|
|
|
|
|
|
|
|
|||||
|
|
|
|
|
|
|
|
|
|
|
|
|
|
|
|
|||||
Reported Value Equity Awards |
|
|
(1,967,741 |
) |
|
(2,031,826 |
) |
|
|
(1,884,232 |
) |
|
|
(1,668,767 |
) |
|
|
(1,577,189 |
) |
|
|
|
|
|
|
|
|
|
|
|
|
|
|
|
|
|
|||||
|
|
|
|
|
|
|
|
|
|
|
|
|
|
|
|
|||||
Year-End Fair Value of Outstanding Equity Awards Granted in Year |
|
|
1,616,239 |
|
|
3,848,379 |
|
|
|
1,344,165 |
|
|
|
2,988,436 |
|
|
|
1,361,314 |
|
|
|
|
|
|
|
|
|
|
|
|
|
|
|
|
|
|
|||||
|
|
|
|
|
|
|
|
|
|
|
|
|
|
|
|
|||||
Vesting Date Fair Value of Equity Awards Granted in Covered Year That Vested in Covered Year |
|
|
134,210 |
|
|
— |
|
|
|
— |
|
|
|
— |
|
|
|
— |
|
|
|
|
|
|
|
|
|
|
|
|
|
|
|
|
|
|
|||||
|
|
|
|
|
|
|
|
|
|
|
|
|
|
|
|
|||||
Year Over Year Change in Fair Value of Outstanding Unvested Equity Granted in Prior Years |
|
|
(706,726 |
) |
|
1,929,616 |
|
|
|
(1,524,150 |
) |
|
|
1,307,395 |
|
|
|
(550,759 |
) |
|
|
|
|
|
|
|
|
|
|
|
|
|
|
|
|
|
|||||
|
|
|
|
|
|
|
|
|
|
|
|
|
|
|
|
|||||
Year Over Year Change in Fair Value of Equity Granted in Prior Years and Vested in Year |
|
|
(68,774 |
) |
|
(840,828 |
) |
|
|
77,967 |
|
|
|
(87,150 |
) |
|
|
(29,572 |
) |
|
|
|
|
|
|
|
|
|
|
|
|
|
|
|
|
|
|||||
|
|
|
|
|
|
|
|
|
|
|
|
|
|
|
|
|||||
Value of Dividends Paid on Unvested Equity |
|
|
297,639 |
|
|
303,221 |
|
|
|
234,887 |
|
|
|
159,771 |
|
|
|
165,395 |
|
|
|
|
|
|
|
|
|
|
|
|
|
|
|
|
|
|
|||||
|
|
|
|
|
|
|
|
|
|
|
|
|
|
|
|
|||||
Compensation Actually Paid |
|
|
3,333,605 |
|
|
6,930,068 |
|
|
|
1,906,365 |
|
|
|
5,905,006 |
|
|
|
2,886,390 |
|
|
|
|
|
|
|
|
|
|
|
|
|
|
|
|
|
|
|||||
(6) Represents the cumulative TSR of the S&P Consumer Discretionary Select Sector Index.
(7) The dollar amount represents the amount of net income reported in the Company’s audited financial statements for the applicable fiscal year.
(8) Adjusted Darden Diluted Net EPS was selected as the Company-Selected Measure. A detailed Adjusted EPS reconciliation can be found in the "Compensation Discussion and Analysis" section of the Company’s Proxy Statement for the applicable fiscal year, each as filed with the SEC on August 8, 2022, August 7, 2023, August 5, 2024, August 4, 2025, and August 10, 2026, respectively.
Fiscal 2026 |
|
Matthew R. Broad, Todd A. Burrowes, Sarah H. King, M. John Martin, Rajesh Vennam |
Fiscal 2025 |
|
Todd A. Burrowes, Daniel J. Kiernan, Matthew R. Broad, Rajesh Vennam |
Fiscal 2024 |
|
Todd A. Burrowes, Daniel J. Kiernan, M. John Martin, Rajesh Vennam |
Fiscal 2023 |
|
Todd A. Burrowes, Ricardo Cardenas, M. John Martin, Rajesh Vennam |
Fiscal 2022 |
|
Todd A. Burrowes, Ricardo Cardenas, M. John Martin, Rajesh Vennam |
Items Adjusted |
|
2026 |
|
|
2025 |
|
|
2024 |
|
|
2023 |
|
|
2022 |
|
|
|||||
|
|
|
|
|
|
|
|
|
|
|
|
|
|
|
|
|
|||||
Reported Summary Compensation Table |
|
|
34,815,979 |
|
|
|
13,995,870 |
|
|
|
12,004,427 |
|
|
|
8,500,029 |
|
|
|
11,891,841 |
|
|
|
|
|
|
|
|
|
|
|
|
|
|
|
|
|
|
|
|||||
|
|
|
|
|
|
|
|
|
|
|
|
|
|
|
|
|
|||||
Reported Value Equity Awards |
|
|
(28,259,248 |
) |
|
|
(10,298,173 |
) |
|
|
(8,696,601 |
) |
|
|
(5,562,526 |
) |
|
|
(5,982,682 |
) |
|
|
|
|
|
|
|
|
|
|
|
|
|
|
|
|
|
|
|||||
|
|
|
|
|
|
|
|
|
|
|
|
|
|
|
|
|
|||||
Year-End Fair Value of Outstanding Equity Awards Granted in Year |
|
|
30,223,839 |
|
|
|
19,505,238 |
|
|
|
6,203,936 |
|
|
|
9,961,422 |
|
|
|
5,163,812 |
|
|
|
|
|
|
|
|
|
|
|
|
|
|
|
|
|
|
|
|||||
|
|
|
|
|
|
|
|
|
|
|
|
|
|
|
|
|
|||||
Year Over Year Change in Fair Value of Outstanding Unvested Equity Granted in Prior Years |
|
|
(3,906,925 |
) |
|
|
7,450,520 |
|
|
|
(3,763,992 |
) |
|
|
2,219,441 |
|
|
|
(2,838,468 |
) |
|
|
|
|
|
|
|
|
|
|
|
|
|
|
|
|
|
|
|||||
|
|
|
|
|
|
|
|
|
|
|
|
|
|
|
|
|
|||||
Year Over Year Change in Fair Value of Equity Granted in Prior Years and Vested in Year |
|
|
(11,070 |
) |
|
|
(133,299 |
) |
|
|
157,113 |
|
|
|
(181,368 |
) |
|
|
(167,098 |
) |
|
|
|
|
|
|
|
|
|
|
|
|
|
|
|
|
|
|
|||||
|
|
|
|
|
|
|
|
|
|
|
|
|
|
|
|
|
|||||
Value of Dividends Paid on Unvested Equity |
|
|
1,972,594 |
|
|
|
1,085,371 |
|
|
|
689,875 |
|
|
|
309,535 |
|
|
|
785,481 |
|
|
|
|
|
|
|
|
|
|
|
|
|
|
|
|
|
|
|
|||||
|
|
|
|
|
|
|
|
|
|
|
|
|
|
|
|
|
|||||
Compensation Actually Paid |
|
|
34,835,170 |
|
|
|
31,605,527 |
|
|
|
6,594,758 |
|
|
|
15,246,533 |
|
|
|
8,852,886 |
|
|
|
|
|
|
|
|
|
|
|
|
|
|
|
|
|
|
|
|||||
Items Adjusted |
|
2026 |
|
2025 |
|
|
2024 |
|
|
2023 |
|
|
2022 |
|
|
|||||
|
|
|
|
|
|
|
|
|
|
|
|
|
|
|
|
|||||
Reported Summary Compensation Table |
|
|
4,028,759 |
|
|
3,721,506 |
|
|
|
3,657,728 |
|
|
|
3,205,321 |
|
|
|
3,517,201 |
|
|
|
|
|
|
|
|
|
|
|
|
|
|
|
|
|
|
|||||
|
|
|
|
|
|
|
|
|
|
|
|
|
|
|
|
|||||
Reported Value Equity Awards |
|
|
(1,967,741 |
) |
|
(2,031,826 |
) |
|
|
(1,884,232 |
) |
|
|
(1,668,767 |
) |
|
|
(1,577,189 |
) |
|
|
|
|
|
|
|
|
|
|
|
|
|
|
|
|
|
|||||
|
|
|
|
|
|
|
|
|
|
|
|
|
|
|
|
|||||
Year-End Fair Value of Outstanding Equity Awards Granted in Year |
|
|
1,616,239 |
|
|
3,848,379 |
|
|
|
1,344,165 |
|
|
|
2,988,436 |
|
|
|
1,361,314 |
|
|
|
|
|
|
|
|
|
|
|
|
|
|
|
|
|
|
|||||
|
|
|
|
|
|
|
|
|
|
|
|
|
|
|
|
|||||
Vesting Date Fair Value of Equity Awards Granted in Covered Year That Vested in Covered Year |
|
|
134,210 |
|
|
— |
|
|
|
— |
|
|
|
— |
|
|
|
— |
|
|
|
|
|
|
|
|
|
|
|
|
|
|
|
|
|
|
|||||
|
|
|
|
|
|
|
|
|
|
|
|
|
|
|
|
|||||
Year Over Year Change in Fair Value of Outstanding Unvested Equity Granted in Prior Years |
|
|
(706,726 |
) |
|
1,929,616 |
|
|
|
(1,524,150 |
) |
|
|
1,307,395 |
|
|
|
(550,759 |
) |
|
|
|
|
|
|
|
|
|
|
|
|
|
|
|
|
|
|||||
|
|
|
|
|
|
|
|
|
|
|
|
|
|
|
|
|||||
Year Over Year Change in Fair Value of Equity Granted in Prior Years and Vested in Year |
|
|
(68,774 |
) |
|
(840,828 |
) |
|
|
77,967 |
|
|
|
(87,150 |
) |
|
|
(29,572 |
) |
|
|
|
|
|
|
|
|
|
|
|
|
|
|
|
|
|
|||||
|
|
|
|
|
|
|
|
|
|
|
|
|
|
|
|
|||||
Value of Dividends Paid on Unvested Equity |
|
|
297,639 |
|
|
303,221 |
|
|
|
234,887 |
|
|
|
159,771 |
|
|
|
165,395 |
|
|
|
|
|
|
|
|
|
|
|
|
|
|
|
|
|
|
|||||
|
|
|
|
|
|
|
|
|
|
|
|
|
|
|
|
|||||
Compensation Actually Paid |
|
|
3,333,605 |
|
|
6,930,068 |
|
|
|
1,906,365 |
|
|
|
5,905,006 |
|
|
|
2,886,390 |
|
|
|
|
|
|
|
|
|
|
|
|
|
|
|
|
|
|
|||||
Compensation Actually Paid and Cumulative TSR
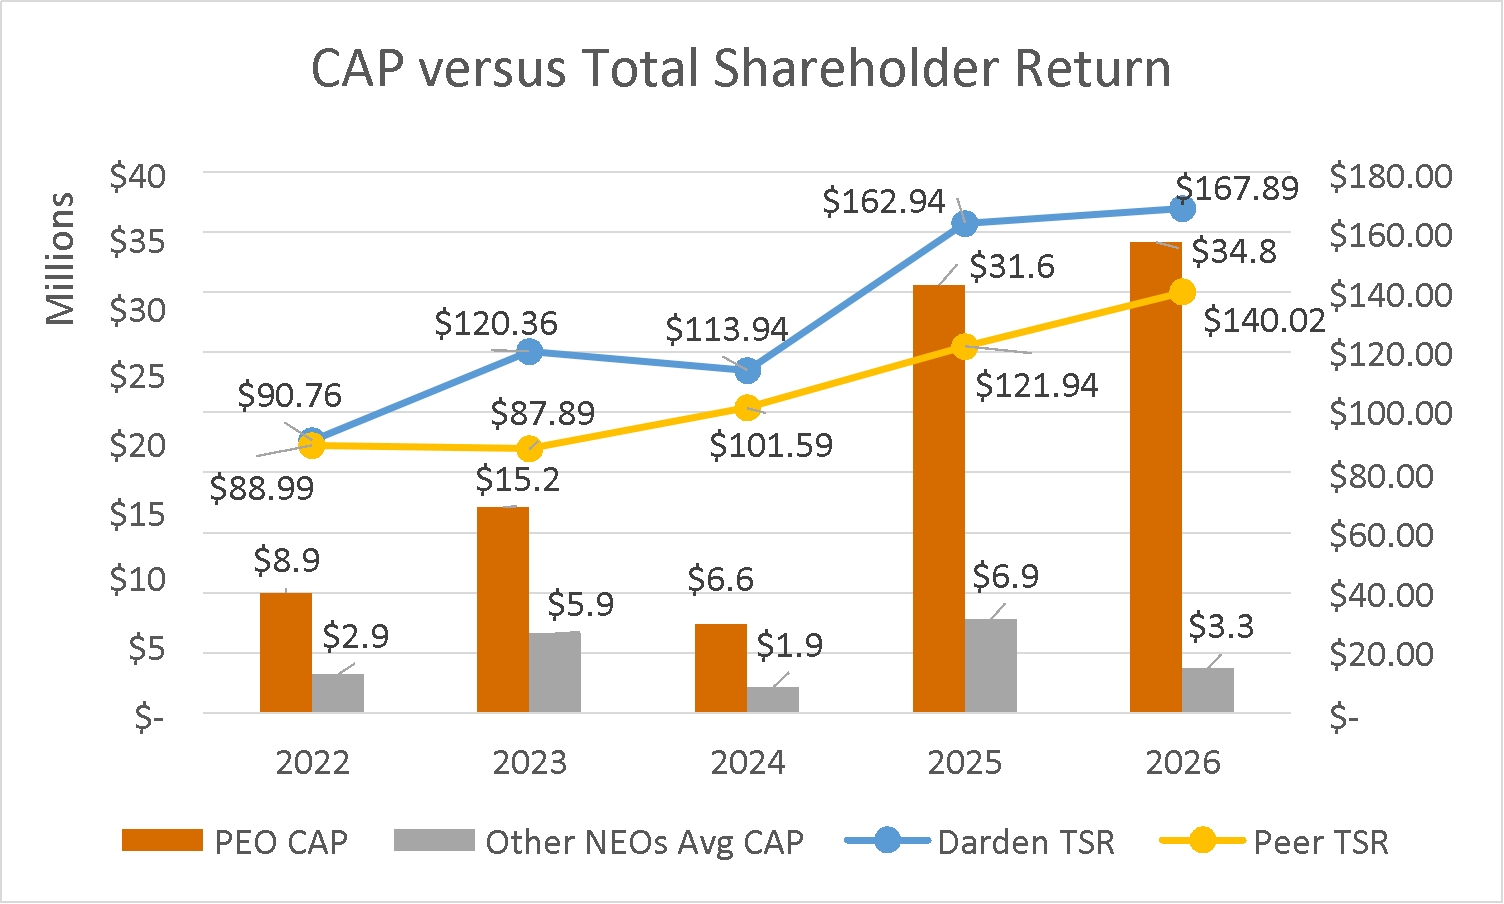
The table below shows the relationship between the amount of compensation actually paid to the PEO and the average amount of compensation actually paid to the Company’s NEOs as a group and the Company’s Total Shareholder Return and Total Shareholder Return of our peer group, the S&P Consumer Discretionary Select Sector Index. Neither the Company’s Total Shareholder Return nor the peer group Total Shareholder Return are performance metrics in the Company’s incentive plans. The Company’s Total Shareholder return as a percentile rank versus the Total Shareholder Return of the constituents of a different peer group is a performance measure in the Company’s Performance Stock Unit Awards. Please see the "Compensation Discussion and Analysis" section in this Proxy Statement for a description of the Company’s Executive Compensation Philosophy and Strategy.
Compensation Actually Paid and Net Income
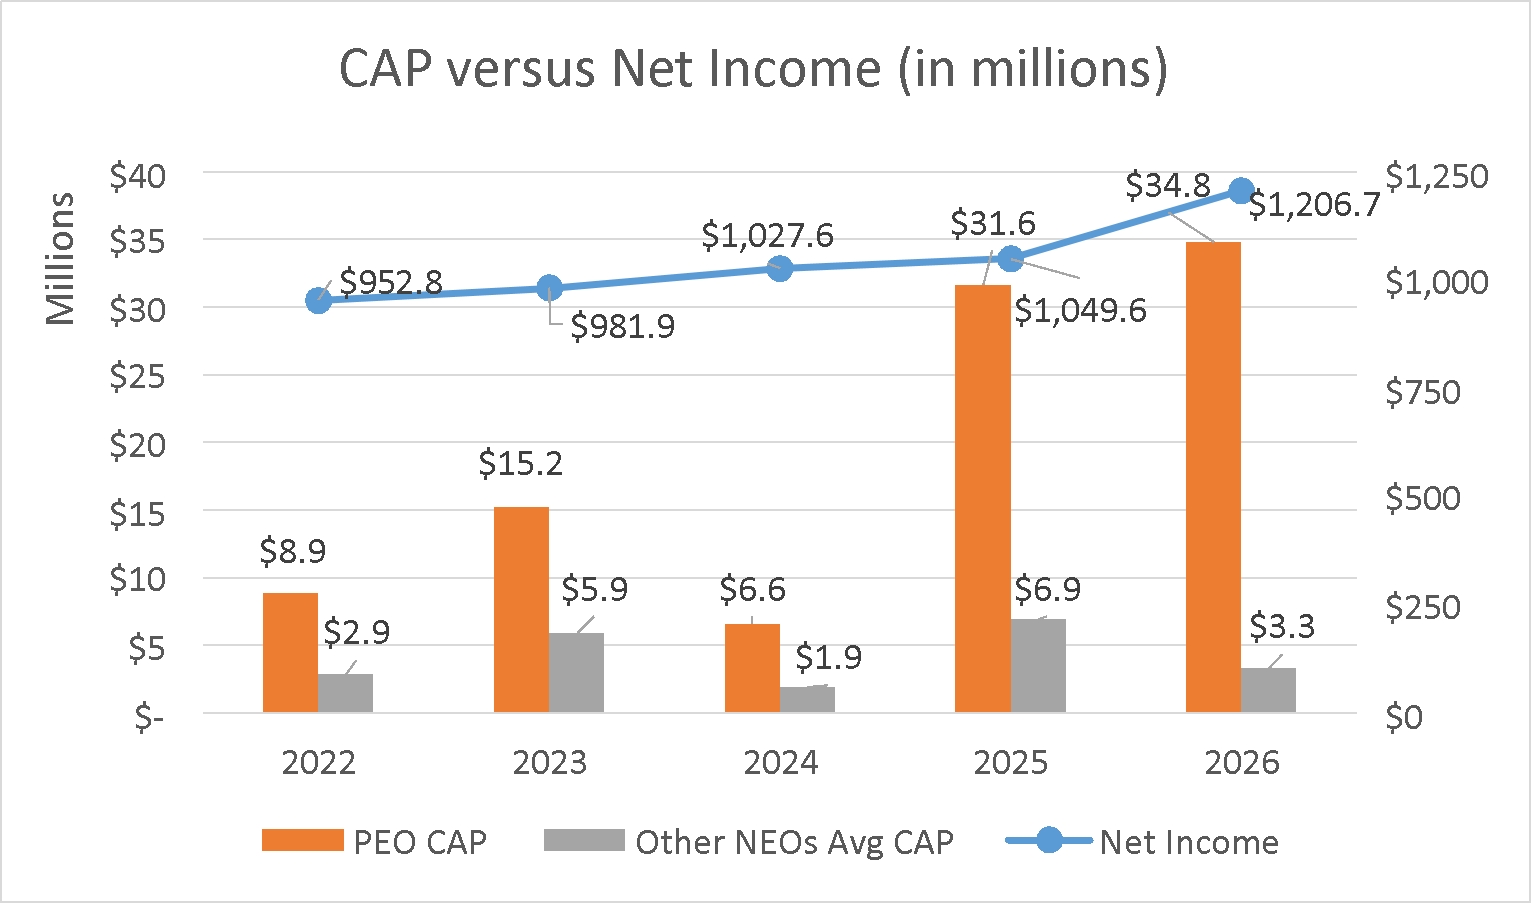
The table below shows the relationship between the amount of compensation actually paid to the PEO and the average amount of compensation actually paid to the Company’s NEOs as a group and the Company’s Net Income. Net Income is not a performance measure in any of the Company’s incentive plans and any alignment would be indirect. Please see the "Compensation Discussion and Analysis" section in this Proxy Statement for a description of the Company’s Executive Compensation Philosophy and Strategy.
Compensation Actually Paid and Adjusted Diluted Net EPS
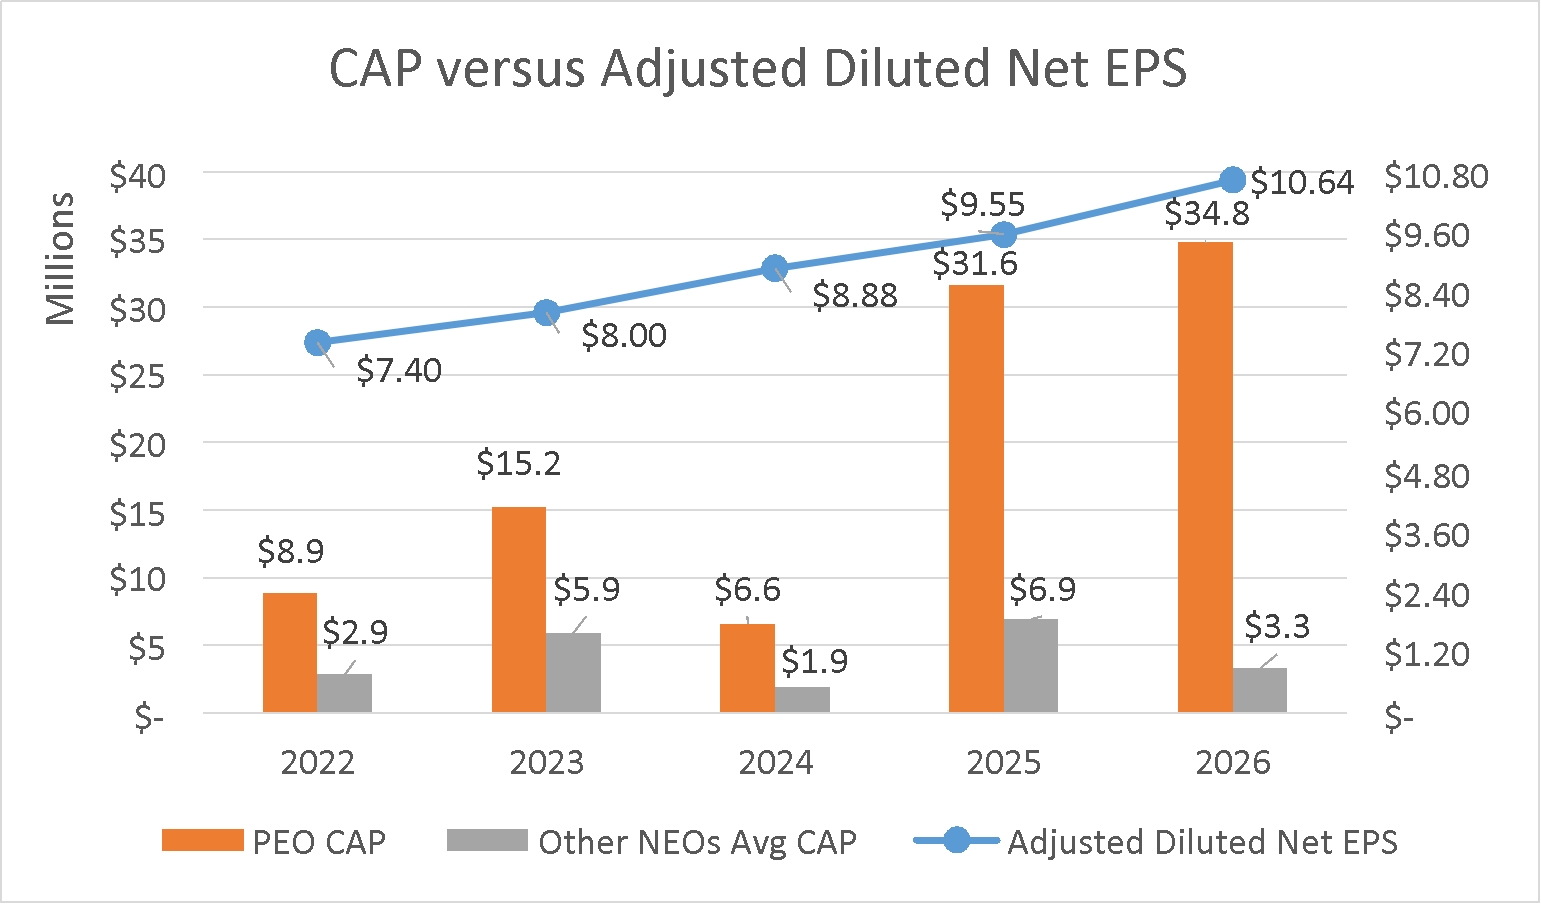
The table below shows the relationship between the amount of compensation actually paid to the PEO and the average amount of compensation actually paid to the Company’s NEOs as a group and the Company’s Adjusted Diluted Net EPS. Adjusted Diluted Net EPS is the Company Selected Measure because it is a performance measure in the Company’s Annual Incentive Plan. Note, compensation actually paid to the PEO and the average amount of compensation actually paid to the Company’s NEOs as a group is impacted by changes in stock price and other performance metrics in the Company’s Incentive Plans. Please see the "Compensation Discussion and Analysis" section in this Proxy Statement for a description of the Company’s Executive Compensation Philosophy and Strategy.
Compensation Actually Paid and Cumulative TSR
The table below shows the relationship between the amount of compensation actually paid to the PEO and the average amount of compensation actually paid to the Company’s NEOs as a group and the Company’s Total Shareholder Return and Total Shareholder Return of our peer group, the S&P Consumer Discretionary Select Sector Index. Neither the Company’s Total Shareholder Return nor the peer group Total Shareholder Return are performance metrics in the Company’s incentive plans. The Company’s Total Shareholder return as a percentile rank versus the Total Shareholder Return of the constituents of a different peer group is a performance measure in the Company’s Performance Stock Unit Awards. Please see the "Compensation Discussion and Analysis" section in this Proxy Statement for a description of the Company’s Executive Compensation Philosophy and Strategy.
Pay versus Performance Tabular List
The table below lists our most important performance measures used to link “Compensation Actually Paid” for our NEOs to company performance, over the fiscal year ending May 31, 2026. These measures are among the measures used to determine the annual incentive and the PSU component of long-term incentive payouts for each of the NEOs.
For more information on annual incentives and actual payouts for each NEO, see “Annual Incentive Plan” beginning on page 56 of this Proxy Statement. For more information on the PSU component of the long-term incentives for each NEO, see “Long-Term Incentives” beginning on page 57 of this Proxy Statement. The performance measures included in this table are not ranked by relative importance.
|
Darden Adjusted Diluted Net EPS |
|
Darden Same-Restaurant Sales Growth |
|
Relative Total Shareholder Return |