Shareholder Report
May 31, 2026
USD ($)
Holding
Shareholder Report |
12 Months Ended |
|---|---|
|
May 31, 2026
USD ($)
Holding
| |
| Shareholder Report [Line Items] | |
| Document Type | N-CSR |
| Amendment Flag | false |
| Registrant Name | Northern Lights Fund Trust II |
| Entity Central Index Key | 0001518042 |
| Entity Investment Company Type | N-1A |
| Document Period End Date | May 31, 2026 |
| Shareholder Report Annual or Semi-Annual | Annual Shareholder Report |
| C000228894 | |
| Shareholder Report [Line Items] | |
| Fund Name | One Global ETF |
| Trading Symbol | FFND |
| Security Exchange Name | NYSEArca |
| Annual or Semi-Annual Statement [Text Block] | This annual shareholder report contains important information about One Global ETF for the period of June 1, 2025 to May 31, 2026. |
| Additional Information [Text Block] | You can find additional information about the Fund at https://futurefundetf.com/fund. You can also request this information by contacting us at 1-877-466-7090. |
| Additional Information Phone Number | 1-877-466-7090 |
| Additional Information Website | https://futurefundetf.com/fund |
| Expenses [Text Block] | |
| Expenses Paid, Amount | $ 105 |
| Expense Ratio, Percent | 0.94% |
| Performance Past Does Not Indicate Future [Text] | The Fund’s past performance is not a good predictor of how the Fund will perform in the future. |
| Performance Inception Date | Aug. 23, 2021 |
| No Deduction of Taxes [Text Block] | The graph and table do not reflect the deduction of taxes that a shareholder would pay on fund distributions or redemption of fund shares. |
| AssetsNet | $ 102,796,722 |
| Holdings Count | Holding | 90 |
| Advisory Fees Paid, Amount | $ 582,426 |
| InvestmentCompanyPortfolioTurnover | 72.00% |
| Additional Fund Statistics [Text Block] | |
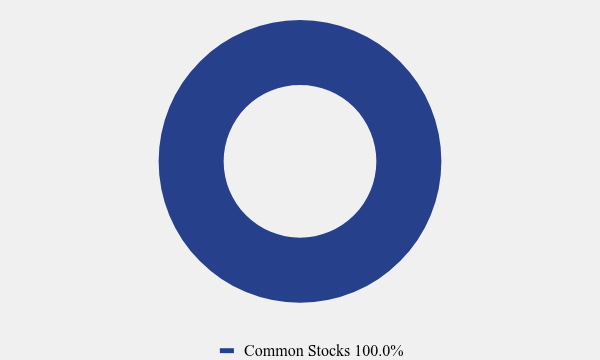
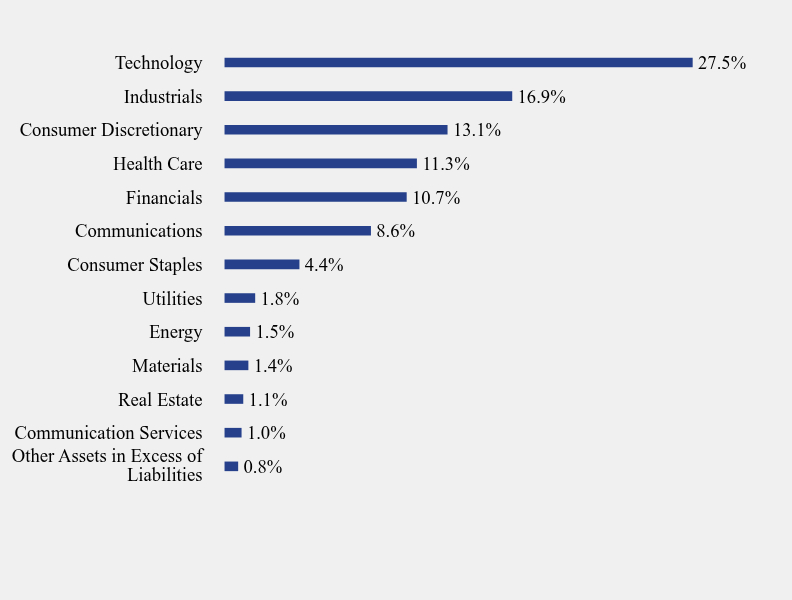
| Holdings [Text Block] | |
| Largest Holdings [Text Block] | |
| Material Fund Change [Text Block] | |
| C000233373 | |
| Shareholder Report [Line Items] | |
| Fund Name | The Future Fund Long/Short ETF |
| Trading Symbol | FFLS |
| Security Exchange Name | NYSEArca |
| Annual or Semi-Annual Statement [Text Block] | This annual shareholder report contains important information about The Future Fund Long/Short ETF for the period of June 1, 2025 to May 31, 2026. |
| Additional Information [Text Block] | You can find additional information about the Fund at https://futurefundetf.com/fund/the-future-fund-long-short-etf. You can also request this information by contacting us at 1-877-466-7090. |
| Additional Information Phone Number | 1-877-466-7090 |
| Additional Information Website | https://futurefundetf.com/fund/the-future-fund-long-short-etf |
| Expenses [Text Block] | |
| Expenses Paid, Amount | $ 205 |
| Expense Ratio, Percent | 2.04% |
| Performance Past Does Not Indicate Future [Text] | The Fund’s past performance is not a good predictor of how the Fund will perform in the future. |
| Performance Inception Date | Jun. 20, 2023 |
| No Deduction of Taxes [Text Block] | The graph and table do not reflect the deduction of taxes that a shareholder would pay on fund distributions or redemption of fund shares. |
| AssetsNet | $ 42,618,125 |
| Holdings Count | Holding | 54 |
| Advisory Fees Paid, Amount | $ 228,601 |
| InvestmentCompanyPortfolioTurnover | 283.00% |
| Additional Fund Statistics [Text Block] | |
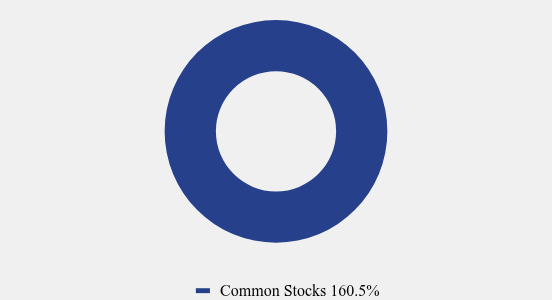
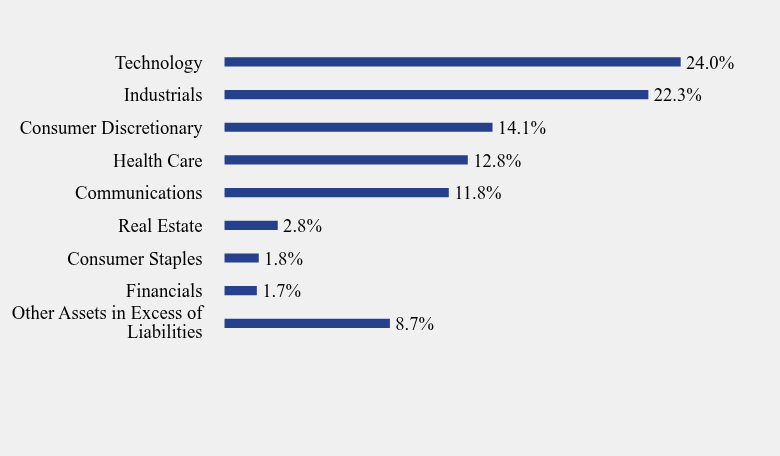
| Holdings [Text Block] | |
| Largest Holdings [Text Block] | |
| Material Fund Change [Text Block] |