Sable Offshore Corp. Investor Presentation August 2026
2 FORWARD LOOKING STATEMENTS The information in this presentation includes “forward-looking statements” within the meaning of the Private Securities Litigation Reform Act of 1995. When used in this presentation, the words “could,” “should,” “would,” “will,” “may,” “believe,” “anticipate,” “intend,” “estimate,” “expect,” “project,” “continue,” “plan,” “forecast,” “predict,” “potential,” “future,” “outlook,” and “target,” the negative of such terms and other similar expressions are intended to identify forward-looking statements, although not all forward-looking statements will contain such identifying words. These statements are based on the current beliefs and expectations of Sable’s management and are subject to significant risks and uncertainties. Actual results may differ materially from those described in the forward-looking statements. Factors that could cause Sable’s actual results to differ materially from those described in the forward-looking statements include: the ability to recommence full production of the SYU assets; the cost and time required therefor, and production levels once recommenced; availability of future financing; restrictions in existing or future debt agreements or structured or other financing arrangements; uncertainties related to new technologies, geographical concentration of operations, environmental risks, weather risks, security risks, drilling and other operating risks, regulatory changes and regulatory risks, including risks relating to PHMSA’s regulatory oversight of the SYPS, the DPA Order and the potential implementation of the OS&T Strategy or the Buoy Strategy; our ability to consummate a debt refinancing of our Senior Secured Term Loan B and the timing and terms thereof; our financial performance; global economic conditions and inflation; increased operating costs; lack of availability of drilling and production equipment, supplies, services and qualified personnel; geographical concentration of operations; environmental and weather risks; regulatory changes and uncertainties; litigation, complaints and/or adverse publicity; privacy and data protection laws, privacy or data breaches, or loss of data; our ability to comply with laws and regulations applicable to our business; and other one-time events and other factors that can be found in Sable’s Annual Report on Form 10-K for the year ended December 31, 2025, and any subsequent Quarterly Report on Form 10-Q or Current Report on Form 8-K, filed with the Securities and Exchange Commission, which are available on Sable’s website (www.sableoffshore.com) and on the Securities and Exchange Commission’s website (www.sec.gov). Except as required by applicable law, Sable undertakes no obligation to publicly release the result of any revisions to these forward-looking statements to reflect the impact of events or circumstances that may arise after the date of this presentation. USE OF PROJECTIONS AND ESTIMATES This presentation contains financial projections and estimates for Sable, including with respect to its future capital expenditures, initial timing and production estimates and future cash costs. Sable’s auditors have not audited, reviewed, compiled or performed any procedures with respect to the projections and estimates for the purpose of their inclusion in this presentation, and, accordingly, no such auditors have expressed an opinion or provided any other form of assurance with respect thereto for the purpose of this presentation. These projections and estimates are for illustrative purposes only and should not be relied upon as being necessarily indicative of future results. The assumptions and estimates underlying the projected information are inherently uncertain and are subject to a wide variety of significant business, regulatory, economic and competitive risks and uncertainties that could cause actual results to differ materially from those contained in the projected information. Even if the assumptions and estimates are correct, projections and estimates are inherently uncertain due to a number of factors outside Sable’s control. Accordingly, there can be no assurance that the projected results are indicative of Sable’s future performance or that actual results will not differ materially from those presented in the projected information. Inclusion of the projected information in this presentation should not be regarded as a representation by any person, including, without limitation, Sable, that the results contained in the projected information will be achieved. NON-GAAP FINANCIAL INFORMATION This presentation includes certain non-GAAP measures that are more fully described in the appendices to the presentation. These financial measures should be reviewed in conjunction with the relevant GAAP financial measures and are not presented as alternative measures of GAAP. Other companies in our industry may define or calculate these measures differently than we do, limiting their usefulness as comparative measures. Because of these limitations, these non-GAAP financial measures should not be considered in isolation or as substitutes for performance measures calculated in accordance with GAAP. Reconciliations of these non-GAAP financial measures to their most directly comparable GAAP financial measures for each of the periods included in this presentation are included in the Appendices at the back of this presentation. Disclaimer
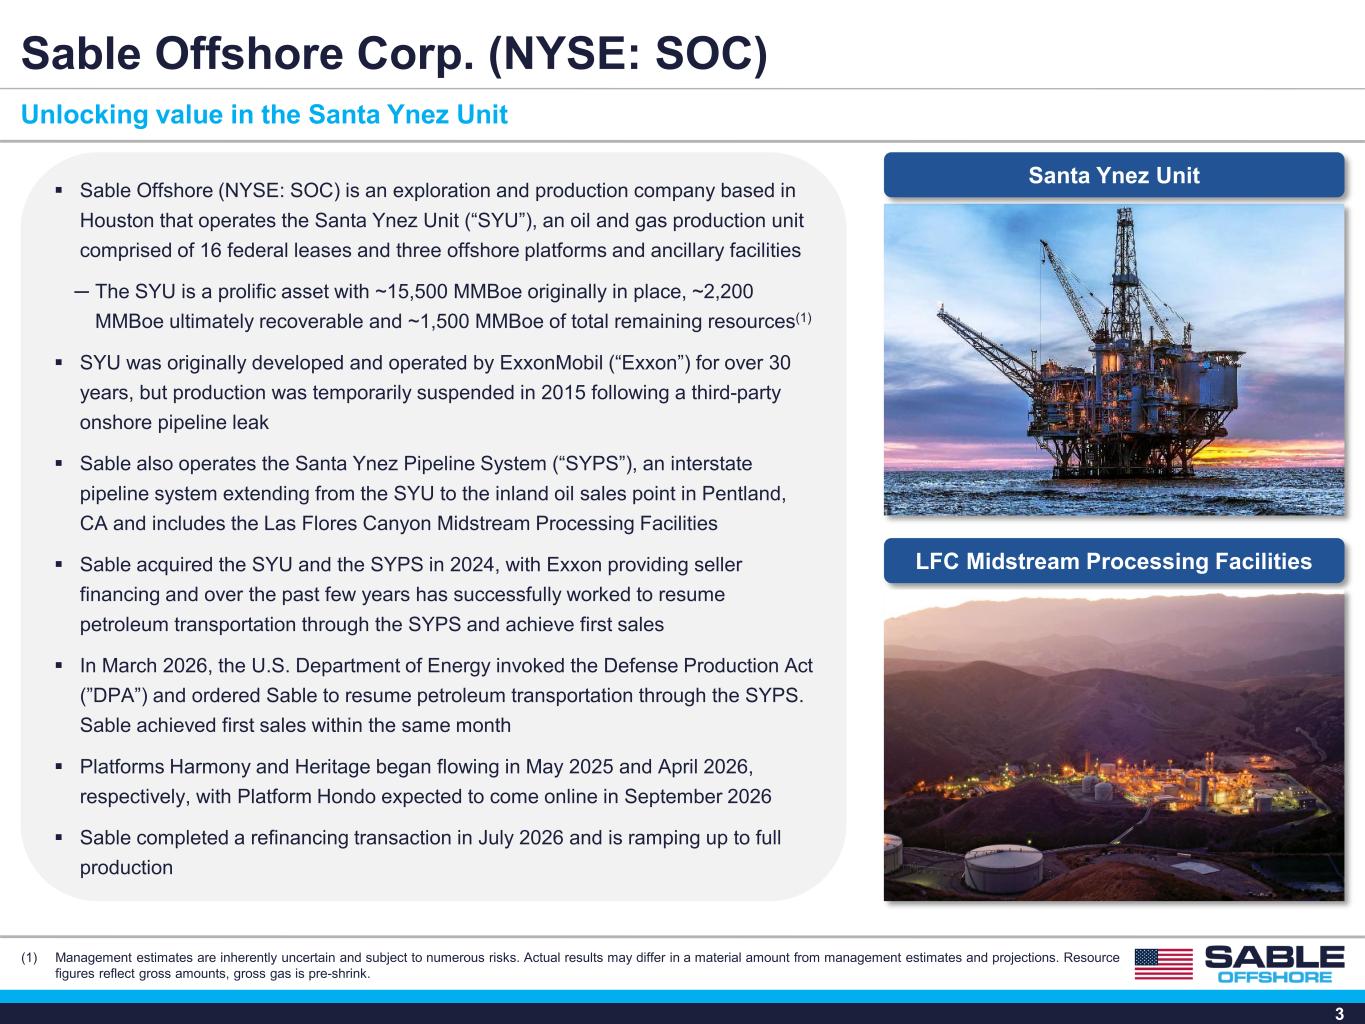
3 Unlocking value in the Santa Ynez Unit Sable Offshore Corp. (NYSE: SOC) Sable Offshore (NYSE: SOC) is an exploration and production company based in Houston that operates the Santa Ynez Unit (“SYU”), an oil and gas production unit comprised of 16 federal leases and three offshore platforms and ancillary facilities ─ The SYU is a prolific asset with ~15,500 MMBoe originally in place, ~2,200 MMBoe ultimately recoverable and ~1,500 MMBoe of total remaining resources(1) SYU was originally developed and operated by ExxonMobil (“Exxon”) for over 30 years, but production was temporarily suspended in 2015 following a third-party onshore pipeline leak Sable also operates the Santa Ynez Pipeline System (“SYPS”), an interstate pipeline system extending from the SYU to the inland oil sales point in Pentland, CA and includes the Las Flores Canyon Midstream Processing Facilities Sable acquired the SYU and the SYPS in 2024, with Exxon providing seller financing and over the past few years has successfully worked to resume petroleum transportation through the SYPS and achieve first sales In March 2026, the U.S. Department of Energy invoked the Defense Production Act (”DPA”) and ordered Sable to resume petroleum transportation through the SYPS. Sable achieved first sales within the same month Platforms Harmony and Heritage began flowing in May 2025 and April 2026, respectively, with Platform Hondo expected to come online in September 2026 Sable completed a refinancing transaction in July 2026 and is ramping up to full production Santa Ynez Unit LFC Midstream Processing Facilities (1) Management estimates are inherently uncertain and subject to numerous risks. Actual results may differ in a material amount from management estimates and projections. Resource figures reflect gross amounts, gross gas is pre-shrink.
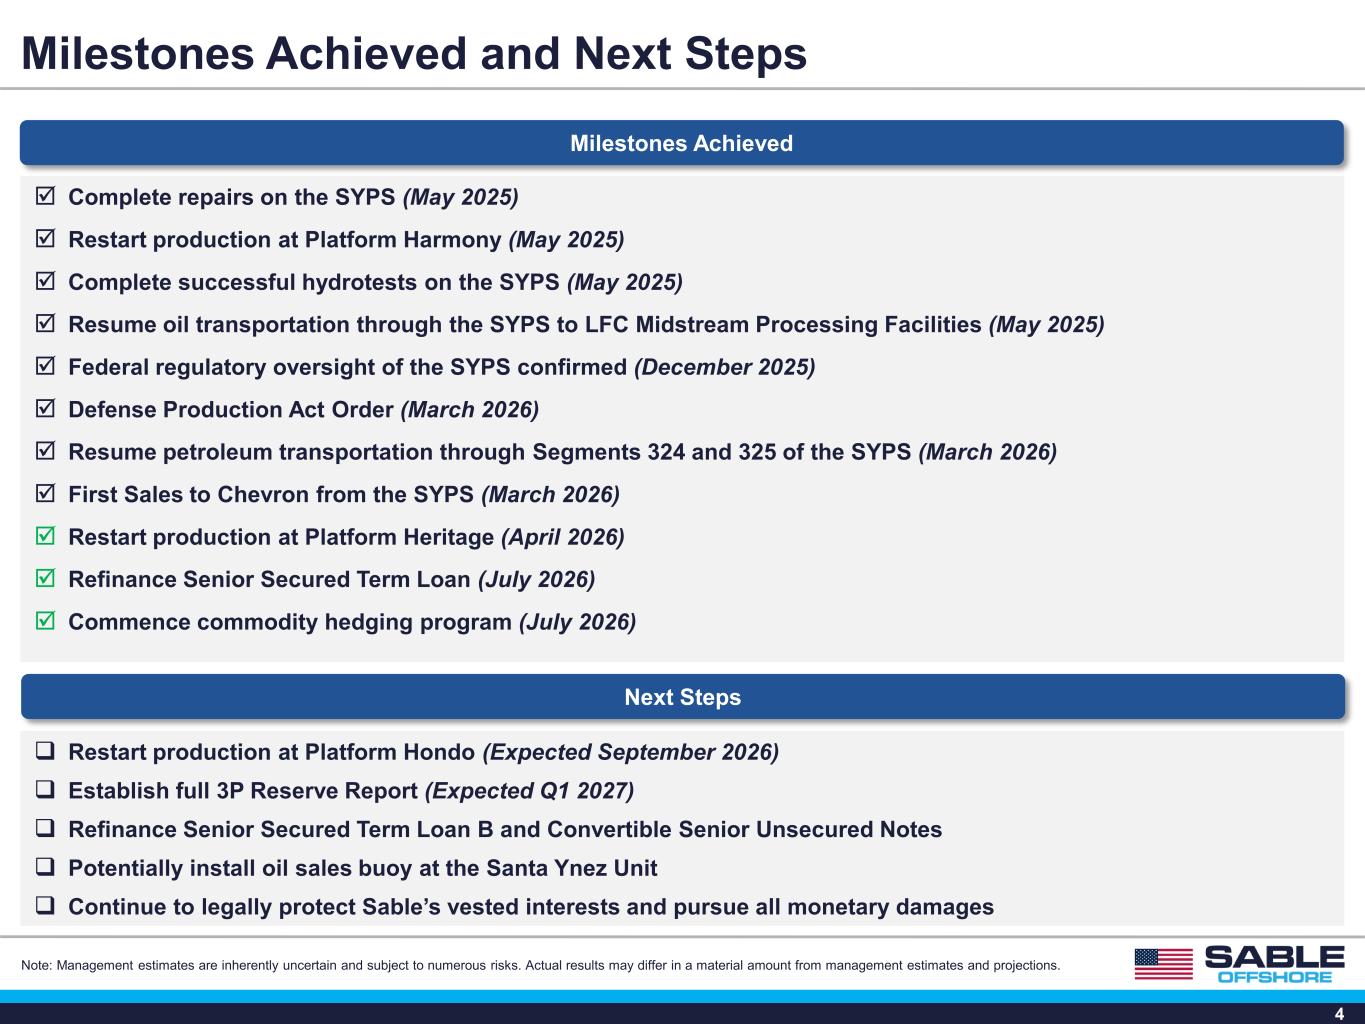
4 Milestones Achieved and Next Steps Complete repairs on the SYPS (May 2025) Restart production at Platform Harmony (May 2025) Complete successful hydrotests on the SYPS (May 2025) Resume oil transportation through the SYPS to LFC Midstream Processing Facilities (May 2025) Federal regulatory oversight of the SYPS confirmed (December 2025) Defense Production Act Order (March 2026) Resume petroleum transportation through Segments 324 and 325 of the SYPS (March 2026) First Sales to Chevron from the SYPS (March 2026) Restart production at Platform Heritage (April 2026) Refinance Senior Secured Term Loan (July 2026) Commence commodity hedging program (July 2026) Restart production at Platform Hondo (Expected September 2026) Establish full 3P Reserve Report (Expected Q1 2027) Refinance Senior Secured Term Loan B and Convertible Senior Unsecured Notes Potentially install oil sales buoy at the Santa Ynez Unit Continue to legally protect Sable’s vested interests and pursue all monetary damages Milestones Achieved Next Steps Note: Management estimates are inherently uncertain and subject to numerous risks. Actual results may differ in a material amount from management estimates and projections.
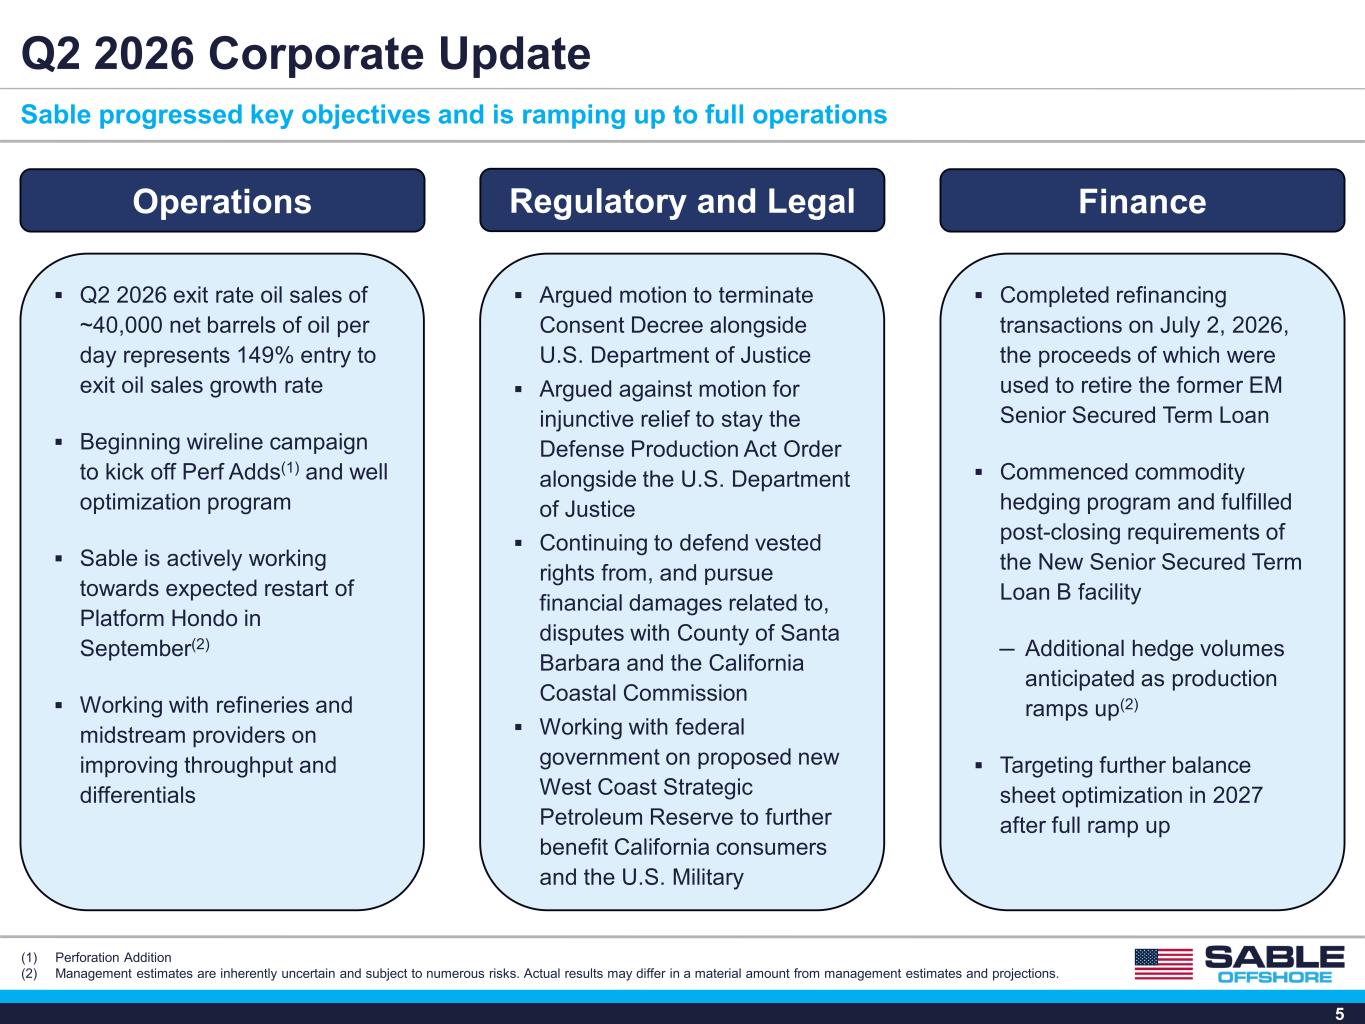
5 Sable progressed key objectives and is ramping up to full operations Q2 2026 Corporate Update (1) Perforation Addition (2) Management estimates are inherently uncertain and subject to numerous risks. Actual results may differ in a material amount from management estimates and projections. Q2 2026 exit rate oil sales of ~40,000 net barrels of oil per day represents 149% entry to exit oil sales growth rate Beginning wireline campaign to kick off Perf Adds(1) and well optimization program Sable is actively working towards expected restart of Platform Hondo in September(2) Working with refineries and midstream providers on improving throughput and differentials Argued motion to terminate Consent Decree alongside U.S. Department of Justice Argued against motion for injunctive relief to stay the Defense Production Act Order alongside the U.S. Department of Justice Continuing to defend vested rights from, and pursue financial damages related to, disputes with County of Santa Barbara and the California Coastal Commission Working with federal government on proposed new West Coast Strategic Petroleum Reserve to further benefit California consumers and the U.S. Military Completed refinancing transactions on July 2, 2026, the proceeds of which were used to retire the former EM Senior Secured Term Loan Commenced commodity hedging program and fulfilled post-closing requirements of the New Senior Secured Term Loan B facility ─ Additional hedge volumes anticipated as production ramps up(2) Targeting further balance sheet optimization in 2027 after full ramp up Operations Regulatory and Legal Finance
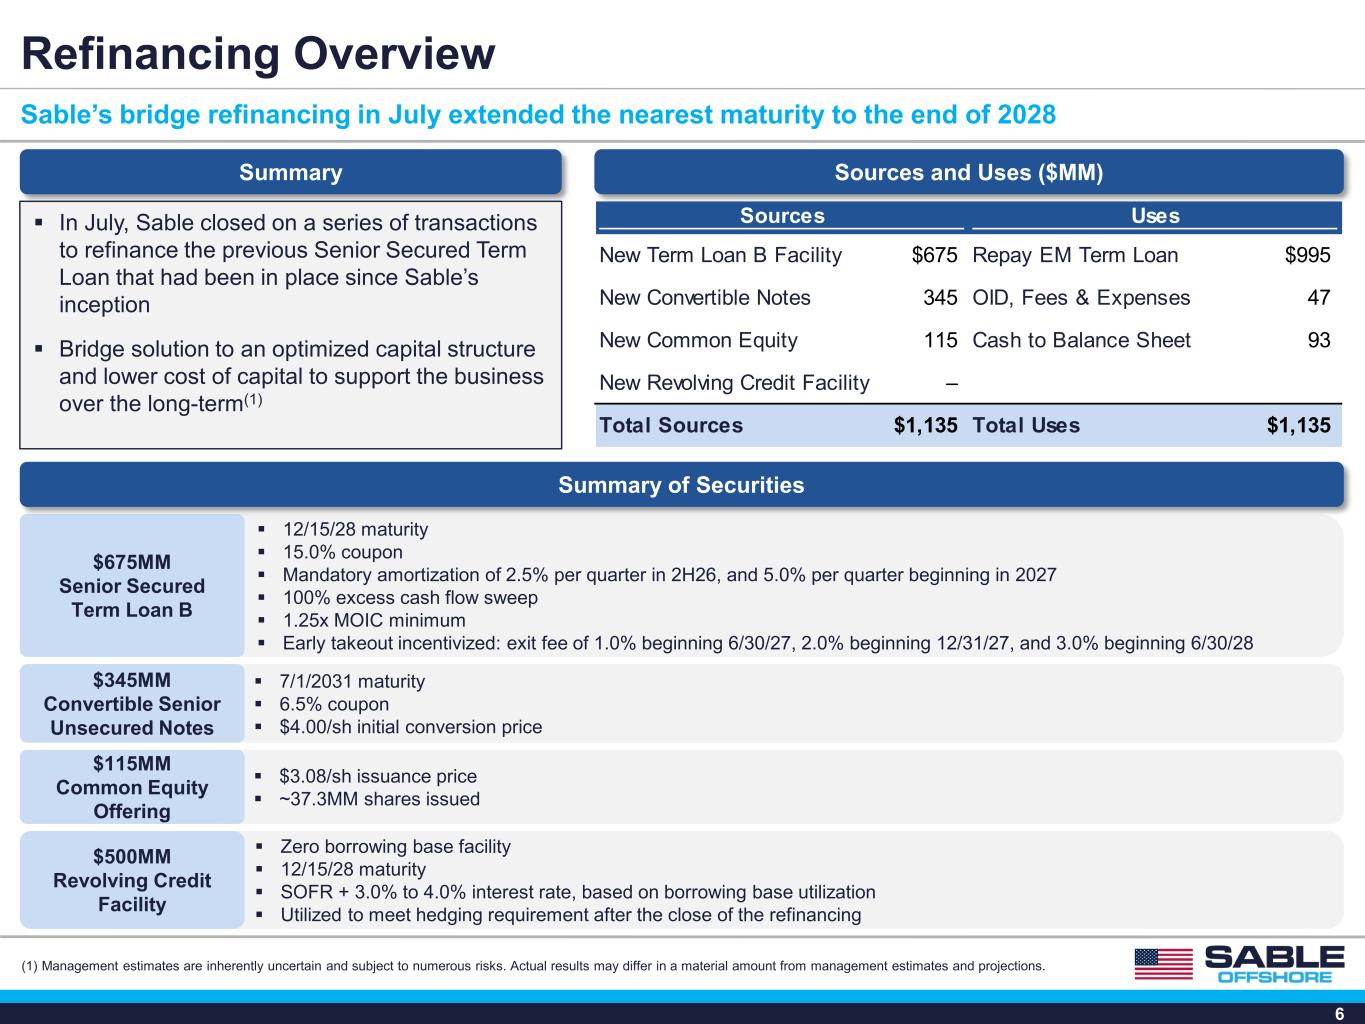
6 Refinancing Overview Sable’s bridge refinancing in July extended the nearest maturity to the end of 2028 Summary 12/15/28 maturity 15.0% coupon Mandatory amortization of 2.5% per quarter in 2H26, and 5.0% per quarter beginning in 2027 100% excess cash flow sweep 1.25x MOIC minimum Early takeout incentivized: exit fee of 1.0% beginning 6/30/27, 2.0% beginning 12/31/27, and 3.0% beginning 6/30/28 $675MM Senior Secured Term Loan B 7/1/2031 maturity 6.5% coupon $4.00/sh initial conversion price $345MM Convertible Senior Unsecured Notes Zero borrowing base facility 12/15/28 maturity SOFR + 3.0% to 4.0% interest rate, based on borrowing base utilization Utilized to meet hedging requirement after the close of the refinancing $500MM Revolving Credit Facility Summary of Securities Sources and Uses ($MM) In July, Sable closed on a series of transactions to refinance the previous Senior Secured Term Loan that had been in place since Sable’s inception Bridge solution to an optimized capital structure and lower cost of capital to support the business over the long-term(1) Sources Uses New Term Loan B Facility $675 Repay EM Term Loan $995 New Convertible Notes 345 OID, Fees & Expenses 47 New Common Equity 115 Cash to Balance Sheet 93 New Revolving Credit Facility – Total Sources $1,135 Total Uses $1,135 $3.08/sh issuance price ~37.3MM shares issued $115MM Common Equity Offering (1) Management estimates are inherently uncertain and subject to numerous risks. Actual results may differ in a material amount from management estimates and projections.
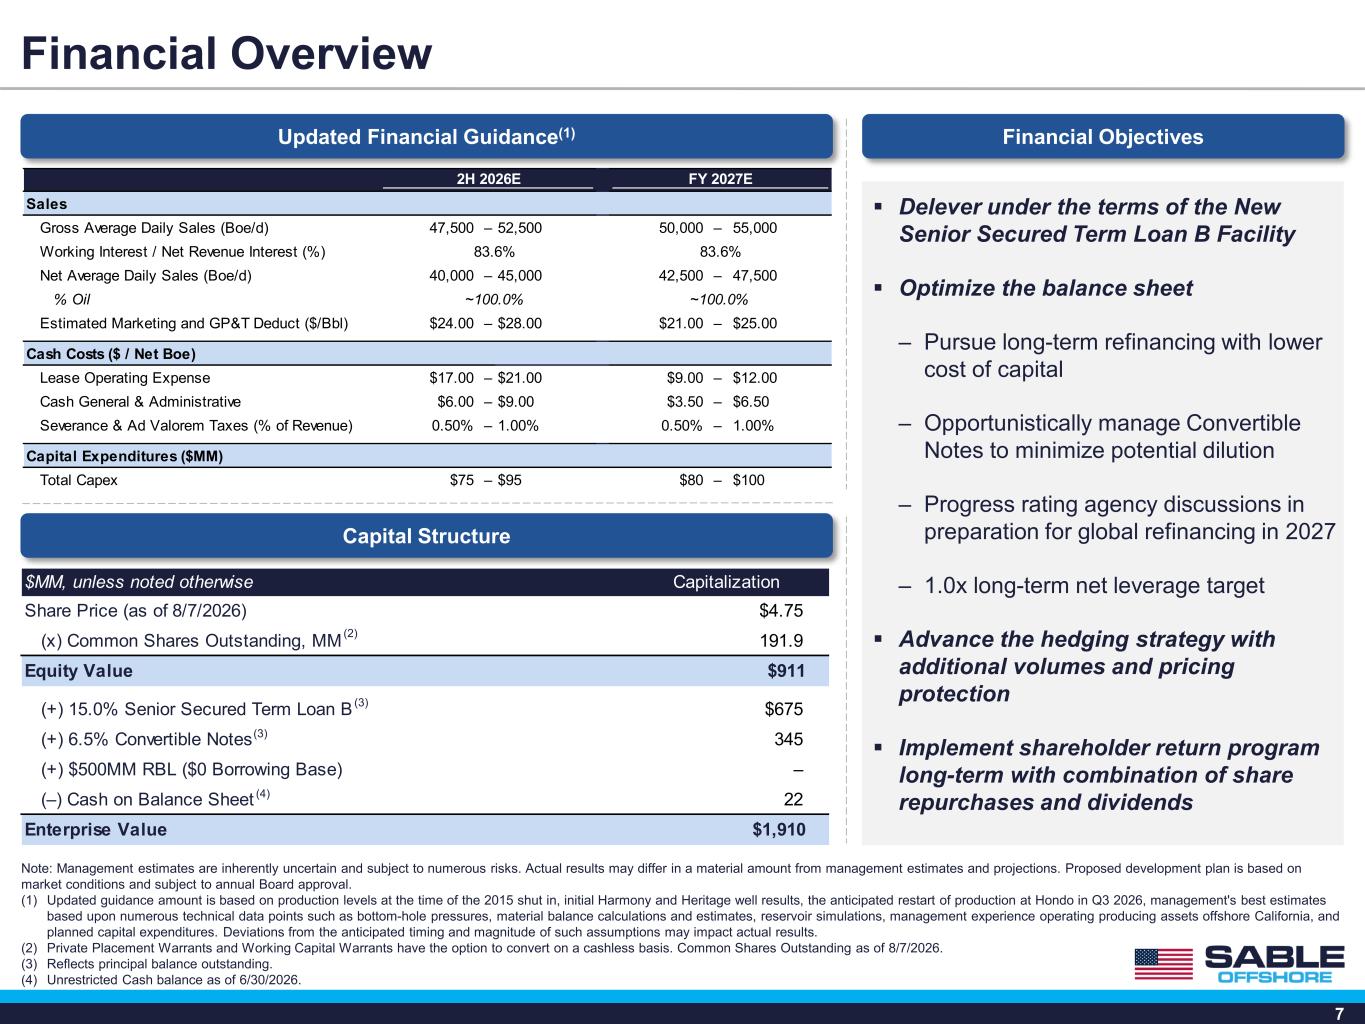
7 2H 2026E FY 2027E Sales Gross Average Daily Sales (Boe/d) 47,500 ‒ 52,500 50,000 ‒ 55,000 Working Interest / Net Revenue Interest (%) 83.6% 83.6% Net Average Daily Sales (Boe/d) 40,000 ‒ 45,000 42,500 ‒ 47,500 % Oil ~100.0% ~100.0% Estimated Marketing and GP&T Deduct ($/Bbl) $24.00 ‒ $28.00 $21.00 ‒ $25.00 Cash Costs ($ / Net Boe) Lease Operating Expense $17.00 ‒ $21.00 $9.00 ‒ $12.00 Cash General & Administrative $6.00 ‒ $9.00 $3.50 ‒ $6.50 Severance & Ad Valorem Taxes (% of Revenue) 0.50% ‒ 1.00% 0.50% ‒ 1.00% Capital Expenditures ($MM) Total Capex $75 ‒ $95 $80 ‒ $100 $MM, unless noted otherwise Capitalization Share Price (as of 8/7/2026) $4.75 (x) Common Shares Outstanding, MM 191.9 Equity Value $911 (+) 15.0% Senior Secured Term Loan B $675 (+) 6.5% Convertible Notes 345 (+) $500MM RBL ($0 Borrowing Base) – (‒) Cash on Balance Sheet 22 Enterprise Value $1,910 Note: Management estimates are inherently uncertain and subject to numerous risks. Actual results may differ in a material amount from management estimates and projections. Proposed development plan is based on market conditions and subject to annual Board approval. (1) Updated guidance amount is based on production levels at the time of the 2015 shut in, initial Harmony and Heritage well results, the anticipated restart of production at Hondo in Q3 2026, management's best estimates based upon numerous technical data points such as bottom-hole pressures, material balance calculations and estimates, reservoir simulations, management experience operating producing assets offshore California, and planned capital expenditures. Deviations from the anticipated timing and magnitude of such assumptions may impact actual results. (2) Private Placement Warrants and Working Capital Warrants have the option to convert on a cashless basis. Common Shares Outstanding as of 8/7/2026. (3) Reflects principal balance outstanding. (4) Unrestricted Cash balance as of 6/30/2026. Delever under the terms of the New Senior Secured Term Loan B Facility Optimize the balance sheet ‒ Pursue long-term refinancing with lower cost of capital ‒ Opportunistically manage Convertible Notes to minimize potential dilution ‒ Progress rating agency discussions in preparation for global refinancing in 2027 ‒ 1.0x long-term net leverage target Advance the hedging strategy with additional volumes and pricing protection Implement shareholder return program long-term with combination of share repurchases and dividends Updated Financial Guidance(1) Financial Overview Capital Structure Financial Objectives (3) (4) (2) (3)
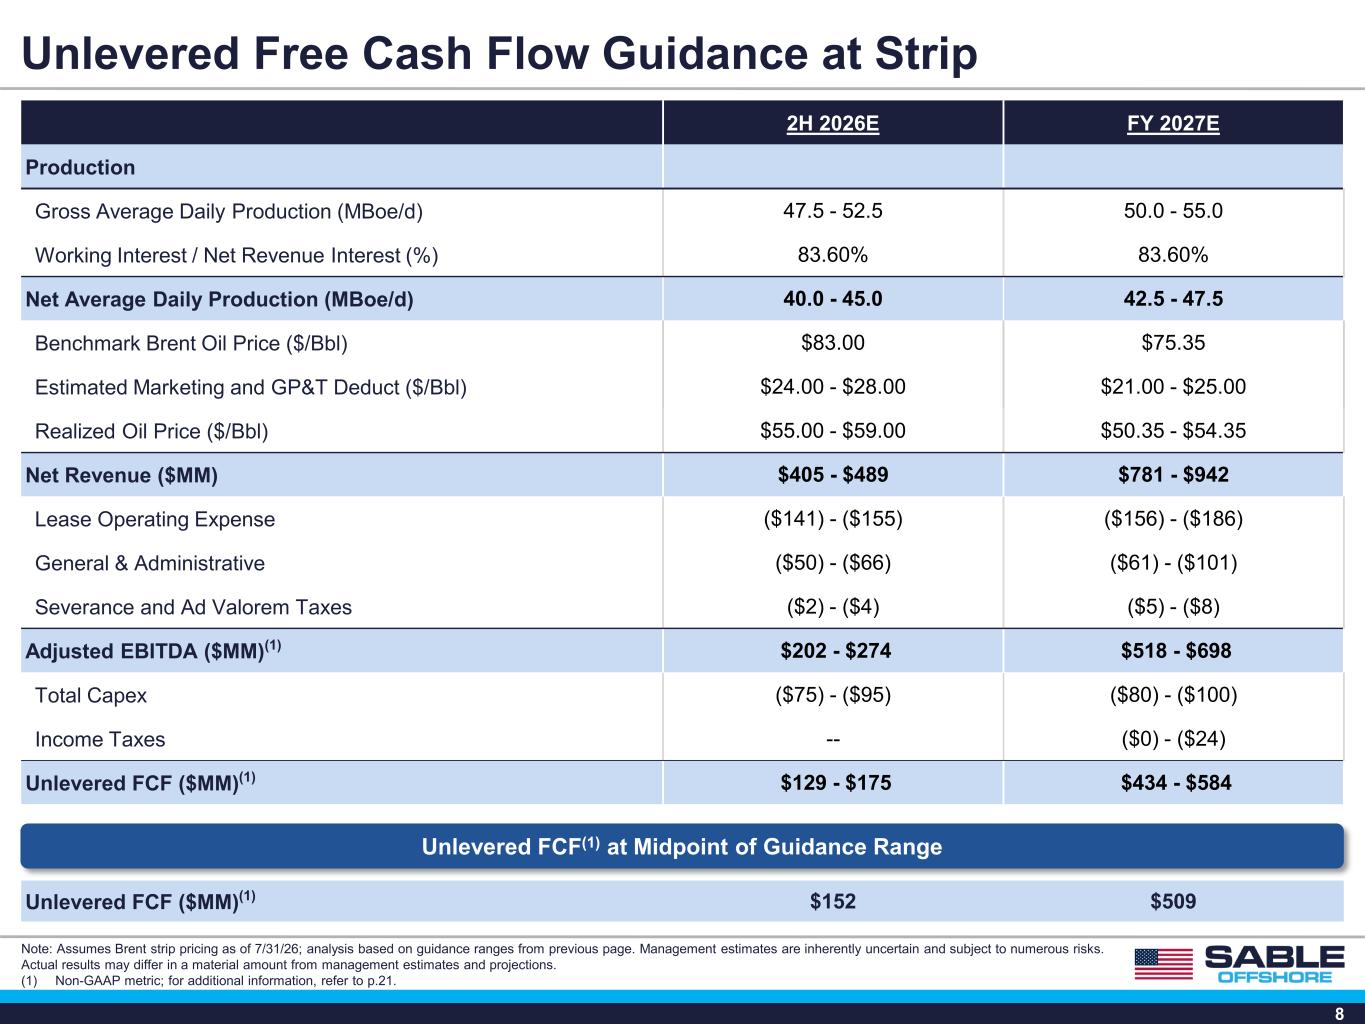
8 Unlevered Free Cash Flow Guidance at Strip 2H 2026E FY 2027E Production Gross Average Daily Production (MBoe/d) 47.5 - 52.5 50.0 - 55.0 Working Interest / Net Revenue Interest (%) 83.60% 83.60% Net Average Daily Production (MBoe/d) 40.0 - 45.0 42.5 - 47.5 Benchmark Brent Oil Price ($/Bbl) $83.00 $75.35 Estimated Marketing and GP&T Deduct ($/Bbl) $24.00 - $28.00 $21.00 - $25.00 Realized Oil Price ($/Bbl) $55.00 - $59.00 $50.35 - $54.35 Net Revenue ($MM) $405 - $489 $781 - $942 Lease Operating Expense ($141) - ($155) ($156) - ($186) General & Administrative ($50) - ($66) ($61) - ($101) Severance and Ad Valorem Taxes ($2) - ($4) ($5) - ($8) Adjusted EBITDA ($MM)(1) $202 - $274 $518 - $698 Total Capex ($75) - ($95) ($80) - ($100) Income Taxes -- ($0) - ($24) Unlevered FCF ($MM)(1) $129 - $175 $434 - $584 Unlevered FCF(1) at Midpoint of Guidance Range Unlevered FCF ($MM)(1) $152 $509 Note: Assumes Brent strip pricing as of 7/31/26; analysis based on guidance ranges from previous page. Management estimates are inherently uncertain and subject to numerous risks. Actual results may differ in a material amount from management estimates and projections. (1) Non-GAAP metric; for additional information, refer to p.21.
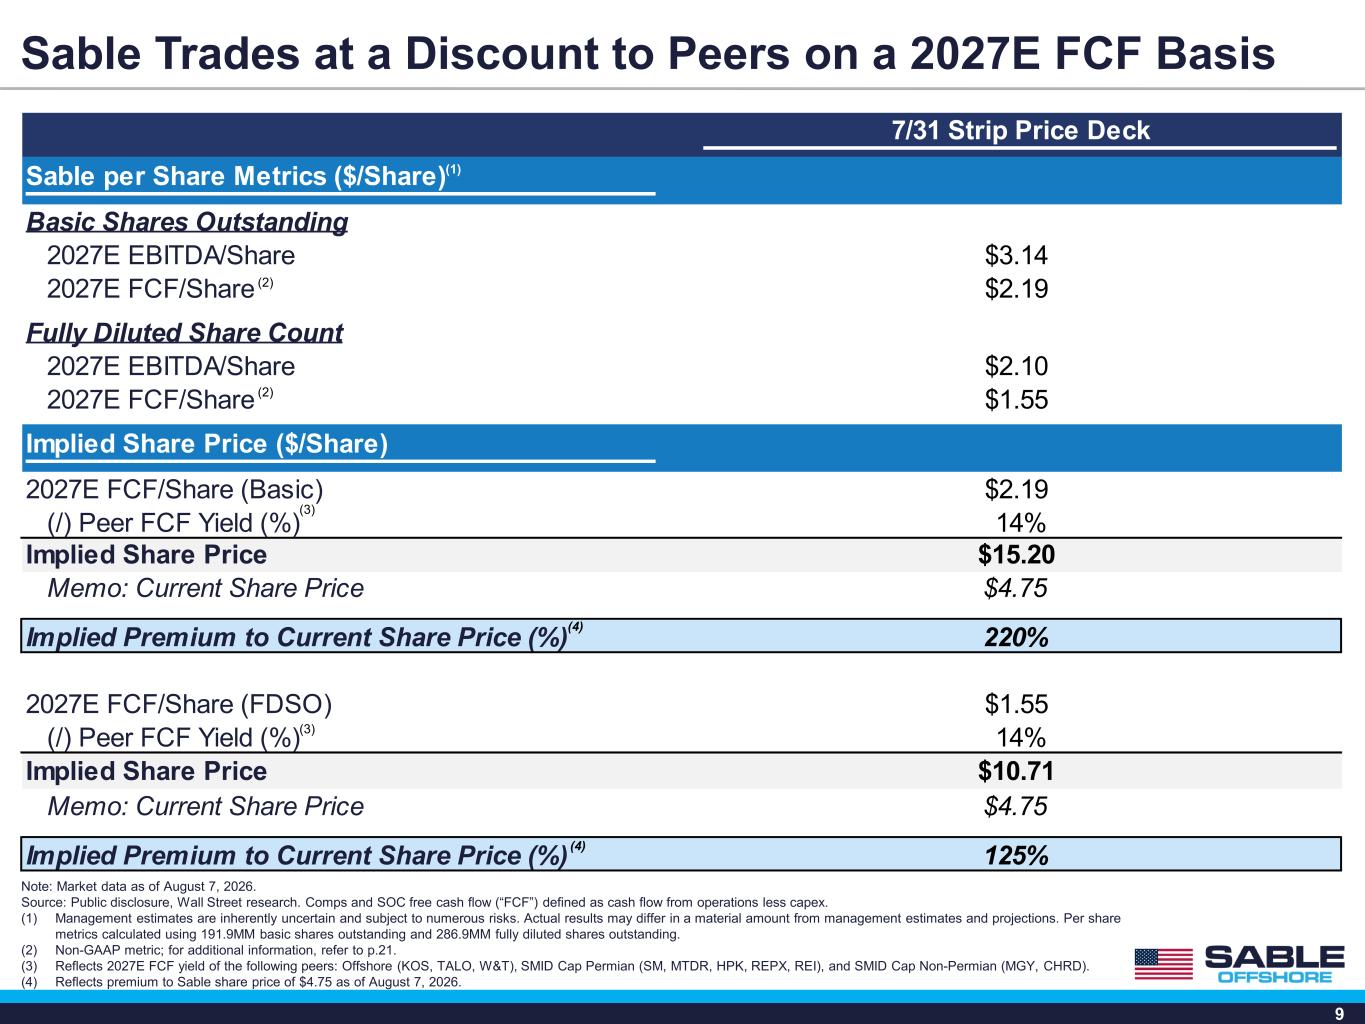
9 Sable Trades at a Discount to Peers on a 2027E FCF Basis 7/31 Strip Price Deck Sable per Share Metrics ($/Share) Basic Shares Outstanding 2027E EBITDA/Share $3.14 2027E FCF/Share $2.19 Fully Diluted Share Count 2027E EBITDA/Share $2.10 2027E FCF/Share $1.55 Implied Share Price ($/Share) 2027E FCF/Share (Basic) $2.19 (/) Peer FCF Yield (%) 14% Implied Share Price $15.20 Memo: Current Share Price $4.75 Implied Premium to Current Share Price (%) 220% 2027E FCF/Share (FDSO) $1.55 (/) Peer FCF Yield (%) 14% Implied Share Price $10.71 Memo: Current Share Price $4.75 Implied Premium to Current Share Price (%) 125% Note: Market data as of August 7, 2026. Source: Public disclosure, Wall Street research. Comps and SOC free cash flow (“FCF”) defined as cash flow from operations less capex. (1) Management estimates are inherently uncertain and subject to numerous risks. Actual results may differ in a material amount from management estimates and projections. Per share metrics calculated using 191.9MM basic shares outstanding and 286.9MM fully diluted shares outstanding. (2) Non-GAAP metric; for additional information, refer to p.21. (3) Reflects 2027E FCF yield of the following peers: Offshore (KOS, TALO, W&T), SMID Cap Permian (SM, MTDR, HPK, REPX, REI), and SMID Cap Non-Permian (MGY, CHRD). (4) Reflects premium to Sable share price of $4.75 as of August 7, 2026. (3) (4) (3) (4) (1) (2) (2)
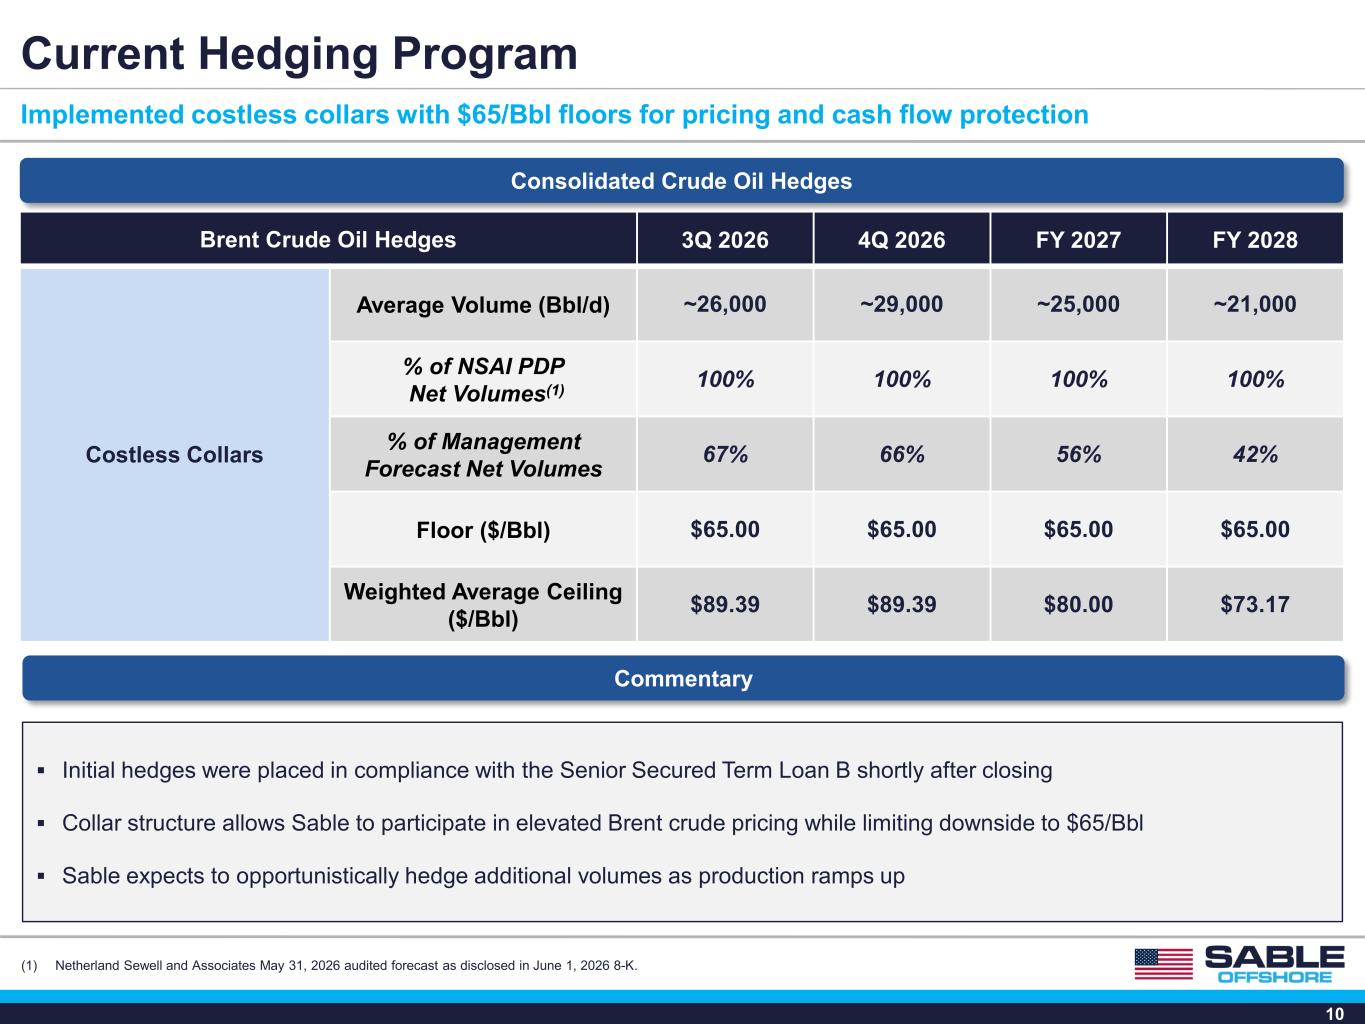
10 Current Hedging Program Implemented costless collars with $65/Bbl floors for pricing and cash flow protection Consolidated Crude Oil Hedges Brent Crude Oil Hedges 3Q 2026 4Q 2026 FY 2027 FY 2028 Costless Collars Average Volume (Bbl/d) ~26,000 ~29,000 ~25,000 ~21,000 % of NSAI PDP Net Volumes(1) 100% 100% 100% 100% % of Management Forecast Net Volumes 67% 66% 56% 42% Floor ($/Bbl) $65.00 $65.00 $65.00 $65.00 Weighted Average Ceiling ($/Bbl) $89.39 $89.39 $80.00 $73.17 Initial hedges were placed in compliance with the Senior Secured Term Loan B shortly after closing Collar structure allows Sable to participate in elevated Brent crude pricing while limiting downside to $65/Bbl Sable expects to opportunistically hedge additional volumes as production ramps up Commentary (1) Netherland Sewell and Associates May 31, 2026 audited forecast as disclosed in June 1, 2026 8-K.
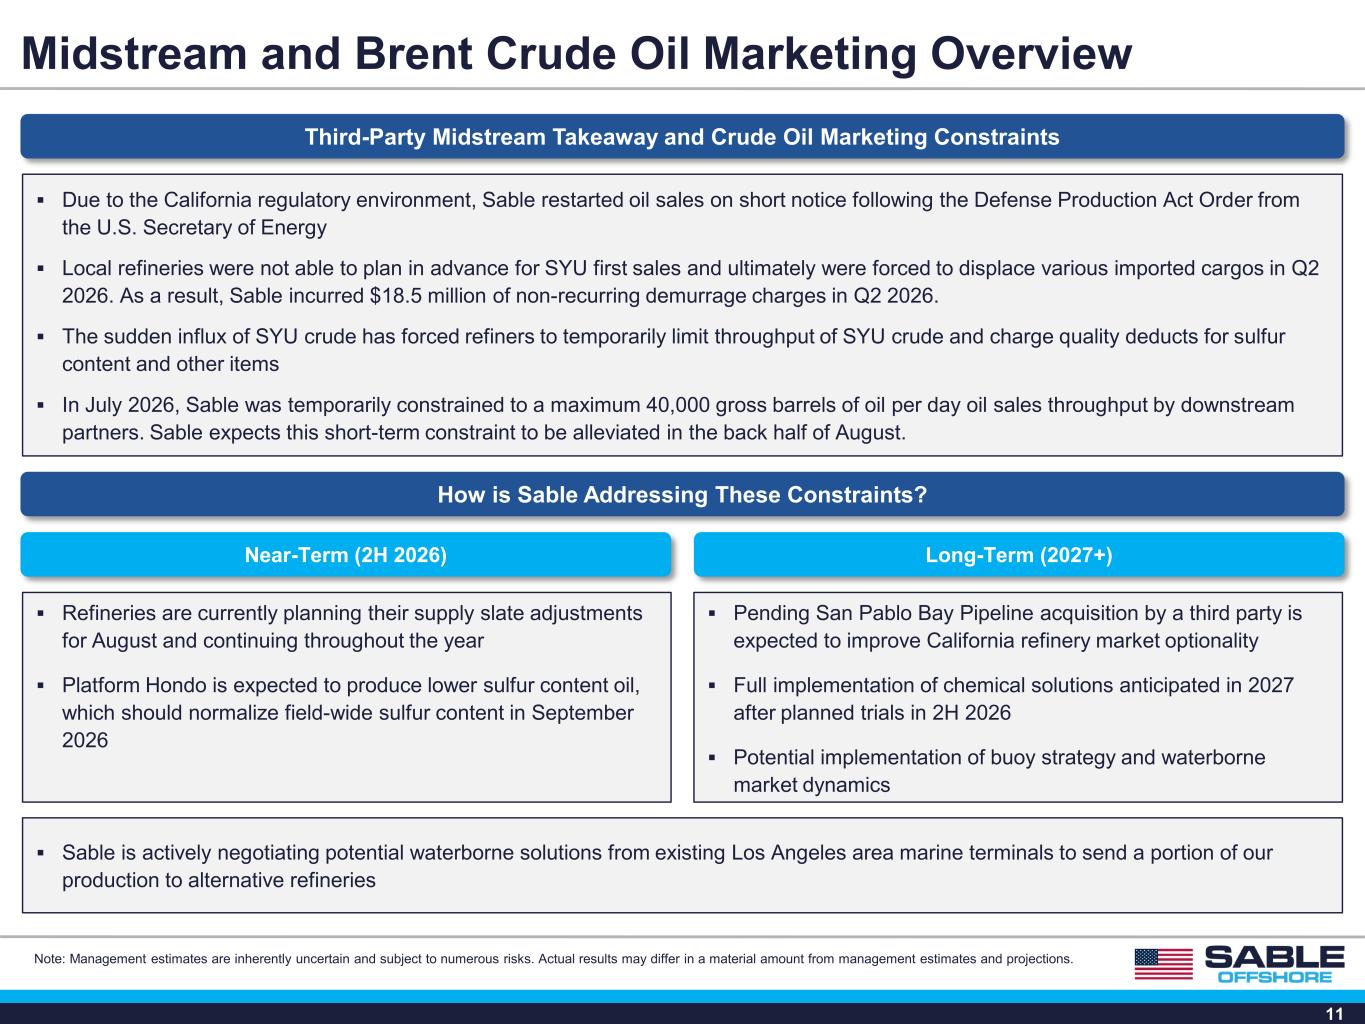
11 Midstream and Brent Crude Oil Marketing Overview Third-Party Midstream Takeaway and Crude Oil Marketing Constraints How is Sable Addressing These Constraints? Near-Term (2H 2026) Long-Term (2027+) Sable is actively negotiating potential waterborne solutions from existing Los Angeles area marine terminals to send a portion of our production to alternative refineries Due to the California regulatory environment, Sable restarted oil sales on short notice following the Defense Production Act Order from the U.S. Secretary of Energy Local refineries were not able to plan in advance for SYU first sales and ultimately were forced to displace various imported cargos in Q2 2026. As a result, Sable incurred $18.5 million of non-recurring demurrage charges in Q2 2026. The sudden influx of SYU crude has forced refiners to temporarily limit throughput of SYU crude and charge quality deducts for sulfur content and other items In July 2026, Sable was temporarily constrained to a maximum 40,000 gross barrels of oil per day oil sales throughput by downstream partners. Sable expects this short-term constraint to be alleviated in the back half of August. Refineries are currently planning their supply slate adjustments for August and continuing throughout the year Platform Hondo is expected to produce lower sulfur content oil, which should normalize field-wide sulfur content in September 2026 Pending San Pablo Bay Pipeline acquisition by a third party is expected to improve California refinery market optionality Full implementation of chemical solutions anticipated in 2027 after planned trials in 2H 2026 Potential implementation of buoy strategy and waterborne market dynamics Note: Management estimates are inherently uncertain and subject to numerous risks. Actual results may differ in a material amount from management estimates and projections.
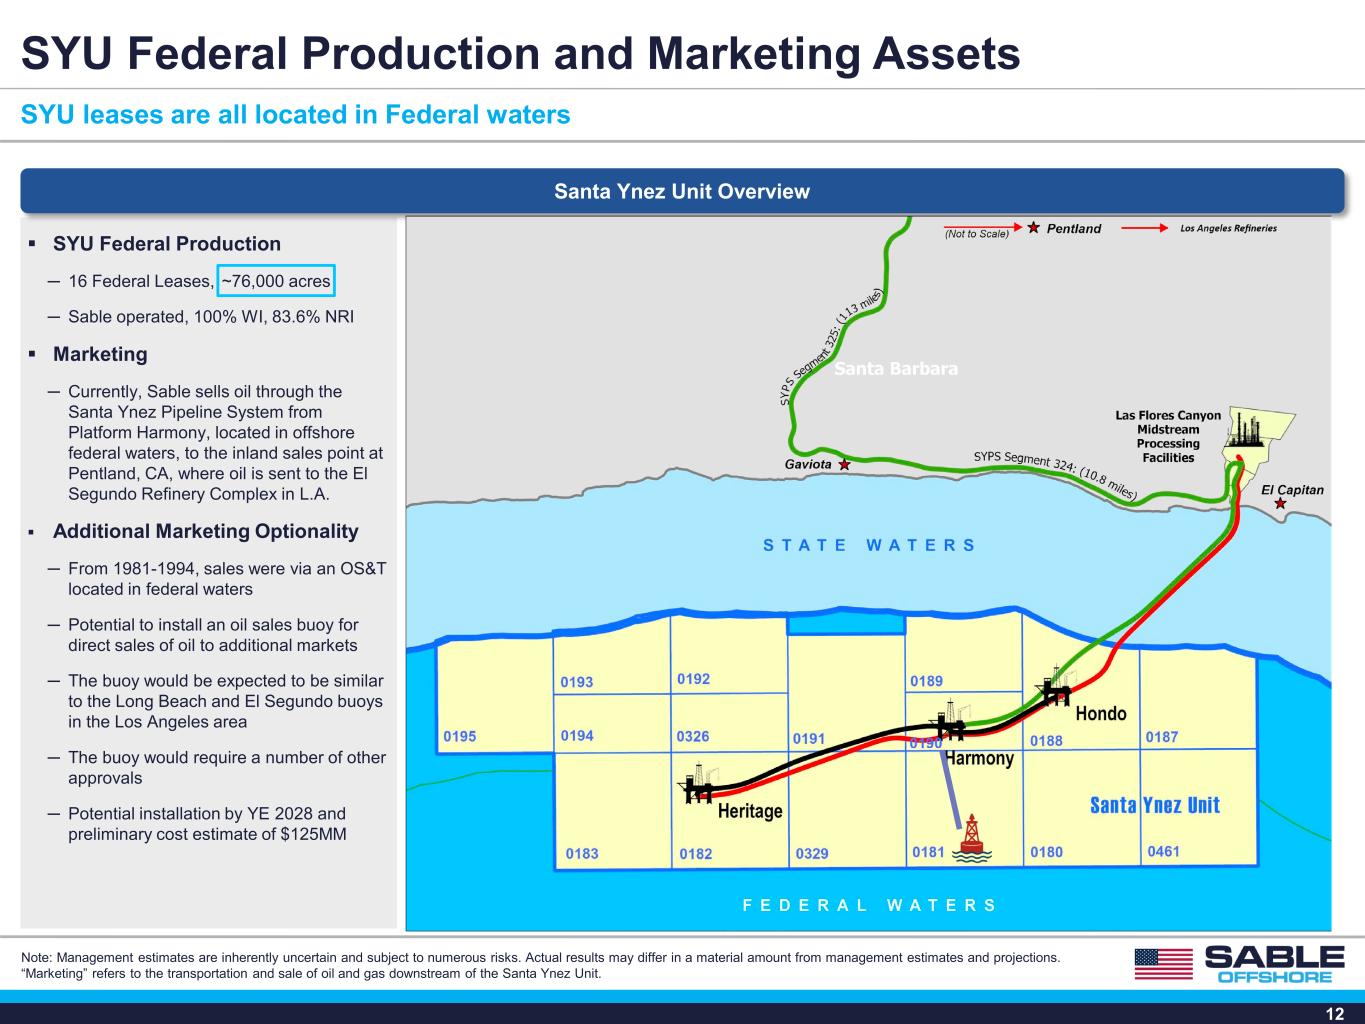
12 SYU Federal Production ─ 16 Federal Leases, ─ Sable operated, 100% WI, 83.6% NRI Marketing ─ Currently, Sable sells oil through the Santa Ynez Pipeline System from Platform Harmony, located in offshore federal waters, to the inland sales point at Pentland, CA, where oil is sent to the El Segundo Refinery Complex in L.A. Additional Marketing Optionality ─ From 1981-1994, sales were via an OS&T located in federal waters ─ Potential to install an oil sales buoy for direct sales of oil to additional markets ─ The buoy would be expected to be similar to the Long Beach and El Segundo buoys in the Los Angeles area ─ The buoy would require a number of other approvals ─ Potential installation by YE 2028 and preliminary cost estimate of $125MM Santa Ynez Unit Overview SYU Federal Production and Marketing Assets SYU leases are all located in Federal waters ~76,000 acres Note: Management estimates are inherently uncertain and subject to numerous risks. Actual results may differ in a material amount from management estimates and projections. “Marketing” refers to the transportation and sale of oil and gas downstream of the Santa Ynez Unit.
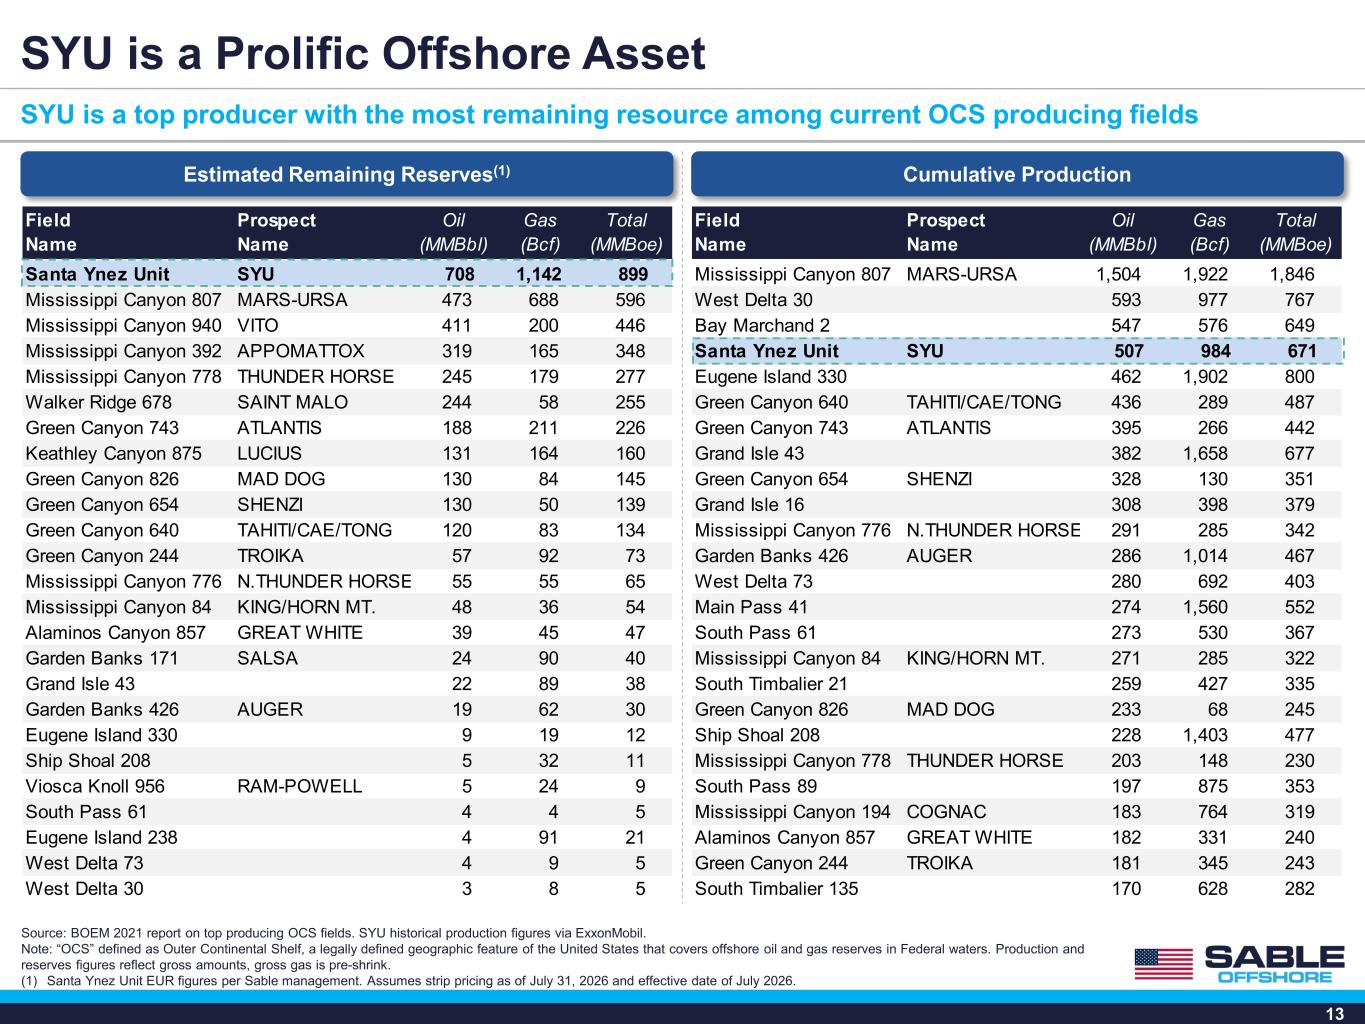
13 Field Name Prospect Name Oil (MMBbl) Gas (Bcf) Total (MMBoe) Santa Ynez Unit SYU 708 1,142 899 Mississippi Canyon 807 MARS-URSA 473 688 596 Mississippi Canyon 940 VITO 411 200 446 Mississippi Canyon 392 APPOMATTOX 319 165 348 Mississippi Canyon 778 THUNDER HORSE 245 179 277 Walker Ridge 678 SAINT MALO 244 58 255 Green Canyon 743 ATLANTIS 188 211 226 Keathley Canyon 875 LUCIUS 131 164 160 Green Canyon 826 MAD DOG 130 84 145 Green Canyon 654 SHENZI 130 50 139 Green Canyon 640 TAHITI/CAE/TONG 120 83 134 Green Canyon 244 TROIKA 57 92 73 Mississippi Canyon 776 N.THUNDER HORSE 55 55 65 Mississippi Canyon 84 KING/HORN MT. 48 36 54 Alaminos Canyon 857 GREAT WHITE 39 45 47 Garden Banks 171 SALSA 24 90 40 Grand Isle 43 22 89 38 Garden Banks 426 AUGER 19 62 30 Eugene Island 330 9 19 12 Ship Shoal 208 5 32 11 Viosca Knoll 956 RAM-POWELL 5 24 9 South Pass 61 4 4 5 Eugene Island 238 4 91 21 West Delta 73 4 9 5 West Delta 30 3 8 5 SYU is a Prolific Offshore Asset Cumulative Production Source: BOEM 2021 report on top producing OCS fields. SYU historical production figures via ExxonMobil. Note: “OCS” defined as Outer Continental Shelf, a legally defined geographic feature of the United States that covers offshore oil and gas reserves in Federal waters. Production and reserves figures reflect gross amounts, gross gas is pre-shrink. (1) Santa Ynez Unit EUR figures per Sable management. Assumes strip pricing as of July 31, 2026 and effective date of July 2026. SYU is a top producer with the most remaining resource among current OCS producing fields Field Name Prospect Name Oil (MMBbl) Gas (Bcf) Total (MMBoe) Mississippi Canyon 807 MARS-URSA 1,504 1,922 1,846 West Delta 30 593 977 767 Bay Marchand 2 547 576 649 Santa Ynez Unit SYU 507 984 671 Eugene Island 330 462 1,902 800 Green Canyon 640 TAHITI/CAE/TONG 436 289 487 Green Canyon 743 ATLANTIS 395 266 442 Grand Isle 43 382 1,658 677 Green Canyon 654 SHENZI 328 130 351 Grand Isle 16 308 398 379 Mississippi Canyon 776 N.THUNDER HORSE 291 285 342 Garden Banks 426 AUGER 286 1,014 467 West Delta 73 280 692 403 Main Pass 41 274 1,560 552 South Pass 61 273 530 367 Mississippi Canyon 84 KING/HORN MT. 271 285 322 South Timbalier 21 259 427 335 Green Canyon 826 MAD DOG 233 68 245 Ship Shoal 208 228 1,403 477 Mississippi Canyon 778 THUNDER HORSE 203 148 230 South Pass 89 197 875 353 Mississippi Canyon 194 COGNAC 183 764 319 Alaminos Canyon 857 GREAT WHITE 182 331 240 Green Canyon 244 TROIKA 181 345 243 South Timbalier 135 170 628 282 Estimated Remaining Reserves(1)
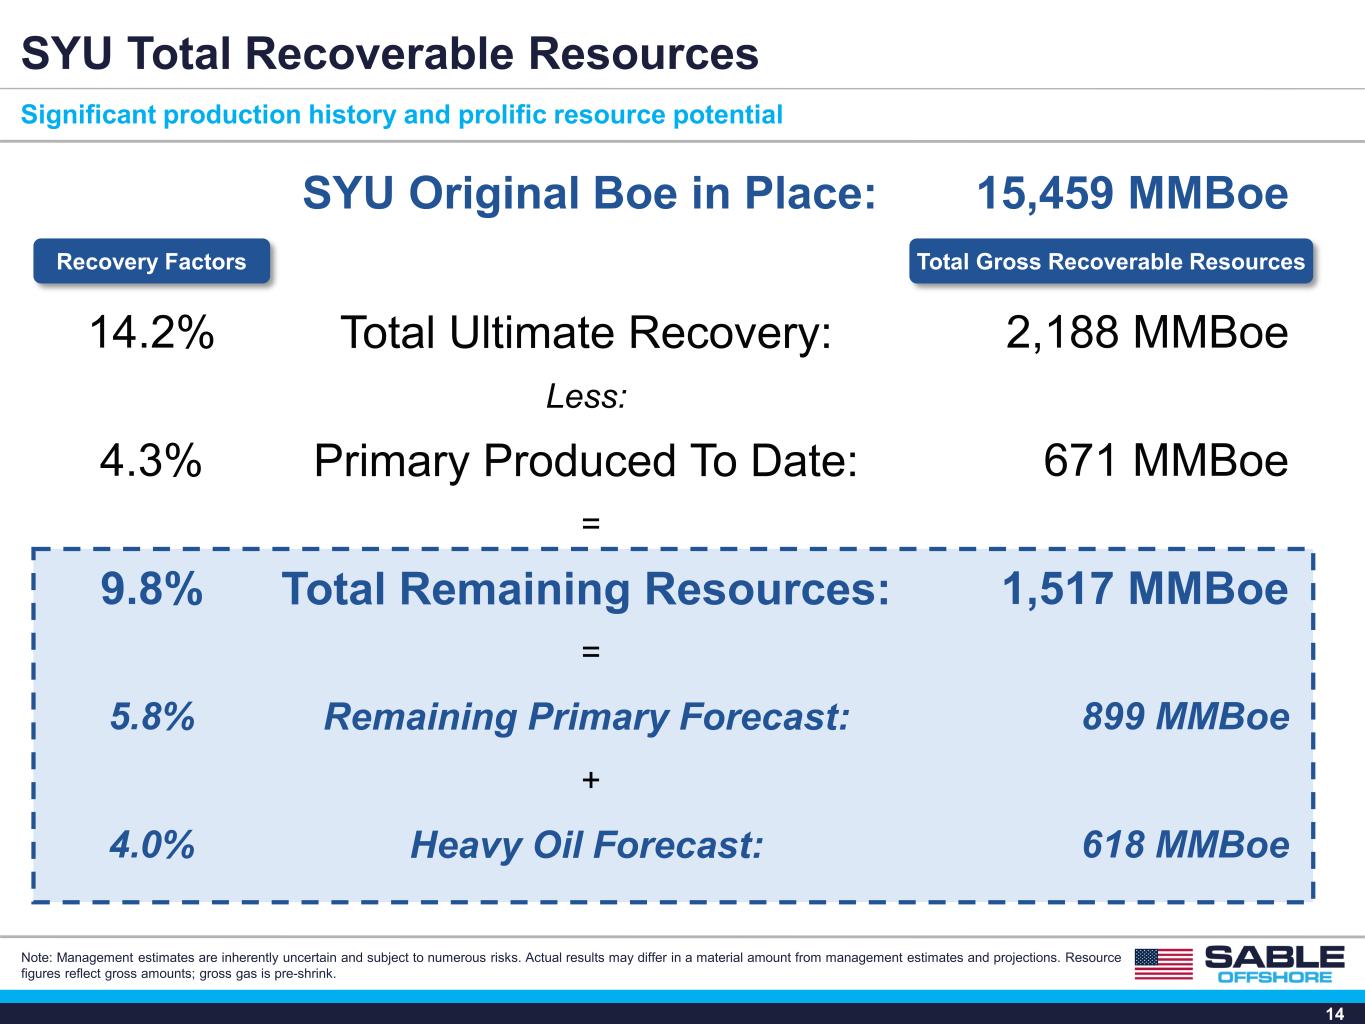
14 SYU Total Recoverable Resources Significant production history and prolific resource potential Note: Management estimates are inherently uncertain and subject to numerous risks. Actual results may differ in a material amount from management estimates and projections. Resource figures reflect gross amounts; gross gas is pre-shrink. 15,459 MMBoe Primary Produced To Date: Remaining Primary Forecast: Heavy Oil Forecast: 2,188 MMBoe Total Remaining Resources: Recovery Factors Total Gross Recoverable Resources 14.2% Total Ultimate Recovery: 4.3% 671 MMBoe 1,517 MMBoe 5.8% 899 MMBoe 4.0% 618 MMBoe 9.8% Less: = = + SYU Original Boe in Place:
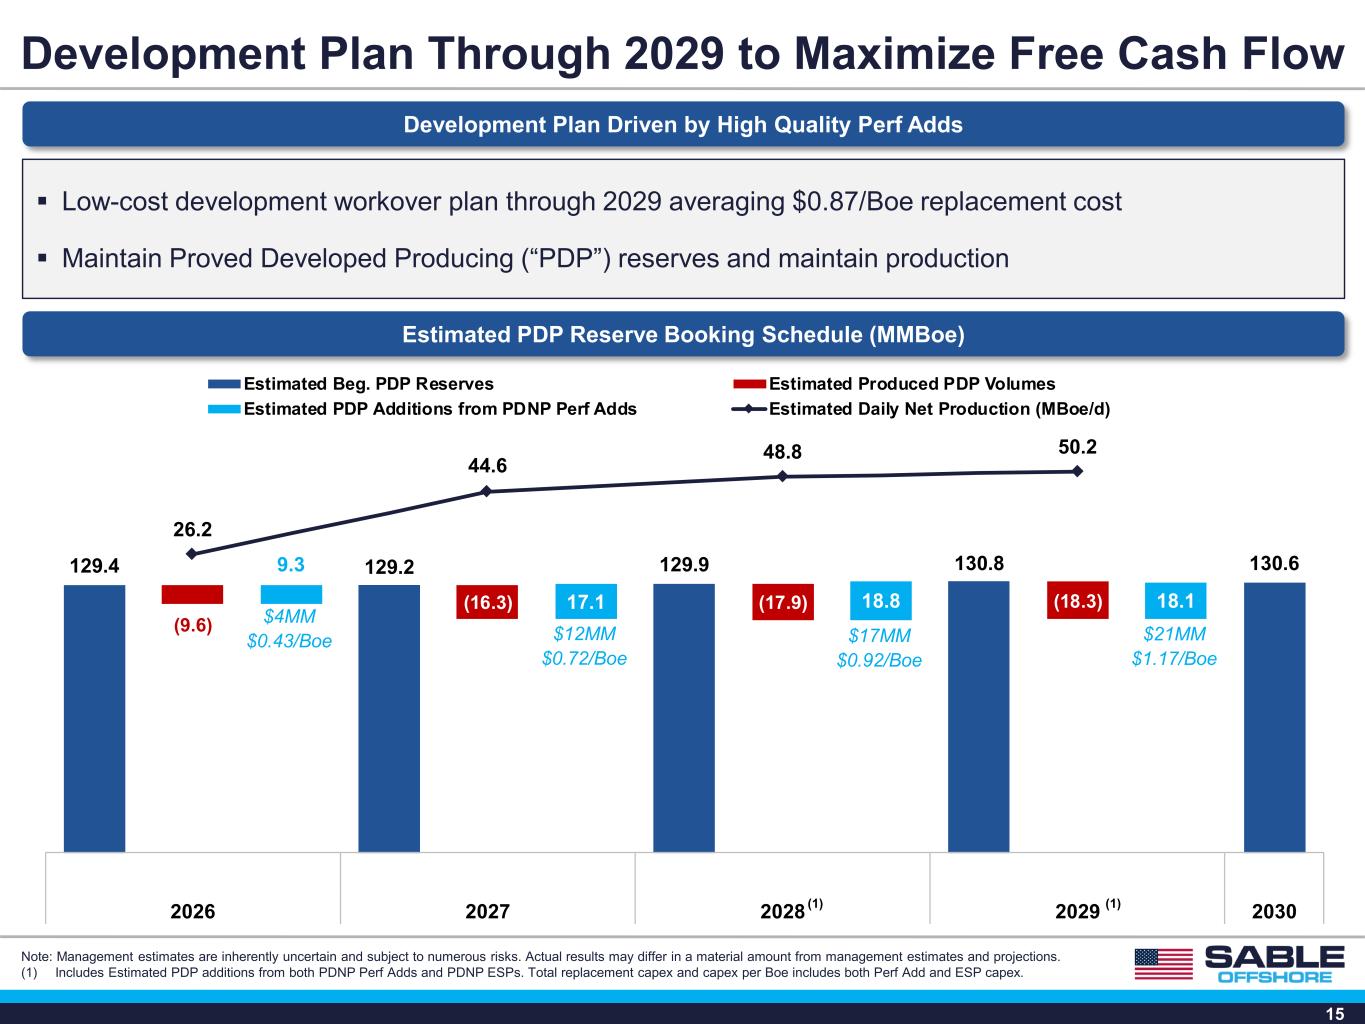
15 Development Plan Through 2029 to Maximize Free Cash Flow Development Plan Driven by High Quality Perf Adds Estimated PDP Reserve Booking Schedule (MMBoe) (9.6) (16.3) (17.9) (18.3) 9.3 17.1 18.8 18.1 129.4 129.2 129.9 130.8 130.6 26.2 44.6 48.8 50.2 2026 2027 2028 2029 2030 Estimated Beg. PDP Reserves Estimated Produced PDP Volumes Estimated PDP Additions from PDNP Perf Adds Estimated Daily Net Production (MBoe/d) Low-cost development workover plan through 2029 averaging $0.87/Boe replacement cost Maintain Proved Developed Producing (“PDP”) reserves and maintain production $4MM $0.43/Boe $12MM $0.72/Boe $17MM $0.92/Boe $21MM $1.17/Boe Note: Management estimates are inherently uncertain and subject to numerous risks. Actual results may differ in a material amount from management estimates and projections. (1) Includes Estimated PDP additions from both PDNP Perf Adds and PDNP ESPs. Total replacement capex and capex per Boe includes both Perf Add and ESP capex. (1) (1)
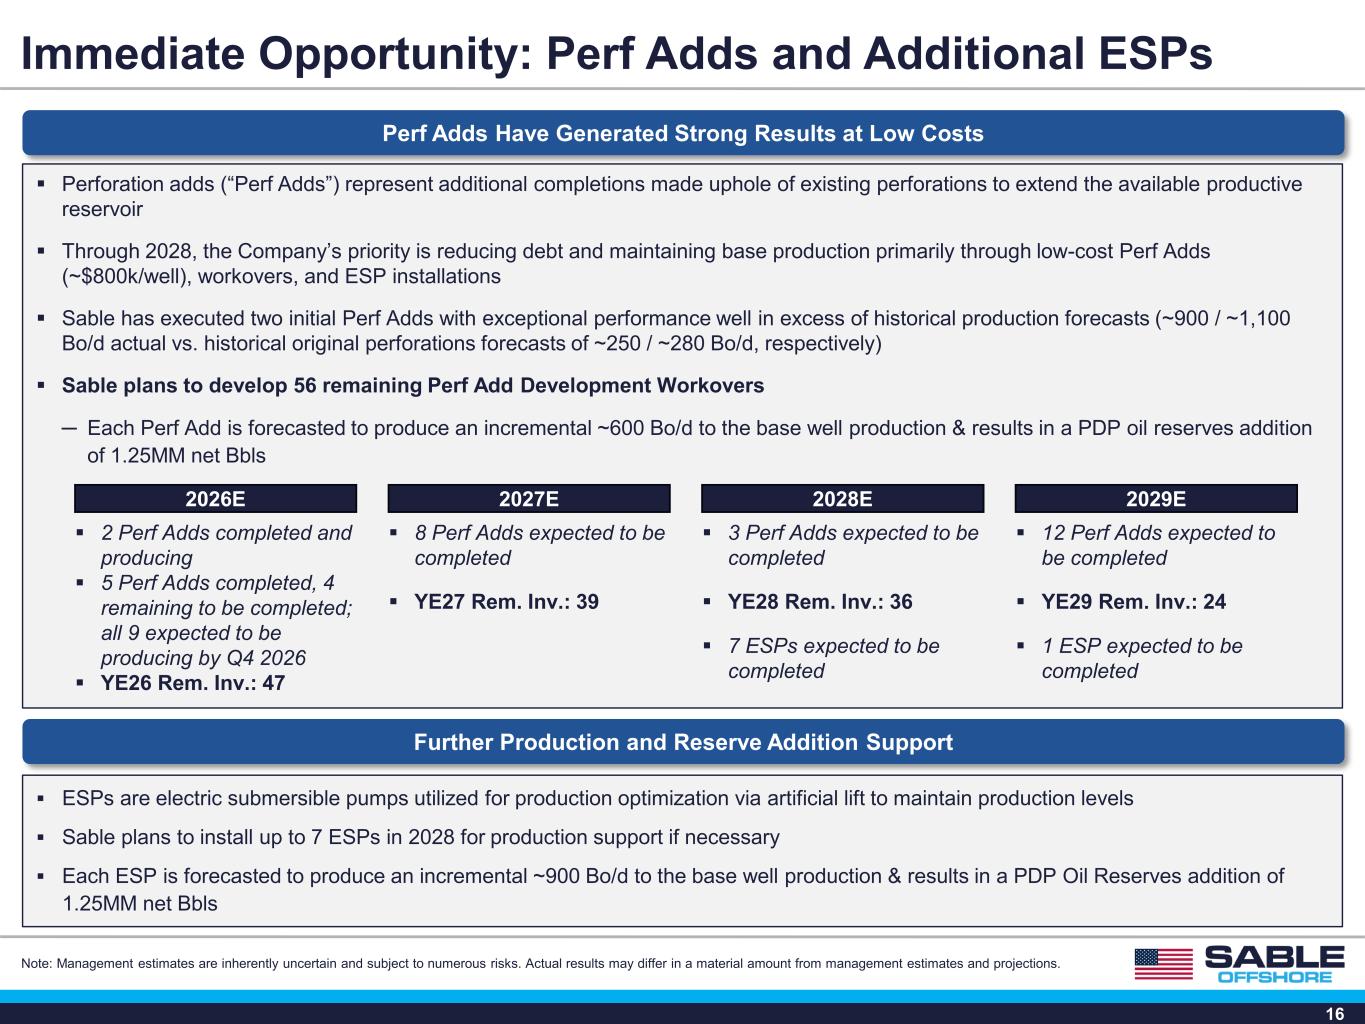
16 Immediate Opportunity: Perf Adds and Additional ESPs Perf Adds Have Generated Strong Results at Low Costs Perforation adds (“Perf Adds”) represent additional completions made uphole of existing perforations to extend the available productive reservoir Through 2028, the Company’s priority is reducing debt and maintaining base production primarily through low-cost Perf Adds (~$800k/well), workovers, and ESP installations Sable has executed two initial Perf Adds with exceptional performance well in excess of historical production forecasts (~900 / ~1,100 Bo/d actual vs. historical original perforations forecasts of ~250 / ~280 Bo/d, respectively) Sable plans to develop 56 remaining Perf Add Development Workovers ─ Each Perf Add is forecasted to produce an incremental ~600 Bo/d to the base well production & results in a PDP oil reserves addition of 1.25MM net Bbls ESPs are electric submersible pumps utilized for production optimization via artificial lift to maintain production levels Sable plans to install up to 7 ESPs in 2028 for production support if necessary Each ESP is forecasted to produce an incremental ~900 Bo/d to the base well production & results in a PDP Oil Reserves addition of 1.25MM net Bbls 2 Perf Adds completed and producing 5 Perf Adds completed, 4 remaining to be completed; all 9 expected to be producing by Q4 2026 YE26 Rem. Inv.: 47 2026E 8 Perf Adds expected to be completed YE27 Rem. Inv.: 39 2027E 3 Perf Adds expected to be completed YE28 Rem. Inv.: 36 7 ESPs expected to be completed 2028E 12 Perf Adds expected to be completed YE29 Rem. Inv.: 24 1 ESP expected to be completed 2029E Further Production and Reserve Addition Support Note: Management estimates are inherently uncertain and subject to numerous risks. Actual results may differ in a material amount from management estimates and projections.
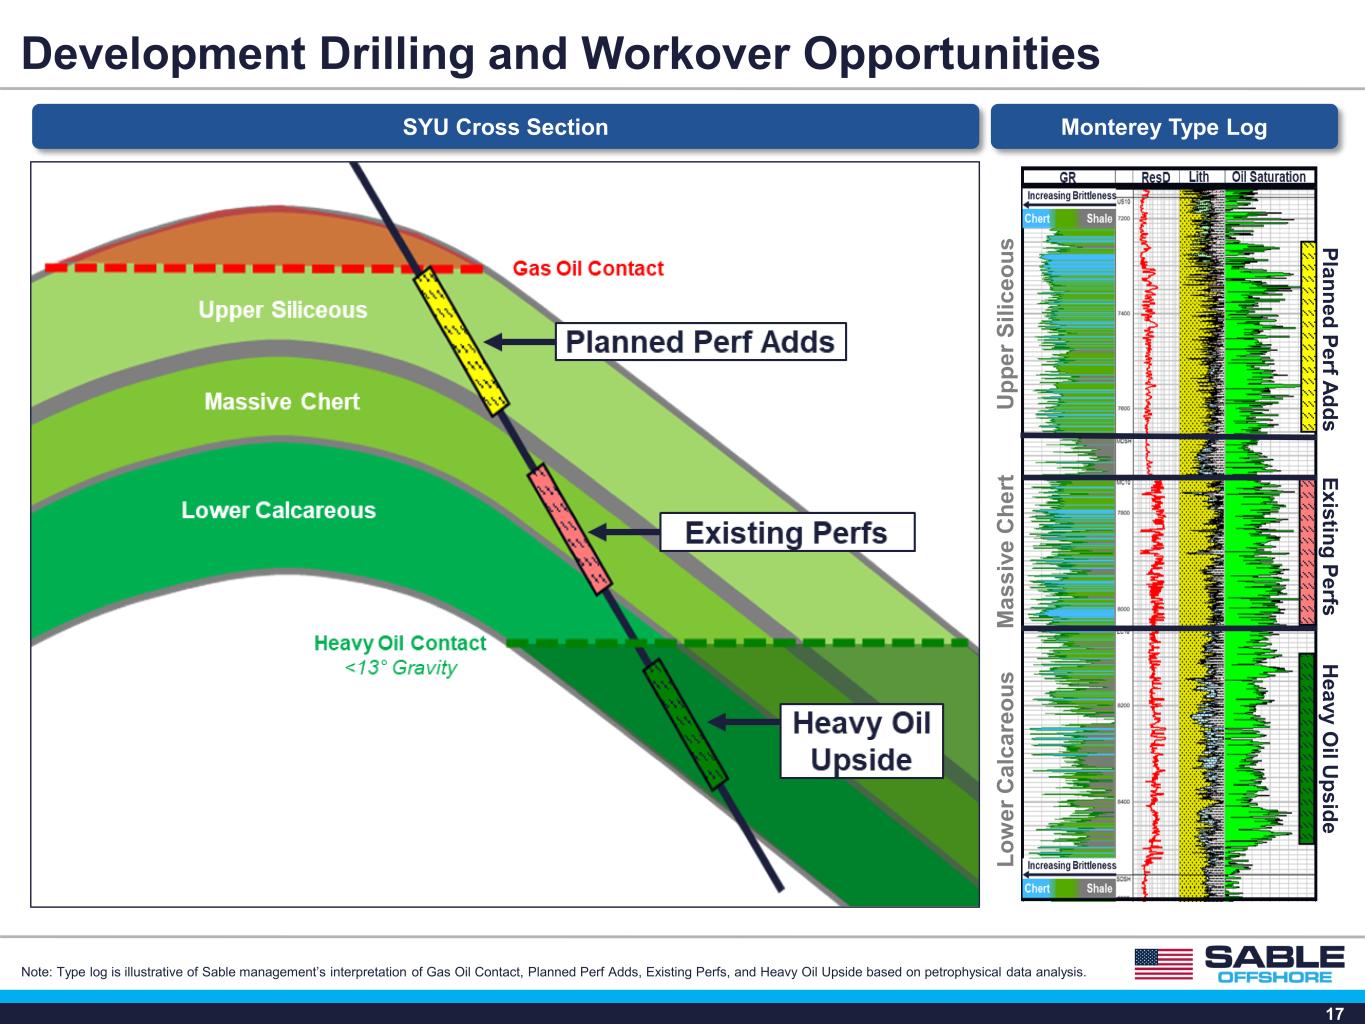
17 Development Drilling and Workover Opportunities U pp er S ili ce ou s M as si ve C he rt Lo w er C al ca re ou s Existing Perfs Planned Perf Adds H eavy O il U pside SYU Cross Section Monterey Type Log Note: Type log is illustrative of Sable management’s interpretation of Gas Oil Contact, Planned Perf Adds, Existing Perfs, and Heavy Oil Upside based on petrophysical data analysis.
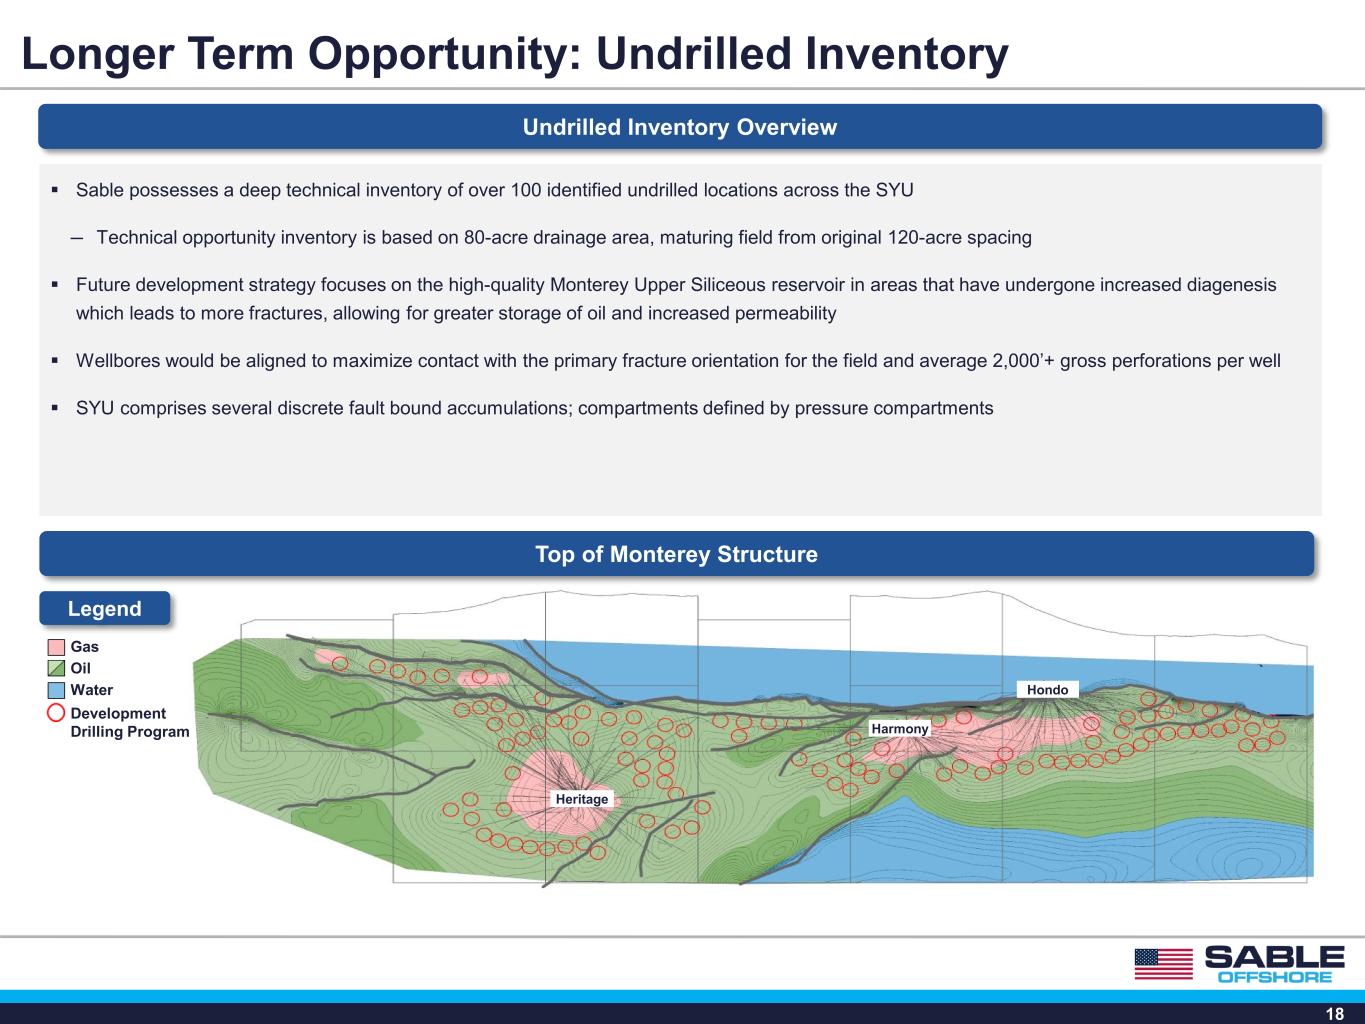
18 Longer Term Opportunity: Undrilled Inventory Sable possesses a deep technical inventory of over 100 identified undrilled locations across the SYU ─ Technical opportunity inventory is based on 80-acre drainage area, maturing field from original 120-acre spacing Future development strategy focuses on the high-quality Monterey Upper Siliceous reservoir in areas that have undergone increased diagenesis which leads to more fractures, allowing for greater storage of oil and increased permeability Wellbores would be aligned to maximize contact with the primary fracture orientation for the field and average 2,000’+ gross perforations per well SYU comprises several discrete fault bound accumulations; compartments defined by pressure compartments Undrilled Inventory Overview Top of Monterey Structure Legend Gas Oil Water Development Drilling Program Heritage Harmony Hondo
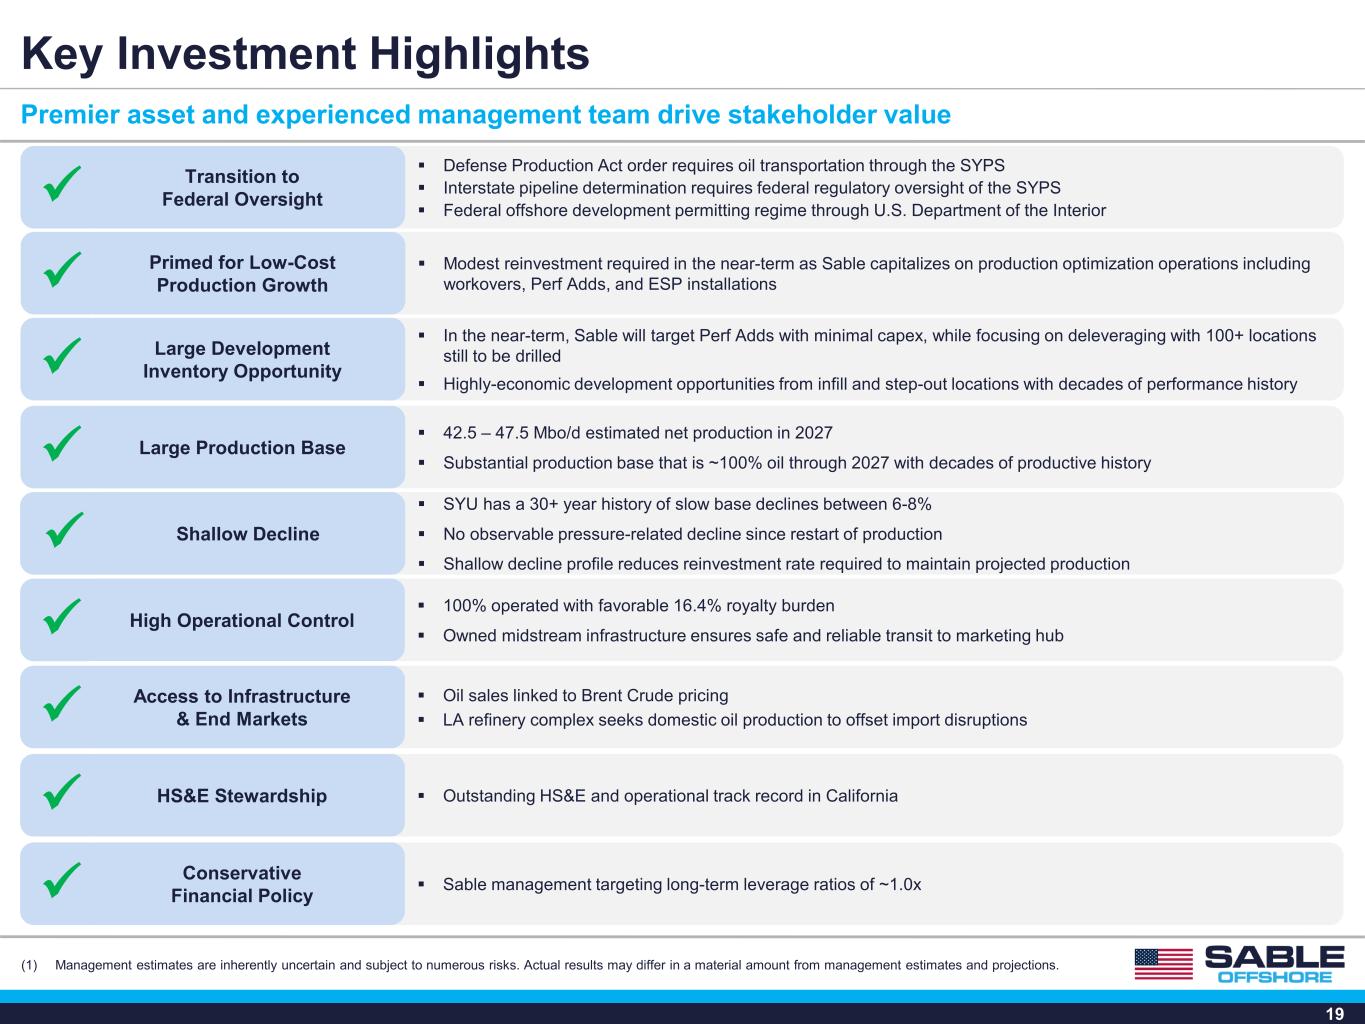
19 Key Investment Highlights SYU has a 30+ year history of slow base declines between 6-8% No observable pressure-related decline since restart of production Shallow decline profile reduces reinvestment rate required to maintain projected production Shallow Decline Modest reinvestment required in the near-term as Sable capitalizes on production optimization operations including workovers, Perf Adds, and ESP installations Primed for Low-Cost Production Growth In the near-term, Sable will target Perf Adds with minimal capex, while focusing on deleveraging with 100+ locations still to be drilled Highly-economic development opportunities from infill and step-out locations with decades of performance history Large Development Inventory Opportunity 100% operated with favorable 16.4% royalty burden Owned midstream infrastructure ensures safe and reliable transit to marketing hub High Operational Control 42.5 – 47.5 Mbo/d estimated net production in 2027 Substantial production base that is ~100% oil through 2027 with decades of productive history Large Production Base Oil sales linked to Brent Crude pricing LA refinery complex seeks domestic oil production to offset import disruptions Access to Infrastructure & End Markets Premier asset and experienced management team drive stakeholder value Defense Production Act order requires oil transportation through the SYPS Interstate pipeline determination requires federal regulatory oversight of the SYPS Federal offshore development permitting regime through U.S. Department of the Interior Transition to Federal Oversight Outstanding HS&E and operational track record in CaliforniaHS&E Stewardship Sable management targeting long-term leverage ratios of ~1.0xConservative Financial Policy (1) Management estimates are inherently uncertain and subject to numerous risks. Actual results may differ in a material amount from management estimates and projections.
Appendix
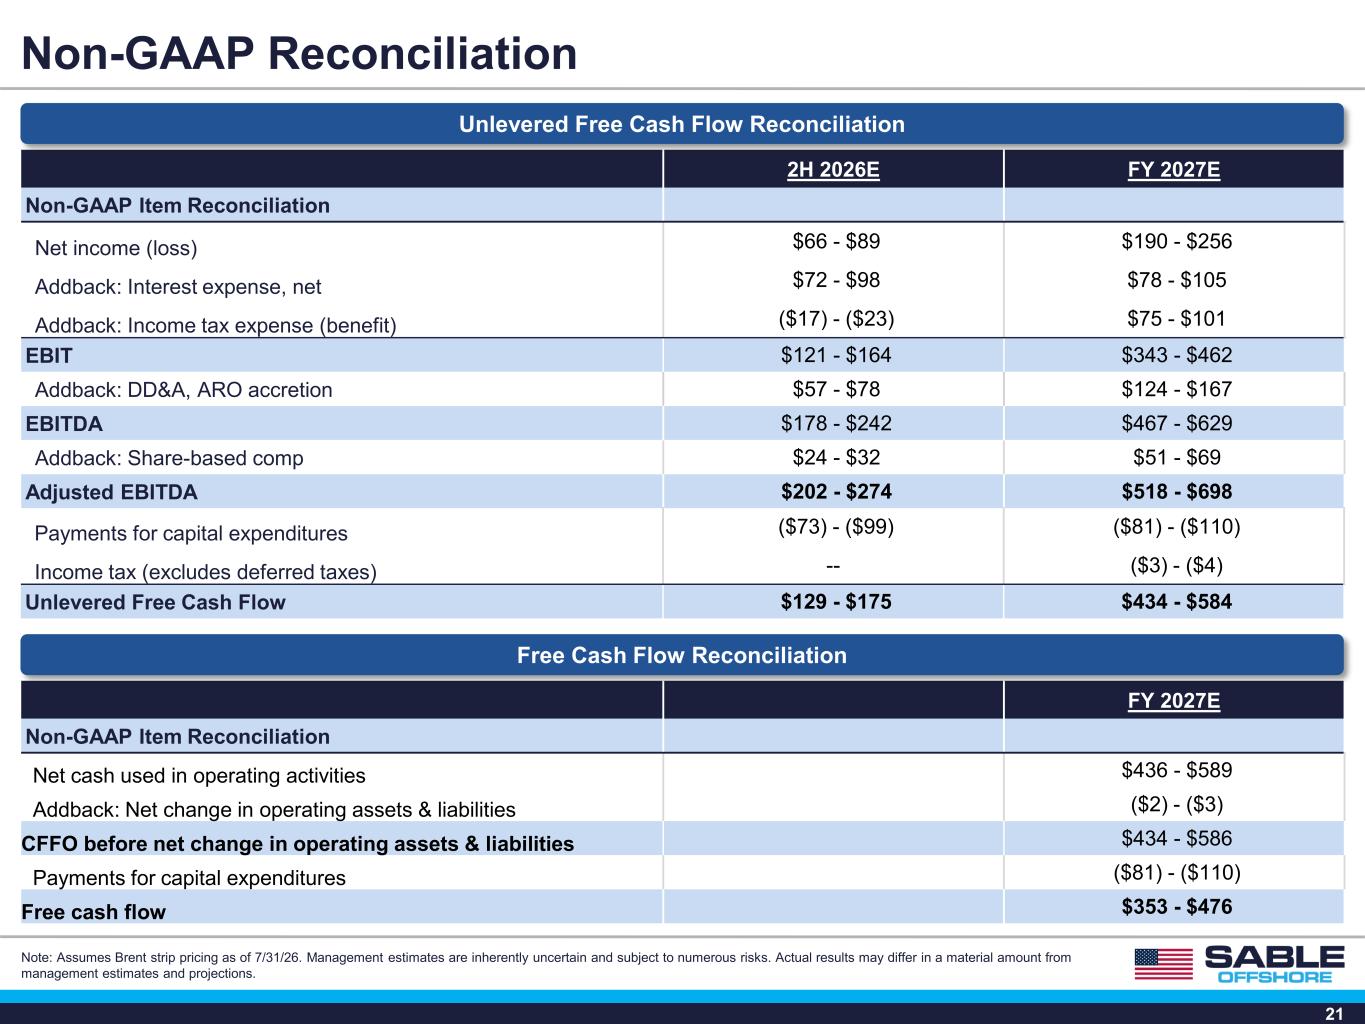
21 Non-GAAP Reconciliation 2H 2026E FY 2027E Non-GAAP Item Reconciliation Net income (loss) $66 - $89 $190 - $256 Addback: Interest expense, net $72 - $98 $78 - $105 Addback: Income tax expense (benefit) ($17) - ($23) $75 - $101 EBIT $121 - $164 $343 - $462 Addback: DD&A, ARO accretion $57 - $78 $124 - $167 EBITDA $178 - $242 $467 - $629 Addback: Share-based comp $24 - $32 $51 - $69 Adjusted EBITDA $202 - $274 $518 - $698 Payments for capital expenditures ($73) - ($99) ($81) - ($110) Income tax (excludes deferred taxes) -- ($3) - ($4) Unlevered Free Cash Flow $129 - $175 $434 - $584 Note: Assumes Brent strip pricing as of 7/31/26. Management estimates are inherently uncertain and subject to numerous risks. Actual results may differ in a material amount from management estimates and projections. FY 2027E Non-GAAP Item Reconciliation Net cash used in operating activities $436 - $589 Addback: Net change in operating assets & liabilities ($2) - ($3) CFFO before net change in operating assets & liabilities $434 - $586 Payments for capital expenditures ($81) - ($110) Free cash flow $353 - $476 Unlevered Free Cash Flow Reconciliation Free Cash Flow Reconciliation
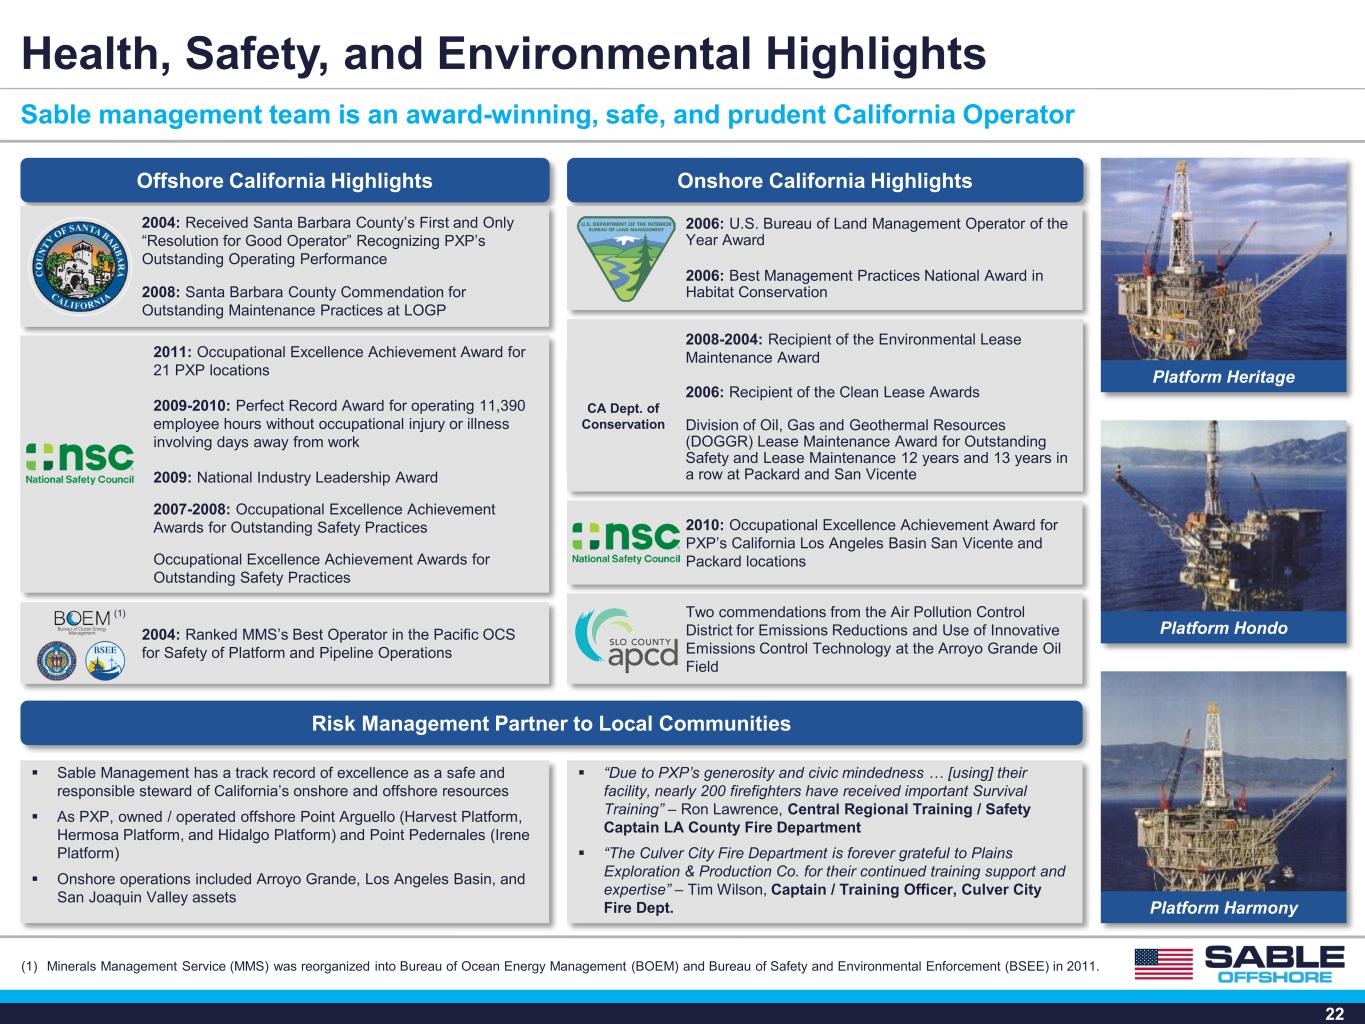
22 Sable management team is an award-winning, safe, and prudent California Operator Two commendations from the Air Pollution Control District for Emissions Reductions and Use of Innovative Emissions Control Technology at the Arroyo Grande Oil Field “Due to PXP’s generosity and civic mindedness … [using] their facility, nearly 200 firefighters have received important Survival Training” – Ron Lawrence, Central Regional Training / Safety Captain LA County Fire Department “The Culver City Fire Department is forever grateful to Plains Exploration & Production Co. for their continued training support and expertise” – Tim Wilson, Captain / Training Officer, Culver City Fire Dept. Health, Safety, and Environmental Highlights Risk Management Partner to Local Communities Offshore California Highlights Sable Management has a track record of excellence as a safe and responsible steward of California’s onshore and offshore resources As PXP, owned / operated offshore Point Arguello (Harvest Platform, Hermosa Platform, and Hidalgo Platform) and Point Pedernales (Irene Platform) Onshore operations included Arroyo Grande, Los Angeles Basin, and San Joaquin Valley assets 2011: Occupational Excellence Achievement Award for 21 PXP locations 2009-2010: Perfect Record Award for operating 11,390 employee hours without occupational injury or illness involving days away from work 2009: National Industry Leadership Award 2007-2008: Occupational Excellence Achievement Awards for Outstanding Safety Practices Occupational Excellence Achievement Awards for Outstanding Safety Practices 2008-2004: Recipient of the Environmental Lease Maintenance Award 2006: Recipient of the Clean Lease Awards Division of Oil, Gas and Geothermal Resources (DOGGR) Lease Maintenance Award for Outstanding Safety and Lease Maintenance 12 years and 13 years in a row at Packard and San Vicente 2004: Received Santa Barbara County’s First and Only “Resolution for Good Operator” Recognizing PXP’s Outstanding Operating Performance 2008: Santa Barbara County Commendation for Outstanding Maintenance Practices at LOGP 2004: Ranked MMS’s Best Operator in the Pacific OCS for Safety of Platform and Pipeline Operations Onshore California Highlights 2010: Occupational Excellence Achievement Award for PXP’s California Los Angeles Basin San Vicente and Packard locations 2006: U.S. Bureau of Land Management Operator of the Year Award 2006: Best Management Practices National Award in Habitat Conservation (1) (1) Minerals Management Service (MMS) was reorganized into Bureau of Ocean Energy Management (BOEM) and Bureau of Safety and Environmental Enforcement (BSEE) in 2011. Platform Hondo Platform Harmony Platform Heritage CA Dept. of Conservation
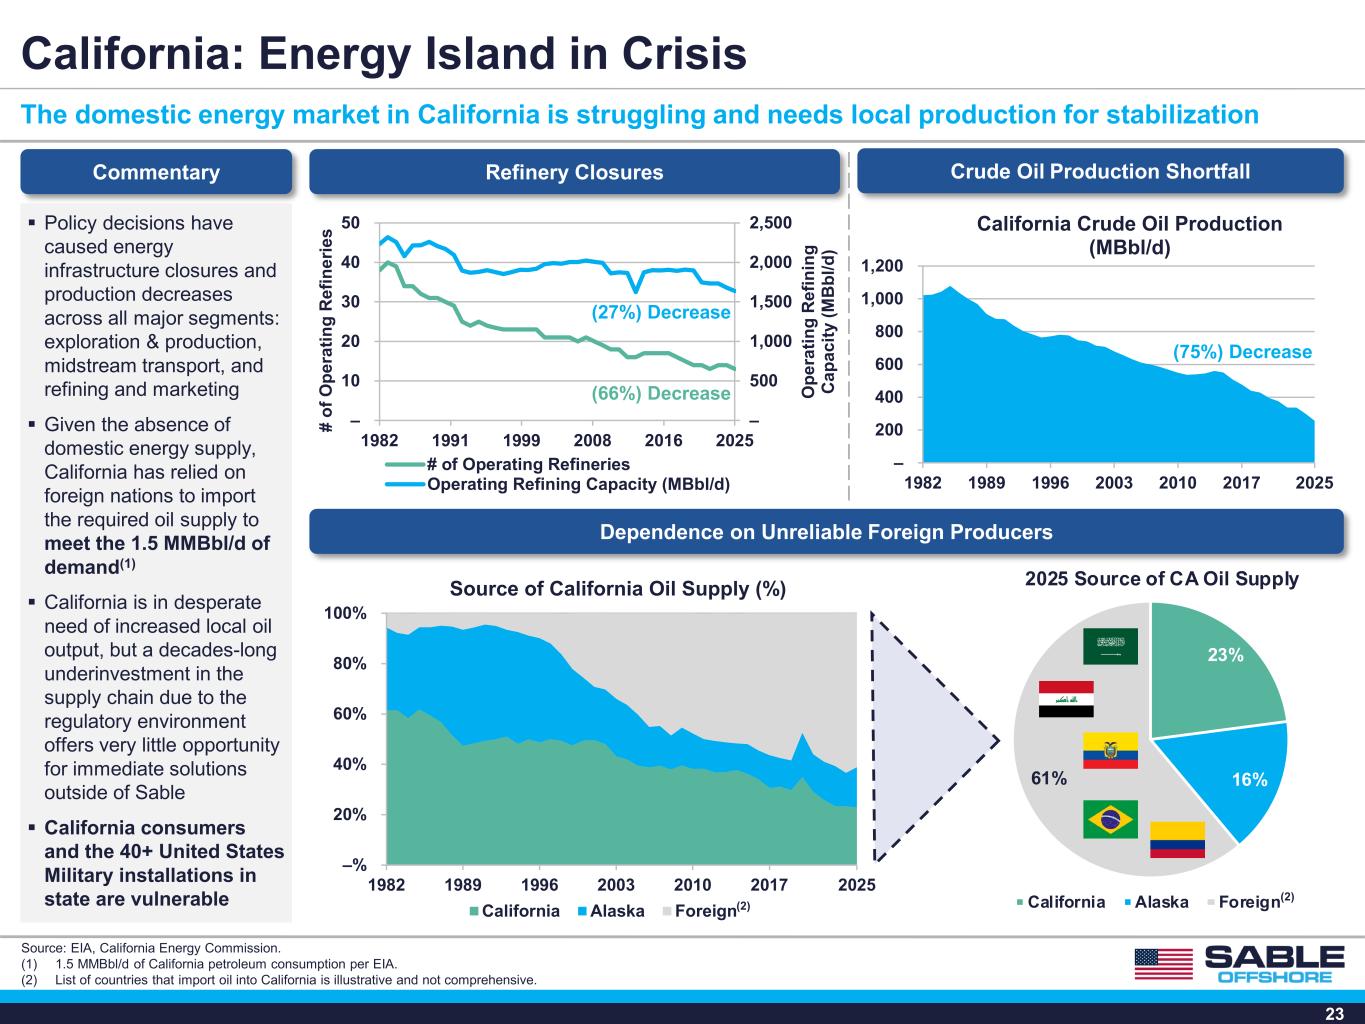
23 California: Energy Island in Crisis The domestic energy market in California is struggling and needs local production for stabilization Refinery Closures Source: EIA, California Energy Commission. (1) 1.5 MMBbl/d of California petroleum consumption per EIA. (2) List of countries that import oil into California is illustrative and not comprehensive. Commentary Policy decisions have caused energy infrastructure closures and production decreases across all major segments: exploration & production, midstream transport, and refining and marketing Given the absence of domestic energy supply, California has relied on foreign nations to import the required oil supply to meet the 1.5 MMBbl/d of demand(1) California is in desperate need of increased local oil output, but a decades-long underinvestment in the supply chain due to the regulatory environment offers very little opportunity for immediate solutions outside of Sable California consumers and the 40+ United States Military installations in state are vulnerable Dependence on Unreliable Foreign Producers Crude Oil Production Shortfall – 500 1,000 1,500 2,000 2,500 – 10 20 30 40 50 1982 1991 1999 2008 2016 2025 O pe ra tin g R ef in in g C ap ac ity (M B bl /d ) # of O pe ra tin g R ef in er ie s # of Operating Refineries Operating Refining Capacity (MBbl/d) (66%) Decrease (27%) Decrease – 200 400 600 800 1,000 1,200 1982 1989 1996 2003 2010 2017 2025 California Crude Oil Production (MBbl/d) (75%) Decrease 23% 16% 61% 2025 Source of CA Oil Supply California Alaska Foreign –% 20% 40% 60% 80% 100% 1982 1989 1996 2003 2010 2017 2025 Source of California Oil Supply (%) California Alaska Foreign (2) (2)
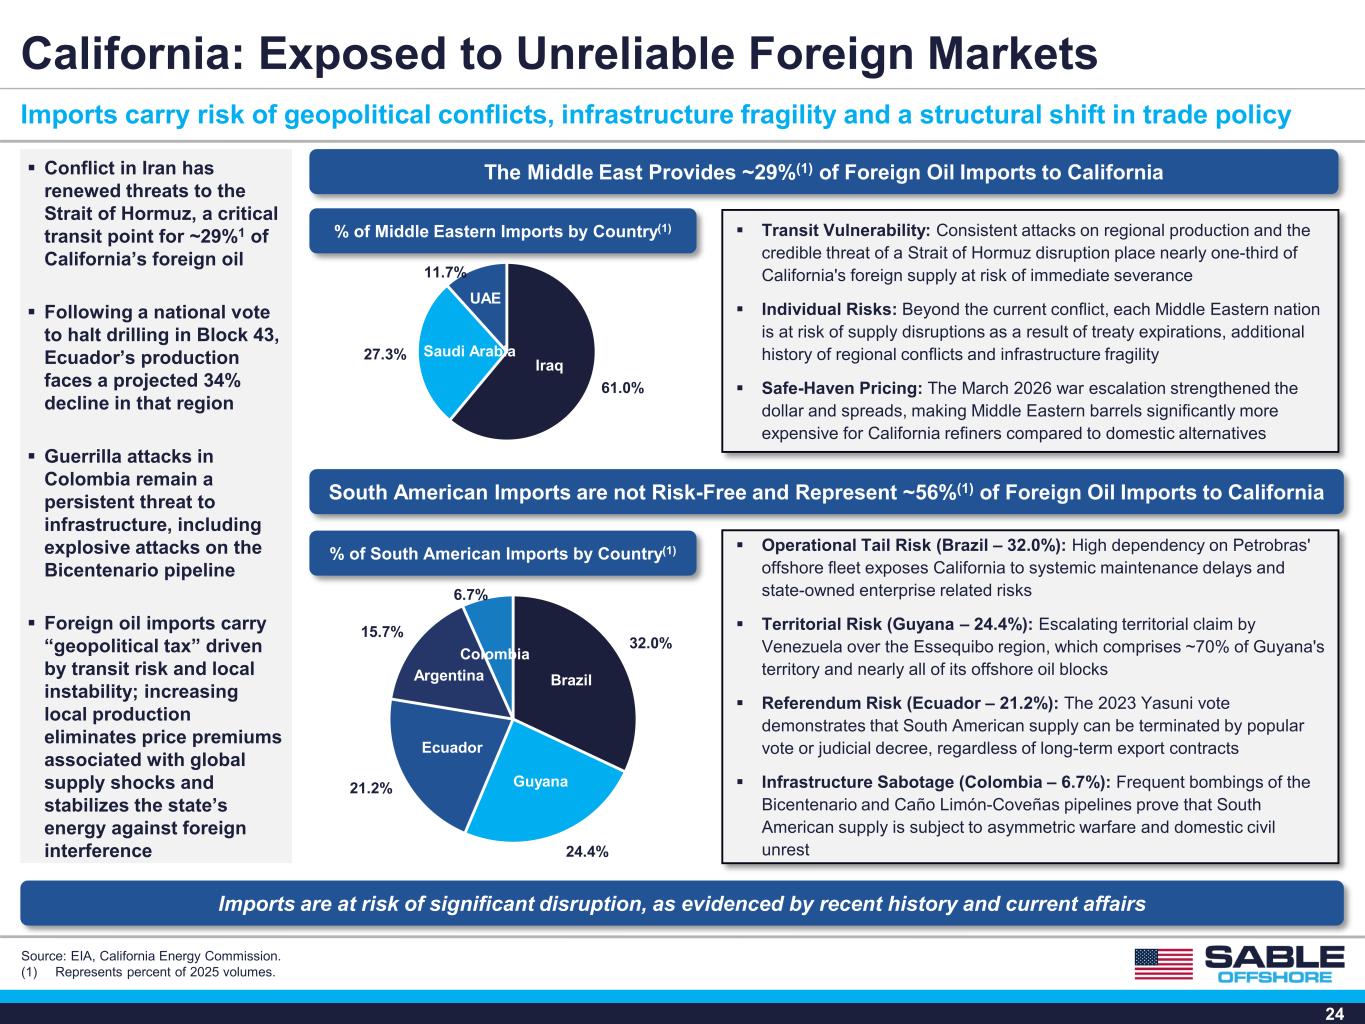
24 California: Exposed to Unreliable Foreign Markets Imports carry risk of geopolitical conflicts, infrastructure fragility and a structural shift in trade policy The Middle East Provides ~29%(1) of Foreign Oil Imports to California Source: EIA, California Energy Commission. (1) Represents percent of 2025 volumes. % of South American Imports by Country(1) Conflict in Iran has renewed threats to the Strait of Hormuz, a critical transit point for ~29%1 of California’s foreign oil Following a national vote to halt drilling in Block 43, Ecuador’s production faces a projected 34% decline in that region Guerrilla attacks in Colombia remain a persistent threat to infrastructure, including explosive attacks on the Bicentenario pipeline Foreign oil imports carry “geopolitical tax” driven by transit risk and local instability; increasing local production eliminates price premiums associated with global supply shocks and stabilizes the state’s energy against foreign interference South American Imports are not Risk-Free and Represent ~56%(1) of Foreign Oil Imports to California 61.0% 27.3% 11.7% Iraq Saudi Arabia UAE Transit Vulnerability: Consistent attacks on regional production and the credible threat of a Strait of Hormuz disruption place nearly one-third of California's foreign supply at risk of immediate severance Individual Risks: Beyond the current conflict, each Middle Eastern nation is at risk of supply disruptions as a result of treaty expirations, additional history of regional conflicts and infrastructure fragility Safe-Haven Pricing: The March 2026 war escalation strengthened the dollar and spreads, making Middle Eastern barrels significantly more expensive for California refiners compared to domestic alternatives 32.0% 24.4% 21.2% 15.7% 6.7% Operational Tail Risk (Brazil – 32.0%): High dependency on Petrobras' offshore fleet exposes California to systemic maintenance delays and state-owned enterprise related risks Territorial Risk (Guyana – 24.4%): Escalating territorial claim by Venezuela over the Essequibo region, which comprises ~70% of Guyana's territory and nearly all of its offshore oil blocks Referendum Risk (Ecuador – 21.2%): The 2023 Yasuni vote demonstrates that South American supply can be terminated by popular vote or judicial decree, regardless of long-term export contracts Infrastructure Sabotage (Colombia – 6.7%): Frequent bombings of the Bicentenario and Caño Limón-Coveñas pipelines prove that South American supply is subject to asymmetric warfare and domestic civil unrest Brazil Guyana Ecuador Argentina Colombia % of Middle Eastern Imports by Country(1) Imports are at risk of significant disruption, as evidenced by recent history and current affairs