Q2 2026 Earnings Supplement August 2026 Exhibit 99.2
Disclaimer Repay Holdings Corporation (“REPAY” or the “Company”) is required to file annual, quarterly and current reports, proxy statements and other information with the Securities and Exchange Commission (“SEC”) Such filings, which you may obtain for free at the SEC’s website at http://www.sec.gov, discuss some of the important risk factors that may affect REPAY’s business, results of operations and financial condition. Forward-Looking Statements This presentation (the “Presentation”) contains “forward-looking statements” within the meaning of the Private Securities Litigation Reform Act of 1995. Such statements include, but are not limited to, statements about future financial and operating results, REPAY’s plans, objectives, expectations and intentions with respect to future operations, products and services; and other statements identified by words such as “will likely result,” “are expected to,” “will continue,” “is anticipated,” “estimated,” “believe,” “intend,” “plan,” “projection,” “outlook” or words of similar meaning. These forward-looking statements include, but are not limited to, REPAY’s 2026 outlook and other financial guidance, anticipated benefits from the KUBRA acquisition, expected demand on REPAY’s product offering, including further implementation of electronic payment options and statements regarding REPAY’s market and growth opportunities, and REPAY’s business strategy and the plans and objectives of management for future operations. Such forward-looking statements are based upon the current beliefs and expectations of REPAY’s management and are inherently subject to significant business, economic and competitive uncertainties and contingencies, many of which are difficult to predict and generally beyond REPAY’s control. In addition to factors previously disclosed in REPAY’s reports filed with the SEC, including its Annual Report on Form 10-K for the year ended December 31, 2025 and Quarterly Report on Form 10-Q for the quarter ended June 30, 2026, the following factors, among others, could cause actual results and the timing of events to differ materially from the anticipated results or other expectations expressed in the forward-looking statements: the inability to integrate and/or realize the benefits of the KUBRA transaction, including expected synergies; that the KUBRA acquisition could disrupt the Company’s relationships with customers, employees or other business partners; the impact, cost and effect of actions by activist stockholders; the risk that our stockholder rights plan may delay, discourage or prevent a change of control or acquisition of the Company, even if such action may be considered beneficial by some stockholders; exposure to economic conditions and political risk affecting the consumer loan market, the receivables management industry, the utilities industry and consumer and commercial spending, including bank failures or other adverse events affecting financial institutions, inflationary pressures, evolving U.S. trade policies, or general economic slowdown; changes in the payment processing market in which REPAY competes, including with respect to its competitive landscape, technology evolution or regulatory changes; changes in the vertical markets that REPAY targets, including the regulatory environment applicable to REPAY’s clients; the ability to retain, develop and hire key personnel; risks relating to REPAY’s relationships within the payment ecosystem; risk that REPAY may not be able to execute its growth strategies, including identifying and executing acquisitions; risks relating to data security; changes in accounting policies applicable to REPAY; and the risk that REPAY may not be able to maintain effective internal controls. Actual results, performance or achievements may differ materially, and potentially adversely, from any projections and forward-looking statements and the assumptions on which those forward-looking statements are based. There can be no assurance that the data contained herein is reflective of future performance to any degree. You are cautioned not to place undue reliance on forward-looking statements as a predictor of future performance. All information set forth herein speaks only as of the date hereof in the case of information about REPAY or the date of such information in the case of information from persons other than REPAY, and REPAY disclaims any intention or obligation to update any forward-looking statements as a result of developments occurring after the date of this Presentation. Forecasts and estimates regarding our industry and end markets are based on sources REPAY believes to be reliable, however there can be no assurance these forecasts and estimates will prove accurate in whole or in part. Annualized, pro forma, projected and estimated numbers are used for illustrative purpose only, are not forecasts and may not reflect actual results. Industry and Market Data The information contained herein also includes information provided by third parties, such as market research firms. Neither of REPAY nor its affiliates and any third parties that provide information to REPAY, such as market research firms, guarantee the accuracy, completeness, timeliness or availability of any information. Neither REPAY nor its affiliates and any third parties that provide information to REPAY, such as market research firms, are responsible for any errors or omissions (negligent or otherwise), regardless of the cause, or the results obtained from the use of such content. Neither REPAY nor its affiliates give any express or implied warranties, including, but not limited to, any warranties of merchantability or fitness for a particular purpose or use, and they expressly disclaim any responsibility or liability for direct, indirect, incidental, exemplary, compensatory, punitive, special or consequential damages, costs, expenses, legal fees or losses (including lost income or profits and opportunity costs) in connection with the use of the information herein. Non-GAAP Financial Measures This Presentation includes certain non-GAAP financial measures that REPAY’s management uses to evaluate its operating business, measure its performance and make strategic decisions. Adjusted EBITDA is a non-GAAP financial measure that represents net income prior to interest expense, tax expense, depreciation and amortization, as adjusted to add back certain charges deemed to not be part of normal operating expenses, non-cash and/or non-recurring charges, such as non-cash impairment loss, loss on business disposition, loss on extinguishment of debt, loss on termination of interest rate hedge, non-cash change in fair value of contingent consideration, non-cash change in fair value of assets and liabilities, share-based compensation charges, transaction expenses, restructuring and other strategic initiative costs and other non-recurring charges. Adjusted EBITDA margin is a non-GAAP financial measure that represents Adjusted EBITDA divided by GAAP revenue. Adjusted Net Income is a non-GAAP financial measure that represents net income prior to amortization of acquisition-related intangibles, as adjusted to add back certain charges deemed to not be part of normal operating expenses, non-cash and/or non-recurring charges, such as non-cash impairment loss, loss on business disposition, loss on extinguishment of debt, loss on termination of interest rate hedge, non-cash change in fair value of contingent consideration, non-cash change in fair value of assets and liabilities, share-based compensation expense, transaction expenses, restructuring and strategic initiative costs and other non-recurring charges, non-cash interest expense, net of tax effect associated with these adjustments. Adjusted Net Income is adjusted to exclude amortization of all acquisition-related intangibles as such amounts are inconsistent in amount and frequency and are significantly impacted by the timing and/or size of acquisitions. Management believes that the adjustment of acquisition-related intangible amortization supplements GAAP financial measures because it allows for greater comparability of operating performance. Although management excludes amortization from acquisition-related intangibles from REPAY’s non-GAAP expenses, management believes that it is important for investors to understand that such intangibles were recorded as part of purchase accounting and contribute to revenue generation. Organic revenue growth is a non-GAAP financial measure that represents the percentage change in the applicable metric for a fiscal period over the comparable prior fiscal period, exclusive of any incremental amount attributable to acquisitions or divestitures made in the comparable prior fiscal period or any subsequent fiscal period through the applicable current fiscal period. Any financial measure (whether GAAP or non-GAAP) that is modified by “excl. political media” or “normalized” is a non-GAAP financial measure that measures a defined growth rate exclusive of the estimated contribution from political media clients in the prior corresponding period. Free Cash Flow is a non-GAAP financial measure that represents net cash flow provided by operating activities less total capital expenditures. Free Cash Flow Conversion represents Free Cash Flow divided by Adjusted EBITDA. Adjusted Free Cash Flow is a non-GAAP financial measure that represents Free Cash Flow plus technology, merger and integration costs. Adjusted Free Cash Flow Conversion represents Adjusted Free Cash Flow divided by Adjusted EBITDA. Net leverage is a non-GAAP financial measure that represents Net Debt (Total Debt minus Cash) divided by LTM Adjusted EBITDA. LTM Adjusted EBITDA represents the sum of the Adjusted EBITDA for the four most recent fiscal quarters. Combined LTM Net Leverage represents LTM Adjusted EBITDA as of 6/30/2026 for REPAY and KUBRA adjusted for transaction-related adjustments and synergies. REPAY believes that each of the non-GAAP financial measures referenced in this paragraph provide useful information to investors and others in understanding and evaluating its operating results in the same manner as management. However, these non-GAAP financial measures are not financial measures calculated in accordance with GAAP and should not be considered as a substitute for net income, operating profit, or any other operating performance measure calculated in accordance with GAAP. Using these non-GAAP financial measures to analyze REPAY’s business has material limitations because the calculations are based on the subjective determination of management regarding the nature and classification of events and circumstances that investors may find significant. In addition, although other companies in REPAY’s industry may report measures titled with the same or similar description, such non-GAAP financial measures may be calculated differently from how REPAY calculates its non-GAAP financial measures, which reduces their overall usefulness as comparative measures. Because of these limitations, you should consider each of the non-GAAP financial measures referenced in this paragraph alongside other financial performance measures, including net income and REPAY’s other financial results presented in accordance with GAAP.
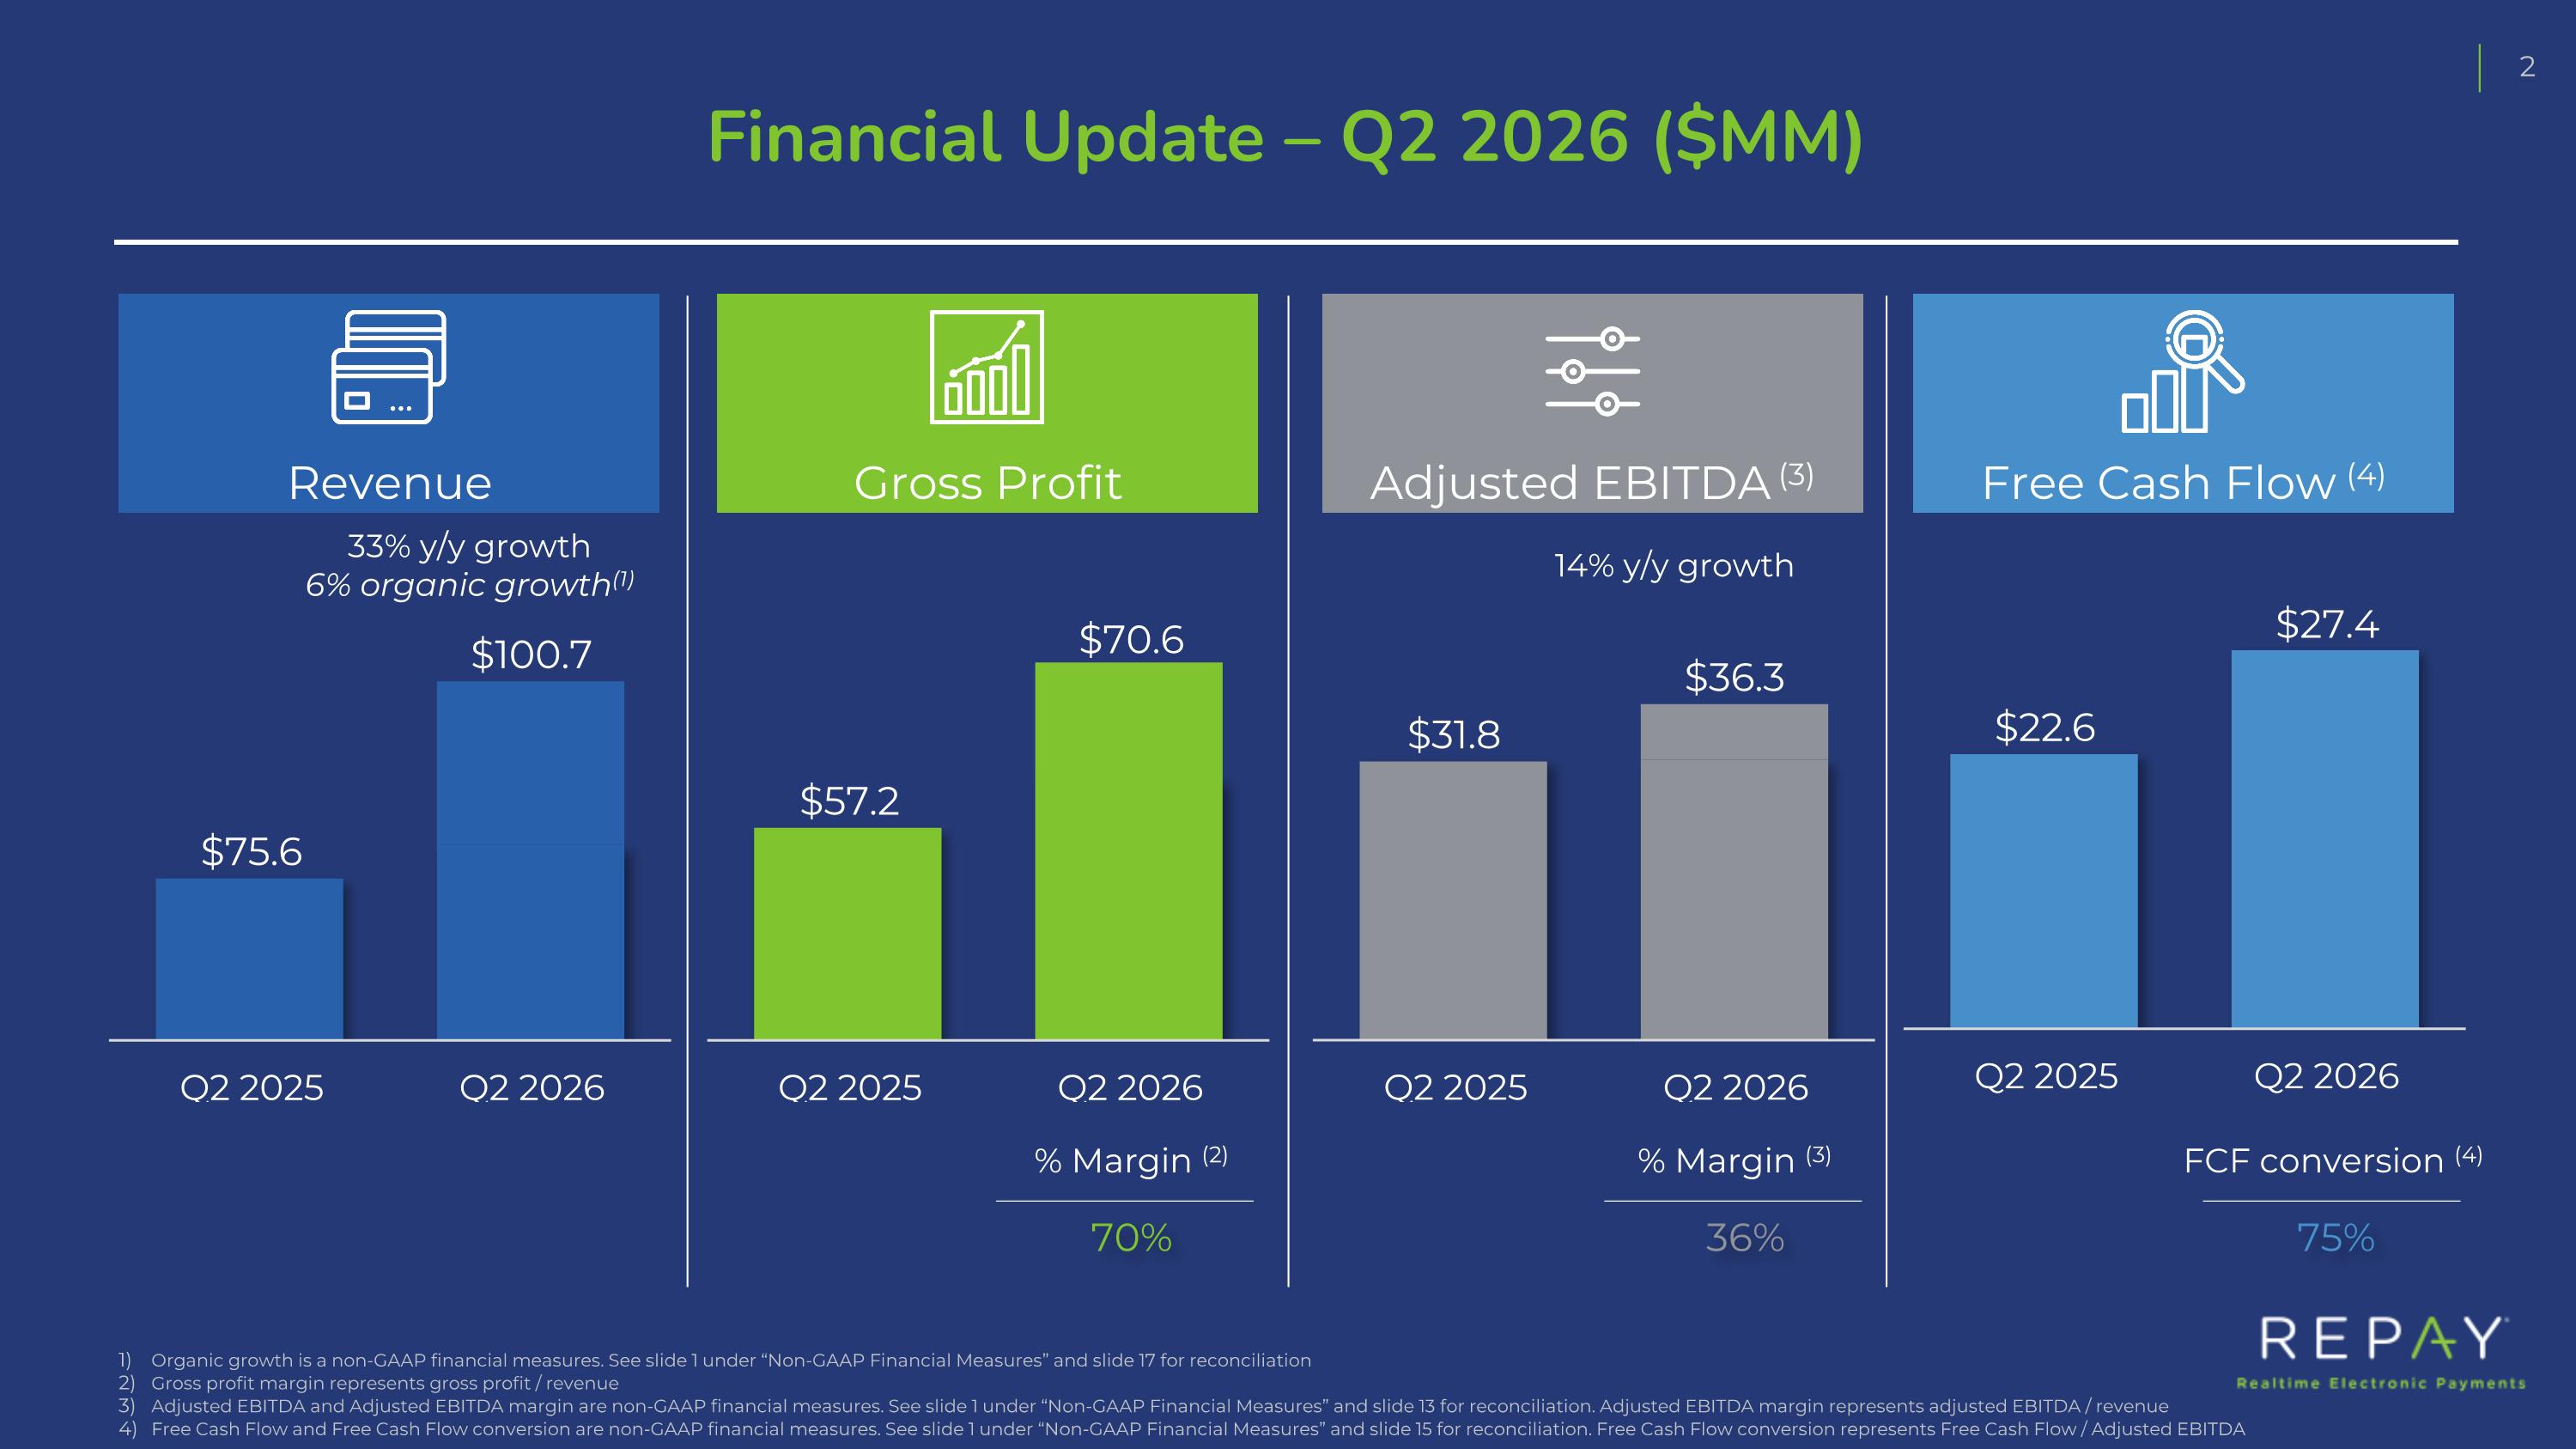
Financial Update – Q2 2026 ($MM) Organic growth is a non-GAAP financial measures. See slide 1 under “Non-GAAP Financial Measures” and slide 17 for reconciliation Gross profit margin represents gross profit / revenue Adjusted EBITDA and Adjusted EBITDA margin are non-GAAP financial measures. See slide 1 under “Non-GAAP Financial Measures” and slide 13 for reconciliation. Adjusted EBITDA margin represents adjusted EBITDA / revenue Free Cash Flow and Free Cash Flow conversion are non-GAAP financial measures. See slide 1 under “Non-GAAP Financial Measures” and slide 15 for reconciliation. Free Cash Flow conversion represents Free Cash Flow / Adjusted EBITDA 70% % Margin (2) 36% % Margin (3) 33% y/y growth 6% organic growth(1) 75% FCF conversion (4) 14% y/y growth Revenue Gross Profit Adjusted EBITDA (3) Free Cash Flow (4)
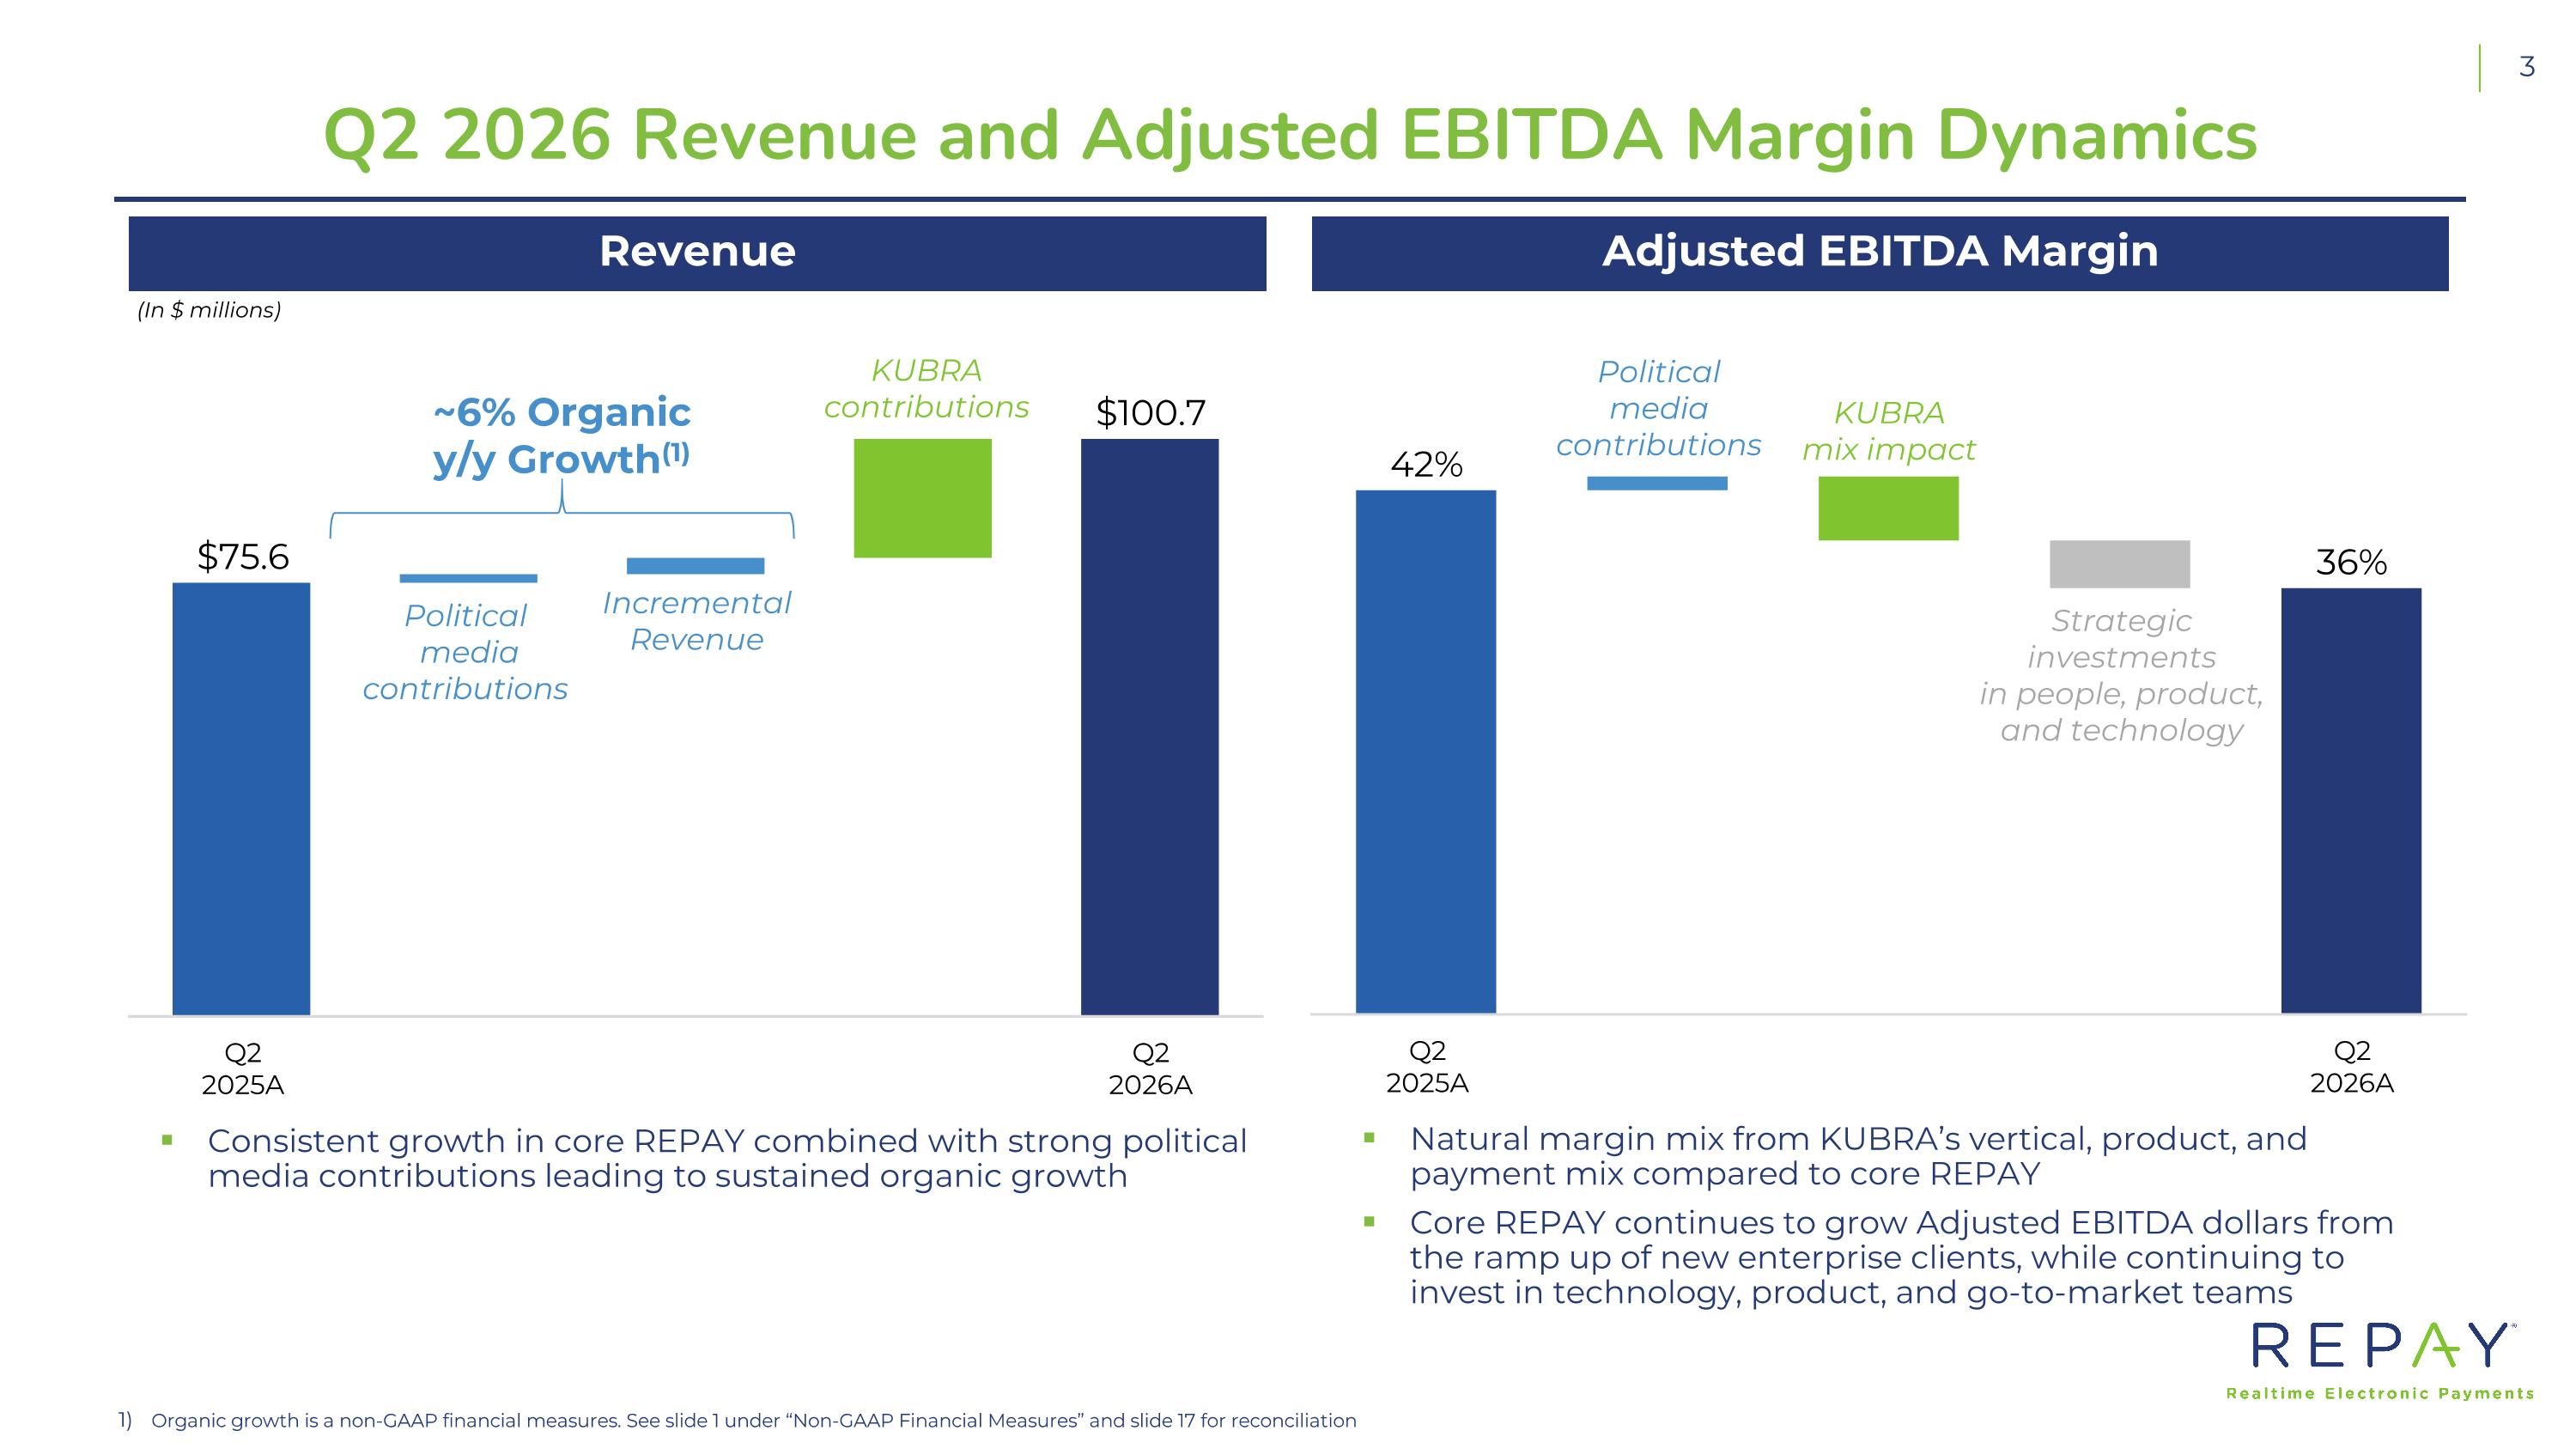
Q2 2026 Revenue and Adjusted EBITDA Margin Dynamics Incremental Revenue Political media contributions KUBRA contributions (In $ millions) KUBRA mix impact Strategic investments in people, product, and technology Political media contributions Adjusted EBITDA Margin Revenue ~6% Organic y/y Growth(1) Natural margin mix from KUBRA’s vertical, product, and payment mix compared to core REPAY Core REPAY continues to grow Adjusted EBITDA dollars from the ramp up of new enterprise clients, while continuing to invest in technology, product, and go-to-market teams Consistent growth in core REPAY combined with strong political media contributions leading to sustained organic growth Organic growth is a non-GAAP financial measures. See slide 1 under “Non-GAAP Financial Measures” and slide 17 for reconciliation
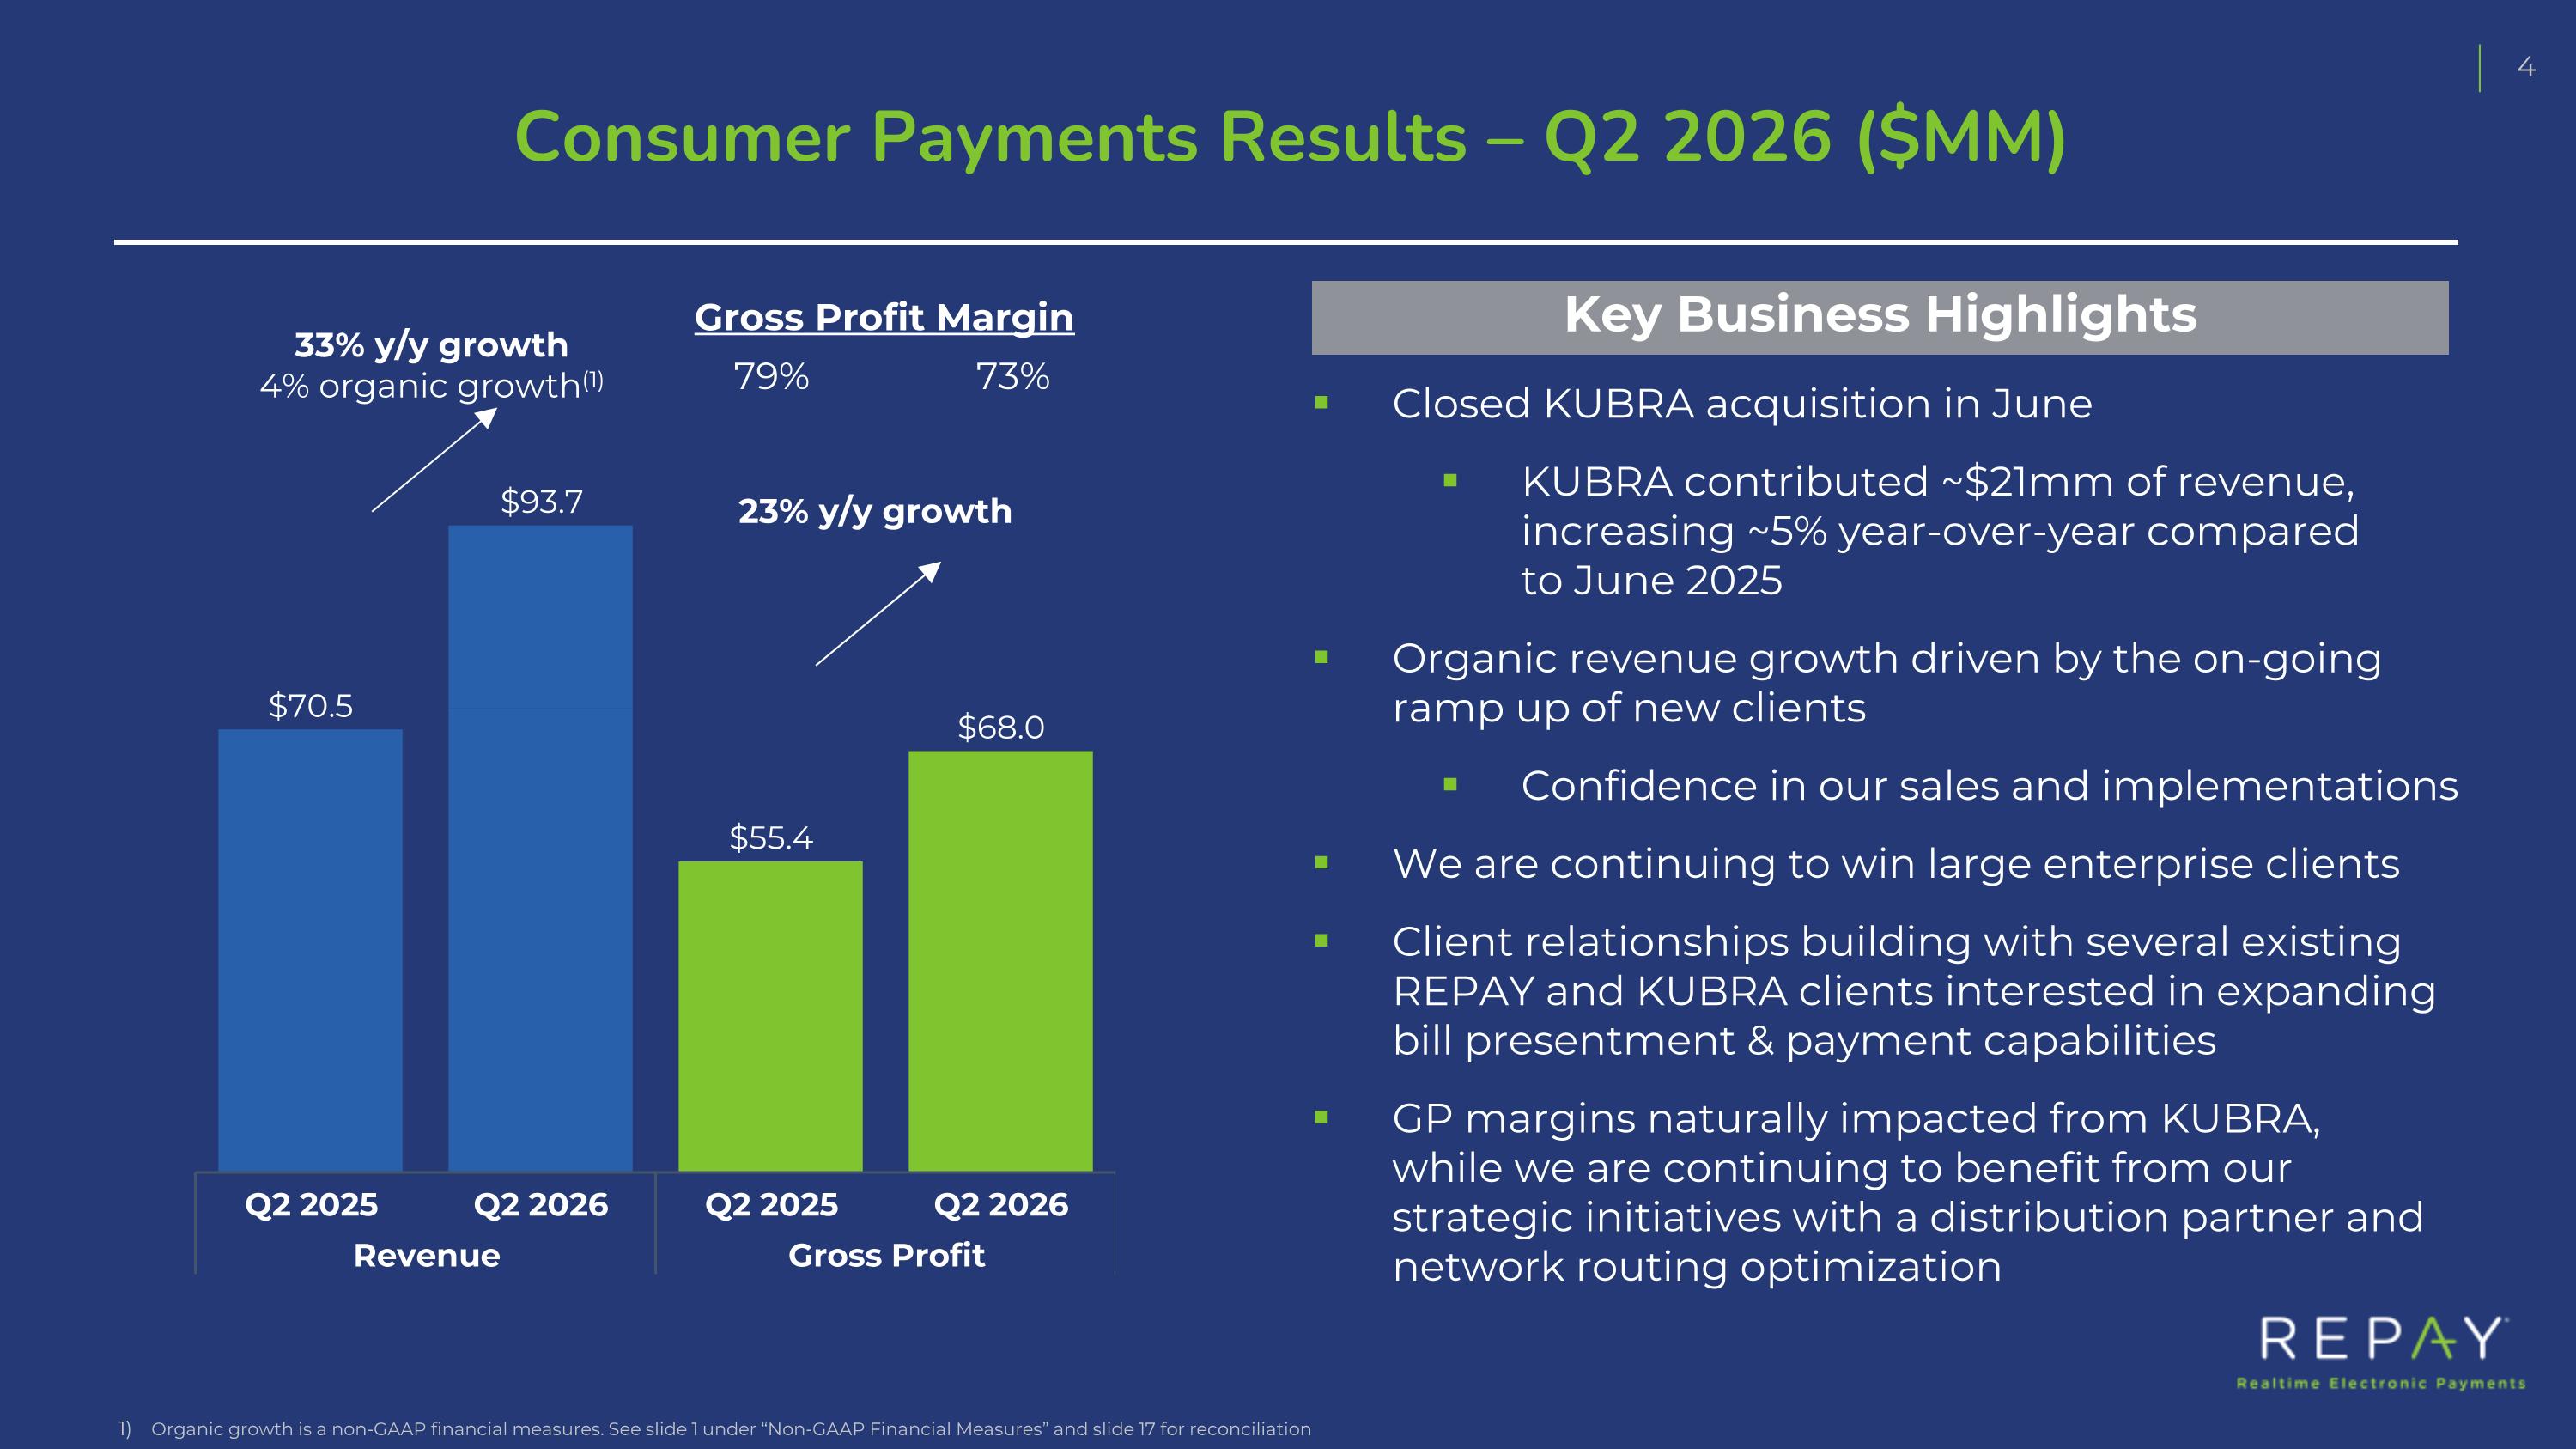
Consumer Payments Results – Q2 2026 ($MM) Key Business Highlights Closed KUBRA acquisition in June KUBRA contributed ~$21mm of revenue, increasing ~5% year-over-year compared to June 2025 Organic revenue growth driven by the on-going ramp up of new clients Confidence in our sales and implementations We are continuing to win large enterprise clients Client relationships building with several existing REPAY and KUBRA clients interested in expanding bill presentment & payment capabilities GP margins naturally impacted from KUBRA, while we are continuing to benefit from our strategic initiatives with a distribution partner and network routing optimization Gross Profit Margin 79% 73% 33% y/y growth 4% organic growth(1) 23% y/y growth Organic growth is a non-GAAP financial measures. See slide 1 under “Non-GAAP Financial Measures” and slide 17 for reconciliation
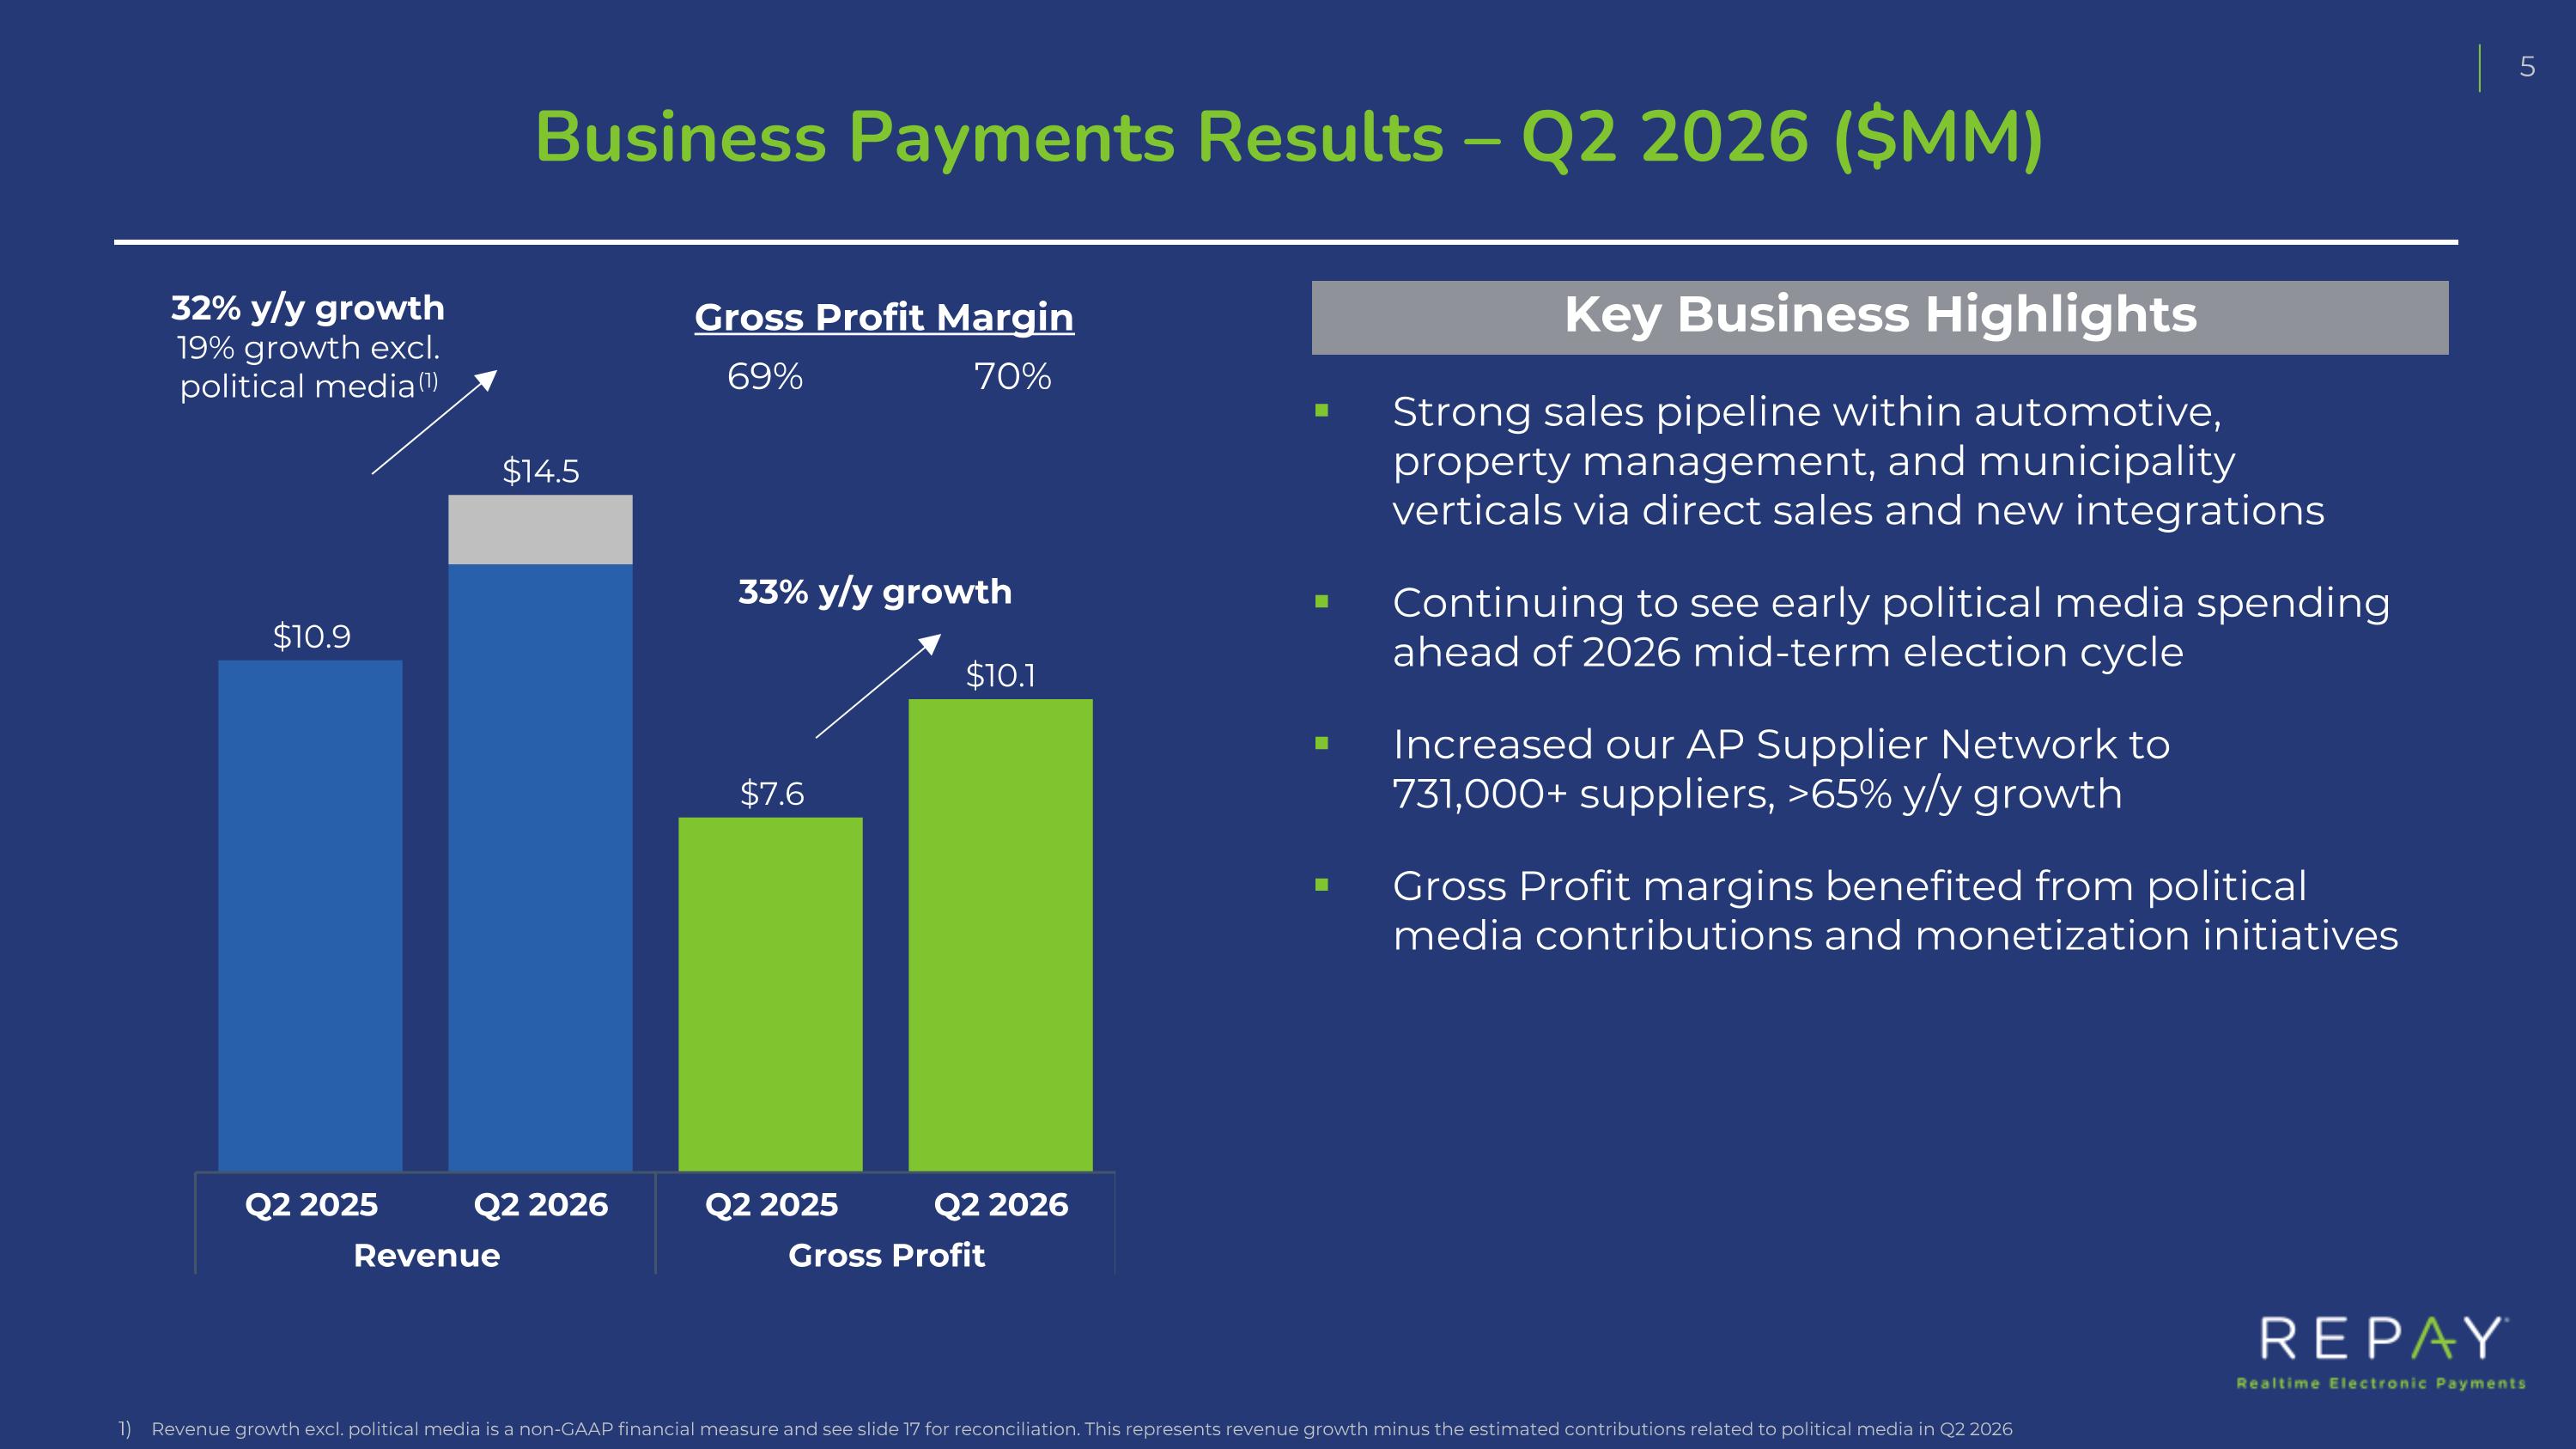
Strong sales pipeline within automotive, property management, and municipality verticals via direct sales and new integrations Continuing to see early political media spending ahead of 2026 mid-term election cycle Increased our AP Supplier Network to 731,000+ suppliers, >65% y/y growth Gross Profit margins benefited from political media contributions and monetization initiatives Business Payments Results – Q2 2026 ($MM) Key Business Highlights Gross Profit Margin 69% 70% 33% y/y growth 32% y/y growth 19% growth excl. political media(1) Revenue growth excl. political media is a non-GAAP financial measure and see slide 17 for reconciliation. This represents revenue growth minus the estimated contributions related to political media in Q2 2026
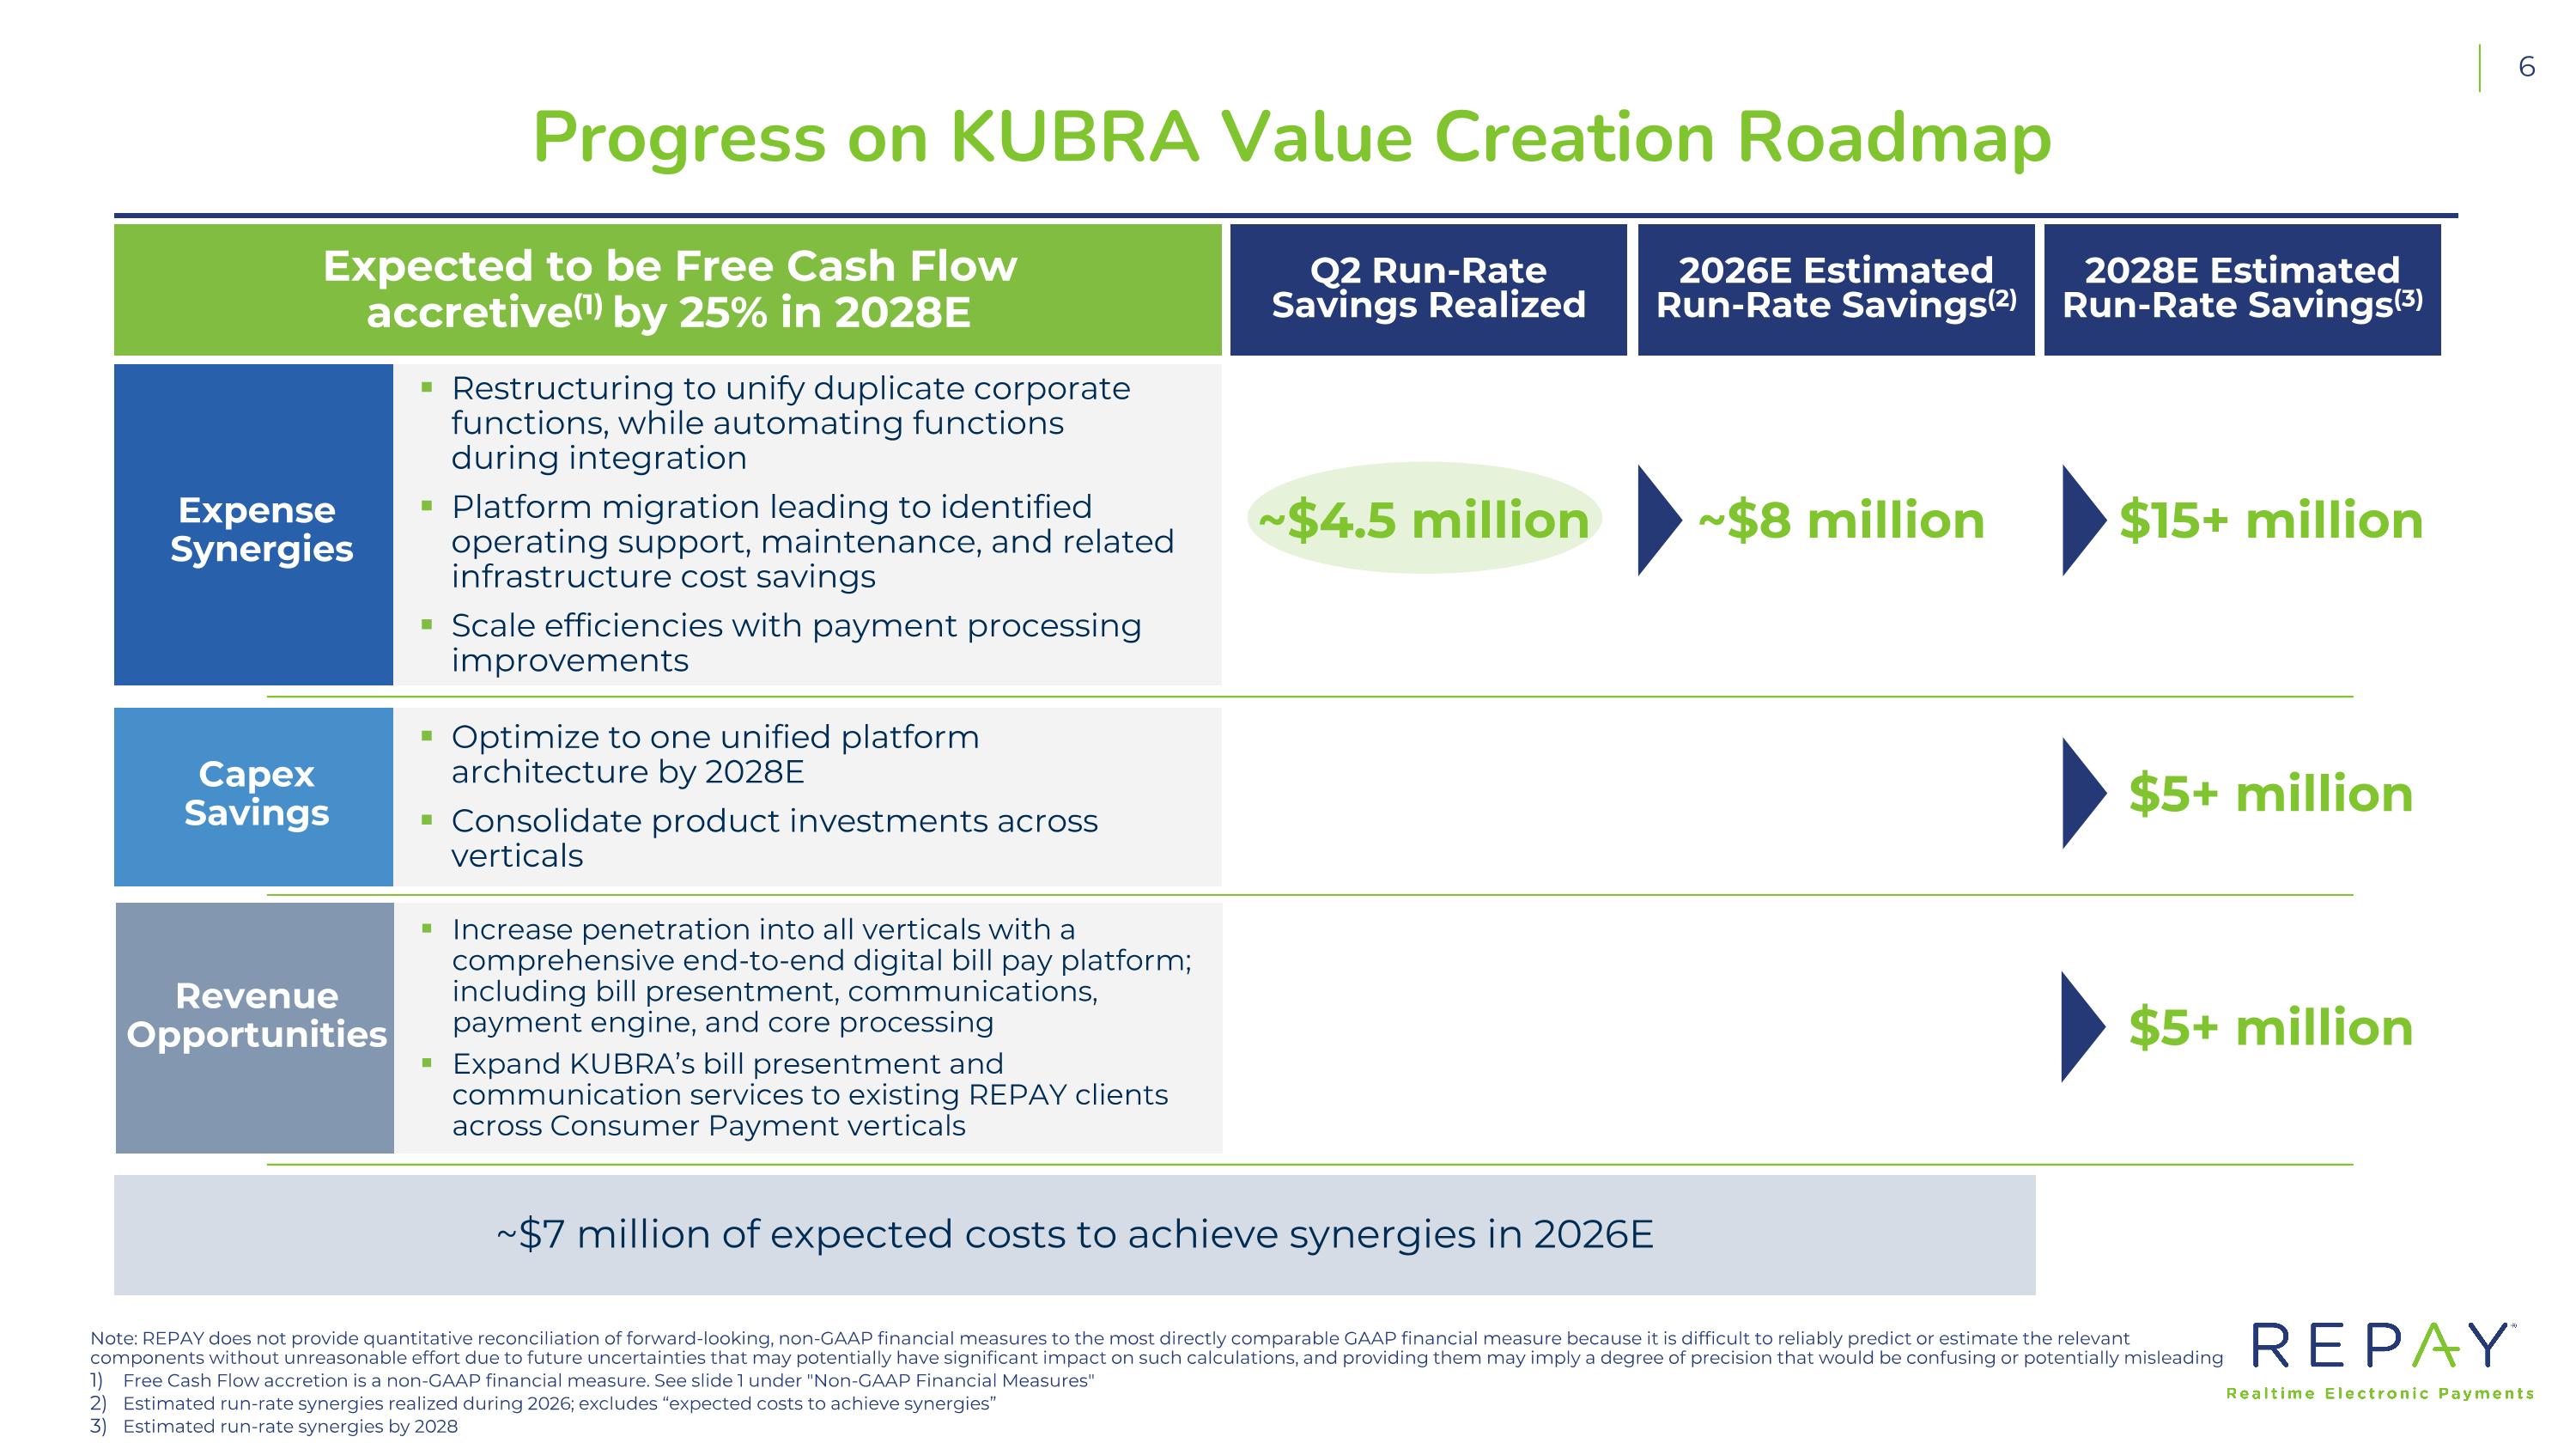
Progress on KUBRA Value Creation Roadmap Expected to be Free Cash Flow accretive(1) by 25% in 2028E Revenue Opportunities Expense Synergies Capex Savings Increase penetration into all verticals with a comprehensive end-to-end digital bill pay platform; including bill presentment, communications, payment engine, and core processing Expand KUBRA’s bill presentment and communication services to existing REPAY clients across Consumer Payment verticals Note: REPAY does not provide quantitative reconciliation of forward-looking, non-GAAP financial measures to the most directly comparable GAAP financial measure because it is difficult to reliably predict or estimate the relevant components without unreasonable effort due to future uncertainties that may potentially have significant impact on such calculations, and providing them may imply a degree of precision that would be confusing or potentially misleading Free Cash Flow accretion is a non-GAAP financial measure. See slide 1 under "Non-GAAP Financial Measures" Estimated run-rate synergies realized during 2026; excludes “expected costs to achieve synergies” Estimated run-rate synergies by 2028 Restructuring to unify duplicate corporate functions, while automating functions during integration Platform migration leading to identified operating support, maintenance, and related infrastructure cost savings Scale efficiencies with payment processing improvements Optimize to one unified platform architecture by 2028E Consolidate product investments across verticals $5+ million 2028E Estimated Run-Rate Savings(3) $15+ million $5+ million 2026E Estimated Run-Rate Savings(2) ~$8 million ~$7 million of expected costs to achieve synergies in 2026E Q2 Run-Rate Savings Realized ~$4.5 million
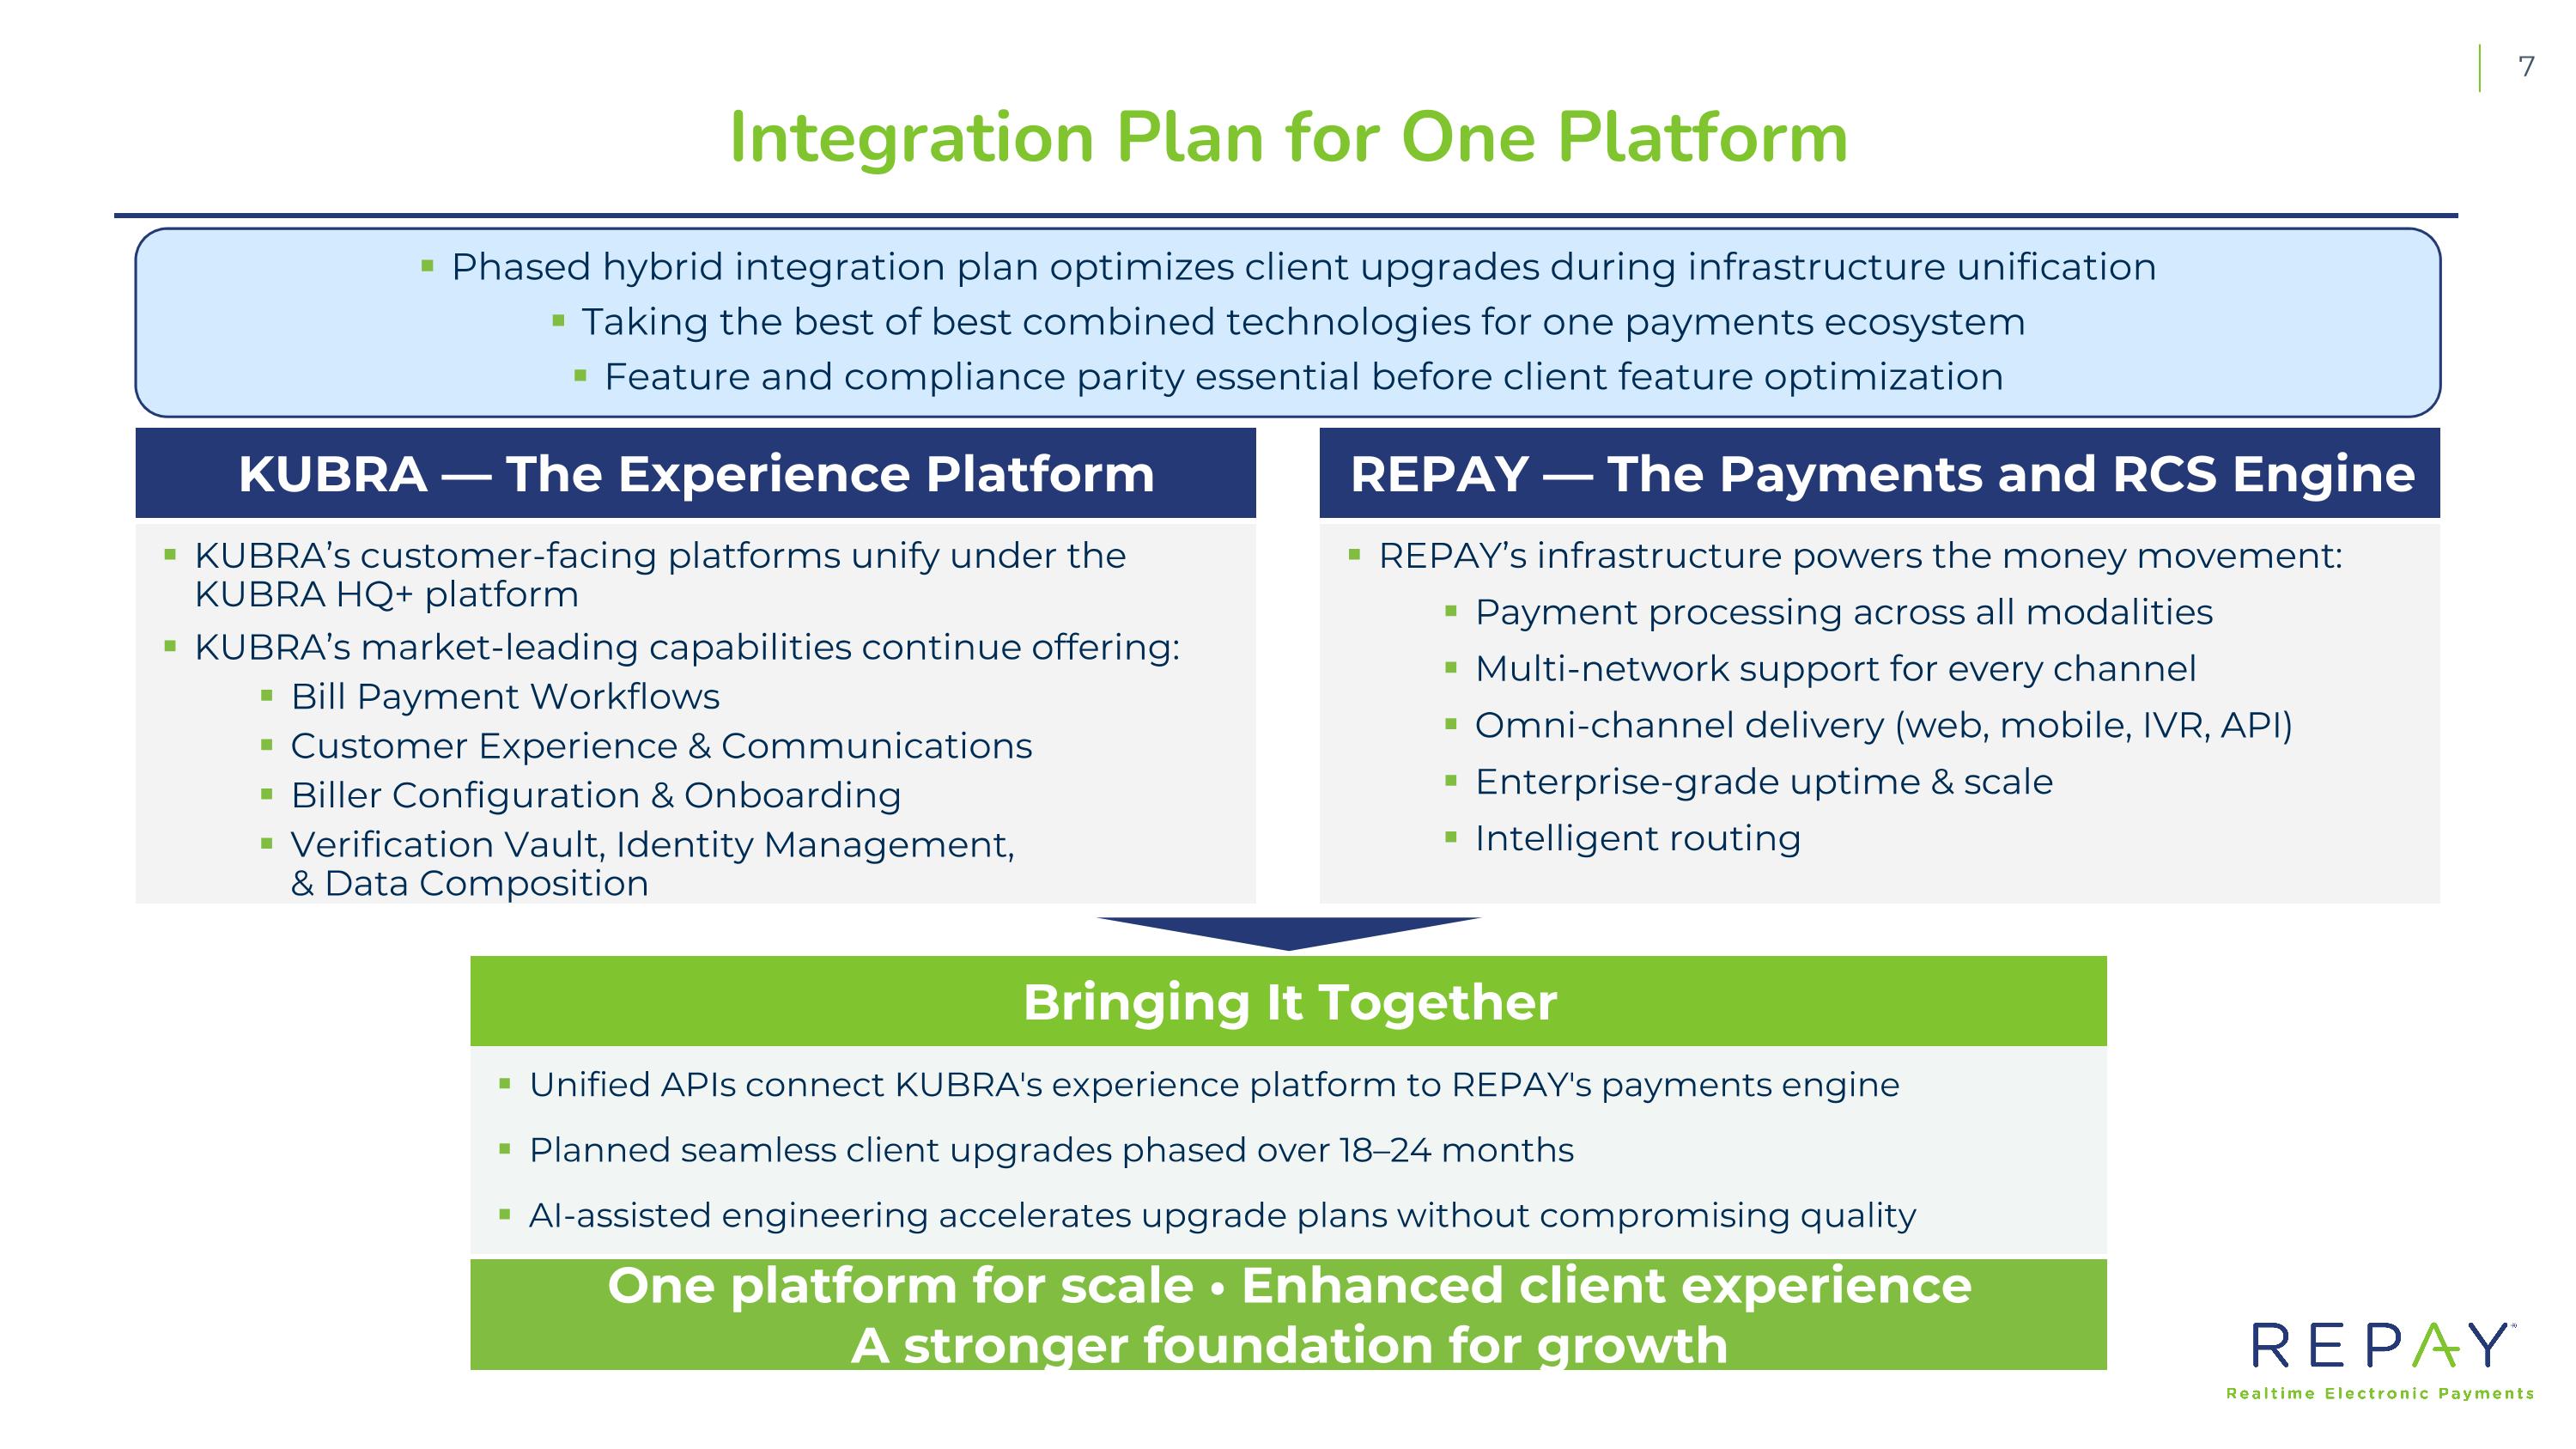
Integration Plan for One Platform Phased hybrid integration plan optimizes client upgrades during infrastructure unification Taking the best of best combined technologies for one payments ecosystem Feature and compliance parity essential before client feature optimization KUBRA — The Experience Platform KUBRA’s customer-facing platforms unify under the KUBRA HQ+ platform KUBRA’s market-leading capabilities continue offering: Bill Payment Workflows Customer Experience & Communications Biller Configuration & Onboarding Verification Vault, Identity Management, & Data Composition REPAY — The Payments and RCS Engine REPAY’s infrastructure powers the money movement: Payment processing across all modalities Multi-network support for every channel Omni-channel delivery (web, mobile, IVR, API) Enterprise-grade uptime & scale Intelligent routing Bringing It Together Unified APIs connect KUBRA's experience platform to REPAY's payments engine Planned seamless client upgrades phased over 18–24 months AI-assisted engineering accelerates upgrade plans without compromising quality One platform for scale • Enhanced client experience A stronger foundation for growth
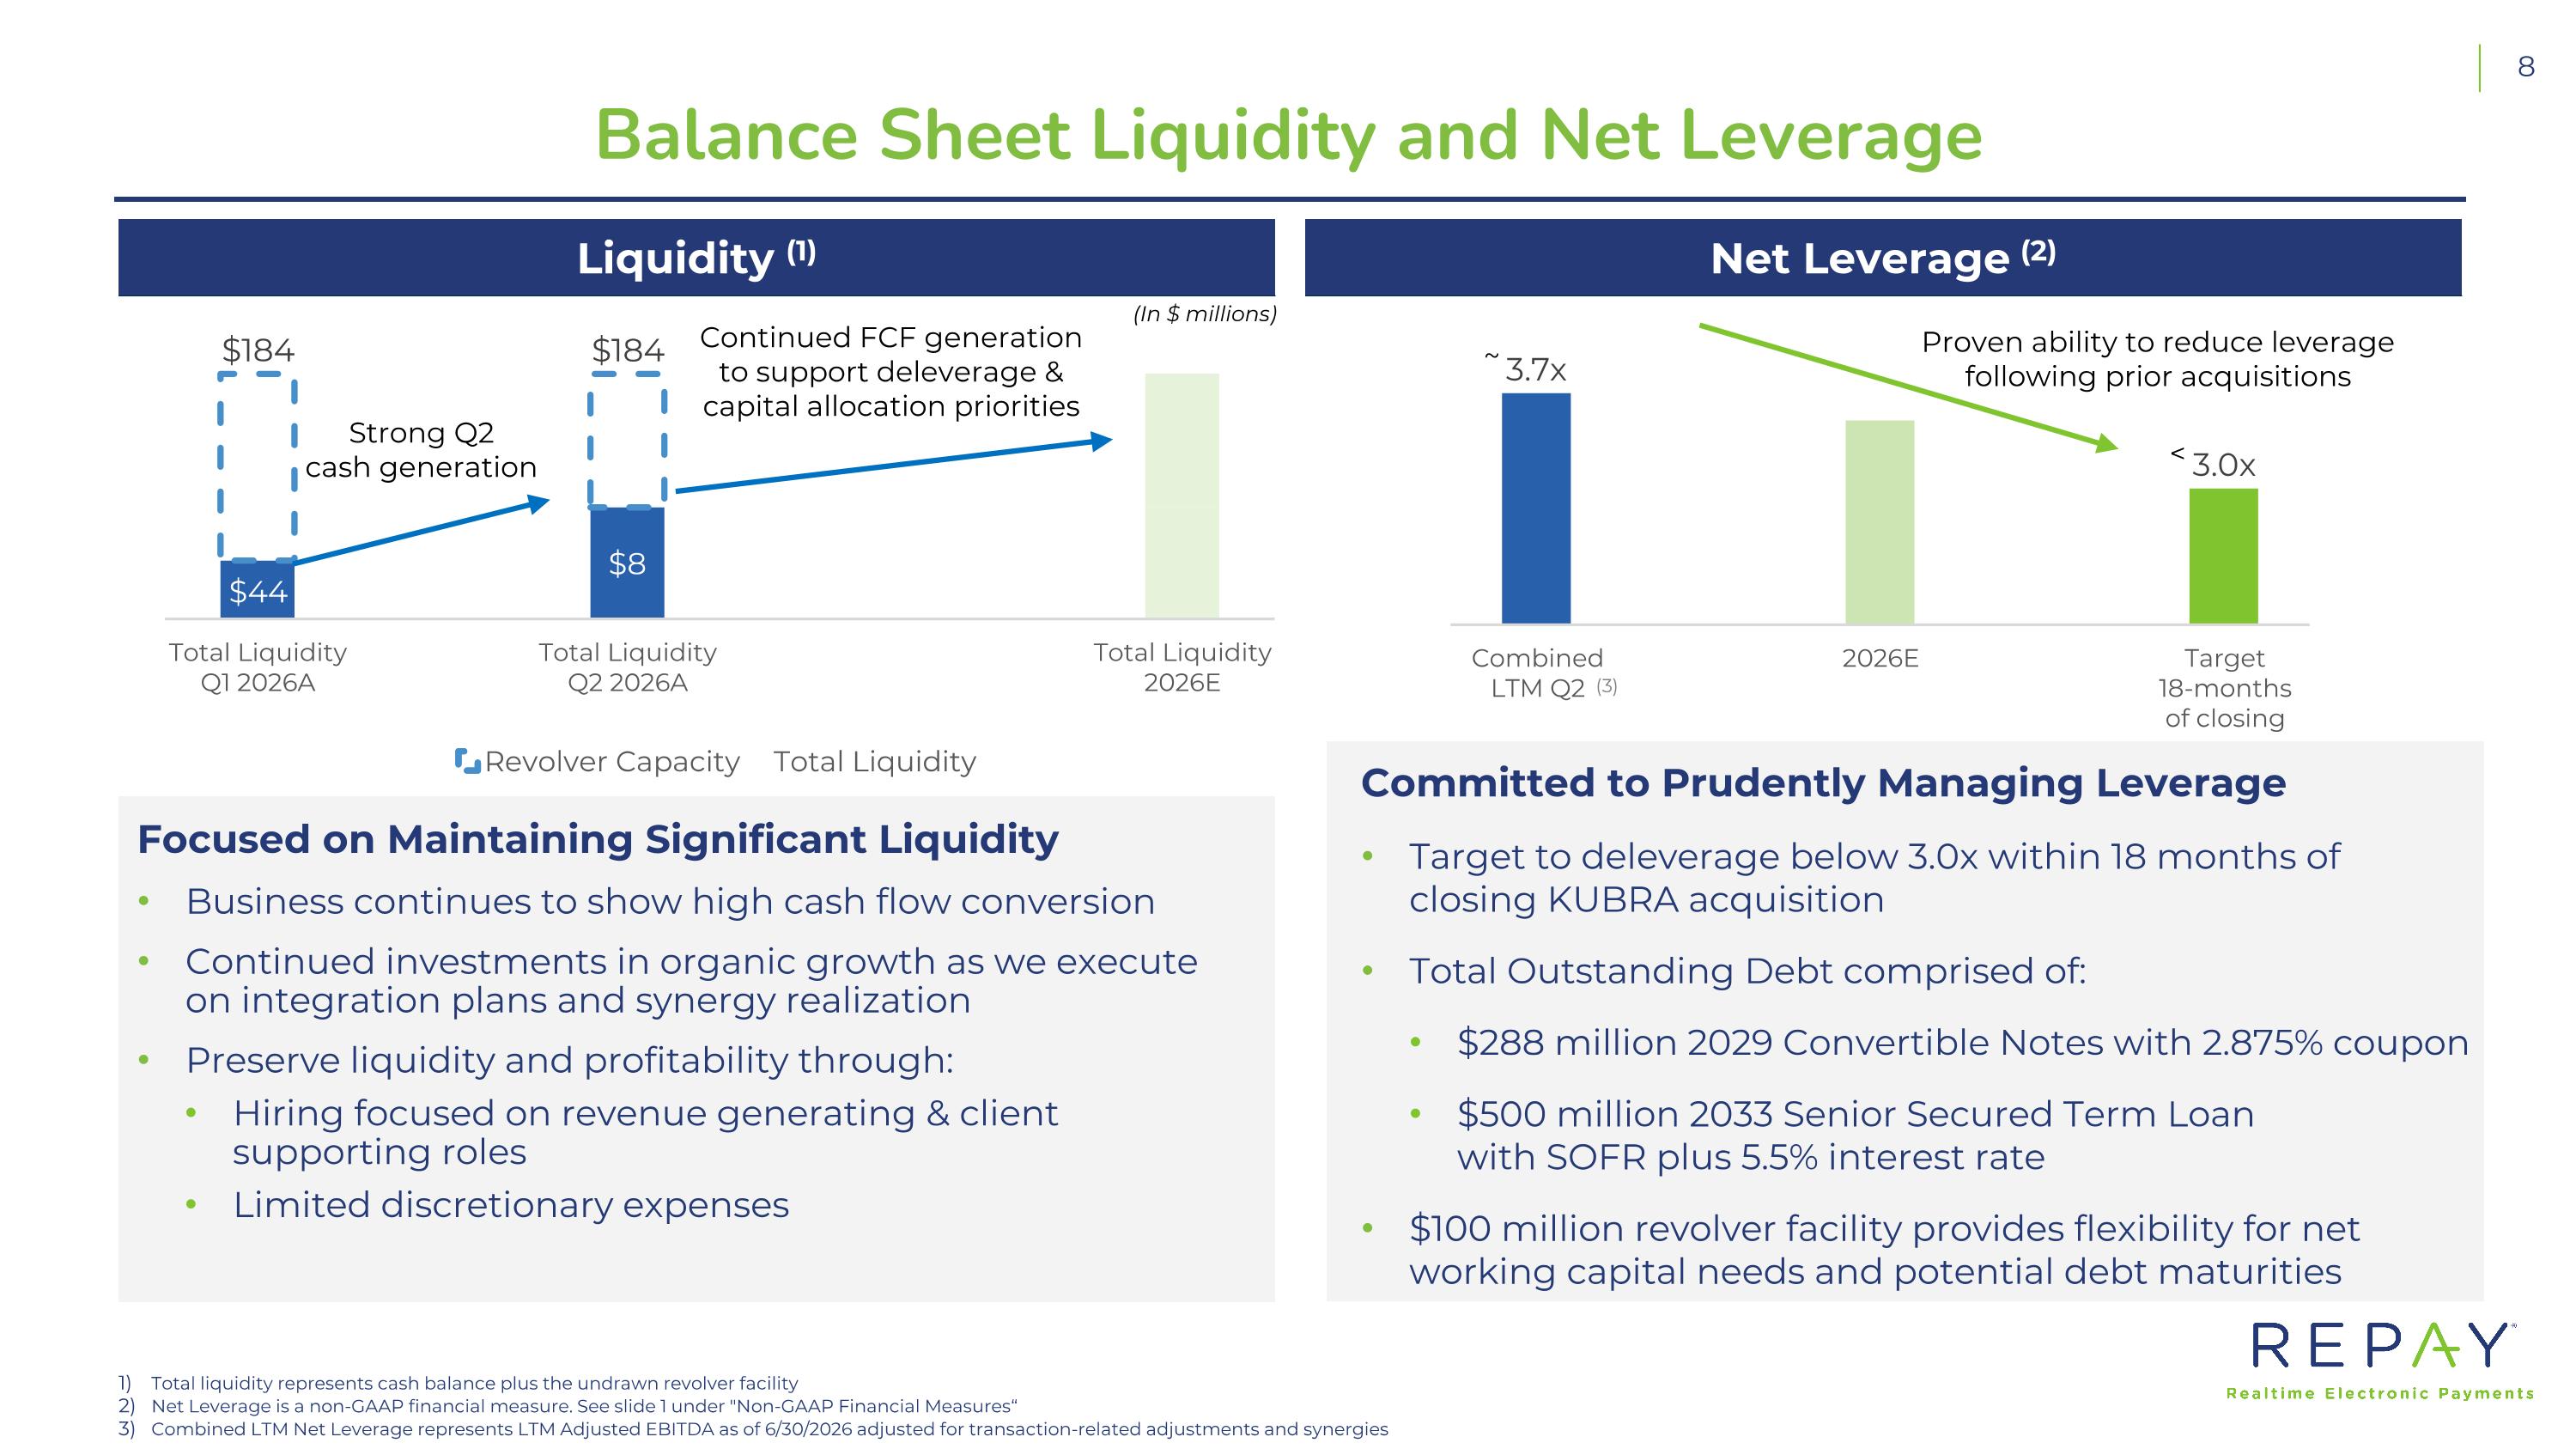
Balance Sheet Liquidity and Net Leverage Total liquidity represents cash balance plus the undrawn revolver facility Net Leverage is a non-GAAP financial measure. See slide 1 under "Non-GAAP Financial Measures“ Combined LTM Net Leverage represents LTM Adjusted EBITDA as of 6/30/2026 adjusted for transaction-related adjustments and synergies Liquidity (1) (In $ millions) Strong Q2 cash generation Continued FCF generation to support deleverage & capital allocation priorities Focused on Maintaining Significant Liquidity Business continues to show high cash flow conversion Continued investments in organic growth as we execute on integration plans and synergy realization Preserve liquidity and profitability through: Hiring focused on revenue generating & client supporting roles Limited discretionary expenses Committed to Prudently Managing Leverage Target to deleverage below 3.0x within 18 months of closing KUBRA acquisition Total Outstanding Debt comprised of: $288 million 2029 Convertible Notes with 2.875% coupon $500 million 2033 Senior Secured Term Loan with SOFR plus 5.5% interest rate $100 million revolver facility provides flexibility for net working capital needs and potential debt maturities Net Leverage (2) < (3) Proven ability to reduce leverage following prior acquisitions ~
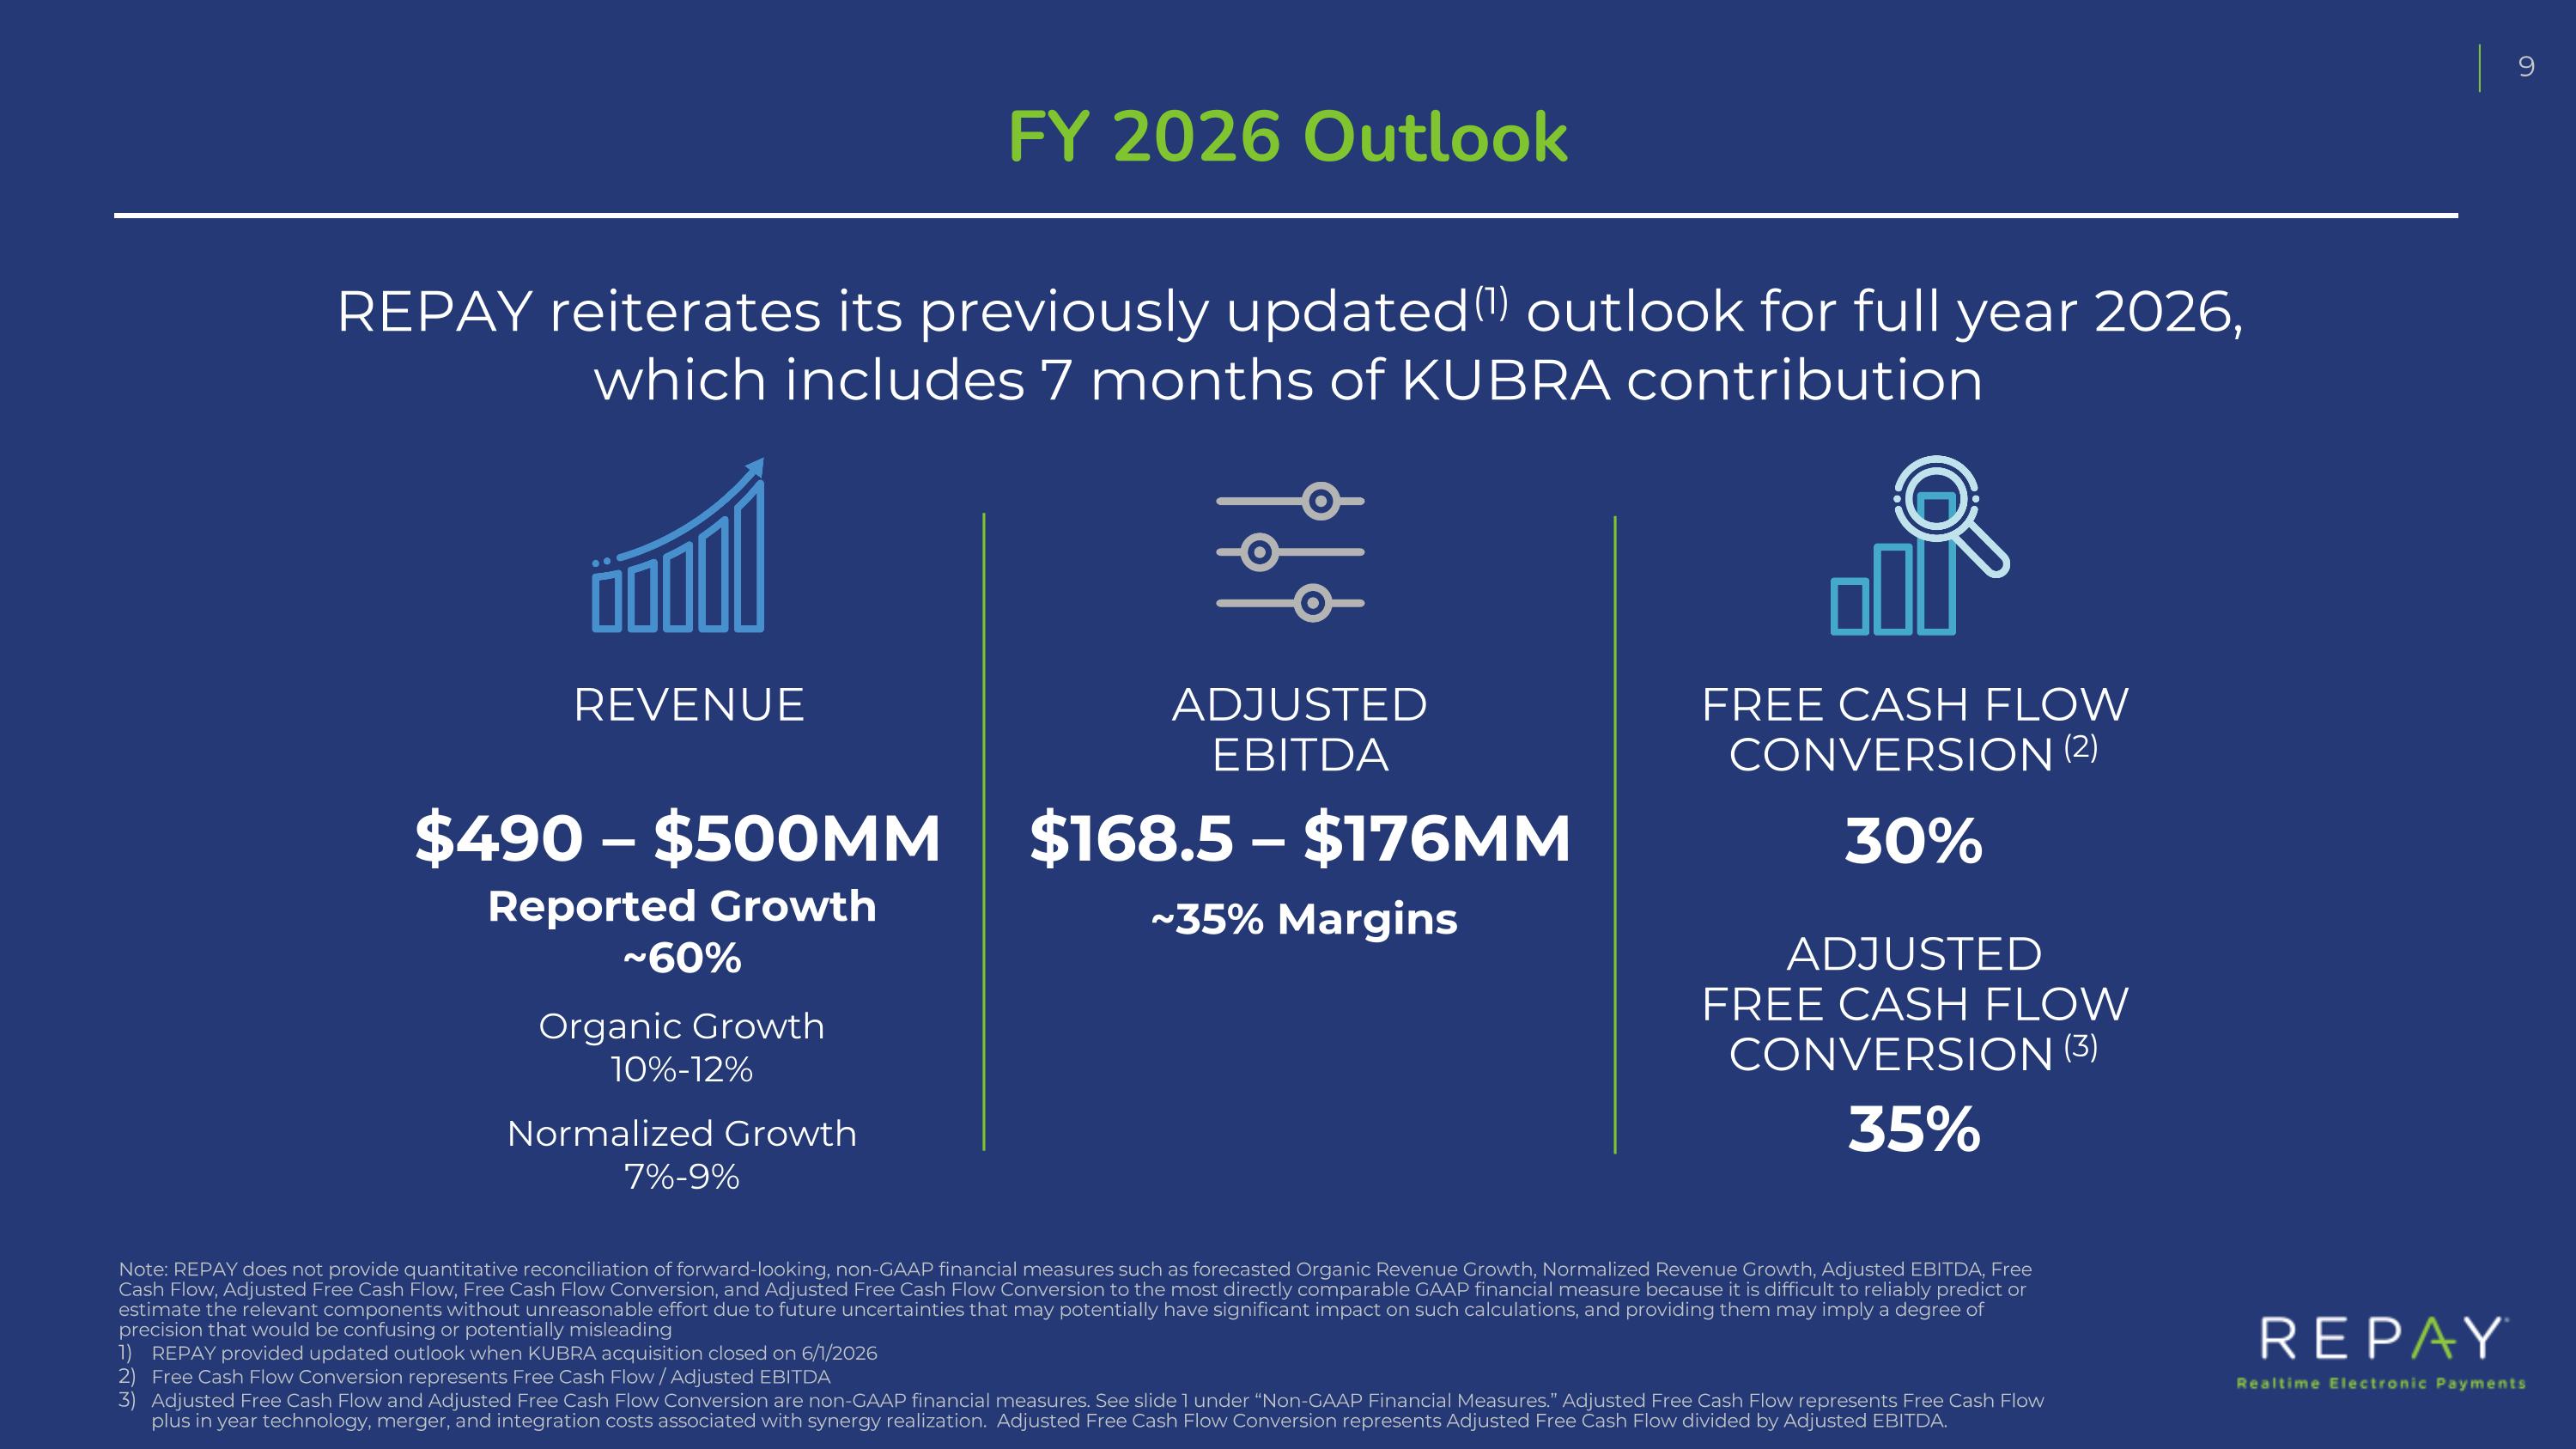
FY 2026 Outlook REVENUE ADJUSTED EBITDA FREE CASH FLOW CONVERSION (2) $490 – $500MM $168.5 – $176MM 30% REPAY reiterates its previously updated (1) outlook for full year 2026, which includes 7 months of KUBRA contribution ~35% Margins Reported Growth ~60% Organic Growth 10%-12% Normalized Growth 7%-9% Note: REPAY does not provide quantitative reconciliation of forward-looking, non-GAAP financial measures such as forecasted Organic Revenue Growth, Normalized Revenue Growth, Adjusted EBITDA, Free Cash Flow, Adjusted Free Cash Flow, Free Cash Flow Conversion, and Adjusted Free Cash Flow Conversion to the most directly comparable GAAP financial measure because it is difficult to reliably predict or estimate the relevant components without unreasonable effort due to future uncertainties that may potentially have significant impact on such calculations, and providing them may imply a degree of precision that would be confusing or potentially misleading REPAY provided updated outlook when KUBRA acquisition closed on 6/1/2026 Free Cash Flow Conversion represents Free Cash Flow / Adjusted EBITDA Adjusted Free Cash Flow and Adjusted Free Cash Flow Conversion are non-GAAP financial measures. See slide 1 under “Non-GAAP Financial Measures.” Adjusted Free Cash Flow represents Free Cash Flow plus in year technology, merger, and integration costs associated with synergy realization. Adjusted Free Cash Flow Conversion represents Adjusted Free Cash Flow divided by Adjusted EBITDA. ADJUSTED FREE CASH FLOW CONVERSION (3) 35%
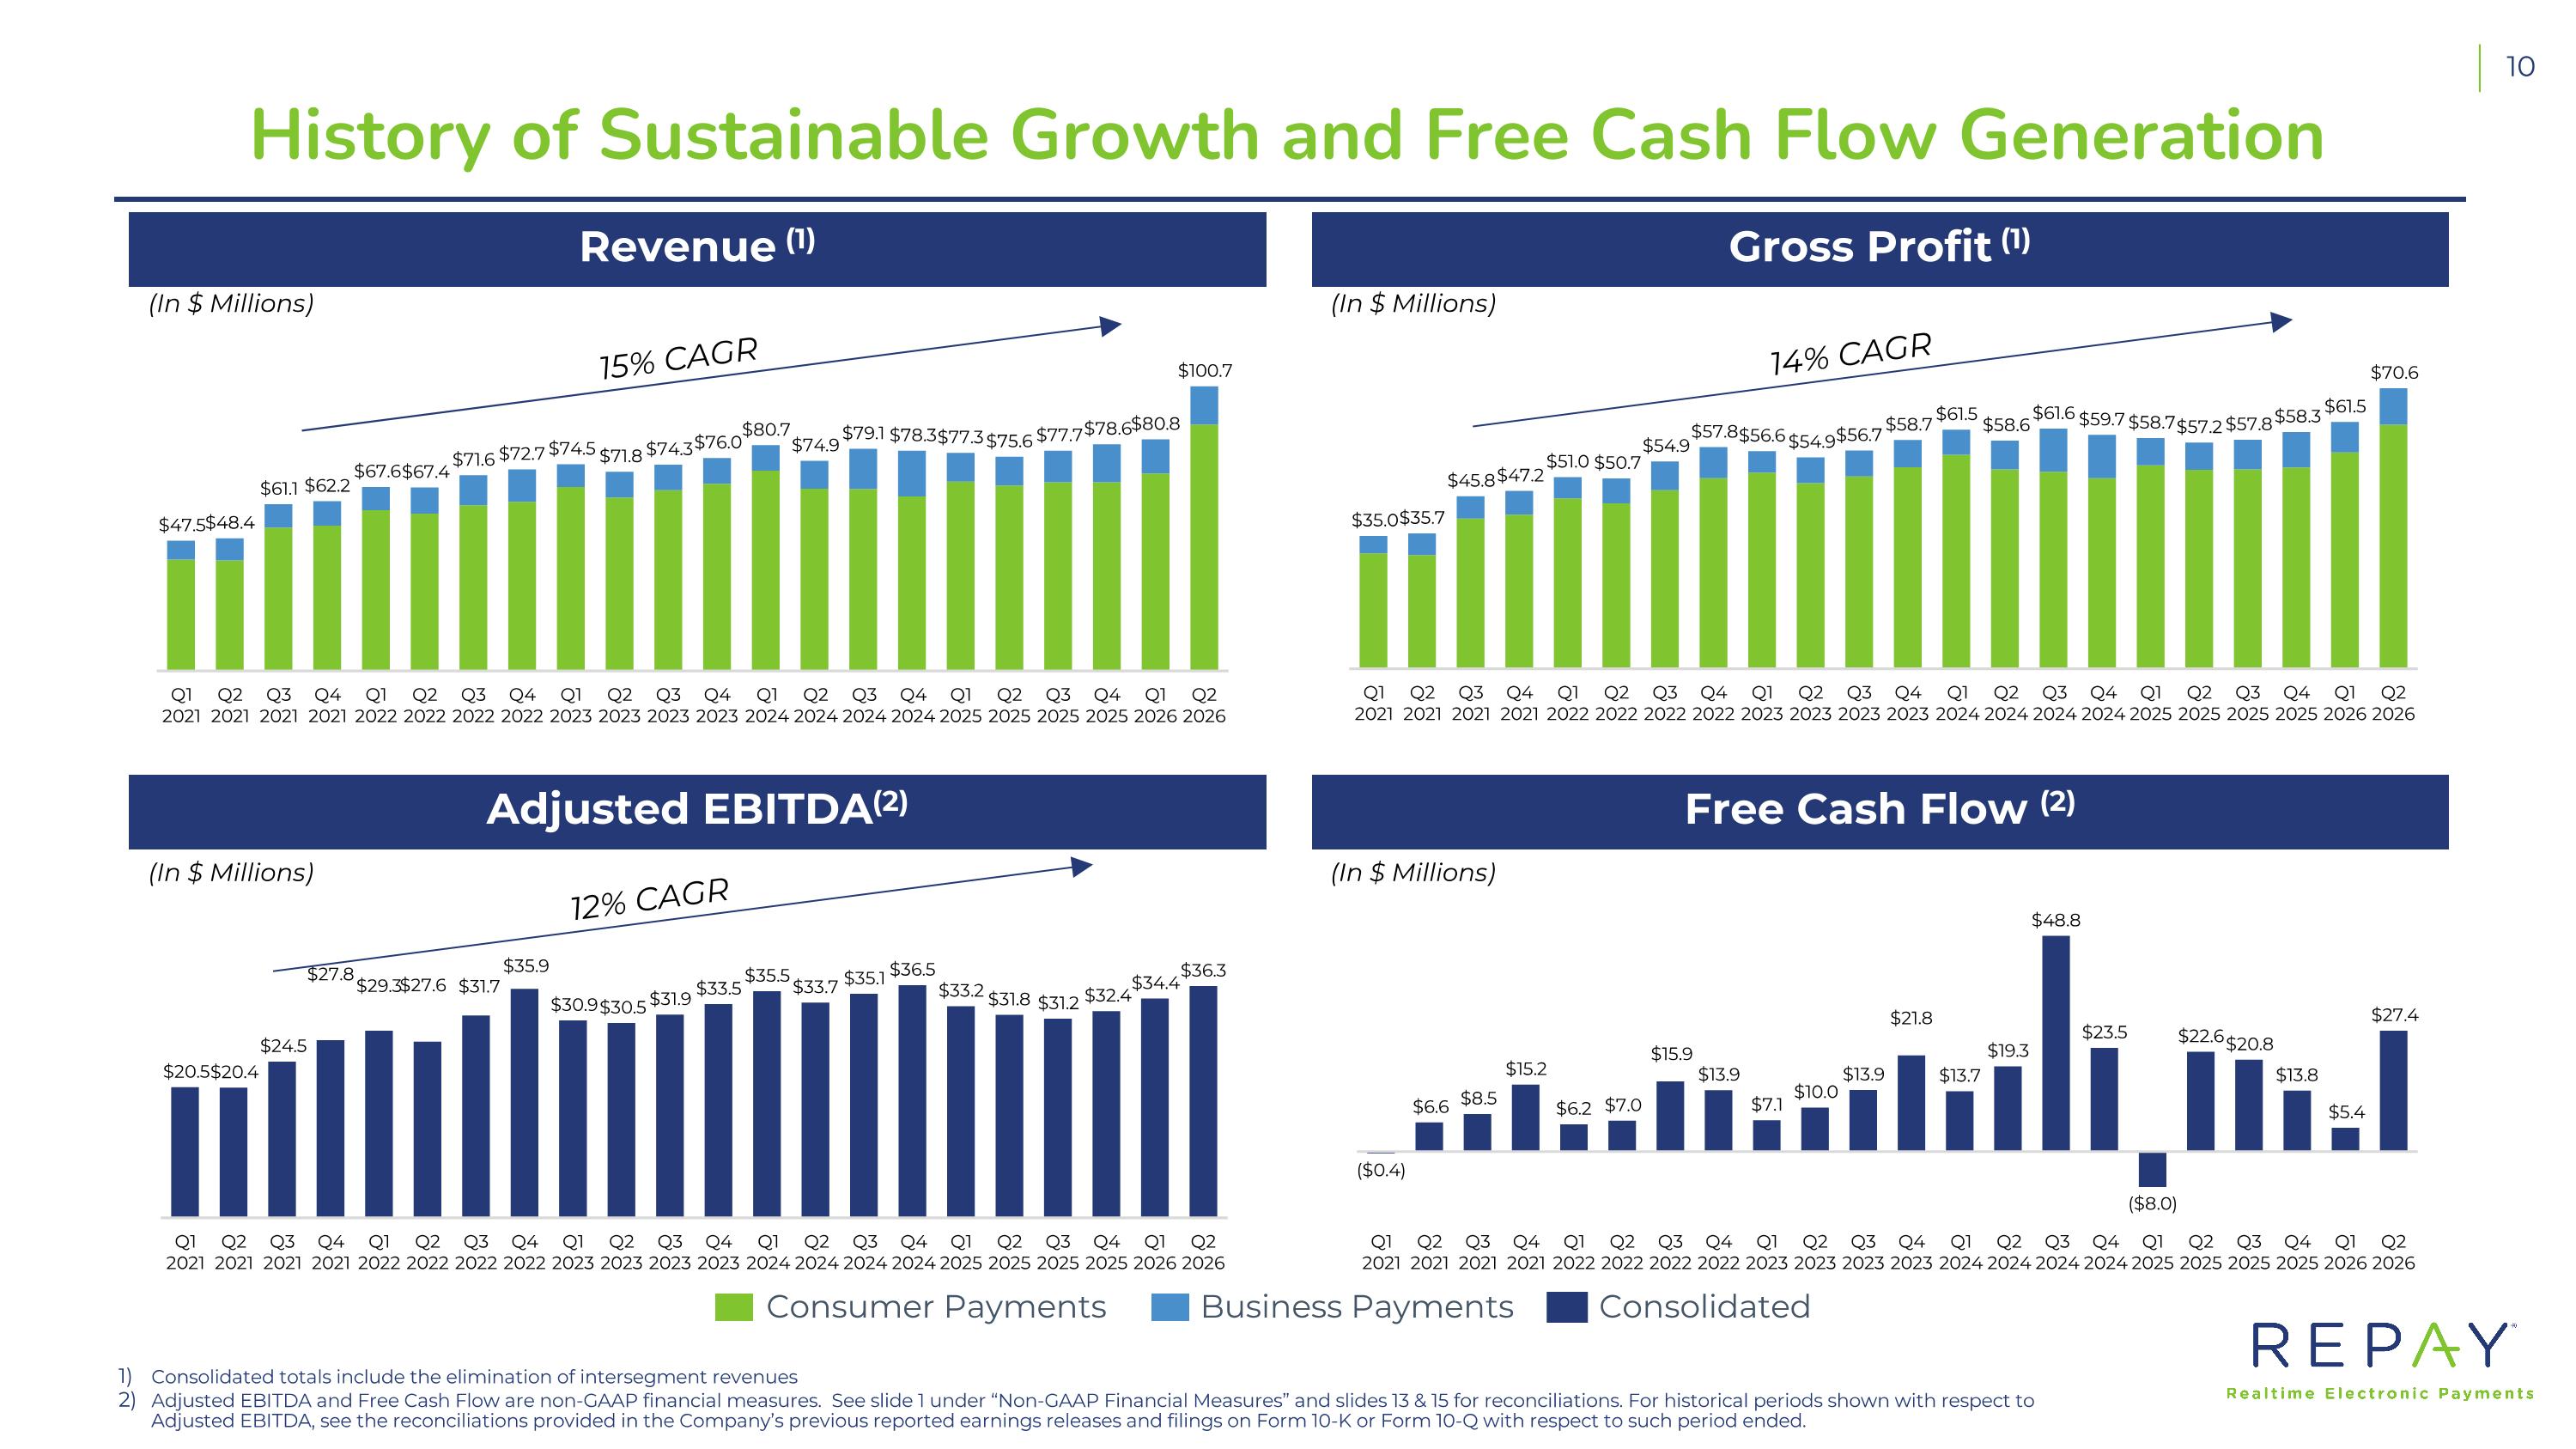
History of Sustainable Growth and Free Cash Flow Generation Gross Profit (1) Revenue (1) Free Cash Flow (2) Adjusted EBITDA(2) (In $ Millions) (In $ Millions) (In $ Millions) (In $ Millions) 15% CAGR Consumer Payments Business Payments Consolidated Consolidated totals include the elimination of intersegment revenues Adjusted EBITDA and Free Cash Flow are non-GAAP financial measures. See slide 1 under “Non-GAAP Financial Measures” and slides 13 & 15 for reconciliations. For historical periods shown with respect to Adjusted EBITDA, see the reconciliations provided in the Company’s previous reported earnings releases and filings on Form 10-K or Form 10-Q with respect to such period ended. 14% CAGR 12% CAGR
Appendix
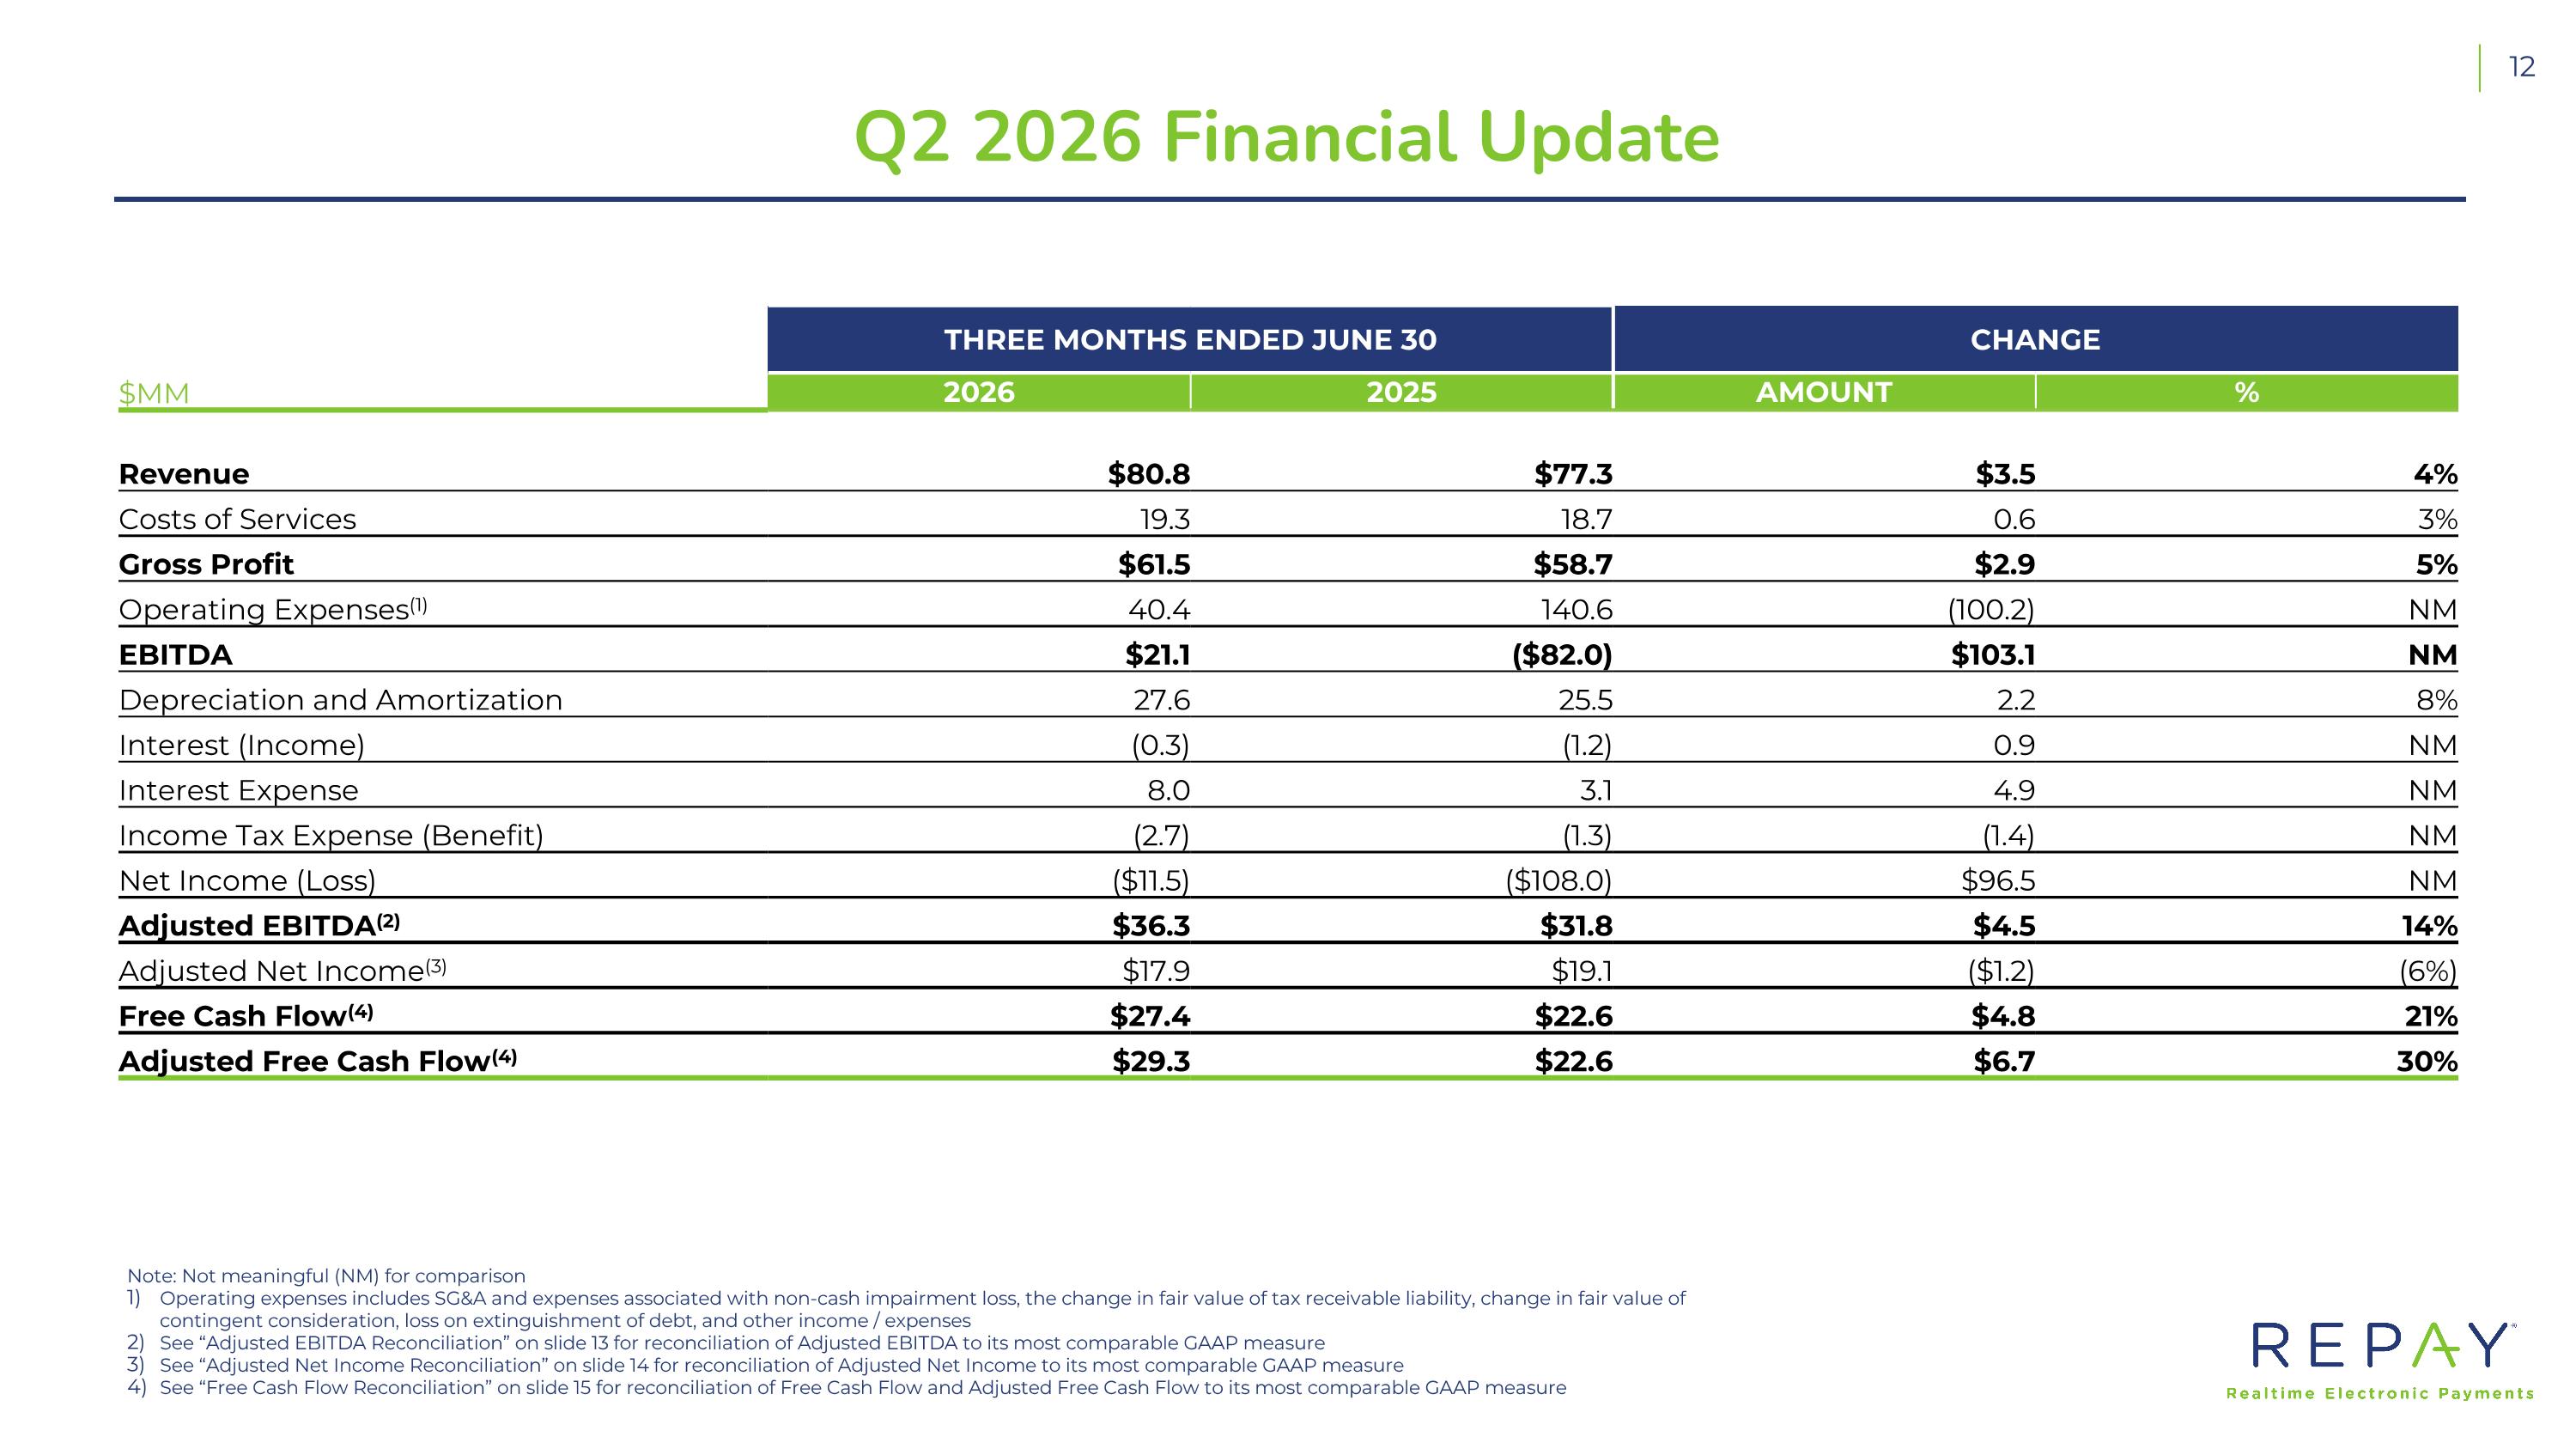
Q2 2026 Financial Update Note: Not meaningful (NM) for comparison Operating expenses includes SG&A and expenses associated with non-cash impairment loss, the change in fair value of tax receivable liability, change in fair value of contingent consideration, loss on extinguishment of debt, and other income / expenses See “Adjusted EBITDA Reconciliation” on slide 13 for reconciliation of Adjusted EBITDA to its most comparable GAAP measure See “Adjusted Net Income Reconciliation” on slide 14 for reconciliation of Adjusted Net Income to its most comparable GAAP measure See “Free Cash Flow Reconciliation” on slide 15 for reconciliation of Free Cash Flow and Adjusted Free Cash Flow to its most comparable GAAP measure THREE MONTHS ENDED JUNE 30 CHANGE $MM 2026 2025 AMOUNT % Revenue $80.8 $77.3 $3.5 4% Costs of Services 19.3 18.7 0.6 3% Gross Profit $61.5 $58.7 $2.9 5% Operating Expenses(1) 40.4 140.6 (100.2) NM EBITDA $21.1 ($82.0) $103.1 NM Depreciation and Amortization 27.6 25.5 2.2 8% Interest (Income) (0.3) (1.2) 0.9 NM Interest Expense 8.0 3.1 4.9 NM Income Tax Expense (Benefit) (2.7) (1.3) (1.4) NM Net Income (Loss) ($11.5) ($108.0) $96.5 NM Adjusted EBITDA(2) $36.3 $31.8 $4.5 14% Adjusted Net Income(3) $17.9 $19.1 ($1.2) (6%) Free Cash Flow(4) $27.4 $22.6 $4.8 21% Adjusted Free Cash Flow(4) $29.3 $22.6 $6.7 30%
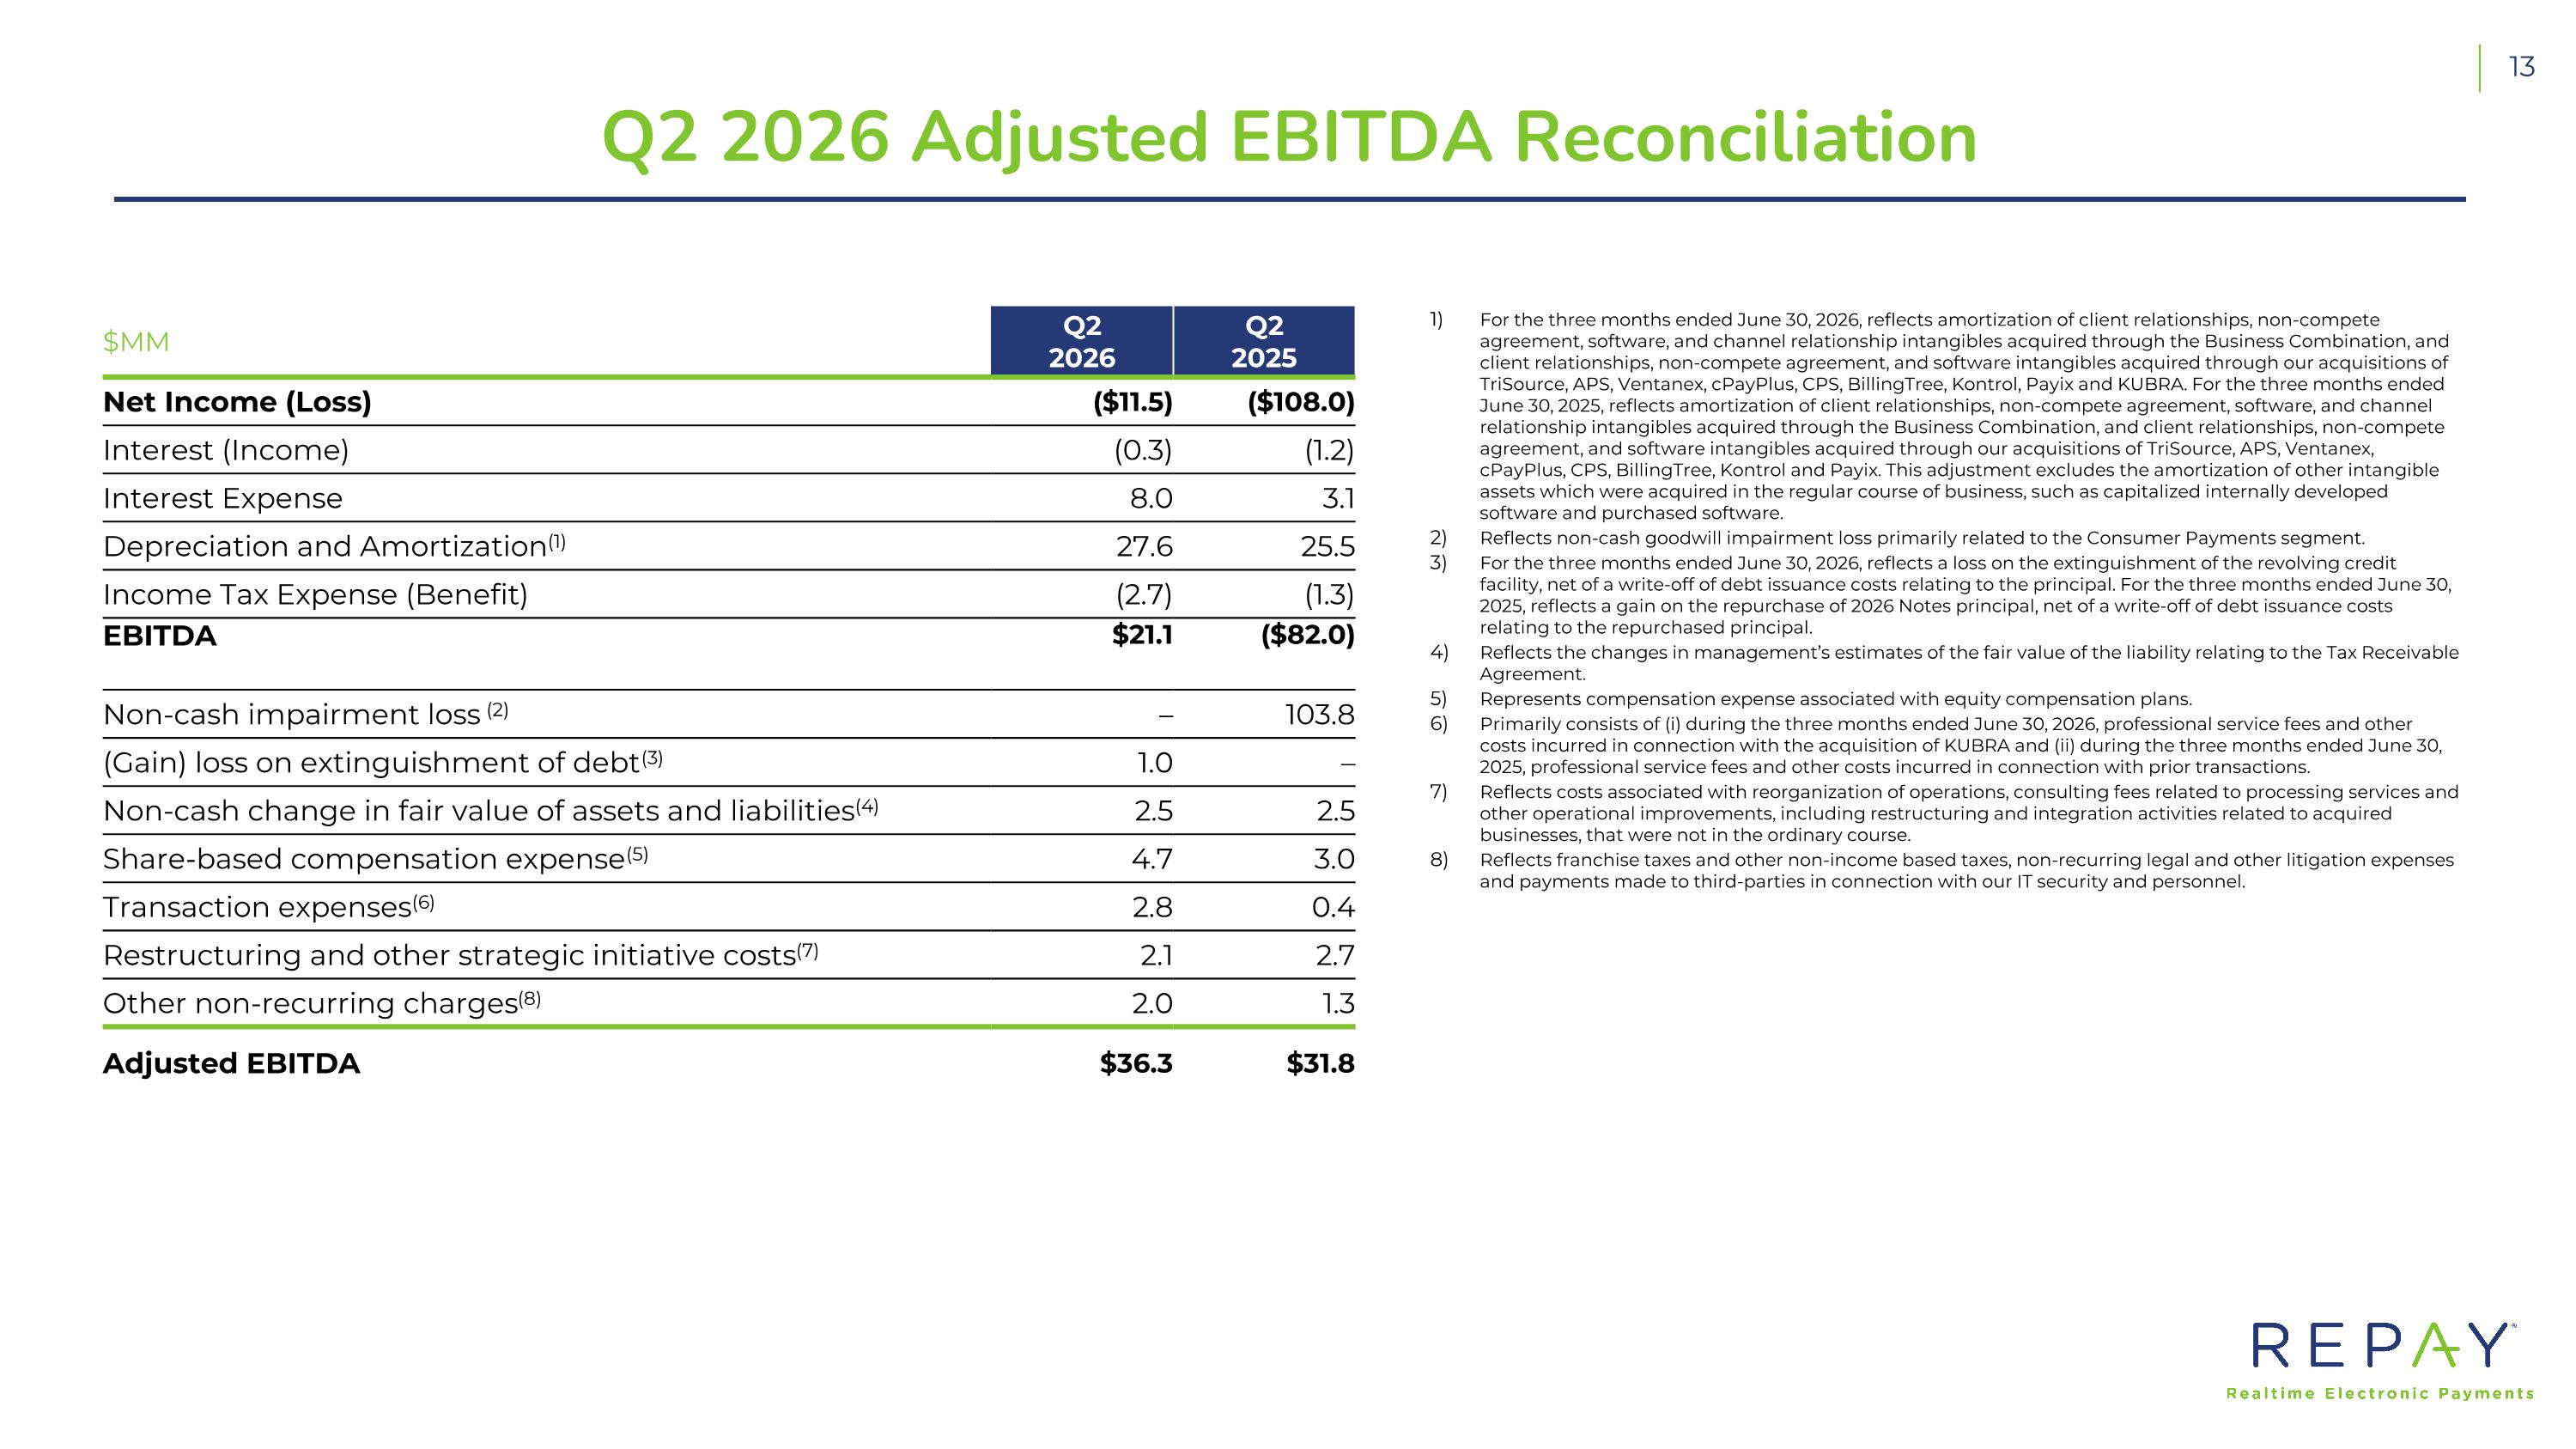
Q2 2026 Adjusted EBITDA Reconciliation For the three months ended June 30, 2026, reflects amortization of client relationships, non-compete agreement, software, and channel relationship intangibles acquired through the Business Combination, and client relationships, non-compete agreement, and software intangibles acquired through our acquisitions of TriSource, APS, Ventanex, cPayPlus, CPS, BillingTree, Kontrol, Payix and KUBRA. For the three months ended June 30, 2025, reflects amortization of client relationships, non-compete agreement, software, and channel relationship intangibles acquired through the Business Combination, and client relationships, non-compete agreement, and software intangibles acquired through our acquisitions of TriSource, APS, Ventanex, cPayPlus, CPS, BillingTree, Kontrol and Payix. This adjustment excludes the amortization of other intangible assets which were acquired in the regular course of business, such as capitalized internally developed software and purchased software. Reflects non-cash goodwill impairment loss primarily related to the Consumer Payments segment. For the three months ended June 30, 2026, reflects a loss on the extinguishment of the revolving credit facility, net of a write-off of debt issuance costs relating to the principal. For the three months ended June 30, 2025, reflects a gain on the repurchase of 2026 Notes principal, net of a write-off of debt issuance costs relating to the repurchased principal. Reflects the changes in management’s estimates of the fair value of the liability relating to the Tax Receivable Agreement. Represents compensation expense associated with equity compensation plans. Primarily consists of (i) during the three months ended June 30, 2026, professional service fees and other costs incurred in connection with the acquisition of KUBRA and (ii) during the three months ended June 30, 2025, professional service fees and other costs incurred in connection with prior transactions. Reflects costs associated with reorganization of operations, consulting fees related to processing services and other operational improvements, including restructuring and integration activities related to acquired businesses, that were not in the ordinary course. Reflects franchise taxes and other non-income based taxes, non-recurring legal and other litigation expenses and payments made to third-parties in connection with our IT security and personnel. $MM Q2 2026 Q2 2025 Net Income (Loss) ($11.5) ($108.0) Interest (Income) (0.3) (1.2) Interest Expense 8.0 3.1 Depreciation and Amortization(1) 27.6 25.5 Income Tax Expense (Benefit) (2.7) (1.3) EBITDA $21.1 ($82.0) Non-cash impairment loss (2) – 103.8 (Gain) loss on extinguishment of debt(3) 1.0 – Non-cash change in fair value of assets and liabilities(4) 2.5 2.5 Share-based compensation expense(5) 4.7 3.0 Transaction expenses(6) 2.8 0.4 Restructuring and other strategic initiative costs(7) 2.1 2.7 Other non-recurring charges(8) 2.0 1.3 Adjusted EBITDA $36.3 $31.8
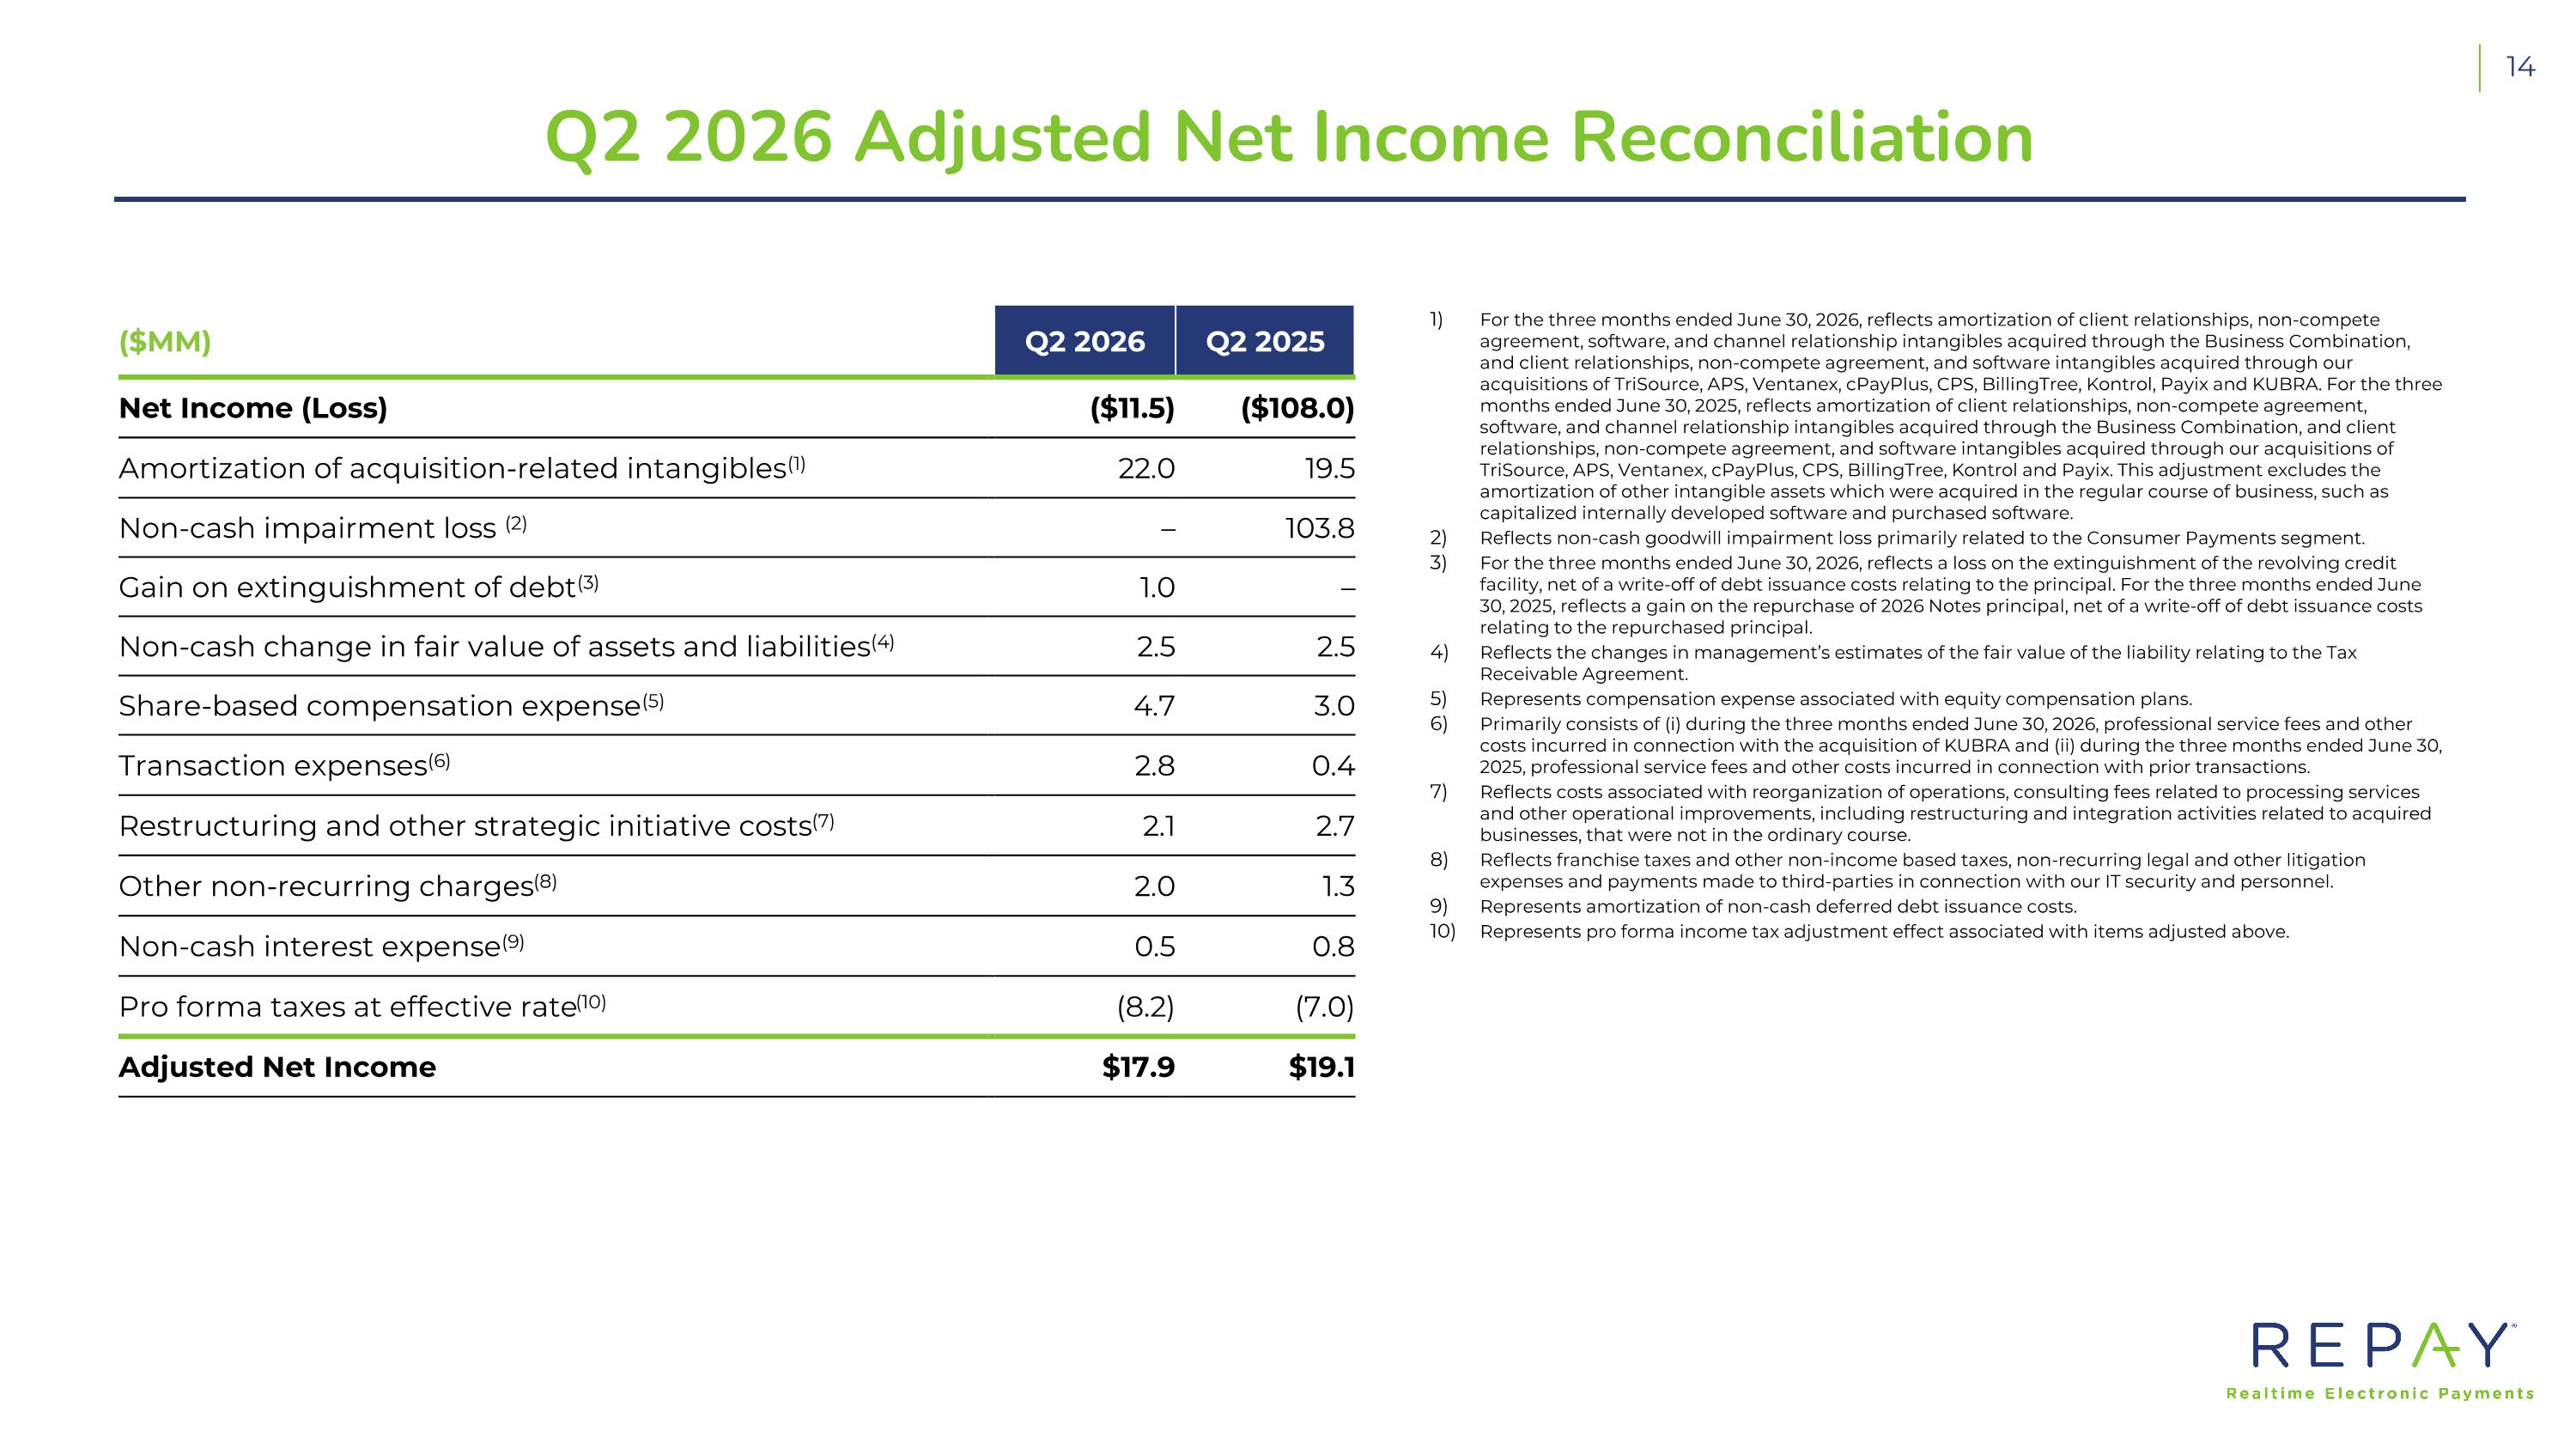
Q2 2026 Adjusted Net Income Reconciliation For the three months ended June 30, 2026, reflects amortization of client relationships, non-compete agreement, software, and channel relationship intangibles acquired through the Business Combination, and client relationships, non-compete agreement, and software intangibles acquired through our acquisitions of TriSource, APS, Ventanex, cPayPlus, CPS, BillingTree, Kontrol, Payix and KUBRA. For the three months ended June 30, 2025, reflects amortization of client relationships, non-compete agreement, software, and channel relationship intangibles acquired through the Business Combination, and client relationships, non-compete agreement, and software intangibles acquired through our acquisitions of TriSource, APS, Ventanex, cPayPlus, CPS, BillingTree, Kontrol and Payix. This adjustment excludes the amortization of other intangible assets which were acquired in the regular course of business, such as capitalized internally developed software and purchased software. Reflects non-cash goodwill impairment loss primarily related to the Consumer Payments segment. For the three months ended June 30, 2026, reflects a loss on the extinguishment of the revolving credit facility, net of a write-off of debt issuance costs relating to the principal. For the three months ended June 30, 2025, reflects a gain on the repurchase of 2026 Notes principal, net of a write-off of debt issuance costs relating to the repurchased principal. Reflects the changes in management’s estimates of the fair value of the liability relating to the Tax Receivable Agreement. Represents compensation expense associated with equity compensation plans. Primarily consists of (i) during the three months ended June 30, 2026, professional service fees and other costs incurred in connection with the acquisition of KUBRA and (ii) during the three months ended June 30, 2025, professional service fees and other costs incurred in connection with prior transactions. Reflects costs associated with reorganization of operations, consulting fees related to processing services and other operational improvements, including restructuring and integration activities related to acquired businesses, that were not in the ordinary course. Reflects franchise taxes and other non-income based taxes, non-recurring legal and other litigation expenses and payments made to third-parties in connection with our IT security and personnel. Represents amortization of non-cash deferred debt issuance costs. Represents pro forma income tax adjustment effect associated with items adjusted above. ($MM) Q2 2026 Q2 2025 Net Income (Loss) ($11.5) ($108.0) Amortization of acquisition-related intangibles(1) 22.0 19.5 Non-cash impairment loss (2) – 103.8 Gain on extinguishment of debt(3) 1.0 – Non-cash change in fair value of assets and liabilities(4) 2.5 2.5 Share-based compensation expense(5) 4.7 3.0 Transaction expenses(6) 2.8 0.4 Restructuring and other strategic initiative costs(7) 2.1 2.7 Other non-recurring charges(8) 2.0 1.3 Non-cash interest expense(9) 0.5 0.8 Pro forma taxes at effective rate(10) (8.2) (7.0) Adjusted Net Income $17.9 $19.1
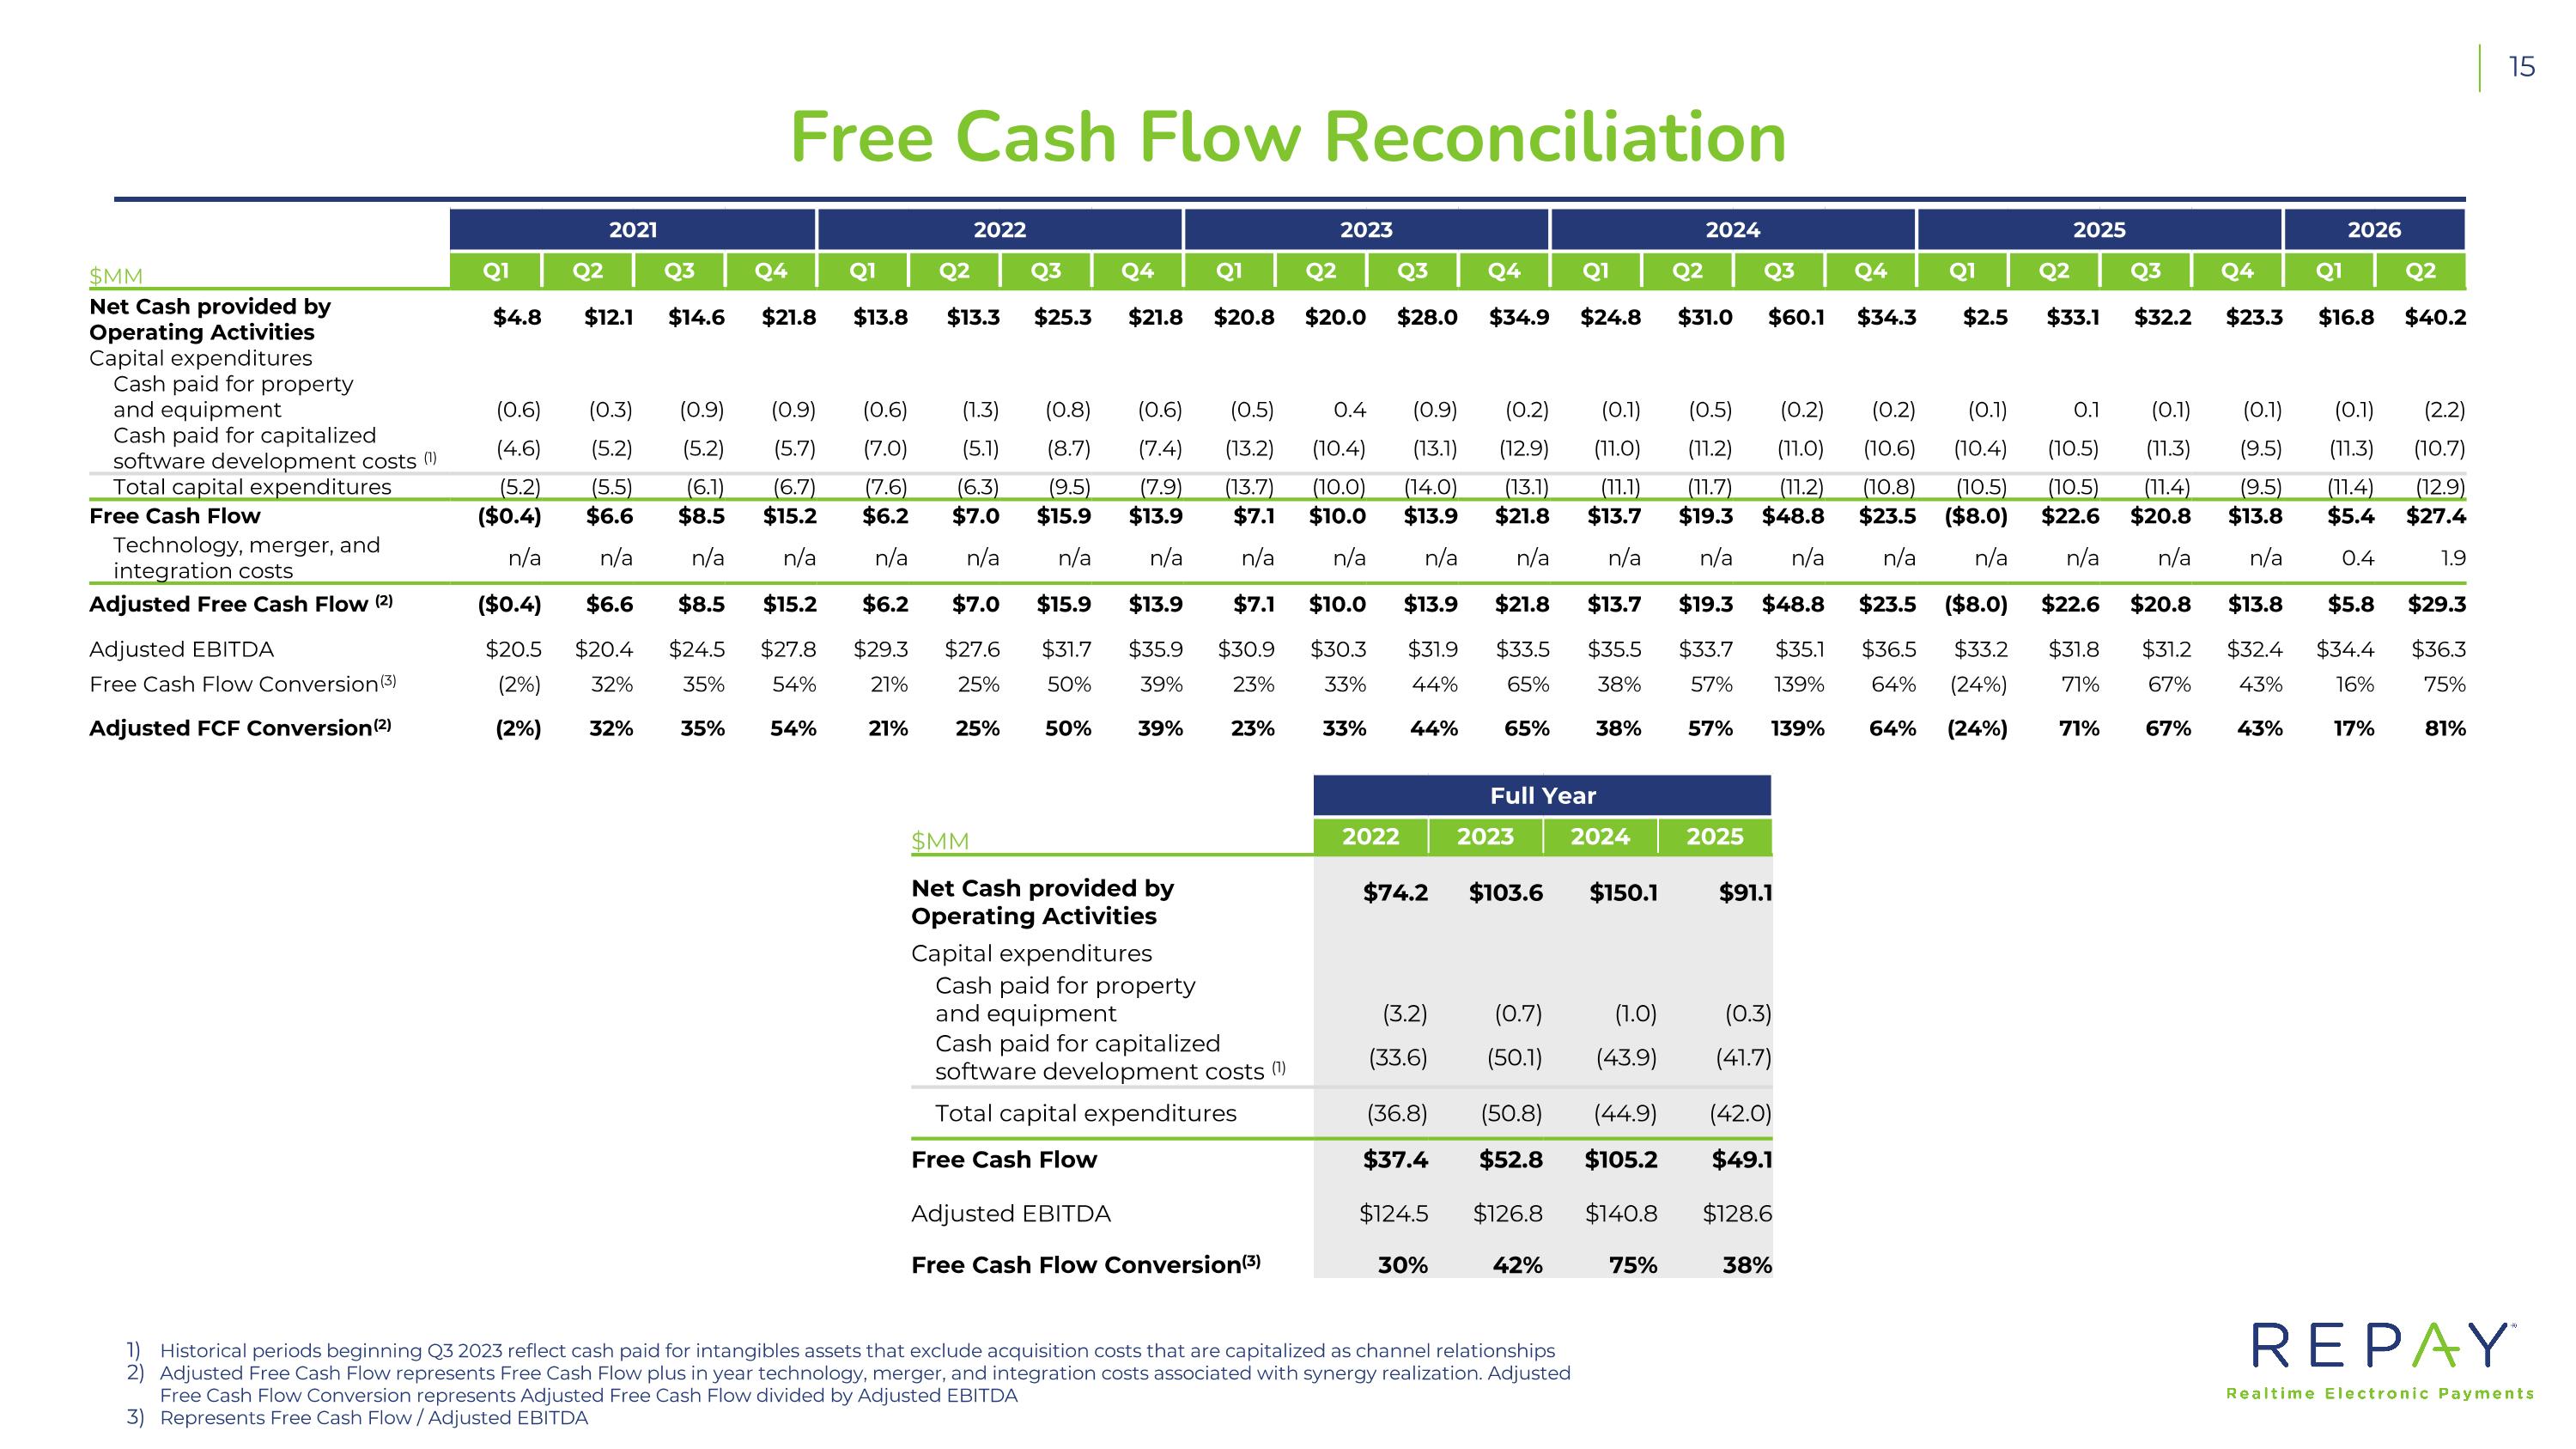
Free Cash Flow Reconciliation 2021 2022 2023 2024 2025 2026 $MM Q1 Q2 Q3 Q4 Q1 Q2 Q3 Q4 Q1 Q2 Q3 Q4 Q1 Q2 Q3 Q4 Q1 Q2 Q3 Q4 Q1 Q2 Net Cash provided by Operating Activities $4.8 $12.1 $14.6 $21.8 $13.8 $13.3 $25.3 $21.8 $20.8 $20.0 $28.0 $34.9 $24.8 $31.0 $60.1 $34.3 $2.5 $33.1 $32.2 $23.3 $16.8 $40.2 Capital expenditures Cash paid for property and equipment (0.6) (0.3) (0.9) (0.9) (0.6) (1.3) (0.8) (0.6) (0.5) 0.4 (0.9) (0.2) (0.1) (0.5) (0.2) (0.2) (0.1) 0.1 (0.1) (0.1) (0.1) (2.2) Cash paid for capitalized software development costs (1) (4.6) (5.2) (5.2) (5.7) (7.0) (5.1) (8.7) (7.4) (13.2) (10.4) (13.1) (12.9) (11.0) (11.2) (11.0) (10.6) (10.4) (10.5) (11.3) (9.5) (11.3) (10.7) Total capital expenditures (5.2) (5.5) (6.1) (6.7) (7.6) (6.3) (9.5) (7.9) (13.7) (10.0) (14.0) (13.1) (11.1) (11.7) (11.2) (10.8) (10.5) (10.5) (11.4) (9.5) (11.4) (12.9) Free Cash Flow ($0.4) $6.6 $8.5 $15.2 $6.2 $7.0 $15.9 $13.9 $7.1 $10.0 $13.9 $21.8 $13.7 $19.3 $48.8 $23.5 ($8.0) $22.6 $20.8 $13.8 $5.4 $27.4 Technology, merger, and integration costs n/a n/a n/a n/a n/a n/a n/a n/a n/a n/a n/a n/a n/a n/a n/a n/a n/a n/a n/a n/a 0.4 1.9 Adjusted Free Cash Flow (2) ($0.4) $6.6 $8.5 $15.2 $6.2 $7.0 $15.9 $13.9 $7.1 $10.0 $13.9 $21.8 $13.7 $19.3 $48.8 $23.5 ($8.0) $22.6 $20.8 $13.8 $5.8 $29.3 Adjusted EBITDA $20.5 $20.4 $24.5 $27.8 $29.3 $27.6 $31.7 $35.9 $30.9 $30.3 $31.9 $33.5 $35.5 $33.7 $35.1 $36.5 $33.2 $31.8 $31.2 $32.4 $34.4 $36.3 Free Cash Flow Conversion(3) (2%) 32% 35% 54% 21% 25% 50% 39% 23% 33% 44% 65% 38% 57% 139% 64% (24%) 71% 67% 43% 16% 75% Adjusted FCF Conversion(2) (2%) 32% 35% 54% 21% 25% 50% 39% 23% 33% 44% 65% 38% 57% 139% 64% (24%) 71% 67% 43% 17% 81% Historical periods beginning Q3 2023 reflect cash paid for intangibles assets that exclude acquisition costs that are capitalized as channel relationships Adjusted Free Cash Flow represents Free Cash Flow plus in year technology, merger, and integration costs associated with synergy realization. Adjusted Free Cash Flow Conversion represents Adjusted Free Cash Flow divided by Adjusted EBITDA Represents Free Cash Flow / Adjusted EBITDA Full Year $MM 2022 2023 2024 2025 Net Cash provided by Operating Activities $74.2 $103.6 $150.1 $91.1 Capital expenditures Cash paid for property and equipment (3.2) (0.7) (1.0) (0.3) Cash paid for capitalized software development costs (1) (33.6) (50.1) (43.9) (41.7) Total capital expenditures (36.8) (50.8) (44.9) (42.0) Free Cash Flow $37.4 $52.8 $105.2 $49.1 Adjusted EBITDA $124.5 $126.8 $140.8 $128.6 Free Cash Flow Conversion(3) 30% 42% 75% 38%
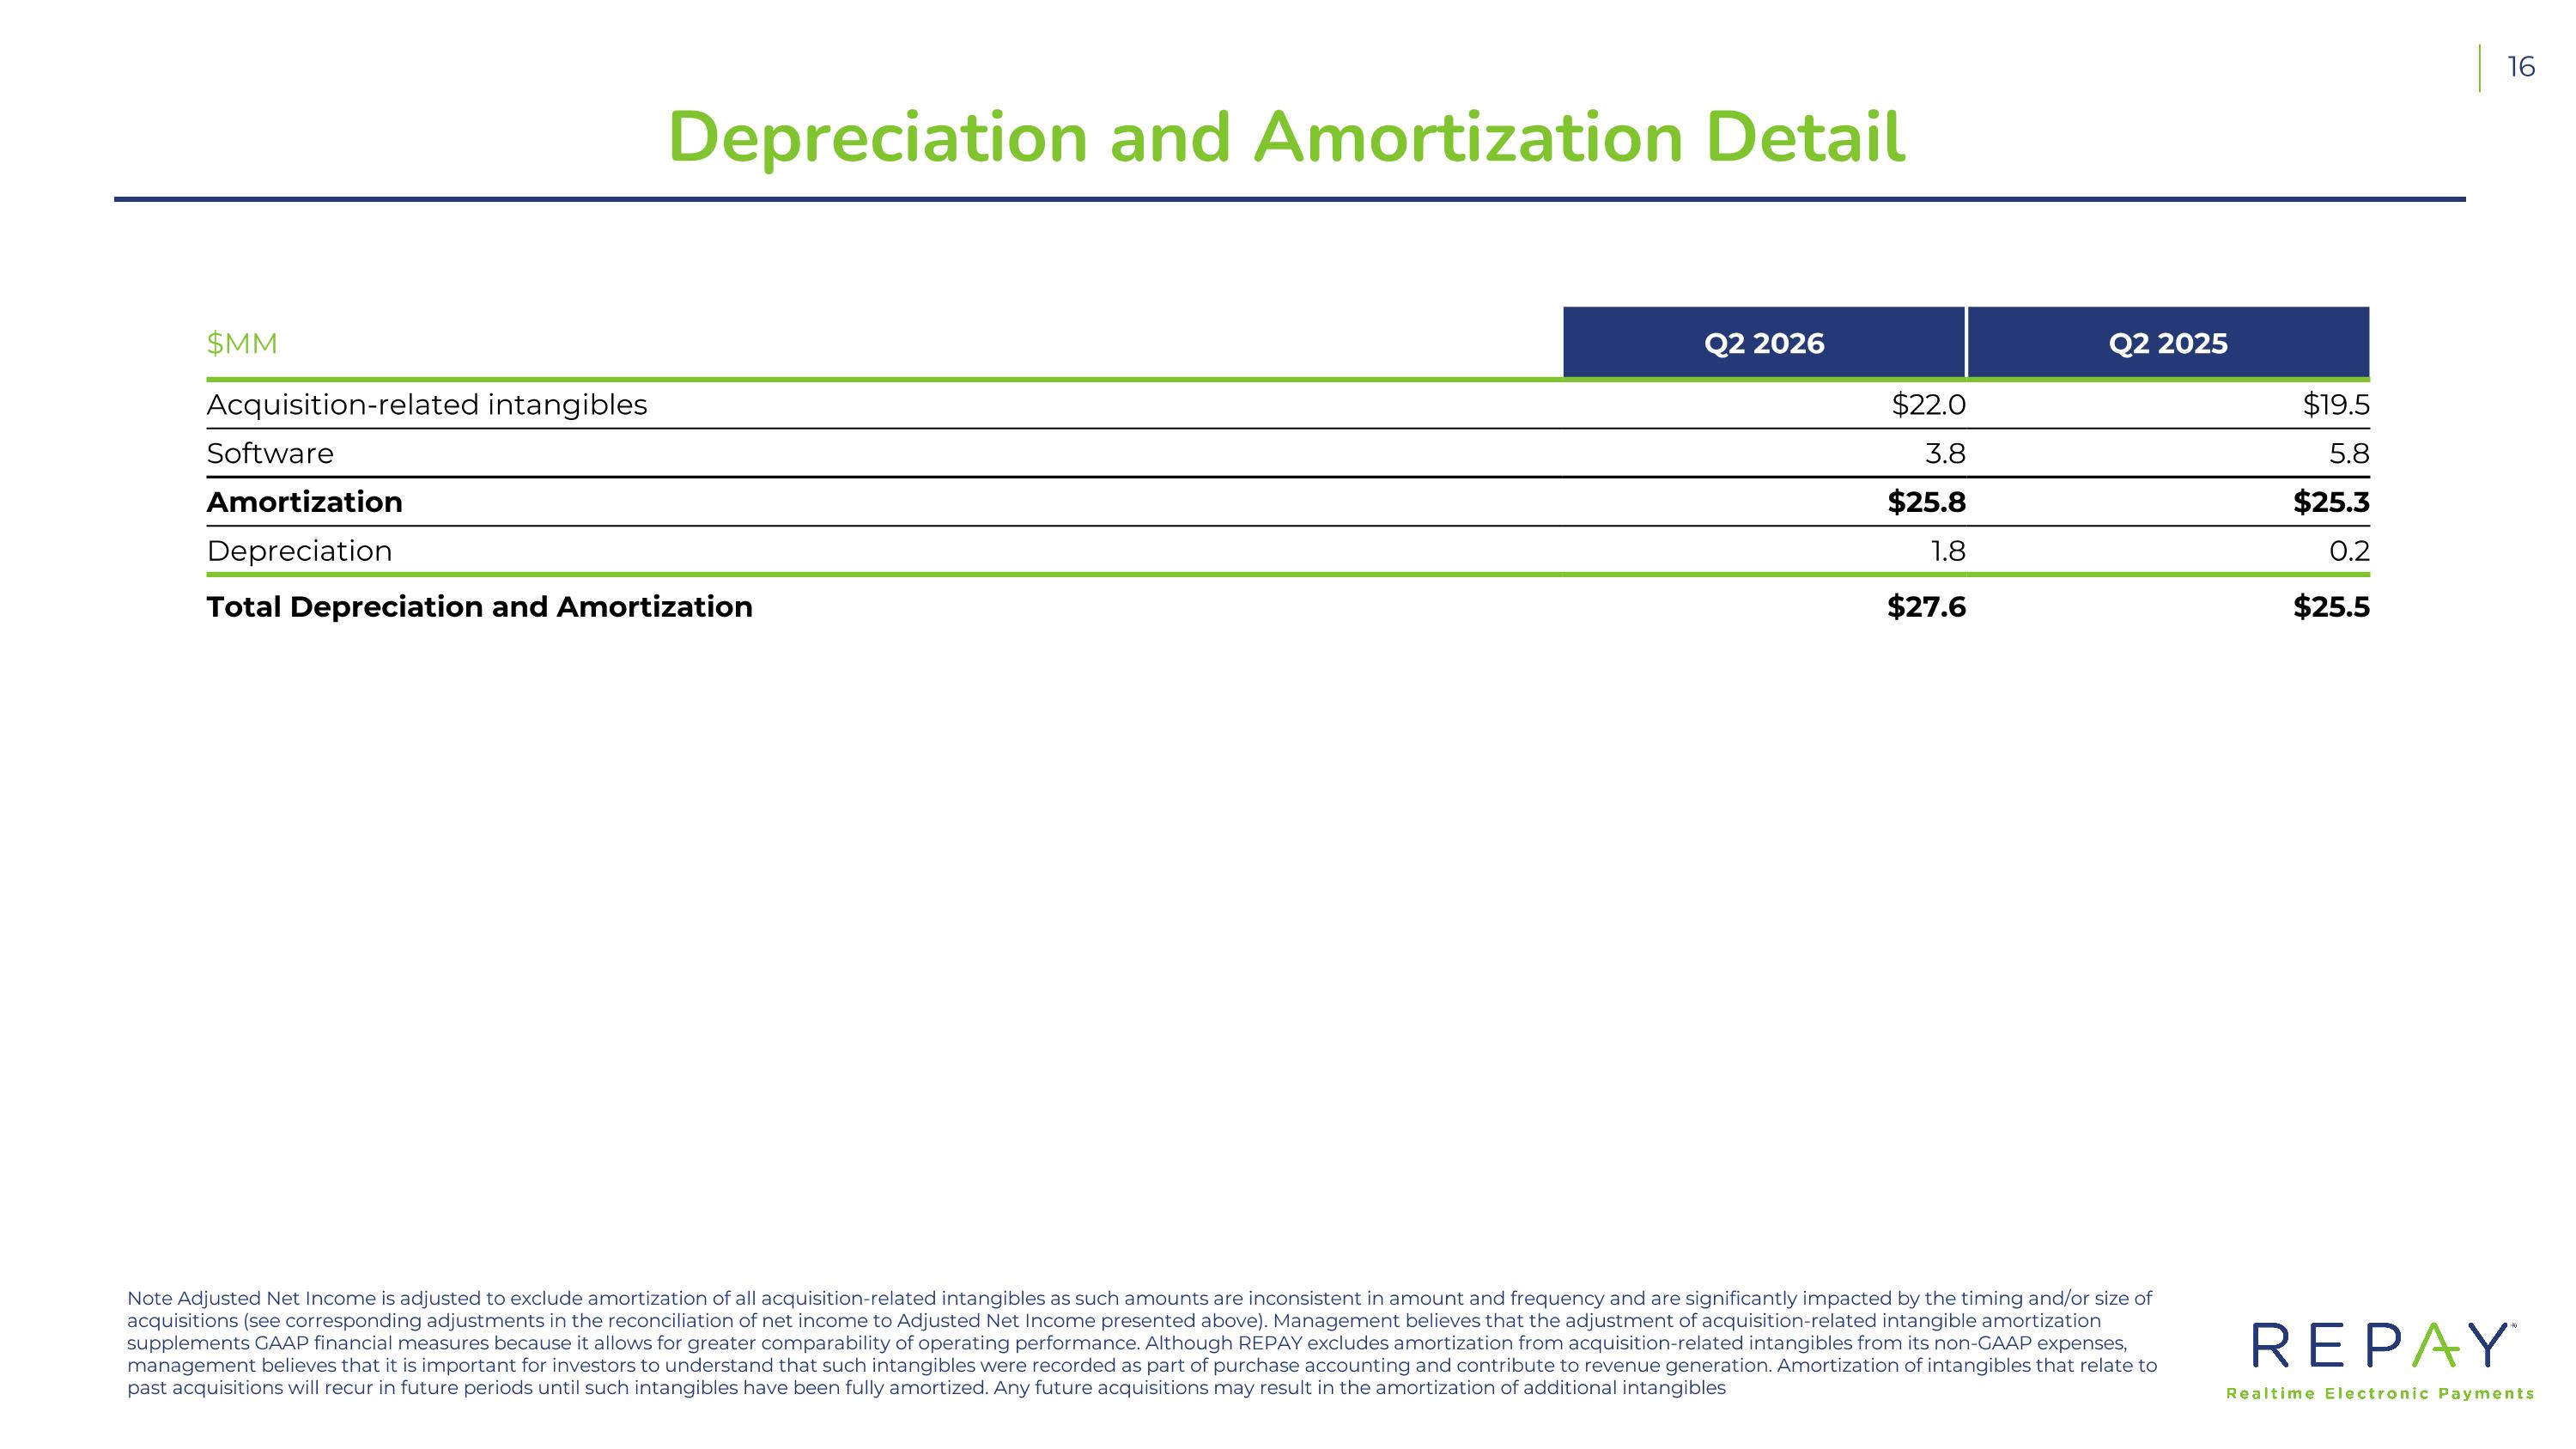
Depreciation and Amortization Detail Note Adjusted Net Income is adjusted to exclude amortization of all acquisition-related intangibles as such amounts are inconsistent in amount and frequency and are significantly impacted by the timing and/or size of acquisitions (see corresponding adjustments in the reconciliation of net income to Adjusted Net Income presented above). Management believes that the adjustment of acquisition-related intangible amortization supplements GAAP financial measures because it allows for greater comparability of operating performance. Although REPAY excludes amortization from acquisition-related intangibles from its non-GAAP expenses, management believes that it is important for investors to understand that such intangibles were recorded as part of purchase accounting and contribute to revenue generation. Amortization of intangibles that relate to past acquisitions will recur in future periods until such intangibles have been fully amortized. Any future acquisitions may result in the amortization of additional intangibles $MM Q2 2026 Q2 2025 Acquisition-related intangibles $22.0 $19.5 Software 3.8 5.8 Amortization $25.8 $25.3 Depreciation 1.8 0.2 Total Depreciation and Amortization $27.6 $25.5
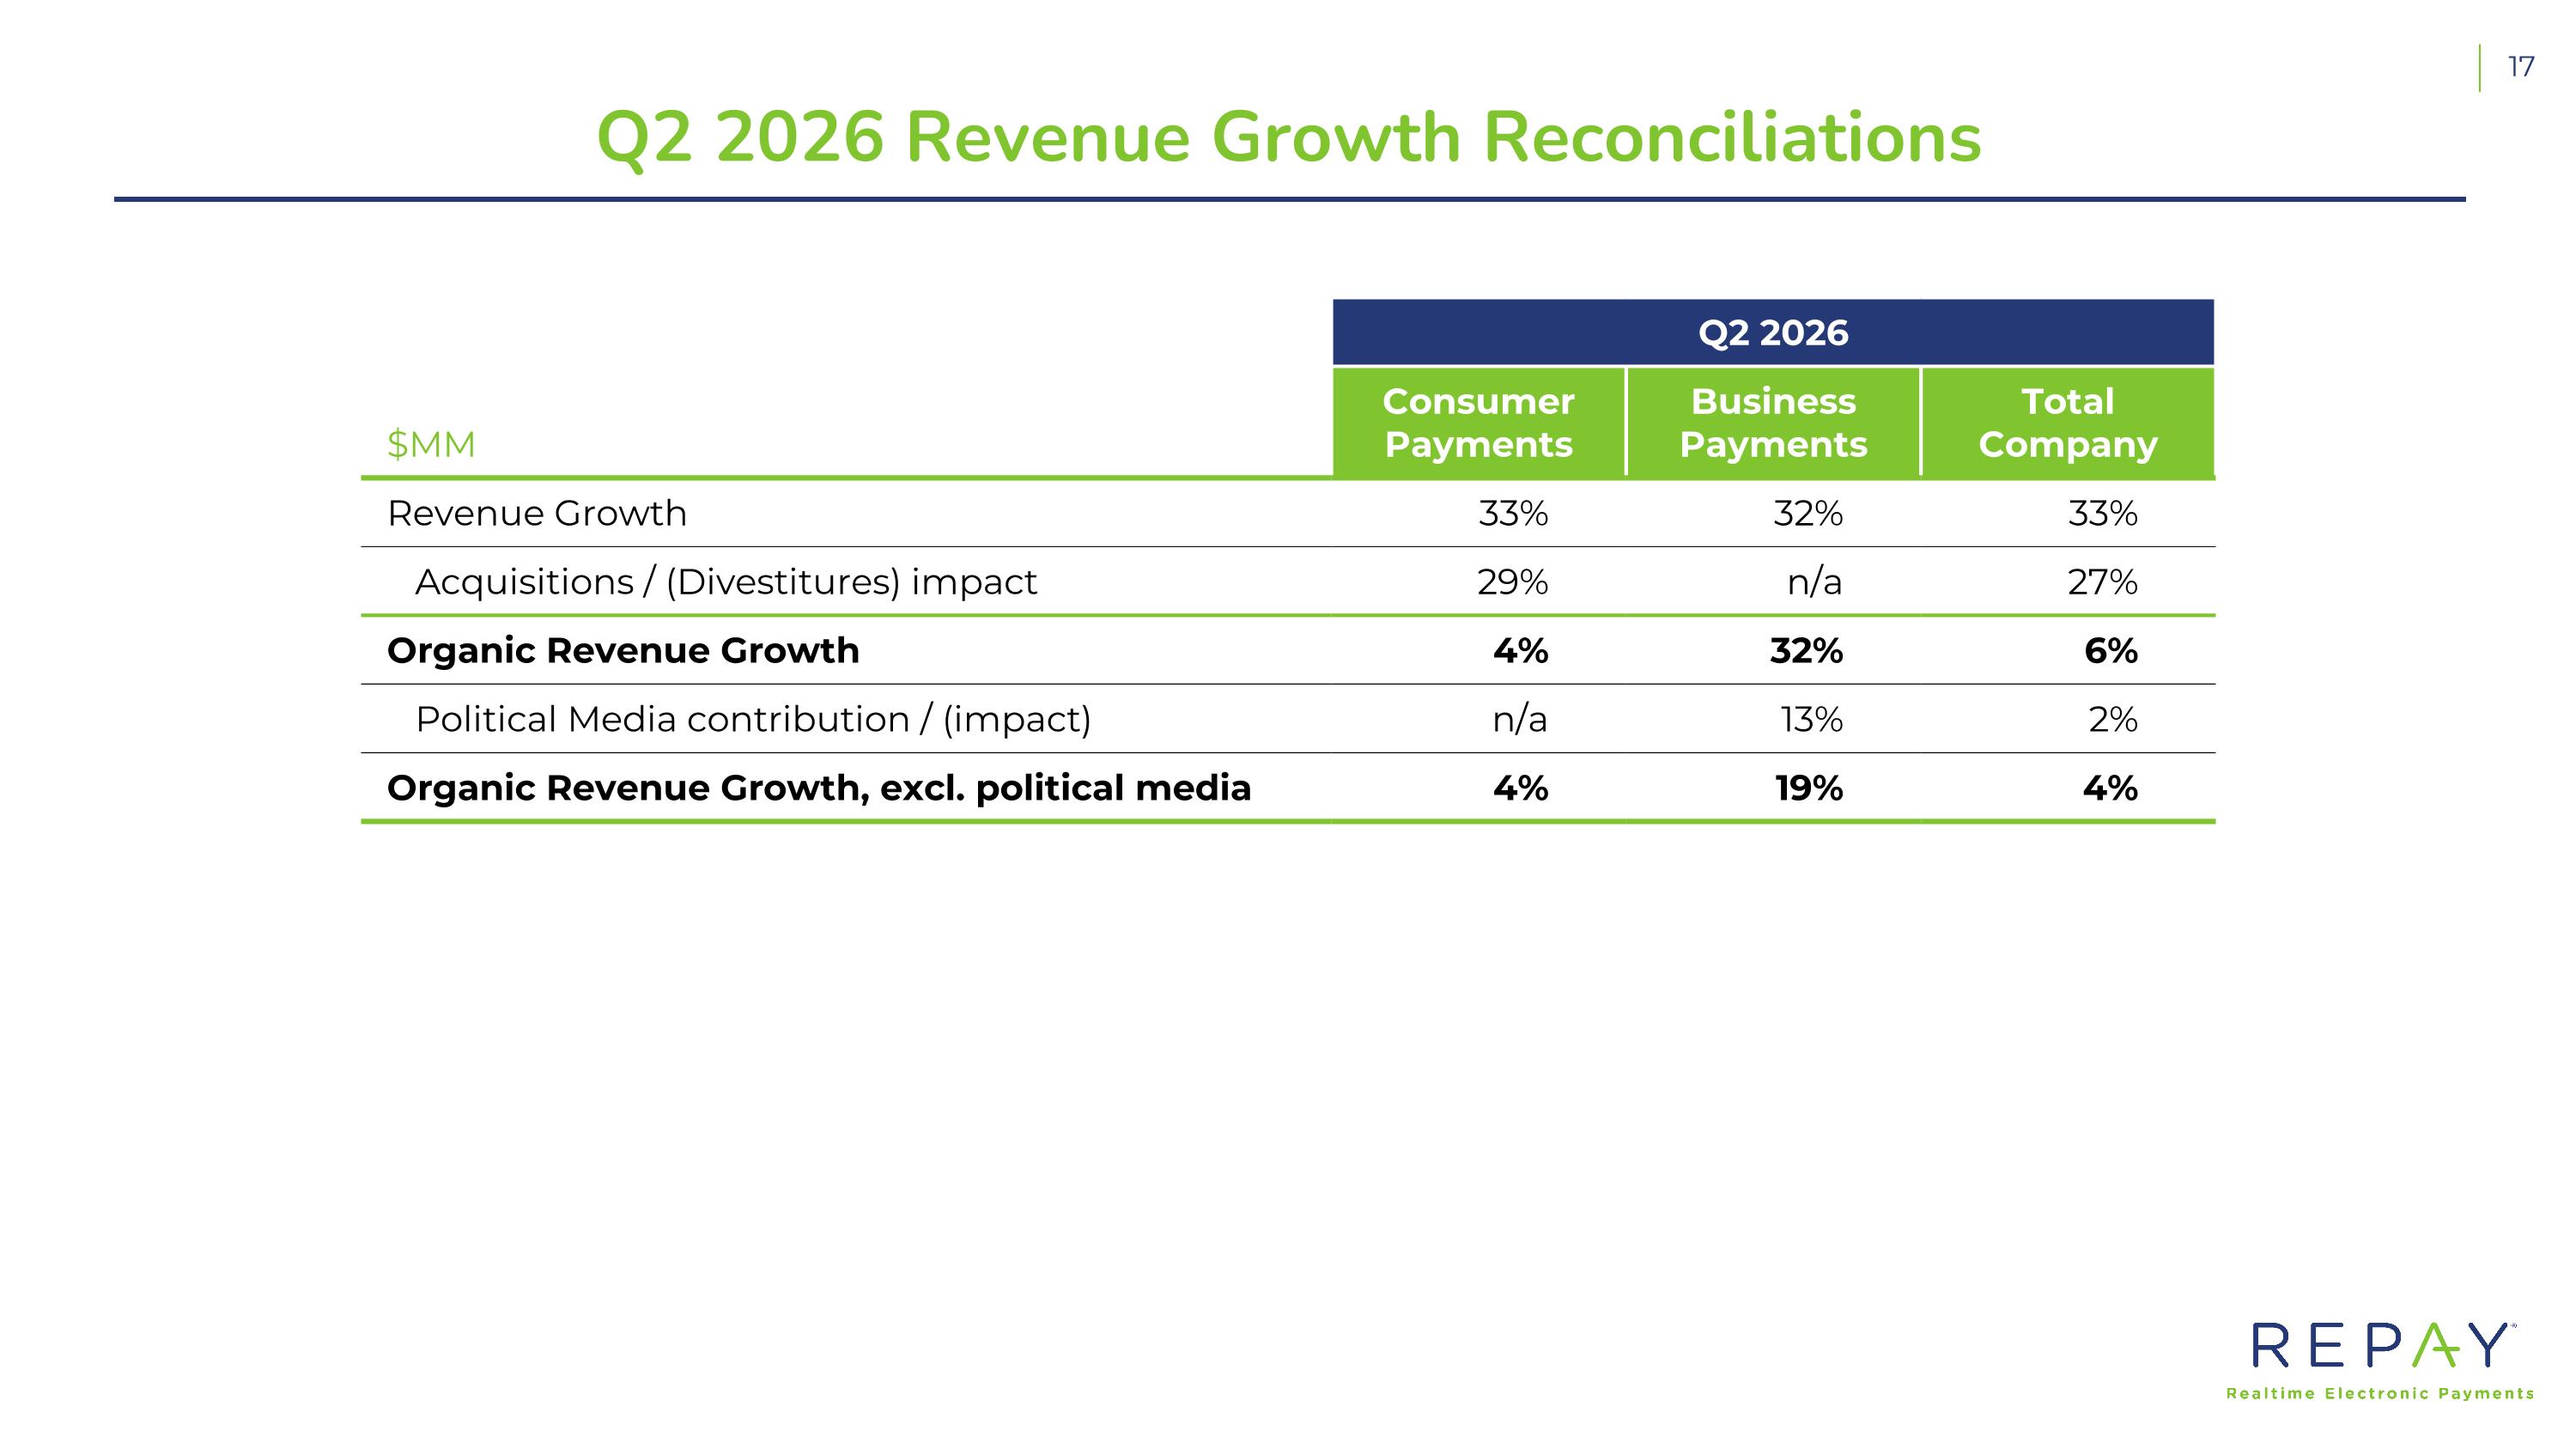
Q2 2026 Revenue Growth Reconciliations Q2 2026 $MM Consumer Payments Business Payments Total Company Revenue Growth 33% 32% 33% Acquisitions / (Divestitures) impact 29% n/a 27% Organic Revenue Growth 4% 32% 6% Political Media contribution / (impact) n/a 13% 2% Organic Revenue Growth, excl. political media 4% 19% 4%
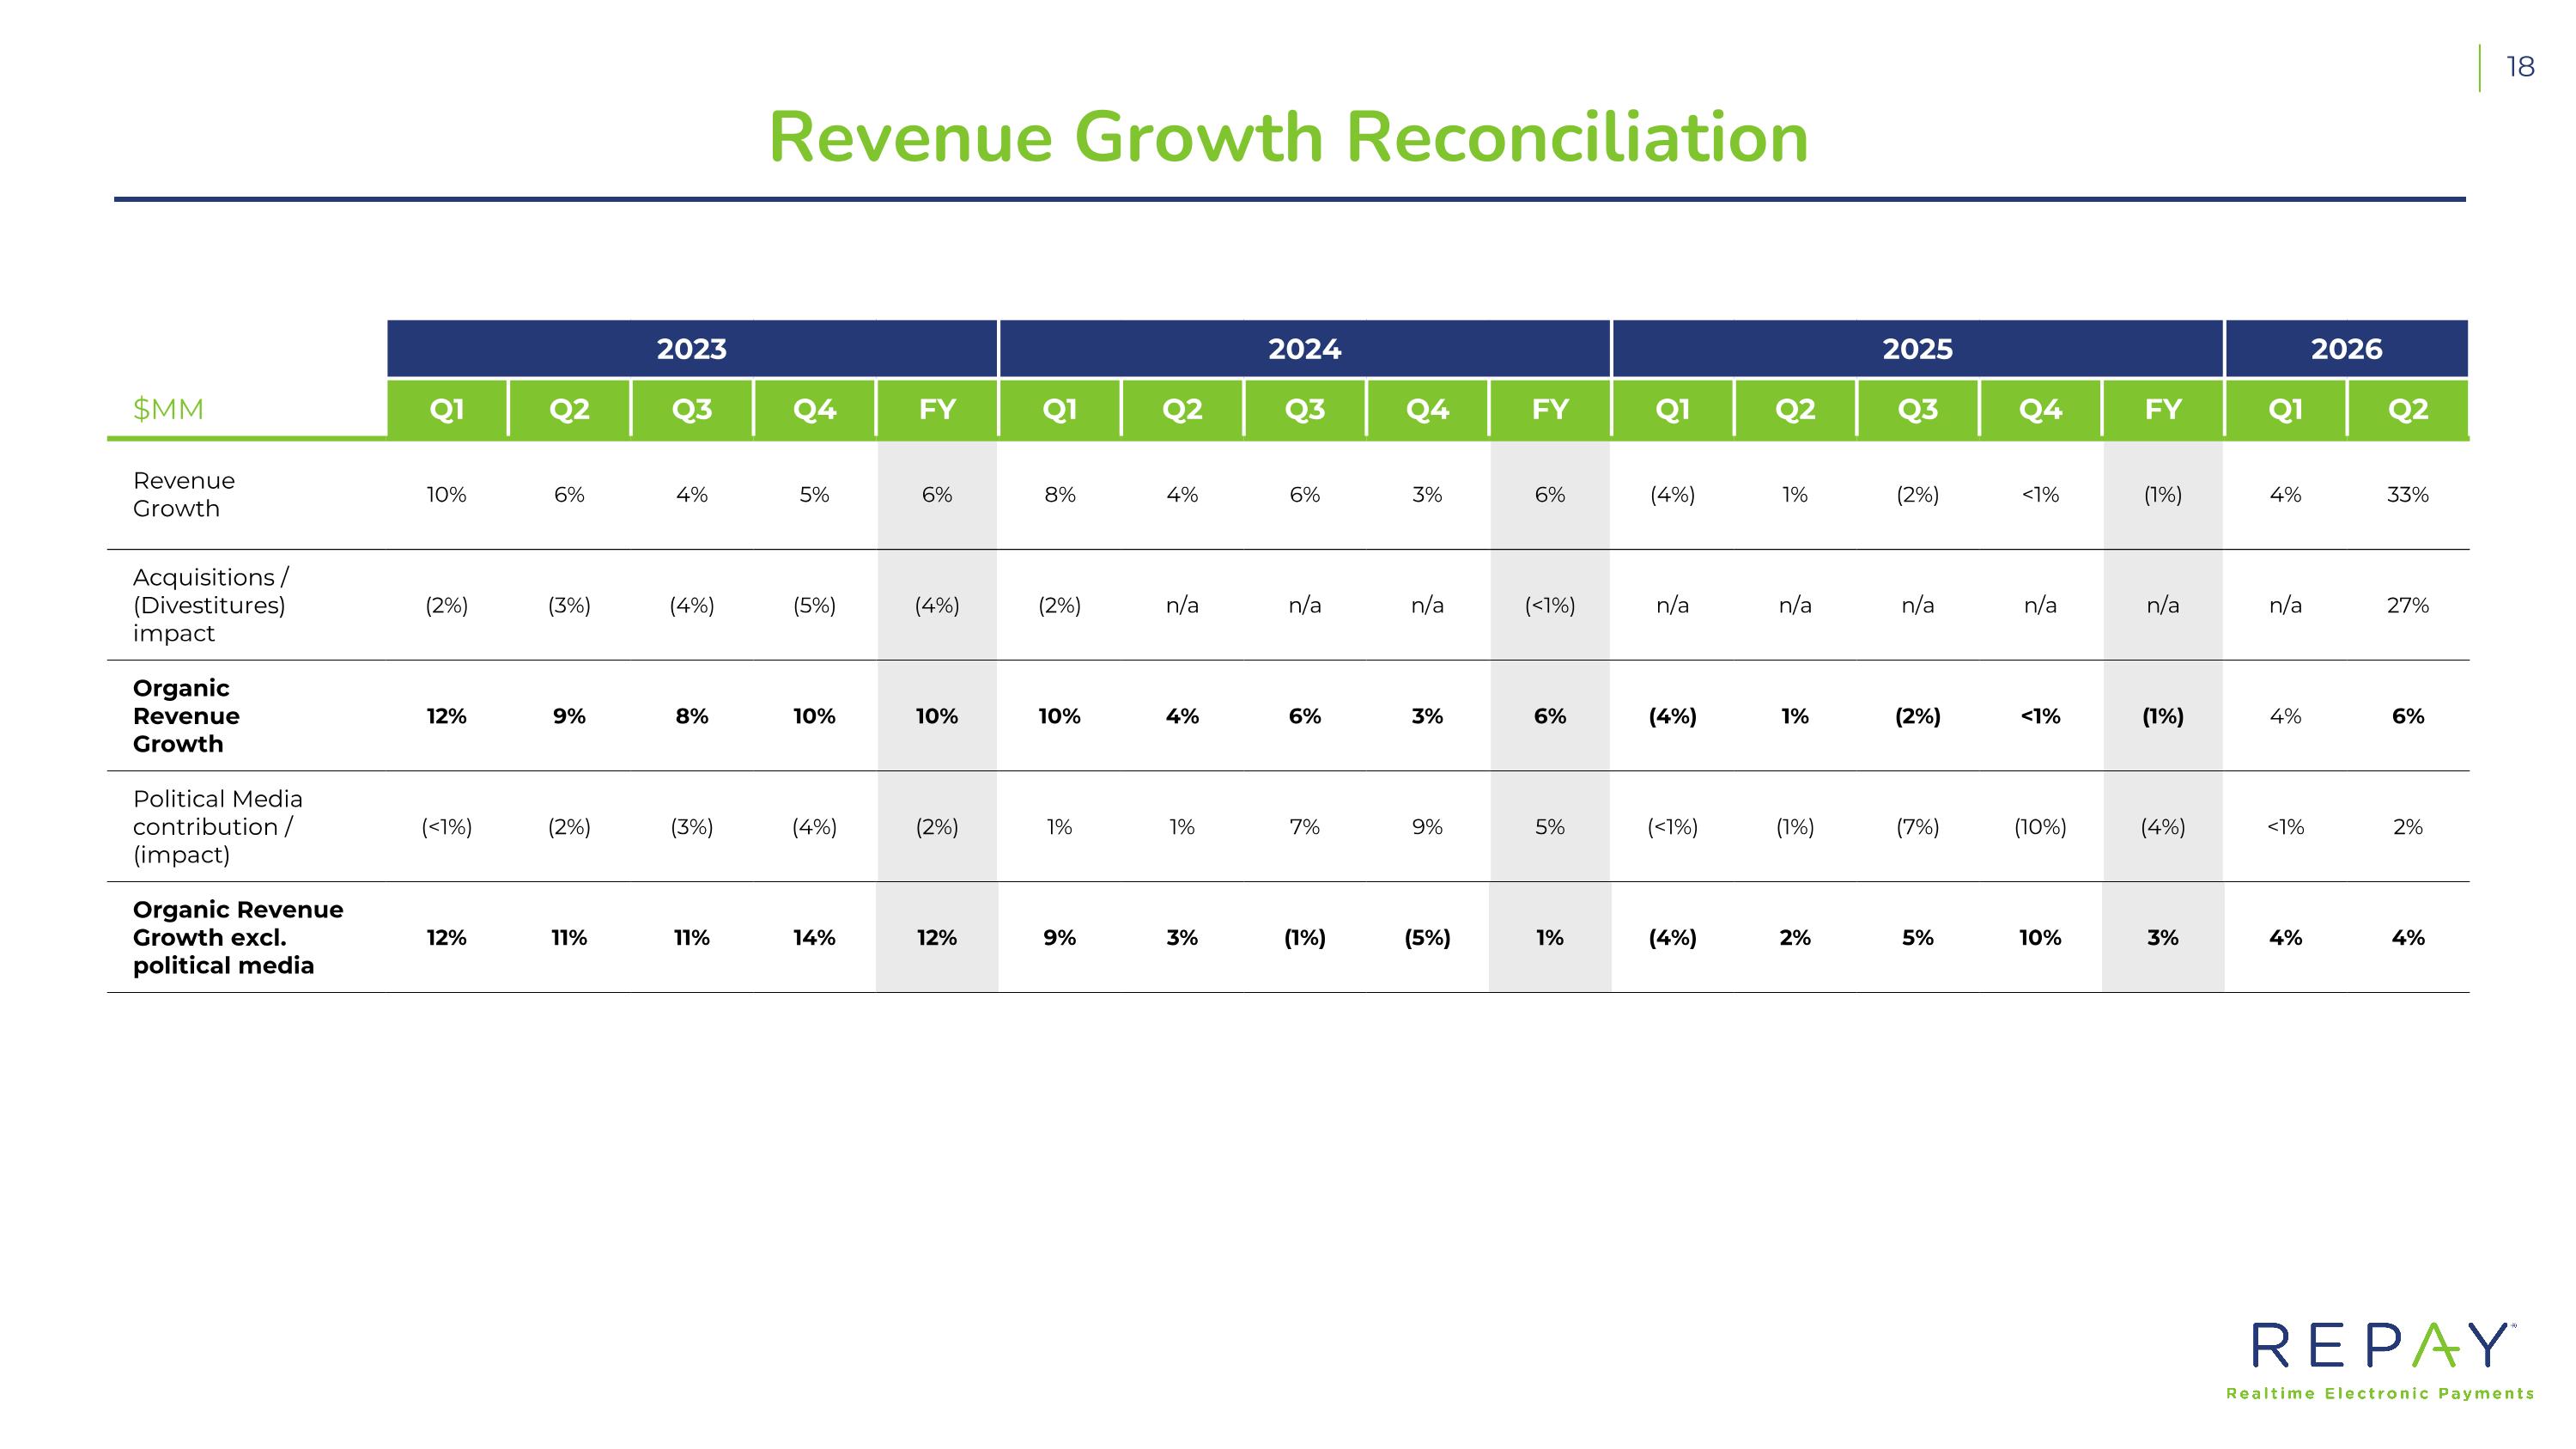
Revenue Growth Reconciliation 2023 2024 2025 2026 $MM Q1 Q2 Q3 Q4 FY Q1 Q2 Q3 Q4 FY Q1 Q2 Q3 Q4 FY Q1 Q2 Revenue Growth 10% 6% 4% 5% 6% 8% 4% 6% 3% 6% (4%) 1% (2%) <1% (1%) 4% 33% Acquisitions / (Divestitures) impact (2%) (3%) (4%) (5%) (4%) (2%) n/a n/a n/a (<1%) n/a n/a n/a n/a n/a n/a 27% Organic Revenue Growth 12% 9% 8% 10% 10% 10% 4% 6% 3% 6% (4%) 1% (2%) <1% (1%) 4% 6% Political Media contribution / (impact) (<1%) (2%) (3%) (4%) (2%) 1% 1% 7% 9% 5% (<1%) (1%) (7%) (10%) (4%) <1% 2% Organic Revenue Growth excl. political media 12% 11% 11% 14% 12% 9% 3% (1%) (5%) 1% (4%) 2% 5% 10% 3% 4% 4%
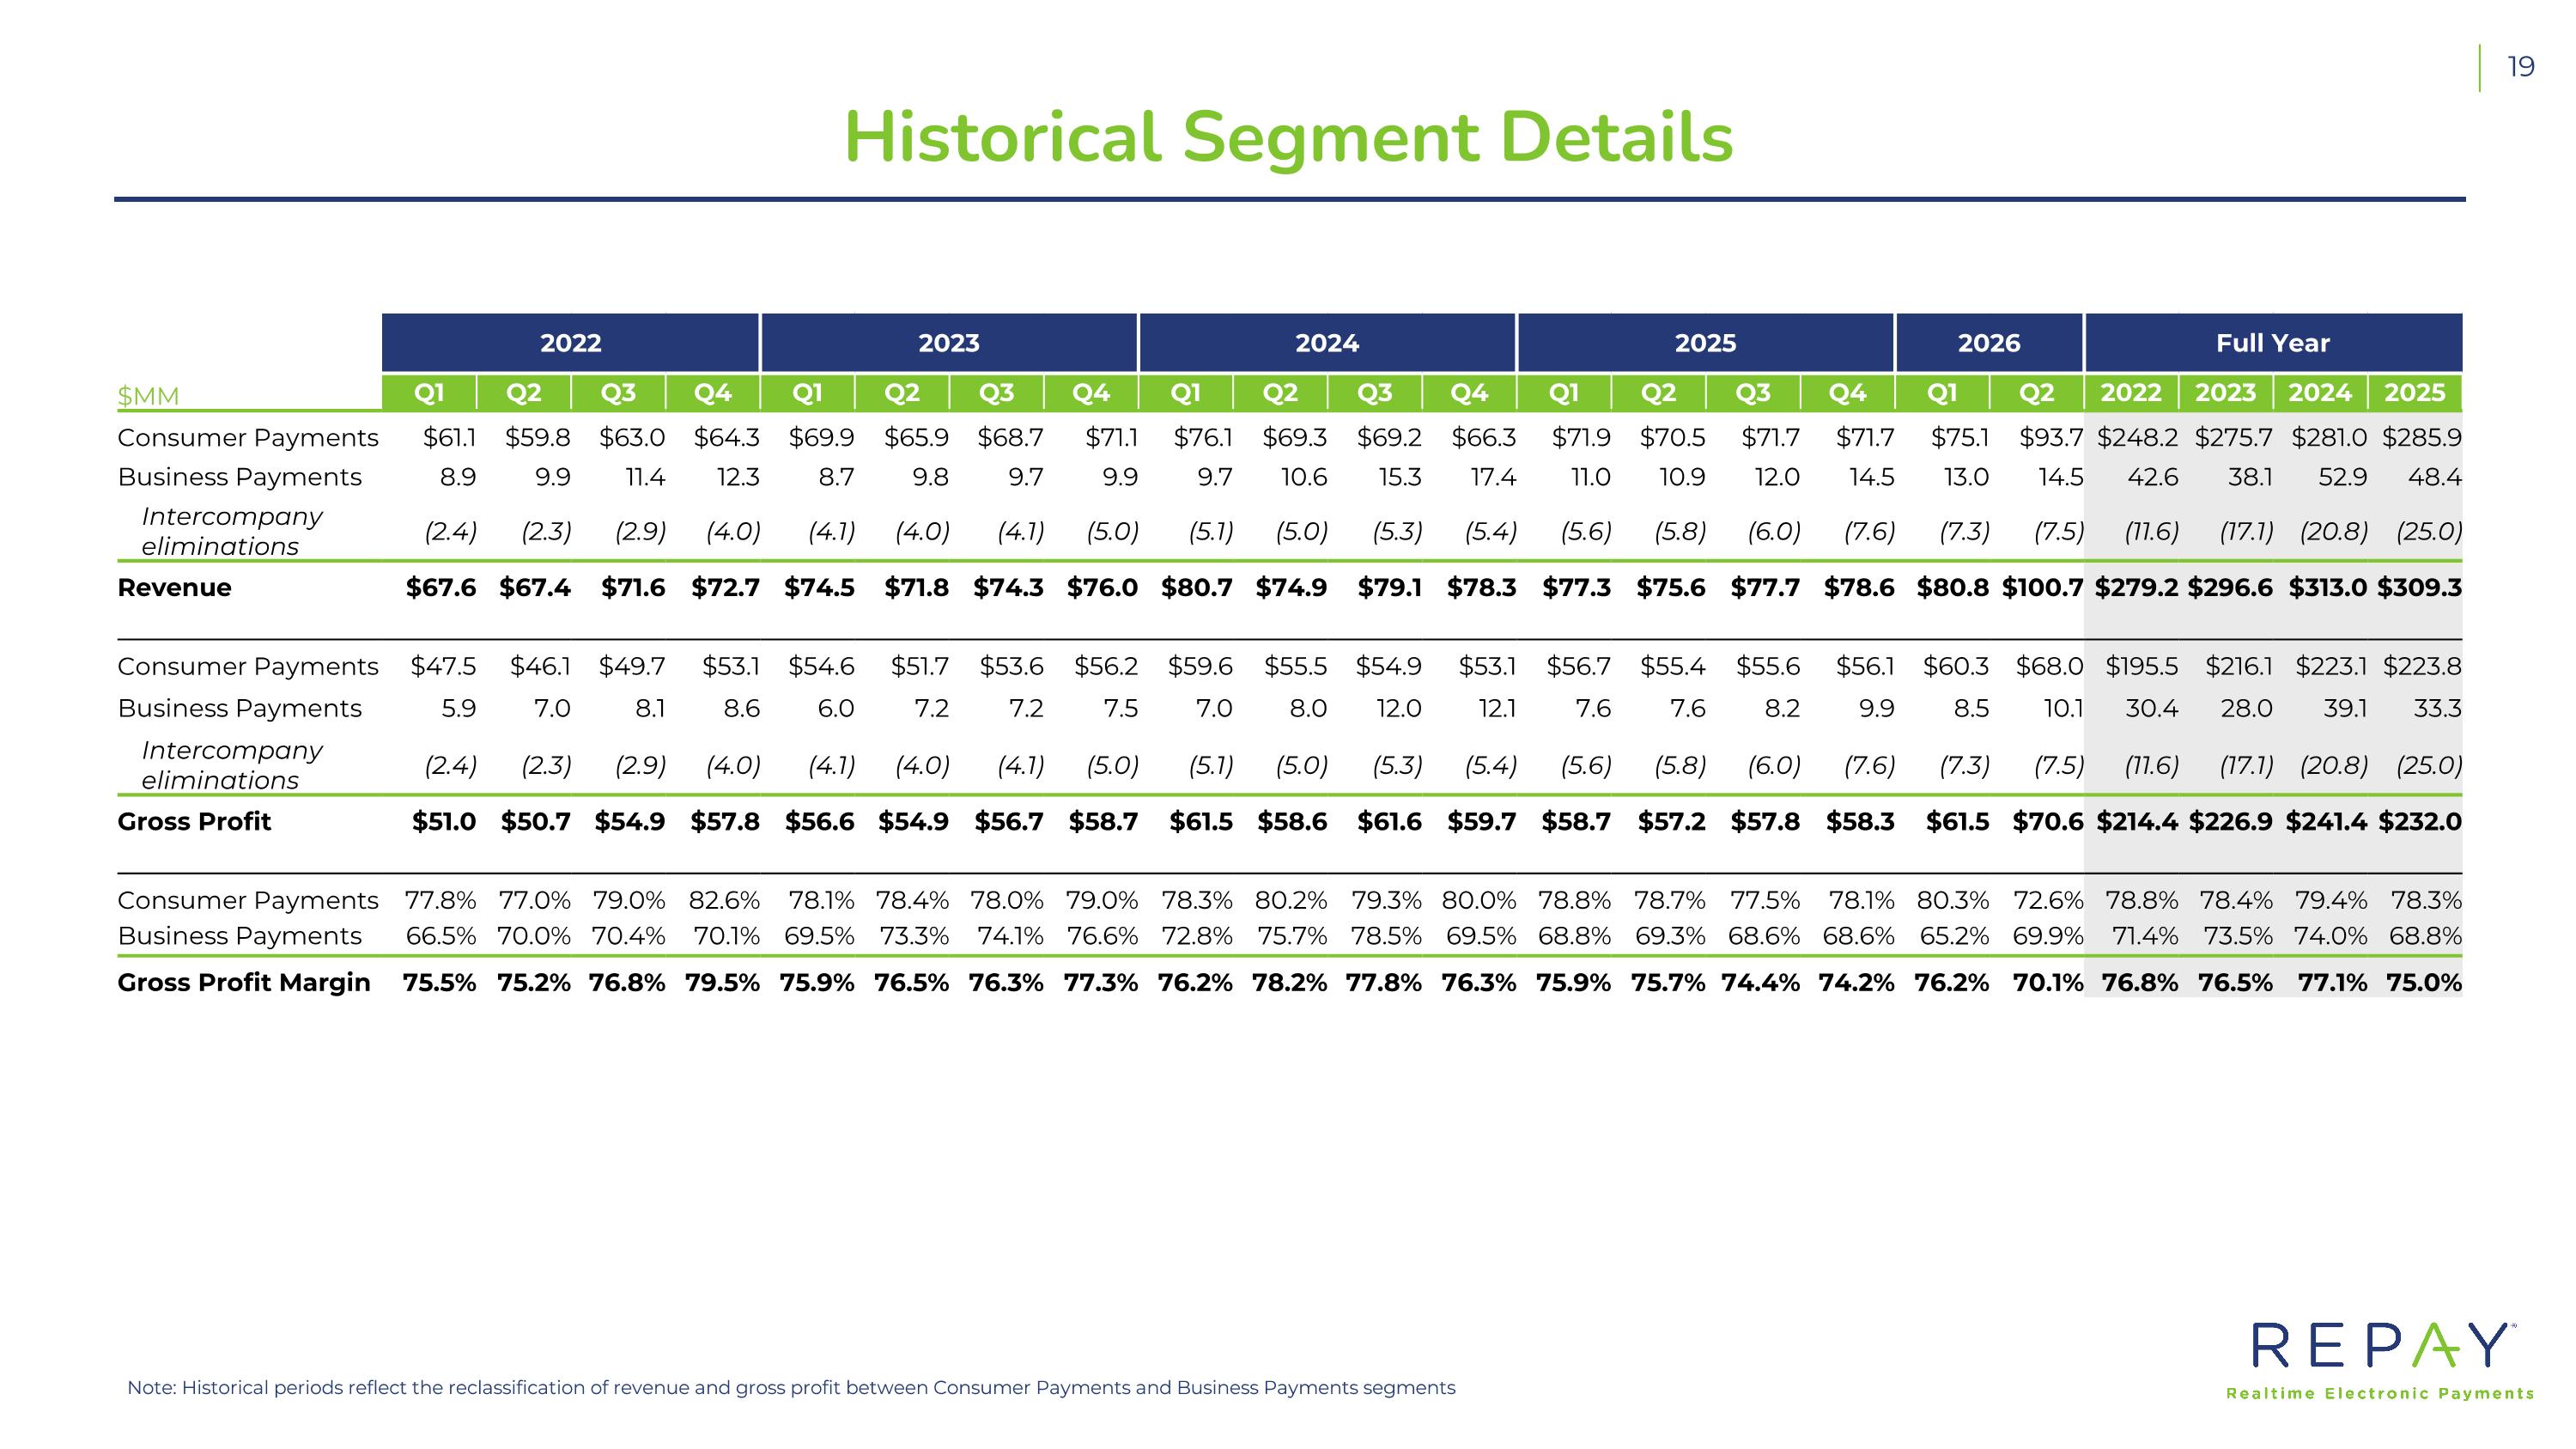
Historical Segment Details Note: Historical periods reflect the reclassification of revenue and gross profit between Consumer Payments and Business Payments segments 2022 2023 2024 2025 2026 Full Year $MM Q1 Q2 Q3 Q4 Q1 Q2 Q3 Q4 Q1 Q2 Q3 Q4 Q1 Q2 Q3 Q4 Q1 Q2 2022 2023 2024 2025 Consumer Payments $61.1 $59.8 $63.0 $64.3 $69.9 $65.9 $68.7 $71.1 $76.1 $69.3 $69.2 $66.3 $71.9 $70.5 $71.7 $71.7 $75.1 $93.7 $248.2 $275.7 $281.0 $285.9 Business Payments 8.9 9.9 11.4 12.3 8.7 9.8 9.7 9.9 9.7 10.6 15.3 17.4 11.0 10.9 12.0 14.5 13.0 14.5 42.6 38.1 52.9 48.4 Intercompany eliminations (2.4) (2.3) (2.9) (4.0) (4.1) (4.0) (4.1) (5.0) (5.1) (5.0) (5.3) (5.4) (5.6) (5.8) (6.0) (7.6) (7.3) (7.5) (11.6) (17.1) (20.8) (25.0) Revenue $67.6 $67.4 $71.6 $72.7 $74.5 $71.8 $74.3 $76.0 $80.7 $74.9 $79.1 $78.3 $77.3 $75.6 $77.7 $78.6 $80.8 $100.7 $279.2 $296.6 $313.0 $309.3 Consumer Payments $47.5 $46.1 $49.7 $53.1 $54.6 $51.7 $53.6 $56.2 $59.6 $55.5 $54.9 $53.1 $56.7 $55.4 $55.6 $56.1 $60.3 $68.0 $195.5 $216.1 $223.1 $223.8 Business Payments 5.9 7.0 8.1 8.6 6.0 7.2 7.2 7.5 7.0 8.0 12.0 12.1 7.6 7.6 8.2 9.9 8.5 10.1 30.4 28.0 39.1 33.3 Intercompany eliminations (2.4) (2.3) (2.9) (4.0) (4.1) (4.0) (4.1) (5.0) (5.1) (5.0) (5.3) (5.4) (5.6) (5.8) (6.0) (7.6) (7.3) (7.5) (11.6) (17.1) (20.8) (25.0) Gross Profit $51.0 $50.7 $54.9 $57.8 $56.6 $54.9 $56.7 $58.7 $61.5 $58.6 $61.6 $59.7 $58.7 $57.2 $57.8 $58.3 $61.5 $70.6 $214.4 $226.9 $241.4 $232.0 Consumer Payments 77.8% 77.0% 79.0% 82.6% 78.1% 78.4% 78.0% 79.0% 78.3% 80.2% 79.3% 80.0% 78.8% 78.7% 77.5% 78.1% 80.3% 72.6% 78.8% 78.4% 79.4% 78.3% Business Payments 66.5% 70.0% 70.4% 70.1% 69.5% 73.3% 74.1% 76.6% 72.8% 75.7% 78.5% 69.5% 68.8% 69.3% 68.6% 68.6% 65.2% 69.9% 71.4% 73.5% 74.0% 68.8% Gross Profit Margin 75.5% 75.2% 76.8% 79.5% 75.9% 76.5% 76.3% 77.3% 76.2% 78.2% 77.8% 76.3% 75.9% 75.7% 74.4% 74.2% 76.2% 70.1% 76.8% 76.5% 77.1% 75.0%