ADDITIONAL INFORMATION
This contains important information about the Fund for the period December 1, 2025 to May 31, 2026, as well as certain changes to the Fund.
You can find additional information about the Fund at www.ParvinFunds.com. You can also request this information by contacting the Fund at 1-866-458-4744.
EXPENSE INFORMATION
What were the Fund costs for the past six months?
(based on a hypothetical $10,000 investment)
| Fund Name | Costs of a $10,000 investment | Costs paid as a percentage of a $10,000 investment |
| Parvin Hedged Equity Solari World Fund | $116 | 2.25% |
MANAGEMENT DISCUSSION
Fund Shareholders:
The first half of the fiscal year could be characterized as seesaw performance. The rising phase occurred during the first three months. Fund returns reached 18.13% through the end of February compared to 5.44% for the All Country World Index (ACWI) benchmark. Performance for the Fund was driven by extraordinary returns in precious metals miners and significant returns in communication services, industrials and energy.
The declining phase began on Saturday, 2/28, when the U.S. and Israel attacked Iran and started a conflict that continues today. Equities generally traded down in March, but tech and industrial stocks with AI exposure moved higher in April and May. Investors appear to be using large-cap tech stocks as defensive positions under the belief that those earnings will continue to grow with the build-out of AI data centers. Without direct AI exposure, Fund shares retreated in the last three months of the first half. Returns ended at 6.05% over the full period while ACWI benchmark returns increased to 13.56% for all six months.
As the U.S. attempts to reposition from global free trade toward more self-sufficient mercantilism, it has focused on enforcing the dollar-based financial system to protect the U.S. currency’s reserve status. Foreign policy seems directed at keeping oil priced in dollars. To help ensure their independence, other nations are turning away from U.S. Treasuries as reserve assets and emphasizing real assets, which have begun taking a more prominent role. Gold is now the most widely held reserve asset among central banks, especially in emerging markets.
The Sub-Adviser holds the opinion that monetary metals and other real assets will continue trending in the direction of higher prices, and the Fund is positioned accordingly. Ongoing inflation, supply chain disruptions, and geopolitical conflicts support further appreciation in precious metals as well as other hard assets and agricultural commodities.
The Fund combines screening with an alternative, or hedged, portfolio strategy. To the Adviser’s knowledge, there are no directly comparable funds. The Adviser believes the Fund represents a unique opportunity for three reasons: 1) an investment screen driven primarily by a focus on governance and transparency; 2) a more cautious stock selection approach, guided by profitability and value, to identify individual equities that should generally meet a growth and income objective; and 3) a hedged strategy adding index and sector put options that should help preserve capital during precipitous drawdowns.
J. Steven Smith, Managing Director
Parvin Fund Management, LLC
PERFORMANCE GRAPH
Total Returns for the Period Ended May 31, 2026
| Fund/Index |
One Year |
Annualized Since Inception* | Value |
| Parvin Hedged Equity Solari World Fund | 15.02% | 3.68% | $12,160 |
| MSCI All Country World Index | 30.83% | 13.21% | $19,553 |
Cumulative Performance Comparison of $10,000 Investment Since Inception
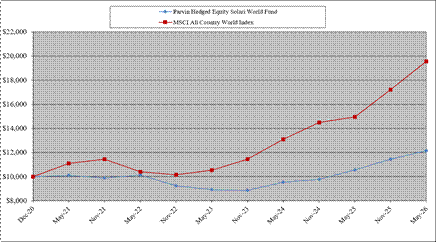
* Inception December 31, 2020
Past performance is not a good predictor of future performance. The graph and table shown do not reflect taxes that a shareholder would pay on Fund distributions or on the redemption of Fund shares. Updated performance data current to the most recent month-end can be obtained by calling 1-866-458-4744.
FUND STATISTICS
|
Net Assets |
Portfolio Holdings |
Portfolio Turnover |
Advisory Fees |
| $13.4 Million | 36 | 7.93% | $76,918 |
PORTFOLIO ILLUSTRATION
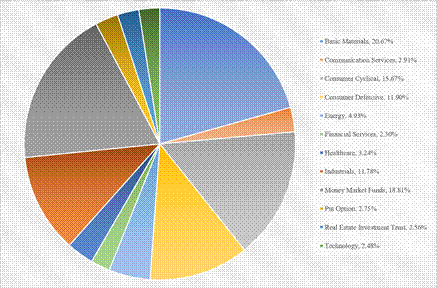
The following chart gives a breakdown of the Fund’s portfolio of investments as of May 31, 2026. Sectors are based on Morningstar® classifications.
GEOGRAPHIC BREAKDOWN
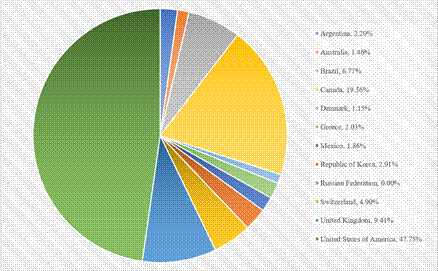
The following chart gives a breakdown of the Fund’s portfolio by country of issuer as of May 31, 2026.
TOP TEN HOLDINGS (% OF NET ASSETS)
| 1. | Fidelity Institutional Money Market Treasury Portfolio - Class III | 18.87% |
| 2. | Silvercorp Metals, Inc. (Canada) | 4.72% |
| 3. | Hecla Mining Co. | 3.97% |
| 4. | Agnico Eagle Mines Ltd. (Canada) | 3.41% |
| 5. | OR Royalties, Inc. (Canada) | 3.17% |
| 6. | Endeavour Silver Corp. (Canada) | 2.97% |
| 7. | SK Telecom Co. Ltd. ADR | 2.92% |
| 8. | Canadian National Railway Co. | 2.87% |
| 9. | Swatch Group AG ADR | 2.82% |
| 10. | Sturm, Ruger & Co., Inc. | 2.76% |
| Total % of Net Assets | 48.48% |
MATERIAL FUND CHANGES
Effective May 12, 2026, the Board appointed Bob Anastasi as Treasurer, Secretary and Chief Compliance Officer of the Trust and approved Hanover Fund Administration, LLC (“Handover”) to provide administrator and compliance services to the Trust.