Exhibit 99.3


H1 2026

MANAGEMENT’S DISCUSSION AND ANALYSIS OF FINANCIAL CONDITION AND RESULTS OF OPERATIONS

As of June 30, 2026 and for the six-month period then ended

Special note regarding forward-looking statements
 
Certain information included herein may be deemed to be “forward-looking statements.” Forward-looking statements are often characterized by the use of forward-looking terminology such as “may,” “might,” “will,” “could,” “would,” “should,” “expect,” “plan,” “anticipate,” “intend,” “seek,” “believe,” “estimate,” “predict,” “potential,” “continue,” “contemplate,” “possible,” or the negative of these terms or similar expressions, but are not the only way these statements are identified.
 
We have based these forward-looking statements largely on our current expectations and projections about future events and financial trends that we believe may affect our business, financial condition and results of operations. Forward-looking statements involve known and unknown risks, uncertainties and other important factors that may cause our actual results, performance or achievements to be materially different from any future results, performance or achievements expressed or implied by the forward-looking statements, including, but not limited to:
 

our ability to effectively manage the scope and complexity of our business following years of rapid growth, increasing operating expenses and our ability to maintain profitability;
 

foreign currency exchange rate fluctuations;
 

the fact that we continue to derive a majority of revenues from monday work management;
 

fluctuations in operating results;
 

real or perceived errors, failures, vulnerabilities or bugs in our platform, products, or third-party applications offered on our app marketplace or interruptions or performance problems associated with the technology or infrastructure underlying our platform;
 

risks related to artificial intelligence (“AI”) and machine learning (“ML”);
 

our ability to attract customers, grow our retention rates, expand usage within organizations, including cross-selling and upselling and sell subscription plans;
 

risks related to our subscription-based business model;
 

our sales efforts may require considerable time and expense and the use of differing sales strategies may extend our sales cycles;
 

changes in sizes or types of business that purchase our platform and products;
 

our ability to offer high-quality customer support and direct sales capabilities;
 

that our restructuring plan may not achieve the expected benefits or that the costs may exceed our expectations;
 

maintenance of corporate culture;


H1 2026
 

risks related to international operations and compliance with laws and regulations applicable to our global operations;
 

risks related to acquisitions, strategic investments, partnerships, or alliances;
 

risks associated with scrutiny related to environmental and social matters;
 

our dependence on founders and other key employees and ability to attract and retain highly skilled employees;
 

our ability to raise additional capital or generate cash flows necessary to expand our operations and invest in new technologies;
 

uncertain global economic conditions and inflation;
 

changes and competition in the market and software categories in which we participate;
 

our ability to introduce new products, features, integrations, capabilities, and enhancements;
 

the ability of our platform to interoperate with a variety of software applications;
 

our reliance on third-party application stores to distribute our mobile application;
 

our successful strategic relationships with, and our dependence on third parties;
 

our reliance on web search engines, both traditional and AI-generated, to direct traffic to our website;
 

interruption or delays in service from third parties or our inability to plan and manage interruptions;
 

risks related to security incidents and unauthorized access to our or our third-party vendors’ systems, networks or data or the data of users and organizations on our platform;
 

evolving privacy protection and data security laws, regulations, industry standards, policies, contractual obligations, and cross-border data transfer or localization restrictions;
 

new legislation and regulatory obligations regulating AI;
 

changes in tax law and regulations or if we were to be classified as a passive foreign investment company;
 

our ability to realize deferred tax assets or requirements to collect sales or other indirect taxes;
 

our ability to maintain, protect or enforce our intellectual property rights or risks related to intellectual property infringement claims;
 

risks related to our use of open-source software;
 

risks related to our founder share that provides certain veto rights;
 

risks related to our status as a foreign private issuer incorporated and located in Israel, including risks related to conflicts in the region and escalations thereof;
 

our expectation not to pay dividends for the foreseeable future;
 

risks related to our repurchase program, including an inability to guarantee the amount of repurchases of our ordinary shares that will occur, if any, or that our repurchase program will enhance long-term shareholder value;

H1 2026
  

risks related to our Digital Lift Initiative and the monday.com Foundation; and
 

risks related to legal and regulatory matters.
 
You should not rely upon forward-looking statements as predictions of future events. Although we believe that the expectations reflected in the forward-looking statements are reasonable, we cannot guarantee that future results, levels of activity, performance and events and circumstances reflected in the forward-looking statements will be achieved or will occur. The estimates and forward-looking statements contained herein speak only as of the date thereof. Except as required by applicable law, we undertake no obligation to publicly update or revise any estimates or forward-looking statements whether as a result of new information, future events or otherwise, or to reflect the occurrence of unanticipated events.

The foregoing list is intended to identify only certain of the principal factors that could cause actual results to differ. For a more detailed description of the risks and uncertainties affecting our company, reference is made to our Annual Report on Form 20-F for the year ended December 31, 2025, which was filed with the Securities and Exchange Commission, or the SEC, on March 13, 2026 (hereafter: “Annual Report”), and the other risk factors discussed from time to time by our company in reports filed or furnished to the SEC.

Introduction
 
Unless indicated otherwise by the context, all references in this report to “monday.com,” “we,” “us” or “our” are to monday.com Ltd. When the following terms and abbreviations appear in the text of this report, they have the meanings indicated below:
 
 
“dollars” or “$” means United States dollars; and
 
 
“NIS” means New Israeli Shekels.
 
You should read the following discussion and analysis in conjunction with our unaudited condensed consolidated financial statements for the six months ended June 30, 2026 and notes thereto, and together with our audited consolidated financial statements for the year ended December 31, 2025 and notes thereto filed with the SEC as part of our Annual Report.
 
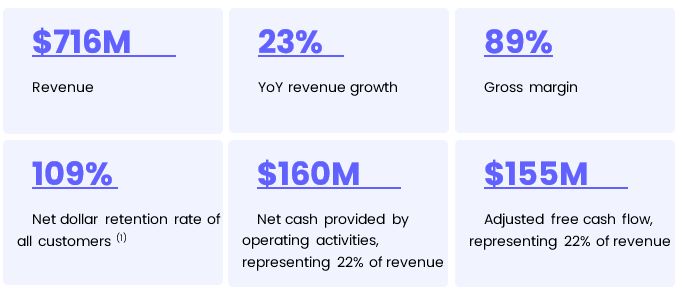
monday.com H1-26 overview in numbers

  
(1)   For a definition of Net Dollar Retention Rate see “Key Business Metrics” below.

H1 2026
 
Growth at scale
 
We have experienced rapid growth since we launched our product in 2014.
 

Revenue: Our revenue was $715.9 million and $581.3 million for the six months ended June 30, 2026 and June 30, 2025, respectively.
 

Year over Year Revenue Growth: Our revenue growth was 23% and 28% for the six months ended June 30 2026, and June 30, 2025, respectively.
 

Net Income: Our net income was $31.5 million and $29.0 million for the six months ended June 30, 2026 and June 30, 2025, respectively.
 

Net Cash Provided by Operating Activities: Our net cash provided by operating activities was $160.0 million and $178.8 million for the six months ended June 30, 2026 and June 30, 2025, respectively.
 

Adjusted Free Cash Flow: Our adjusted free cash flow was $155.1 million and $173.6 million for the six months ended June 30, 2026 and June 30, 2025, respectively.
 
Key Business Metrics
 
We believe that our growth and financial performance are dependent upon many factors, including the key factors described below.
 
A Large and Diversified Customer Base
 
We are focused on expanding within our existing customer base by increasing the number of users within the organization, upgrading to higher tiers and offering additional add-on services and products, including our AI-powered capabilities. Our operating results and growth opportunities depend, in part, on our ability to expand relationships with existing customers and attract new larger customers. We believe we have significant greenfield opportunities among addressable customers worldwide and we will continue to invest in our research and development to differentiate our products and AI offerings from competitive products and services. We will also continue to invest in our sales and marketing to help us take advantage of this opportunity.
  
We define “customer” to mean a unique web domain-based account that is on a paid subscription plan, which could include an organization, educational or government institution, or distinct business unit of an organization. With approximately 250,000 customers, we are not reliant on any specific customer, as no single customer accounts for more than 1% of our revenues, and our top 100 customers accounted for less than 10% of our revenues for the six months ended June 30, 2026 and 2025.

H1 2026
 
Consistent Growth of Enterprise Customers
 
Our ability to successfully move upmarket is demonstrated by the consistent growth in the number of our enterprise customers. We grew the number of enterprise customers, which we define as customers with more than $50,000 in Annual Recurring Revenue (“ARR”) (defined below), on our platform by 31% from 3,702 customers as of June 30, 2025 to 4,834 customers as of June 30, 2026. The ARR from such enterprise customers grew by 37% from June 30, 2025 to June 30, 2026, outpacing our overall ARR growth. As of June 30, 2026 and June 30, 2025, such enterprise customers accounted for 43% and 38% of our ARR, respectively. In addition, such enterprise customers are significantly more likely to adopt multiple products of ours.
 
Customers with more than $100,000 in ARR grew by 37% during the 12 months ended on June 30, 2026, from 1,472 customers as of June 30, 2025 to 2,019 customers as of June 30, 2026. The ARR from such enterprise customers grew by 43% from June 30, 2025 to June 30, 2026. As of June 30, 2026 and June 30, 2025, such enterprise customers accounted for 30% and 26% of our ARR, respectively.
 
Customers with more than $500,000 in ARR grew by 68% during the 12 months ended on June 30, 2026, from 68 customers as of June 30, 2025 to 114 customers as of June 30, 2026. The ARR from such enterprise customers grew by 66% from June 30, 2025 to June 30, 2026. As of June 30, 2026, and June 30, 2025, such enterprise customers accounted for 7% and 5% of our ARR, respectively. “Annual Recurring Revenue” or “ARR” is defined to mean, as of the measurement date, the annualized value of our customer subscriptions plan, assuming that any contract that expires during the next 12 months is renewed on its existing terms. We believe ARR illustrates the improvements we have made to our products to increase the value we deliver to our customers over time. We expect the percentage of ARR attributable to customers with more than $50,000, $100,000 and $500,000 in ARR to increase.
 
Net Dollar Retention Rate
 
We expect to derive a significant portion of our revenue growth from expansion within our customer base, where we have an opportunity to expand adoption of our products across teams, departments, and organizations. We believe our dollar-based net retention rate (“Net Dollar Retention Rate”) underscores the significant opportunity to further expand within our customer base, particularly those that generate high annual revenue. We calculate Net Dollar Retention Rate as of a period end by starting with the ARR from customers as of the 12 months prior to such period end (“Prior Period ARR”). We then calculate the ARR from these customers as of the current period end (“Current Period ARR”). The calculation of Current Period ARR includes any upsells, contraction and attrition. We then divide the total Current Period ARR by the total Prior Period ARR to arrive at the Net Dollar Retention Rate. For the trailing 12-month calculation, we take a weighted average of this calculation of our quarterly Net Dollar Retention Rate for the four quarters ending with the most recent quarter.
 
Our Net Dollar Retention Rate may fluctuate due to a number of factors, including the level of penetration within our customer base, expansion of products and features, the introduction of new offerings, pricing adjustments or changes in packaging, and our ability to retain our customers.

H1 2026
 
Our Net Dollar Retention Rate for all of our customers was 109% and 111% for the three months ended June 30, 2026 and June 30, 2025, respectively. Net Dollar Retention Rate for customers with more than $50,000 in ARR was 115% and 116% for the three months ended June 30, 2026 and June 30, 2025, respectively. Net Dollar Retention Rate for customers with more than $100,000 in ARR was 115% and 117% for the three months ended June 30, 2026 and June 30, 2025, respectively. Our Net Dollar Retention Rate for the three months ended June 30, 2026 reflects continued seat and product expansion within our existing customer base, partially offset by the anniversary of pricing adjustments implemented during 2024 and the first half of 2025. The decline in Net Dollar Retention Rate compared to the prior year period is primarily attributable to the lapping of those pricing adjustments, which had a favorable impact on the comparable period.

A.
Operating Results
 
Components of Results of Operations
 
The following briefly describes the components of revenue and expenses as presented in our consolidated statements of operations.
 
Revenue
 
We derive revenue mainly from monthly or annual subscription agreements with our customers for access to our AI Work Platform and products. Our customers do not have the ability to take possession of our software.
 
Cost of Revenue
 
Cost of revenue consists of merchant and credit card processing fees, hosting and cloud infrastructure fees (including costs associated with AI compute, model usage and data processing), amortization of capitalized software development costs, subcontractor costs, salaries and related expenses, share-based compensation, software license fees, and allocated overhead costs.
 
Gross Profit and Gross Margin
 
Gross profit, or revenue less cost of revenue, and gross margin, or gross profit as a percentage of revenue, has been, and will continue to be, affected by various factors, including the timing of our acquisition of new customers, renewals of and follow-on sales to existing customers, costs associated with operating our cloud-based products, and the extent to which we expand our operations and customer support organizations. As adoption of our AI-powered offerings increases, we expect associated infrastructure and compute costs to increase. As a result, we expect our gross margin to decline modestly in the mid-term, before stabilizing over the long term as we drive efficiencies and scale.
 
Operating Expenses
 
Our operating expenses consist of research and development, sales and marketing, general and administrative expenses, and restructuring charges. Sales and marketing expenses are the most significant component of our operating expenses and consist of marketing and advertising expenses and commissions paid. In addition, personnel-related expenses are a substantial component of our operating expenses and consist of salaries, benefits, and share-based compensation expenses. Operating expenses also include an allocation of overhead costs for facilities and shared IT-related expenses, including depreciation expenses.

H1 2026
 
Research and Development Expenses
 
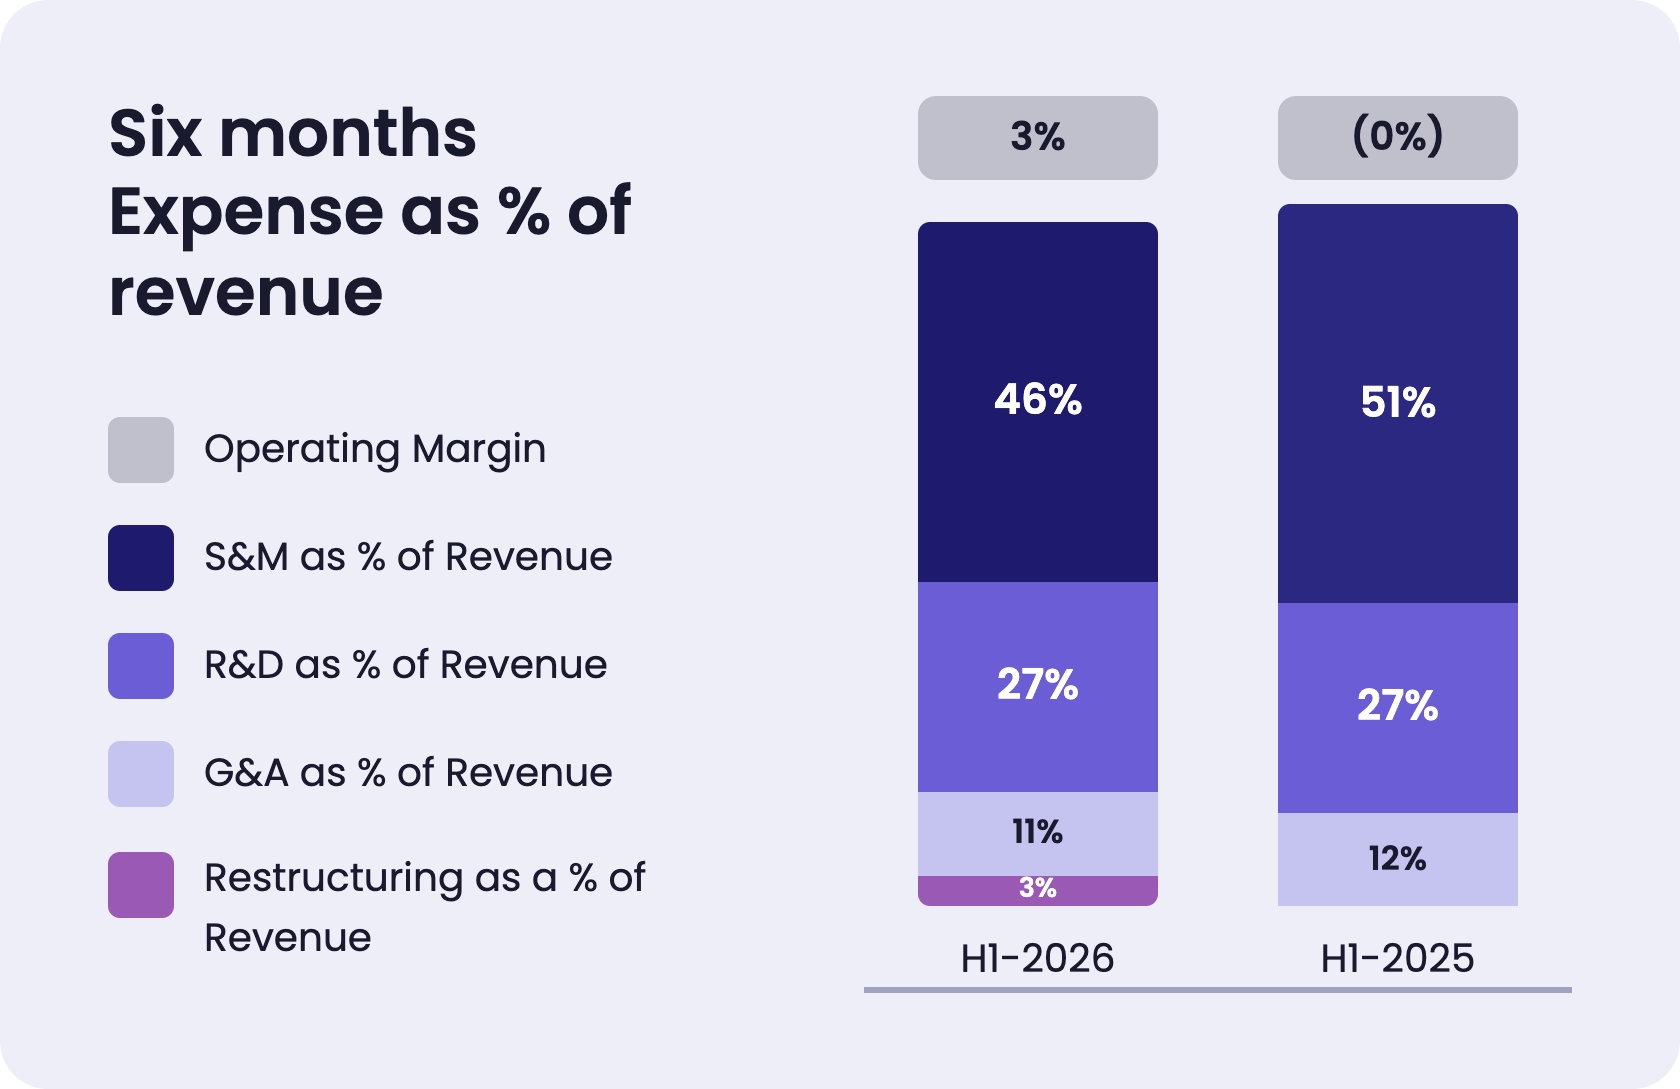
Research and development expenses include salaries and related expenses, share-based compensation, subcontractor costs and allocated overhead costs. As we continue to focus our research and development efforts on enhancing our AI Work Platform, expanding our AI-powered capabilities, and building new products, we expect our research and development expenses to contribute to our long-term growth. For each of the six months ended June 30, 2026 and June 30, 2025, our research and development expenses as a percentage of revenue were approximately 27%.
 
We expect full year 2026 research and development expenses to decline as a percentage of revenue compared to the first half of 2026, to the low-20s as a percentage of revenue, as savings from the 2026 restructuring plan (the “Plan”) and newly enacted Israeli research and development tax benefits (“The Encouragement and Incentivization of Research and Development Law, 5786-2026”) are realized in the second half of the year.
 
In the long term, as we continue to invest in our AI Work Platform and expand our product capabilities, we anticipate research and development expenses as a percentage of revenue will remain in the low-20s.
 
Sales and Marketing Expenses
 
Sales and marketing expenses consist primarily of compensation expenses for our employees, including share-based compensation, online and offline marketing and advertising expenses, commissions, and allocated overhead costs. Our sales related commissions as a percentage of revenue were approximately 2% for each of the six months ended June 30, 2026 and June 30, 2025. For the six months ended June 30, 2026 and June 30, 2025, our sales and marketing expenses as a percentage of revenue were approximately 46% and 51%, respectively.
 
As part of our ongoing go-to-market evolution, we are increasingly allocating resources toward enterprise sales efforts, including expanding our direct sales capacity and brand marketing initiatives. This has included rebalancing investments away from certain online marketing channels toward initiatives that we believe support long-term customer relationships and higher value contracts.
 
We expect full year 2026 sales and marketing expenses to remain broadly stable as a percentage of revenue as continued investment in go-to-market initiatives is largely offset by cost savings from the Plan. In the long term, as our business scales through customer expansion, market awareness, and the operational efficiencies expected from our AI-driven operating model, we anticipate a slight decline in sales and marketing expenses as a percentage of revenue from current levels.
 
General and Administrative Expenses
 
General and administrative expenses consist of salaries and related expenses, share-based compensation, charitable contributions to the monday.com Foundation, professional service fees and allocated overhead costs. For the six months ended June 30, 2026 and June 30, 2025, our general and administrative expenses as a percentage of revenue were approximately 11% and 12%, respectively.

H1 2026
 
We expect full year 2026 general and administrative expenses to increase in absolute dollar terms and as a percentage of revenue compared to the first half of 2026, primarily due to a non-cash contribution of 196,829 ordinary shares to the monday.com Foundation, to be recognized at the fair value of the shares on August 5, 2026 of approximately $18.0 million.
 
This donation is made pursuant to the Company's intention, disclosed since its initial public offering, to contribute up to 10% of its equity to the monday.com Foundation over a ten-year period to support social impact initiatives. The timing and size of individual contributions are episodic and will vary based on the share price at the time of contribution. This charge will be excluded from non-GAAP general and administrative expenses and non-GAAP operating income.
 
In the long term, excluding the impact of non-cash charitable contributions to the monday.com Foundation, we expect general and administrative expenses as a percentage of total revenue to remain broadly stable, reflecting operating leverage as our business scales.
 
Restructuring Charges
 
Restructuring charges represent costs associated with our Plan, announced on July 22, 2026 to align our organizational structure with our strategic focus on the AI Work Platform and support a leaner, more focused operating model. Charges recognized in the six months ended June 30, 2026 consist of non-cash impairment charges related to an operating lease right-of-use asset, leasehold improvements, and other fixed assets for office space in Israel originally secured to support planned workforce expansion.
 
The non-cash impairment charges discussed above were recognized based on a decision made during the second quarter of 2026, prior to and independent of the board of directors’ (the “Board”) approval of the Plan, to vacate a specific office space in Israel. These charges are presented as restructuring charges in our consolidated statement of operations for the six months ended June 30, 2026 because they reflect the same shift toward a leaner, AI-focused operating model that the Plan later formalized, notwithstanding that the facility decision was made and executed independently of the Plan's approval.
 
The Plan also includes a reduction of approximately 20% of our current workforce, a majority of which is not in customer-facing roles; the Company expects to continue hiring in key strategic areas throughout 2026. For the six months ended June 30, 2026 and June 30, 2025, restructuring charges as a percentage of revenue were approximately 3% and 0%, respectively.
 
We estimate total net charges under the Plan of approximately $45–55 million for the full year 2026, consisting of approximately $30–35 million of future net charges related to severance payments, employee benefits and related costs, and approximately $30–35 million in charges related to the impairment of certain office spaces, partially offset by approximately $15 million in non-cash credits related to the forfeiture of unvested share-based compensation awards by departing employees. 
 
The majority of these charges are expected to be recognized in the second half of 2026, with a portion of up to approximately $5 million potentially recognized in the first quarter of 2027 depending on the timing of execution of certain elements of the Plan. The Plan is expected to be substantially complete by the end of 2026. We do not expect to incur material restructuring charges after the first quarter of 2027.

H1 2026
 
Financial Income, Net
 
Financial income, net, consists primarily of interest generated by our money market funds, bank deposits and marketable securities, amortization of discount on marketable securities and foreign exchange gains and losses, offset by bank charges and interest expenses.
 
Income Tax Expenses
 
Income tax expenses consist of current taxes, including those related to our international activities, and deferred taxes arising from temporary differences between the accounting and tax bases of assets and liabilities.

Comparison of Period-to-Period Results of Operations


The following tables set forth the consolidated statements of operations in U.S. dollars and as a percentage of revenue for the period presented.
 
   
Six months ended June 30,
 
   
2026
   
2025
 
   
(in thousands)
 
Revenue
 
$
715,886
   
$
581,264
 
Cost of revenue (1)
   
80,785
     
59,978
 
Gross profit
   
635,101
     
521,286
 
Operating expenses:
               
Research and development (1)
   
191,327
     
156,424
 
Sales and marketing (1)
   
327,797
     
294,310
 
General and administrative (1)
   
76,331
     
72,307
 
Restructuring charges
   
21,436
     
-
 
Total operating expenses
   
616,891
     
523,041
 
Operating income (loss)
   
18,210
     
(1,755
)
Financial income, net
   
17,336
     
31,749
 
Income before income taxes
   
35,546
     
29,994
 
Income tax expenses
   
(4,052
)
   
(996
)
Net income
 
$
31,494
   
$
28,998


H1 2026

(1)          Includes share-based compensation expense as follows:

   
Six months ended June 30,
 
   
2026
   
2025
 
   
(in thousands)
 
Cost of revenue
 
$
3,311
   
$
3,406
 
Research and development
   
29,911
     
43,347
 
Sales and marketing
   
20,172
     
19,205
 
General and administrative
   
17,107
     
21,645
 
Total share-based compensation
 
$
70,501
   
$
87,603


Six months ended June 30, (*)
 
   
2026
   
2025
 
Revenue
   
100
%
   
100
%
Cost of revenue
   
11
     
10
 
Gross profit
   
89
     
90
 
Operating Expenses:
               
Research and development
   
27
     
27
 
Sales and marketing
   
46
     
51
 
General and administrative
   
11
     
12
 
Restructuring charges
   
3
     
-
 
Total operating expenses
   
87
     
90
 
Operating income (loss)
    2      
(-
)
Financial income, net
   
2
     
5
 
Income before income taxes
   
5
     
5
 
Income tax expenses
   
(1
)
   
(-
)
Net income
   
4
%
   
5
%
  
(*) Amounts may not sum to 100% due to rounding
 
Comparison of the Six Months Ended June 30, 2026 and 2025
 
Revenue

   
Six months ended June 30,
             
   
2026
   
2025
   
Change
   
%
 
   
(in thousands)
       
Revenue
 
$
715,886
   
$
581,264
   
$
134,622
     
23
%
 
Revenue was $715.9 million for the six months ended June 30, 2026, an increase of $134.6 million, or 23%, compared to $581.3 million for the six months ended June 30, 2025.
 
This increase was driven primarily by a combination of deferred revenue and open sales orders from prior periods' transactions in the amount of $105.7 million and new business activity from the current period of $28.9 million. Specifically, out of the $715.9 million of revenue for the six months ended June 30, 2026, $461.1 million was associated with performance obligations from prior periods and $254.8 million was derived from current period activity, including contract renewals, expansions, and new client acquisitions. The overall growth was driven by: (i) strong retention and renewals, successfully maintaining our core revenue base through consistent contract renewals; (ii) upselling and expansion efforts, including increased seat penetration, multi-product adoption, and broader adoption of AI capabilities, all of which significantly contributed to growth from existing customer transactions; and (iii) new client acquisition, securing new contracts and further expanding our market reach.


H1 2026

Cost of Revenue and Gross Profit

   
Six months ended June 30,
             
   
2026
   
2025
   
Change
   
% change
 
   
(in thousands)
       
Cost of revenue
 
$
80,785
   
$
59,978
   
$
20,807
     
35
%
Gross profit
   
89
%
   
90
%
               
  
Cost of revenue was $80.8 million for the six months ended June 30, 2026, an increase of $20.8 million, or 35%, compared to $60.0 million for the six months ended June 30, 2025. This increase was directly related to the growth and scale of our business and was primarily driven by an increase of $11.2 million in hosting expenses, an increase of $5.4 million in salaries and related expenses, an increase of $2.3 million in third-party consulting costs, an increase of $2.0 million in processing fees, and an increase in allocated overhead costs of $1.0 million as a result of increased overall costs to support our business growth and related infrastructure, partially offset by a decrease in indirect taxes of $1.5 million.
 
Operating Expenses

         
Six months ended June 30,
             
   
2026
   
2025
   
Change
   
%
 
   
(in thousands)
       
Research and development
 
$
191,327
   
$
156,424
   
$
34,903
     
22
%
Sales and marketing
   
327,797
     
294,310
     
33,487
     
11
%
General and administrative
   
76,331
     
72,307
     
4,024
     
6
%
Restructuring charges
   
21,436
     
-
     
21,436
      -
%
Total operating expenses
 
$
616,891
   
$
523,041
   
$
93,850
     
18
%
 
Research and Development Expenses
 
Research and development expenses were $191.3 million for the six months ended June 30, 2026, an increase of $34.9 million, or 22%, compared to $156.4 million for the six months ended June 30, 2025. This increase was directly related to the growth and scale of our business and was primarily driven by an increase of $35.2 million in salaries and related expenses due to an increase in the number of employees, an increase of $6.1 million in allocated overhead costs as a result of increased overall costs to support our business growth and related infrastructure, an increase of $3.6 million in hosting costs, and an increase of $2.5 million in software and security costs, partially offset by a decrease of $13.4 million in share-based compensation expenses associated with a decrease in the share price of our ordinary shares.
 
Sales and Marketing Expenses
 
Sales and marketing expenses were $327.8 million for the six months ended June 30, 2026, an increase of $33.5 million, or 11%, compared to $294.3 million for the six months ended June 30, 2025. This increase was directly related to the growth and scale of our business and was primarily driven by an increase of $22.6 million in salaries and related expenses, an increase of $6.2 million in amortization of partners commission costs, and an increase of $4.4 million in allocated overhead costs to support our business growth and related infrastructure.

H1 2026
 
General and Administrative Expenses
 
General and administrative expenses were $76.3 million for the six months ended June 30, 2026, an increase of $4.0 million, or 6%, compared to $72.3 million for the six months ended June 30, 2025. This increase was directly related to the growth and scale of our business and was primarily driven by an increase of $9.5 million in salaries and related expenses due to an increase in the number of employees, an increase of $1.1 million in depreciation expenses, an increase of $4.5 million in rent and related expenses mainly due to our global office expansion prior to the restructuring, an increase of $2.5 million in software expenses, an increase of $1.4 million in employee benefits, an increase of $0.9 million in property tax, partially offset by a decrease of $11.6 million in overhead allocation and a decrease of $4.5 million in share-based compensation expenses associated with a decrease in the share price of our ordinary shares.
 
Restructuring Charges
 
Restructuring charges were $21.4 million for the six months ended June 30, 2026, compared to nil for the six months ended June 30, 2025. In connection with our Plan announced on July 22, 2026, the Company determined it would vacate leased office space in Israel originally secured to support planned workforce expansion that is no longer required under its revised operating model, reflecting the Company’s adoption of AI-driven productivity tools and a resulting revision to its long-term hiring plans. The charges comprise non-cash impairment of operating lease right-of-use assets, leasehold improvements and other fixed assets. All charges recognized in the six months ended June 30, 2026 are non-cash as of June 30, 2026. The Plan also includes a reduction of approximately 20% of our current workforce; the related severance and employee costs are expected to be recognized in subsequent periods as employees are notified. We exclude restructuring charges from non-GAAP operating income as they are directly attributable to a discrete, defined restructuring plan and are not indicative of our ongoing operating performance. See Note 18 to the condensed consolidated financial statements for further details.
 
Operating Income and Operating Margin
 
GAAP operating income was $18.2 million for the six months ended June 30, 2026, representing a GAAP operating margin of approximately 3%, compared to a GAAP operating loss of $1.8 million, or a nominal operating loss of less than 1% of revenue, for the six months ended June 30, 2025. This improvement reflects the continued scaling of our business and operating leverage across our cost structure, partially offset by $21.4 million of restructuring charges recognized in the six months ended June 30, 2026 in connection with Plan.


H1 2026
 
Financial Income, Net

   
Six months ended June 30,
             
   
2026
   
2025
   
Change
   
%
 
   
(in thousands)
       
Financial income, net
 
$
17,337
   
$
31,749
   
$
(14,412
)
   
45
%


Financial income, net, was an income of $17.3 million for the six months ended June 30, 2026, a decrease of $14.4 million, or 45%, compared to an income of $31.7 million for the six months ended June 30, 2025. This decrease was mainly driven by a decrease in our cash and cash equivalents balances in order to finance the repurchase of our ordinary shares ($735 million used  for share repurchases during the six months ended June 30, 2026).
 
Income Tax Expenses

   
Six months ended June 30,
             
   
2026
   
2025
   
Change
   
%
 
   
(in thousands)
       
Income tax expenses
 
$
4,053
   
$
996
   
$
3,057
     
307
%
 
Income tax expenses were $4.1 million for the six months ended June 30, 2026, an increase of $3.1 million, or 307%, compared to $1.0 million for the six months ended June 30, 2025. The increase was primarily attributable to deferred tax expense recognized in the six months ended June 30, 2026 as a result of three factors: (i) the utilization of net operating loss carryforwards against taxable income, reducing deferred tax asset balances recognized following the release of the valuation allowance in the second half of 2025; (ii) the vesting and exercise of share-based awards originally granted at significantly higher prices, resulting in tax deductions at settlement that were lower than the related book compensation expense, and reducing the associated deferred tax asset; and (iii) new share-based awards granted in the six months ended June 30, 2026 at lower grant-date fair values, which will result in smaller deferred tax assets accumulating over their vesting periods relative to prior grant cohorts. No comparable deferred tax expense was recorded in the six months ended June 30, 2025, as the valuation allowance was still in place during that period, and accordingly no deferred tax assets or liabilities were being recognized.
 
Non-GAAP Financial Measures

We regularly review several financial measures, including non-GAAP operating income and adjusted free cash flow, to evaluate our business, measure our performance, identify trends in our business, prepare financial forecasts and make strategic decisions. We believe these non-GAAP financial measures are useful in evaluating our performance in addition to our financial results prepared in accordance with GAAP. You should read these non-GAAP measures in conjunction with our unaudited condensed consolidated financial statements for the six months ended June 30, 2026 and notes thereto, and together with our audited consolidated financial statements for the year ended December 31, 2025 included in our Annual Report.
  
Non-GAAP financial measures have limitations as analytical tools and should not be considered in isolation or as substitutes for financial information presented under GAAP. For example, other companies in our industry may calculate these non-GAAP financial measures differently or may use other measures to evaluate their performance. Investors are encouraged to review the reconciliations of these non-GAAP financial measures to their most directly comparable GAAP financial measures and to not rely on any single financial measure to evaluate our business.

H1 2026
 
The following table sets forth our non-GAAP operating income and adjusted free cash flow for the six months ended June 30, 2026 and June 30, 2025:
 
   
Six months ended June 30,
 
   
2026
   
2025
 
   
(in thousands)
 
Non-GAAP operating income
 
$
110,147
   
$
85,848
 
Adjusted free cash flow
 
$
155,122
   
$
173,625
 
 
Non-GAAP Operating Income
 
We define non-GAAP operating income as GAAP operating income (loss), adjusted for (i) share-based compensation expenses, (ii) restructuring charges, and (iii) non-cash charitable contributions of our ordinary shares to the monday.com Foundation. We exclude these items because we believe they do not reflect our ongoing operational performance and may not be comparable across periods.
 
We exclude share-based compensation because it is a non-cash expense not considered indicative of ongoing operational performance. We exclude restructuring charges because they are directly attributable to a discrete, defined restructuring plan and are not reflective of our core ongoing operating performance.
 
We exclude non-cash charitable contributions to the monday.com Foundation because they are non-cash transfers to a philanthropic entity that do not arise from or relate to our core revenue-generating operations and are not indicative of our ongoing operating performance.
 
Although we intend to contribute up to 10% of the Company’s equity to the monday.com Foundation over a ten-year period as described in our registration statement at the time of our initial public offering, the timing, size, and frequency of individual contributions are irregular and episodic, and the amounts vary significantly based on the share price at the time of each contribution. Accordingly, we do not consider these charges indicative of our period-to-period operational results.
 
Management uses non-GAAP operating income to evaluate our financial performance and for planning and forecasting purposes. Non-GAAP operating income should not be considered as an alternative to GAAP operating income (loss) or net income as an indicator of operating performance.
 
The following table provides a reconciliation of GAAP operating income (loss) to non-GAAP operating income for the periods indicated (*):
 
   
Six months ended June 30,
 
   
2026
   
2025
 
   
(in thousands)
 
Operating income (loss) 
 
$
18,210
   
$
(1,755
)
Share-based compensation expenses
   
70,501
     
87,603
 
Restructuring charges (1)(2)
   
21,436
     
-
 
Non-GAAP operating income
 
$
110,147
   
$
85,848
 
  
 (1)
We expect the non-GAAP restructuring add-back for the full year 2026 to be partially offset by approximately $15 million in credits related to the forfeiture of unvested equity awards by departing employees, which will reduce the total restructuring add-back in the period in which those forfeitures are recognized. 

 (2)
In connection with the Plan, the Company recognized restructuring charges of $21.4 million in the six months ended June 30, 2026, consisting of non-cash impairment charges related to operating lease right-of-use assets, leasehold improvements, and other fixed assets for office space in Israel that was originally secured to support planned workforce expansion.
  
* No charitable contributions of ordinary shares to the monday.com Foundation were made in either period presented

H1 2026
 
Adjusted Free Cash Flow
 
We define adjusted free cash flow as net cash provided by operating activities, less cash used for purchases of property and equipment and capitalized software development costs, plus costs associated with the build-out of our corporate headquarters.
 
We believe that adjusted free cash flow is a useful indicator of liquidity that provides information to management and investors, even if negative, about the amount of cash used in our operations and for investments in property and equipment and capitalized software development costs. However, we caution that adjusted free cash flow does not reflect our future contractual commitments and the total increase or decrease of our cash balance for a given period. The following table provides a reconciliation of net cash provided by operating activities to adjusted free cash flow for the periods indicated:

   
Six months ended June 30,
 
   
2026
   
2025
 
   
(in thousands)
 
Net cash provided by operating activities
 
$
160,041
   
$
178,807
 
Purchase of property and equipment
   
(6,237
)
   
(9,571
)
Capitalized software development costs
   
(1,590
)
   
(1,703
)
Purchase of property and equipment related to build-out of our corporate headquarters (1)
   
2,908
     
6,092
 
Adjusted free cash flow
 
$
155,122
   
$
173,625
 

 (1)
For the six months ended June 30, 2026 includes mainly purchases of property and equipment related to the renovation of an Israeli office space, capitalized in periods prior to the Company’s decision in the second quarter of 2026 to vacate that space in connection with the Plan. The cash outflows reflected in this add-back were incurred before the restructuring decision was made and represent a discrete, non-recurring capital investment. We note that the leasehold improvements capitalized at this location were subsequently impaired as part of the $21.4 million restructuring charge excluded from non-GAAP operating income; however, the adjusted free cash flow add-back and the non-GAAP impairment exclusion represent distinct adjustments — the former reflects actual cash paid in prior periods for a capital project, and the latter reflects a non-cash write-down of the remaining book value. The Company does not expect to incur material capital expenditures of this nature in future periods.
 
B.
Liquidity and Capital Resources
 
As of June 30, 2026, we had $853.4 million in cash and cash equivalents and $219.4 million in short-term investments consisting of marketable securities. In the six months ended June 30, 2026, we generated net cash provided by operating activities, and we have also generated net cash provided by operating activities each year since our initial public offering in June 2021.


H1 2026

Excluding capital raises, our principal sources of funds are from our deferred revenue, which is included in the liabilities section of our consolidated balance sheet. Deferred revenue consists of payments received in advance of revenue recognition, excluding amounts subject to right of return, and is recognized as revenue recognition criteria are met. We generally invoice our customers in advance of services being provided. The majority of our deferred revenue is expected to be recognized as revenue during the succeeding 12-month period, provided all other revenue recognition criteria have been met. As of June 30, 2026, and December 31, 2025, we had deferred revenue of $453.7 million and $411.6 million, respectively. We had an accumulated deficit of $401.8 million and $433.3 million as of June 30, 2026 and December 31, 2025, respectively, reflecting losses from operations in prior periods. Our future capital requirements will depend on many factors, including revenue growth and costs incurred to support customer usage and growth in our customer base, increased research and development expenses to support the growth of our business and related infrastructure, and general and administrative expenses to support being a publicly traded company.
 
We assess our liquidity primarily through our cash on hand as well as the projected timing of billings under contract with our paying customers and related collection cycles. We believe that our current cash and cash equivalents will be sufficient to meet our working capital and capital expenditure requirements for at least the next 12 months and for the foreseeable future.
 
The Company’s material cash requirements include the following contractual obligations:
 
Leases
 
The Company has lease arrangements for offices. As of June 30, 2026, the Company had fixed lease payment obligations of $280.6 million, with $13.2 million payable during the remainder of 2026.
 
Other Purchase Obligations
 
The Company’s other purchase obligations primarily consist of noncancelable obligations related to supplier arrangements, licensed intellectual property, and hosting. As of June 30, 2026, the Company had other purchase obligations of $68.9 million, with $62.9 million payable within 12 months.

H1 2026
 
Share Repurchase Program
 
In addition to its contractual cash requirements, the Company authorized a share repurchase program in September 2025 in the amount of up to $870.0 million with no expiration date. The program does not obligate the Company to acquire a minimum amount of its ordinary shares. As of June 30, 2026, the Company repurchased 10,486,207 of its ordinary shares in the total amount of $870.0 million (9,602,294 during the six months ended June 30, 2026). All repurchases were made using cash resources. As of June 30, 2026, the share repurchase program was fully utilized and no shares are available for future share repurchases under the program.
 
Cancellation of Shares
 
On July 1, 2026, the Company's Board approved the cancellation of 10,875,000 unissued ordinary shares previously reserved under the 2021 share incentive plan. The cancellation has no effect on any outstanding equity awards and involves no cash consideration.
 
monday.com Foundation — Subsequent Contribution
 
In August 2026, the Company donated 196,829 ordinary shares to the monday.com Foundation. The terms of the donation include certain caps on annual sales of the donated shares by the monday.com Foundation. The contribution will be recognized as a non-cash general and administrative expense on the contribution date at the fair value of the shares on August 5, 2026 of approximately $18.0 million. This donation is made pursuant to the Company’s intention, disclosed since its initial public offering, to contribute up to 10% of its equity to the monday.com Foundation over a ten-year period. The Company expects to make additional contributions to the Foundation in future periods; the timing and size of individual contributions are episodic and will vary based on the share price at the time of each contribution. This charge will be excluded from non-GAAP general and administrative expenses and non-GAAP operating income in the third quarter of 2026.
  
Cash Flows
 
The following table presents the summary consolidated cash flow information  for the periods presented:
 
   
Six months ended June 30,
 
   
2026
   
2025
 
   
(in thousands)
 
Net cash provided by operating activities
 
$
160,041
   
$
178,807
 
Net cash used in investing activities
 
$
(88,357
)
 
$
(21,323
)
Net cash provided by (used in) financing activities
 
$
(721,431
)
 
$
21,429
 
 
Operating Activities
 
Cash provided by operating activities for the six months ended June 30, 2026 of $160.0 million was primarily related to our net income of $31.5 million, adjusted for non-cash charges of $98.1 million and net cash inflows of $30.4 million resulting from changes in our operating assets and liabilities. Non-cash charges primarily consisted of share-based compensation of $70.5 million, non-cash restructuring charges of $21.4 million (comprising impairment of operating lease right-of-use assets, leasehold improvements, and other fixed assets in connection with our Plan), depreciation and amortization of property and equipment and amortization of discount and accretion of discount on our marketable securities.
 
The main drivers of the changes in operating assets and liabilities were a $42.1 million increase in deferred revenue reflecting strong billings activity, a $22.8 million increase in accrued expenses and other current liabilities, an $11.4 million increase in accounts payable, and a $3.8 million decrease in deferred tax assets partially offset by a $47.3 million increase in prepaid expenses and other assets and a $2.3 million increase in accounts receivable, net.

H1 2026
 
Cash provided by operating activities for the six months ended June 30, 2025 of $178.8 million was primarily related to our net income of $29.0 million, adjusted for non-cash charges of $94.1 million and net cash inflows of $55.7 million resulting from changes in our operating assets and liabilities. Non-cash charges primarily consisted of share-based compensation, depreciation and amortization of property and equipment and amortization of discount and accretion of discount on our marketable securities.
 
The main drivers of the changes in operating assets and liabilities were a $62.5 million increase in deferred revenue, resulting primarily from increased billings for subscriptions, a $24.1 million increase in accrued expenses and other liabilities, and a $6.2 million increase in accounts payable primarily driven by payments timing differences, partially offset by a $26.8 million increase in prepaid expenses and other assets, primarily associated with the revaluation of a foreign currency hedging asset, and a $10.4 million increase in accounts receivable, net.
 
Investing Activities
 
Cash used in investing activities during the six months ended June 30, 2026 was $88.4 million, primarily as a result of a $112.9 million purchase of marketable securities, a $13.2 million acquisition of OneAI, which expands monday.com's AI Work Platform with native voice capabilities, $10.3 million in investments made through monday ventures, our $50 million corporate venture fund focused on backing early to growth-stage companies building AI-powered enterprise work solutions, including a $6.0 million purchase of securities of privately held companies under the cost method and a $4.3 million investment in an affiliated company, and $7.8 million of purchases of property and equipment and capitalized software development costs, offset by maturities of marketable securities in the amount of $55.9 million.
 
Cash used in investing activities during the six months ended June 30, 2025 was $21.3 million, primarily as a result of purchases of marketable securities in the amount of $10 million and $11.3 million of purchases of property and equipment and capitalized software development costs.
 
Financing Activities
 
Cash used in financing activities for the six months ended June 30, 2026 was $721.4 million, primarily as a result of repurchases of our ordinary shares in the amount of $735.0 million, and repayments of $1.8 million relating to exercises of share options and RSUs, net, partially offset by proceeds of $15.4 million from exercise of share options and purchases under the employee share purchase plan.
 
Cash provided by financing activities for the six months ended June 30, 2025 was $21.4 million, primarily as a result of proceeds of $26.5 million from exercise of share options and purchases under the employee share purchase plan, partially offset by repayments of $5.1 million relating to exercises of share options and RSUs, net.
 
Off-Balance Sheet Arrangements
 
We do not have any off-balance sheet arrangements, as defined by applicable regulations of the SEC, that are reasonably likely to have a current or future material effect on our financial condition, results of operations, liquidity, capital expenditures or capital resources.

H1 2026
C.
Research and Development, Patents and Licenses, etc.
  
A comprehensive discussion of our research and development, patents and licenses, etc., is included in “Part 1 - Who We Are” and “Part 4 - Operating and Financial Review and Prospects - Operating Results” sections in our Annual Report.
 
D.
Trend Information
 
Other than the Plan described under “Operating Results” above, and the charitable contribution to the monday.com Foundation described under “Liquidity and Capital Resources” above, and as disclosed in our Annual Report, we are not aware of any trends, uncertainties, demands, commitments or events since June 30, 2026 that are reasonably likely to have a material adverse effect on our net revenue, income, profitability, liquidity or capital resources, or that caused the disclosed financial information to be not necessarily indicative of future operating results or financial condition.
 
E.
Critical Accounting Estimates
 
We describe our significant accounting policies more fully in Note 2 to our unaudited condensed consolidated financial statements for the six months ended June 30, 2026. There have been no material changes to our critical accounting policies since we filed our Annual Report. Please see “Part 4– Operating and Financial Review and Prospects – E. Critical Accounting Estimates” section in our Annual Report.
 
F.
Quantitative and Qualitative Disclosures About Market Risk
 
We are exposed to market risk in the ordinary course of our business.
 
Market risk represents the risk of loss that may impact our financial position due to adverse changes in financial market prices and rates. Our market risk exposure is primarily a result of foreign currency exchange rates and interest rates, which are discussed in detail below.
 
Foreign Currency Risk 

The U.S. dollar is our functional currency. The majority of our revenue was denominated in U.S. dollars for the six months ended June 30, 2026 and June 30, 2025; however, certain expenses comprising our cost of revenue and operating expenses were denominated in NIS, mainly payroll and rent.
 
This foreign currency exposure gives rise to market risk associated with exchange rate movements of the U.S. dollar against the NIS. Furthermore, we anticipate that a material portion of our expenses will continue to be denominated in NIS.
 
A decrease of 5% in the U.S. dollar to NIS exchange rate would have increased our cost of revenue and operating expenses by approximately 1% during each of the six months ended June 30, 2026 and June 30, 2025. If the NIS fluctuates significantly against the U.S. dollar, it may have a negative impact on our results of operations.

H1 2026
 
To reduce the impact of foreign exchange risks associated with forecasted future cash flows and the volatility in our consolidated statements of operations, we have established a hedging program as further described in Note 2 to our audited consolidated financial statements included in our Annual Report. Foreign currency contracts are generally utilized in this hedging program. Our foreign currency contracts are short-term in duration. We do not enter into derivative instruments for trading or speculative purposes.
 
We account for our derivative instruments as either assets or liabilities and carry them at fair value in the consolidated balance sheets. The accounting for changes in the fair value of the derivative depends on the intended use of the derivative and the resulting designation. Our hedging program reduces but does not eliminate the impact of currency exchange rate movements.
 
Our derivatives expose us to credit risk to the extent that the counterparties may be unable to meet the terms of the agreement. We seek to mitigate such risk by limiting our counterparties to major financial institutions and by spreading the risk across a number of major financial institutions. However, failure of one or more of these financial institutions is possible and could result in incurred losses. 
 
As of June 30, 2026, the notional amount of our outstanding foreign exchange contracts was $195.8 million, all of which met the requirements of hedge accounting.
 
The table below provides information regarding our derivative instruments held in order to limit the exposure to exchange rate fluctuation as of June 30, 2026 (in thousands of dollars):
 
Derivatives designated as hedging instruments:
 
Maturity in 2026-2027
 
Foreign exchange contracts:
     
NIS
 
$
195,769
 
Total
 
$
195,769
 
 
Interest Rate Risk
 
We believe that we have no significant exposure to interest rate risk, as we have no long-term loans. However, our future interest income may fall short of expectations due to changes in market interest rates.