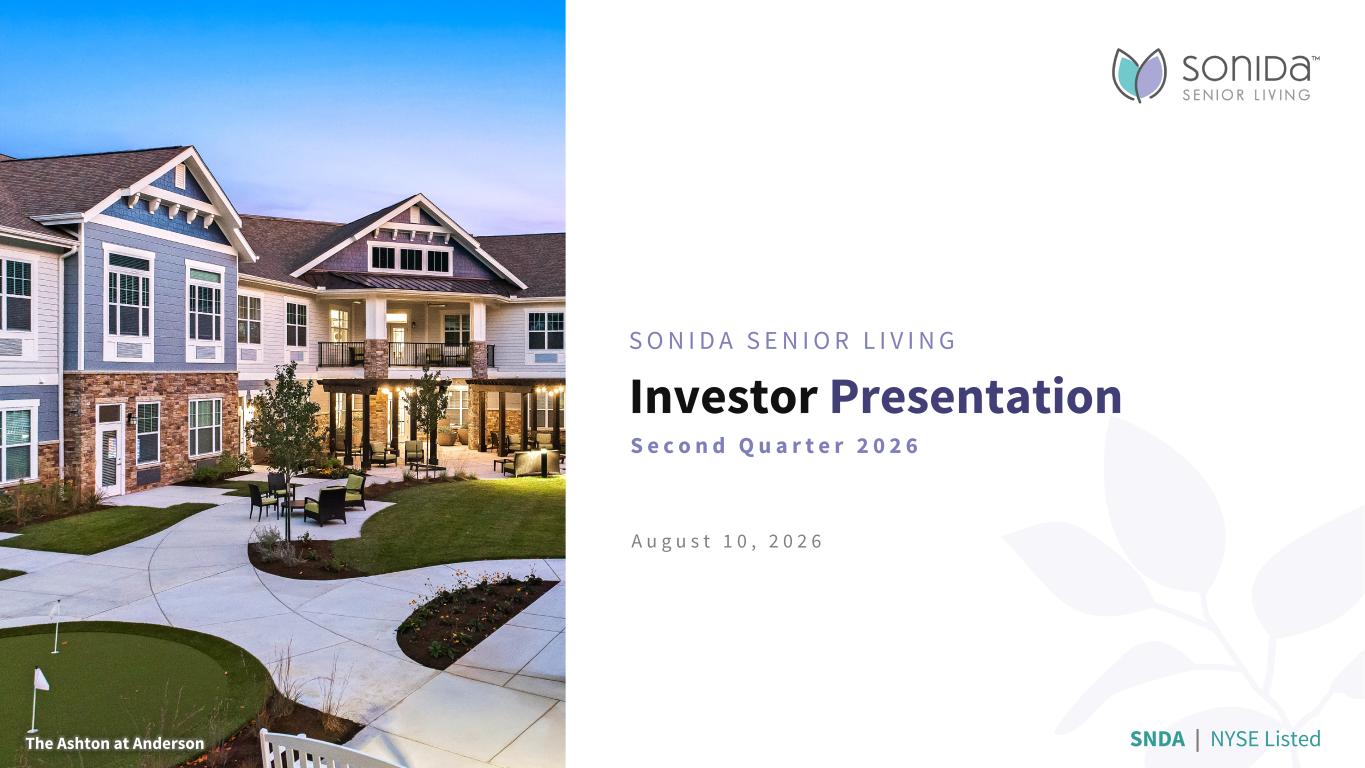
Investor Presentation S O N I D A S E N I O R L I V I N G S e c o n d Q u a r t e r 2 0 2 6 A u g u s t 1 0 , 2 0 2 6 SNDA | NYSE ListedThe Ashton at Anderson
Basis of Presentation I M P O R T A N T D I S C L O S U R E S The information in this investor presentation is current only as of its date and may have changed. We undertake no obligation to update this information in light of new information, future events or otherwise. Please refer to Appendix – Supplemental Information for definitions of certain capitalized terms used in this investor presentation. On March 11, 2026, we completed our previously announced acquisition of CNL Healthcare Properties, Inc. (“CHP”) through a series of steps ending with a forward merger of CHP with and into a subsidiary of the Company (the “CHP Merger”), with such subsidiary surviving the CHP Merger, as a result of which we now indirectly own all of the assets of CHP. For periods presented in which we did not own CHP during the full period, we present certain historical measures in this investor presentation on a “pro forma” basis as if the CHP Merger was consummated on the first day of the applicable period presented, as we believe such historical pro forma information provides investors with useful information about the combined business and a meaningful method of comparing the performance of combined business over historical periods. The historical pro forma information is being presented for informational purposes only and does not reflect the actual results we would have achieved had the CHP Merger occurred on the first day of the applicable period and may not be predictive of future results. The historical CHP information used to prepare the historical pro forma information included herein is based on CHP’s books and records and, in certain cases, has been adjusted to conform to the Company’s presentation of certain metrics. For example, for NOI, NOI Margin and Adjusted EBITDA, we have included pro forma adjustments representing the impact of CHP as if we acquired CHP on the first day of the applicable period. These pro forma adjustments were calculated on the same basis as the Company calculates NOI, NOI Margin and Adjusted EBITDA. Accordingly, to the extent standalone CHP information is presented herein for historical periods it may not conform to similar information previously disclosed by CHP in its SEC filings prior to the consummation of the CHP Merger. We believe that the historical pro forma information represents a reasonable estimate of the results of the combined business for the periods preceding the consummation of the CHP Merger; however, the pro forma information has not been audited. Further, the historical pro forma information does not reflect the cost of any integration activities or benefits from the CHP Merger that may be derived, both of which may have a material effect on our consolidated results in periods following completion of the CHP Merger. As a result, there can be no assurance that the historical pro forma information accurately reflects the actual results of the combined business for the periods preceding the consummation of the CHP Merger. The historical “pro forma” information presented herein should not be viewed as a substitute for consolidated financial results presented in accordance with United States generally accepted accounting principles (“GAAP”) or pro forma financial statements prepared in accordance with Article 11 of Regulation S-X. Please refer to our consolidated financial statements in our Form 10-Q filed with the SEC on August 10, 2026 for our actual historical results presented in accordance with GAAP for the quarter ended June 30, 2026 and our Current Report on Form 8-K filed with the SEC on May 18, 2026 for our actual pro forma combined results prepared in accordance with Article 11 of Regulation S-X for the year ended December 31, 2025 and the three months ended March 31, 2026. Our independent registered public accounting firm has not audited, reviewed, compiled or applied agreed-upon procedures with respect to the historical combined information included herein and does not express an opinion or any other form of assurance with respect thereto. 2
Forward-Looking Statements I M P O R T A N T D I S C L O S U R E S This investor presentation contains “forward-looking statements” within the meaning of the federal securities laws. All statements other than statements of historical fact in this investor presentation are forward-looking statements, including those relating the Company’s expectations and beliefs, the industry in which the Company operates, the CHP Merger and its expected financial and other benefits, including expected accretion and synergies, certain 2026 estimates and the Company’s future business prospects and strategies, financial results, working capital, liquidity, capital needs and expenditures. Forward-looking statements are subject to certain risks and uncertainties that could cause our actual results and financial condition to differ materially from those indicated in the forward-looking statements, including, among others, the risks, uncertainties and factors set forth under “Item 1A. Risk Factors” in our Annual Report on Form 10-K for the fiscal year ended December 31, 2025, filed with the Securities and Exchange Commission (the “SEC”) on March 12, 2026, as such factors may be updated from time to time in the Company’s other filings with the SEC, and include the following: the Company’s ability to generate sufficient cash flows from operations, proceeds from equity issuances and debt financings, to satisfy its short and long-term debt obligations and to fund the Company’s acquisitions and capital improvement projects to expand, redevelop, and/or reposition its senior living communities; increased competition for, or a shortage of, skilled workers, including due to general labor market conditions, along with wage pressures resulting from such increased competition, low unemployment levels, use of contract labor, minimum wage increases and/or changes in immigration or overtime laws; elevated market interest rates that increase the cost of certain of our debt obligations; the Company’s ability to obtain additional capital on terms acceptable to it; the Company’s ability to extend or refinance its existing debt as such debt matures, the Company’s compliance with its debt agreements, including certain financial covenants and the risk of cross-default in the event such non-compliance occurs; the Company’s ability to complete acquisitions and dispositions upon favorable terms or at all, including the possibility that the expected benefits and the Company’s projections related to such acquisitions may not materialize as expected; our ability to integrate our business with CHP successfully, and to achieve the anticipated benefits; the possibility that companies that the Company has acquired (including CHP) or may acquire could have undiscovered liabilities, or that companies or assets that the Company has acquired (including CHP) or may acquire could involve other unexpected costs or may strain the Company’s management capabilities; potential adverse reactions or changes to business relationships resulting from the CHP Merger; the risk of oversupply and increased competition in the markets which the Company operates; the Company’s ability to maintain internal controls over financial reporting; the cost and difficulty of complying with applicable licensure, legislative oversight, or regulatory changes; risks associated with current global economic conditions and general economic factors such as elevated labor costs due to shortages of medical and non-medical staff, competition in the labor market, increased costs of salaries, wages and benefits, and immigration laws, the consumer price index, commodity costs, fuel and other energy costs, supply chain disruptions, increased insurance costs, tariffs, elevated interest rates and tax rates; the impact from or the potential emergence and effects of a future epidemic, pandemic, outbreak of infectious disease or other health crisis; the Company’s ability to maintain the security and functionality of its information systems, to prevent a cybersecurity attack or breach, and to comply with applicable privacy and consumer protection laws, including HIPAA; and changes in accounting principles and interpretations. We caution you that the risks, uncertainties and other factors referenced above may not contain all of the risks, uncertainties and other factors that are important to you. In addition, we cannot assure you that we will realize the results, benefits or outcomes that we expect or anticipate or, even if substantially realized, that they will result in the consequences or affect us or our business in the way expected. All forward-looking statements are expressly qualified in their entirety by the cautionary statements set forth above. Forward-looking statements speak only as of the date of they are made, and the Company does not undertake or assume any obligation to update publicly any of these statements to reflect actual results, new information or future events, changes in assumptions or changes in other factors affecting forward-looking statements, except to the extent required by applicable law. 3
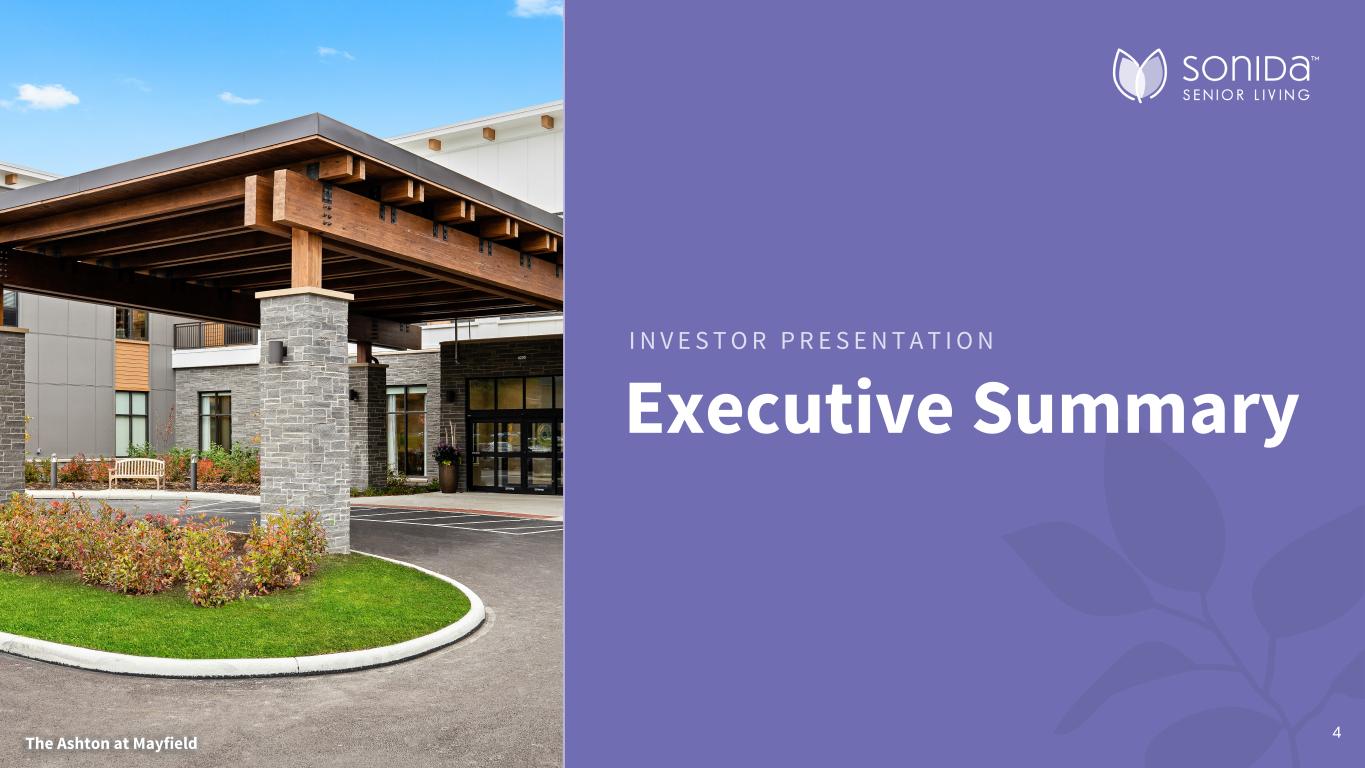
Executive Summary I N V E S T O R P R E S E N T A T I O N The Ashton at Mayfield 4
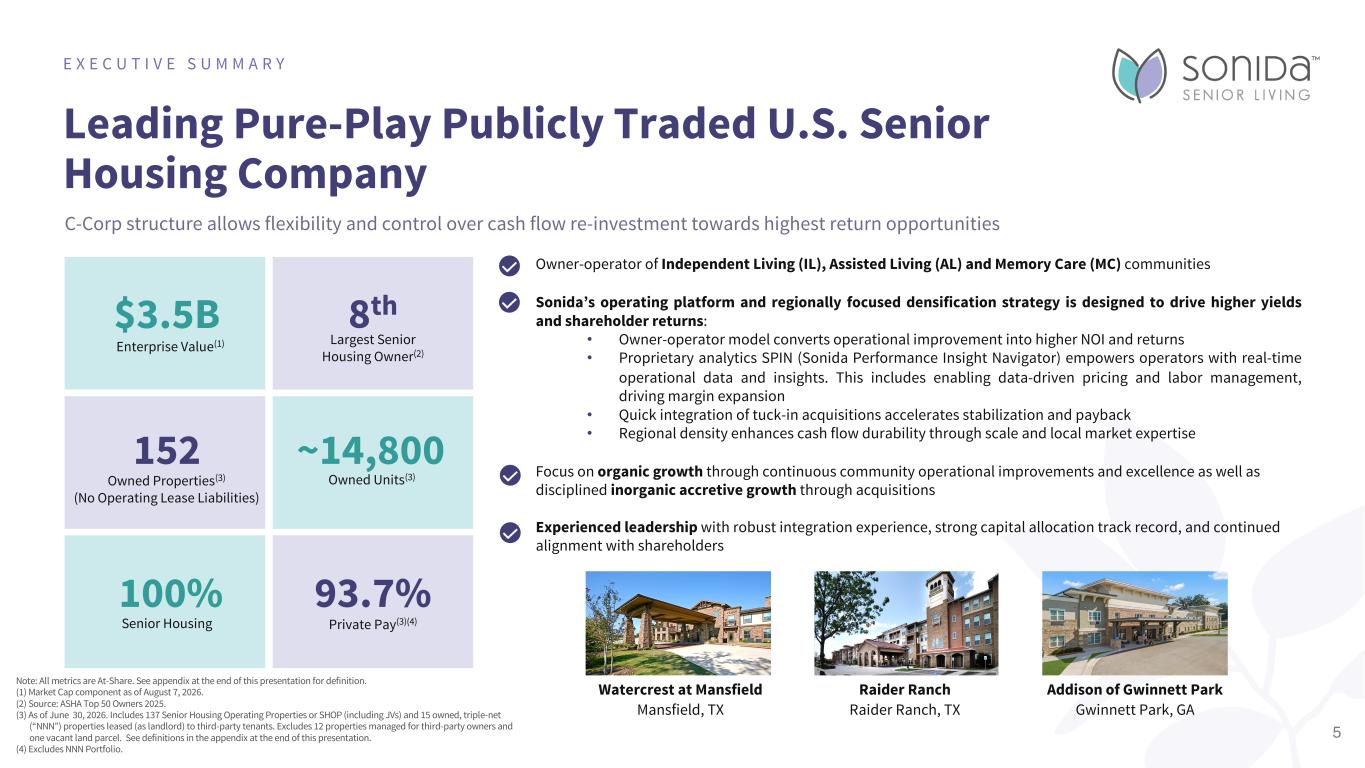
Leading Pure-Play Publicly Traded U.S. Senior Housing Company E X E C U T I V E S U M M A R Y $3.5B Enterprise Value(1) 8th Largest Senior Housing Owner(2) 152 ~14,800 100% Senior Housing 93.7% Private Pay(3)(4) Owned Properties(3) (No Operating Lease Liabilities) Owned Units(3) Owner-operator of Independent Living (IL), Assisted Living (AL) and Memory Care (MC) communities Sonida’s operating platform and regionally focused densification strategy is designed to drive higher yields and shareholder returns: • Owner-operator model converts operational improvement into higher NOI and returns • Proprietary analytics SPIN (Sonida Performance Insight Navigator) empowers operators with real-time operational data and insights. This includes enabling data-driven pricing and labor management, driving margin expansion • Quick integration of tuck-in acquisitions accelerates stabilization and payback • Regional density enhances cash flow durability through scale and local market expertise Focus on organic growth through continuous community operational improvements and excellence as well as disciplined inorganic accretive growth through acquisitions Experienced leadership with robust integration experience, strong capital allocation track record, and continued alignment with shareholders Watercrest at Mansfield Mansfield, TX Raider Ranch Raider Ranch, TX Addison of Gwinnett Park Gwinnett Park, GA Note: All metrics are At-Share. See appendix at the end of this presentation for definition. (1) Market Cap component as of August 7, 2026. (2) Source: ASHA Top 50 Owners 2025. (3) As of June 30, 2026. Includes 137 Senior Housing Operating Properties or SHOP (including JVs) and 15 owned, triple-net (“NNN”) properties leased (as landlord) to third-party tenants. Excludes 12 properties managed for third-party owners and one vacant land parcel. See definitions in the appendix at the end of this presentation. (4) Excludes NNN Portfolio. 5 C-Corp structure allows flexibility and control over cash flow re-investment towards highest return opportunities
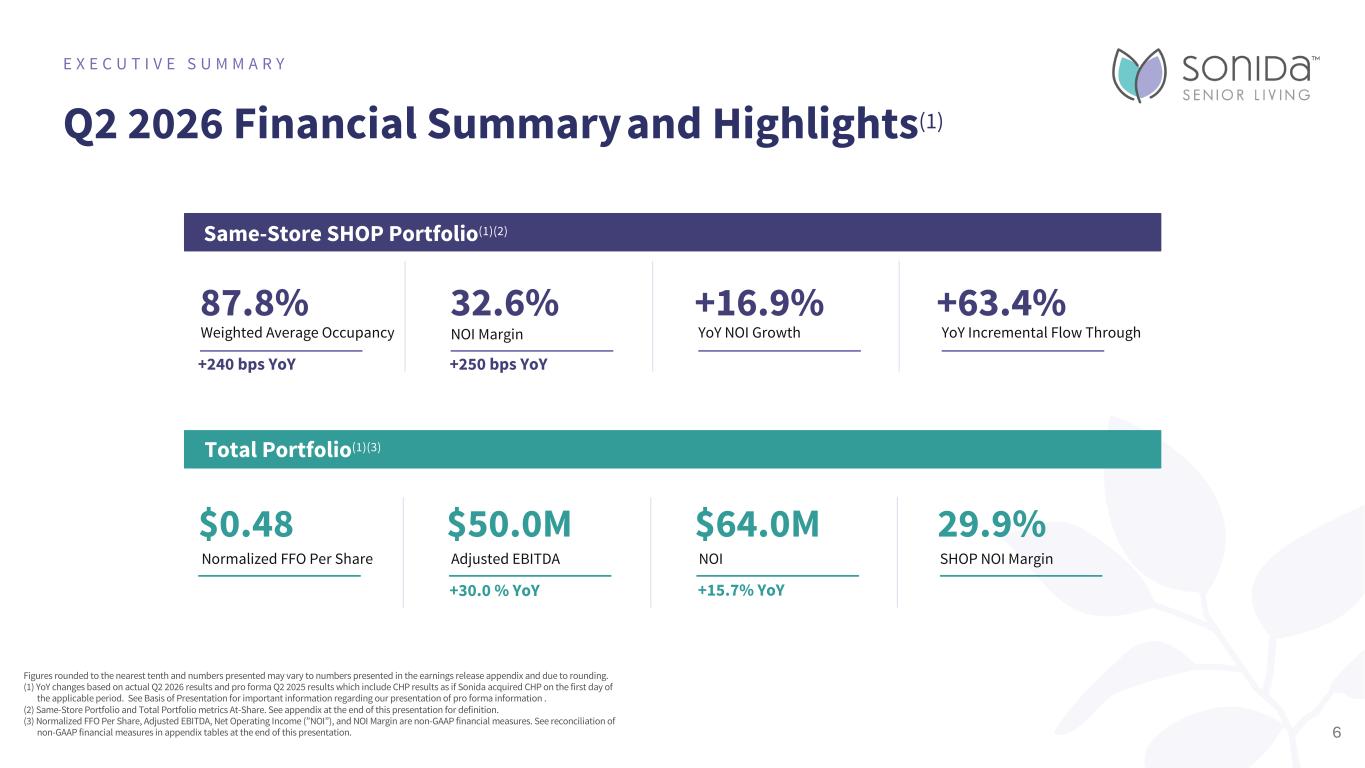
E X E C U T I V E S U M M A R Y 6 Q2 2026 Financial Summary and Highlights(1) Figures rounded to the nearest tenth and numbers presented may vary to numbers presented in the earnings release appendix and due to rounding. (1) YoY changes based on actual Q2 2026 results and pro forma Q2 2025 results which include CHP results as if Sonida acquired CHP on the first day of the applicable period. See Basis of Presentation for important information regarding our presentation of pro forma information . (2) Same-Store Portfolio and Total Portfolio metrics At-Share. See appendix at the end of this presentation for definition. (3) Normalized FFO Per Share, Adjusted EBITDA, Net Operating Income (”NOI”), and NOI Margin are non-GAAP financial measures. See reconciliation of non-GAAP financial measures in appendix tables at the end of this presentation. Same-Store SHOP Portfolio(1)(2) 87.8% Weighted Average Occupancy 32.6% +16.9% YoY NOI Growth +63.4% YoY Incremental Flow Through Total Portfolio(1)(3) $0.48 Normalized FFO Per Share $50.0M Adjusted EBITDA $64.0M NOI 29.9% SHOP NOI Margin NOI Margin +240 bps YoY +250 bps YoY +30.0 % YoY +15.7% YoY
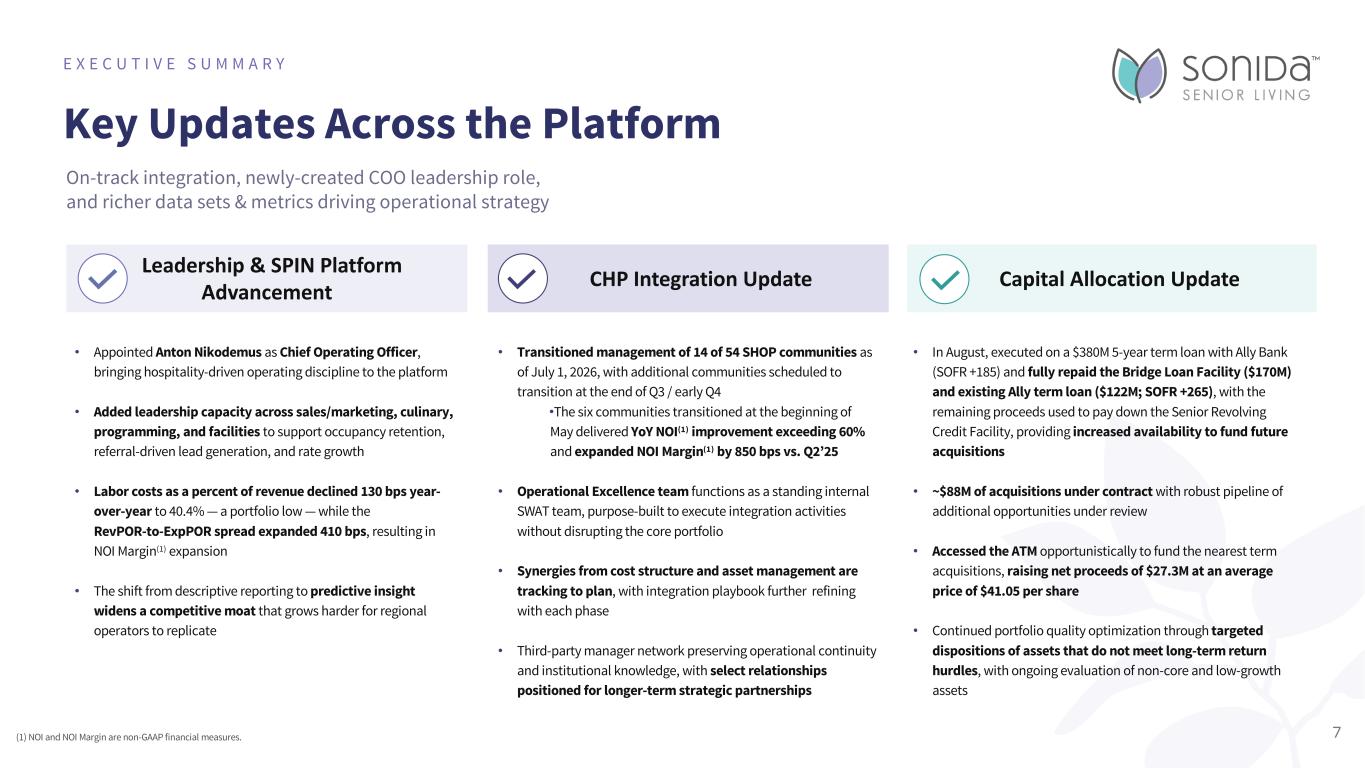
Key Updates Across the Platform E X E C U T I V E S U M M A R Y CHP Integration Update • Appointed Anton Nikodemus as Chief Operating Officer, bringing hospitality-driven operating discipline to the platform • Added leadership capacity across sales/marketing, culinary, programming, and facilities to support occupancy retention, referral-driven lead generation, and rate growth • Labor costs as a percent of revenue declined 130 bps year- over-year to 40.4% — a portfolio low — while the RevPOR-to-ExpPOR spread expanded 410 bps, resulting in NOI Margin(1) expansion • The shift from descriptive reporting to predictive insight widens a competitive moat that grows harder for regional operators to replicate Leadership & SPIN Platform Advancement • Transitioned management of 14 of 54 SHOP communities as of July 1, 2026, with additional communities scheduled to transition at the end of Q3 / early Q4 •The six communities transitioned at the beginning of May delivered YoY NOI(1) improvement exceeding 60% and expanded NOI Margin(1) by 850 bps vs. Q2’25 • Operational Excellence team functions as a standing internal SWAT team, purpose-built to execute integration activities without disrupting the core portfolio • Synergies from cost structure and asset management are tracking to plan, with integration playbook further refining with each phase • Third-party manager network preserving operational continuity and institutional knowledge, with select relationships positioned for longer-term strategic partnerships Capital Allocation Update • In August, executed on a $380M 5-year term loan with Ally Bank (SOFR +185) and fully repaid the Bridge Loan Facility ($170M) and existing Ally term loan ($122M; SOFR +265), with the remaining proceeds used to pay down the Senior Revolving Credit Facility, providing increased availability to fund future acquisitions • ~$88M of acquisitions under contract with robust pipeline of additional opportunities under review • Accessed the ATM opportunistically to fund the nearest term acquisitions, raising net proceeds of $27.3M at an average price of $41.05 per share • Continued portfolio quality optimization through targeted dispositions of assets that do not meet long-term return hurdles, with ongoing evaluation of non-core and low-growth assets On-track integration, newly-created COO leadership role, and richer data sets & metrics driving operational strategy (1) NOI and NOI Margin are non-GAAP financial measures. 7
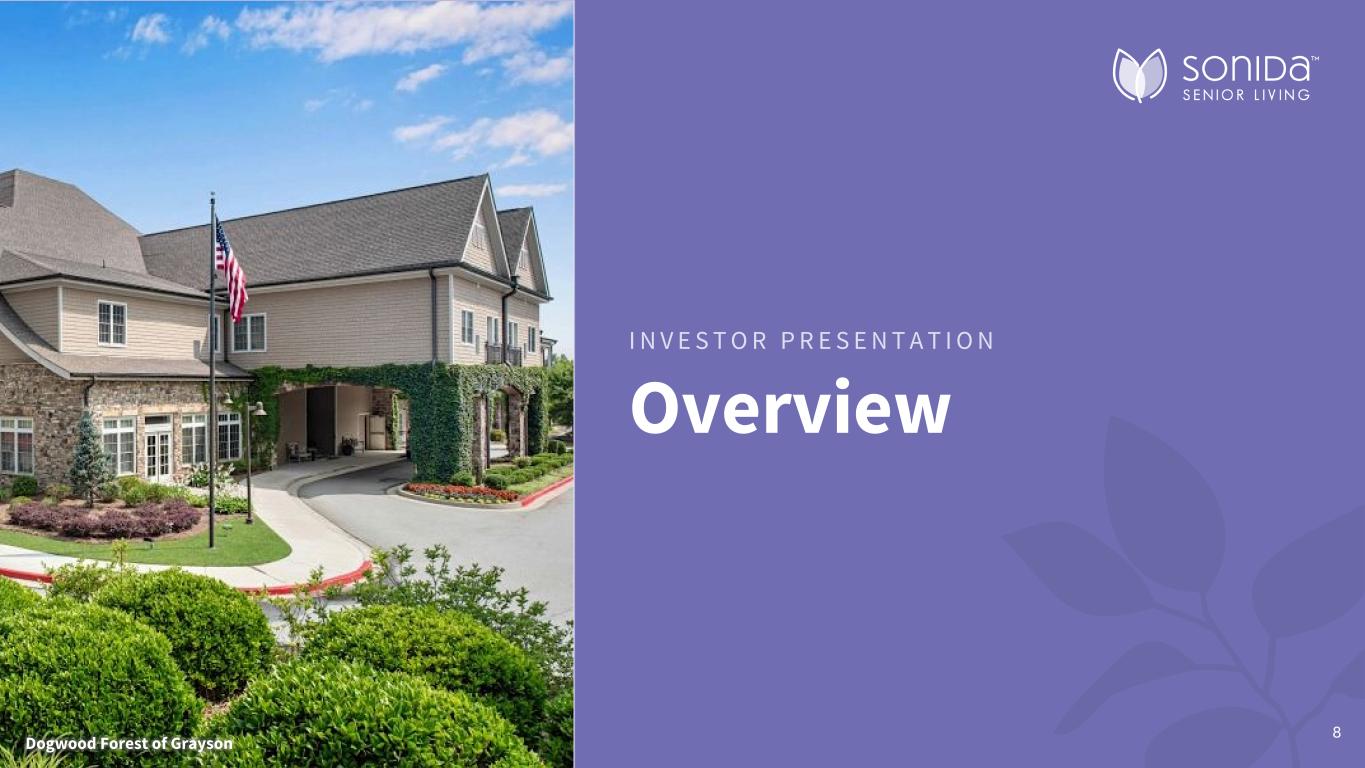
Overview I N V E S T O R P R E S E N T A T I O N 8Dogwood Forest of Grayson
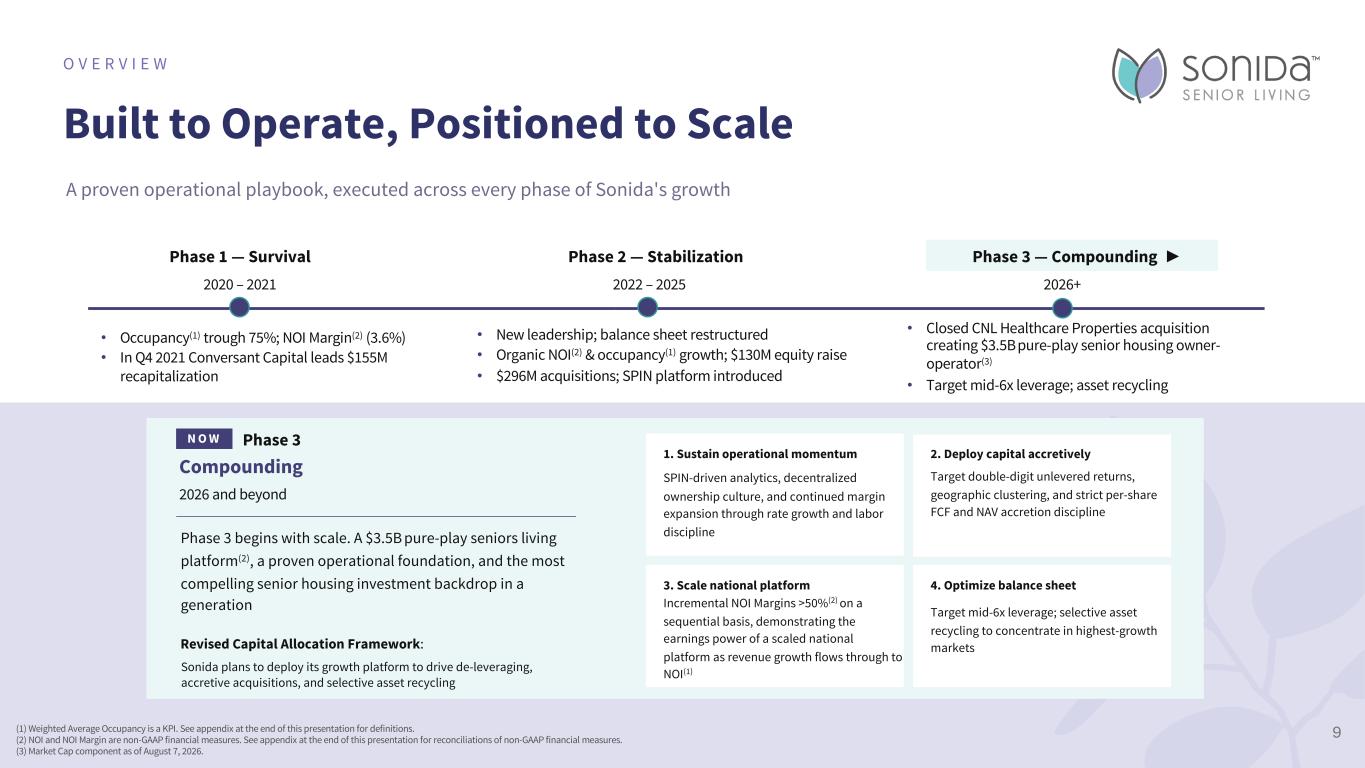
Built to Operate, Positioned to Scale O V E R V I E W N O W Phase 3 Compounding 2026 and beyond Phase 3 begins with scale. A $3.5B pure-play seniors living platform(2), a proven operational foundation, and the most compelling senior housing investment backdrop in a generation 1. Sustain operational momentum SPIN-driven analytics, decentralized ownership culture, and continued margin expansion through rate growth and labor discipline 2. Deploy capital accretively Target double-digit unlevered returns, geographic clustering, and strict per-share FCF and NAV accretion discipline 3. Scale national platform Incremental NOI Margins >50%(2) on a sequential basis, demonstrating the earnings power of a scaled national platform as revenue growth flows through to NOI(1) 4. Optimize balance sheet Target mid-6x leverage; selective asset recycling to concentrate in highest-growth markets • Occupancy(1) trough 75%; NOI Margin(2) (3.6%) • In Q4 2021 Conversant Capital leads $155M recapitalization • New leadership; balance sheet restructured • Organic NOI(2) & occupancy(1) growth; $130M equity raise • $296M acquisitions; SPIN platform introduced • Closed CNL Healthcare Properties acquisition creating $3.5B pure-play senior housing owner- operator(3) • Target mid-6x leverage; asset recycling Phase 1 — Survival 2020 – 2021 Phase 2 — Stabilization 2022 – 2025 Phase 3 — Compounding ► 2026+ Revised Capital Allocation Framework: Sonida plans to deploy its growth platform to drive de-leveraging, accretive acquisitions, and selective asset recycling A proven operational playbook, executed across every phase of Sonida's growth (1) Weighted Average Occupancy is a KPI. See appendix at the end of this presentation for definitions. (2) NOI and NOI Margin are non-GAAP financial measures. See appendix at the end of this presentation for reconciliations of non-GAAP financial measures. (3) Market Cap component as of August 7, 2026. 9
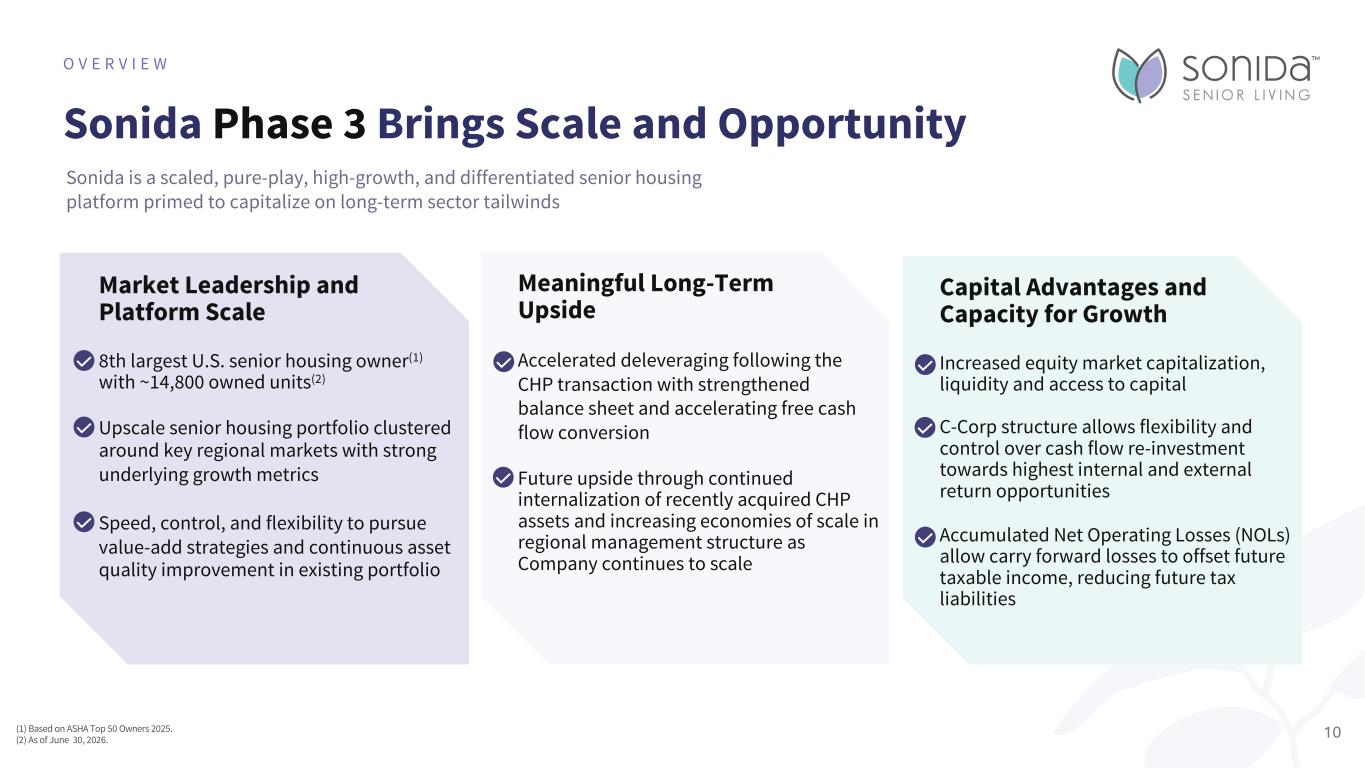
Sonida Phase 3 Brings Scale and Opportunity O V E R V I E W (1) Based on ASHA Top 50 Owners 2025. (2) As of June 30, 2026. Market Leadership and Platform Scale 8th largest U.S. senior housing owner(1) with ~14,800 owned units(2) Upscale senior housing portfolio clustered around key regional markets with strong underlying growth metrics Speed, control, and flexibility to pursue value-add strategies and continuous asset quality improvement in existing portfolio Meaningful Long-Term Upside Accelerated deleveraging following the CHP transaction with strengthened balance sheet and accelerating free cash flow conversion Future upside through continued internalization of recently acquired CHP assets and increasing economies of scale in regional management structure as Company continues to scale Capital Advantages and Capacity for Growth Increased equity market capitalization, liquidity and access to capital C-Corp structure allows flexibility and control over cash flow re-investment towards highest internal and external return opportunities Accumulated Net Operating Losses (NOLs) allow carry forward losses to offset future taxable income, reducing future tax liabilities Sonida is a scaled, pure-play, high-growth, and differentiated senior housing platform primed to capitalize on long-term sector tailwinds 10
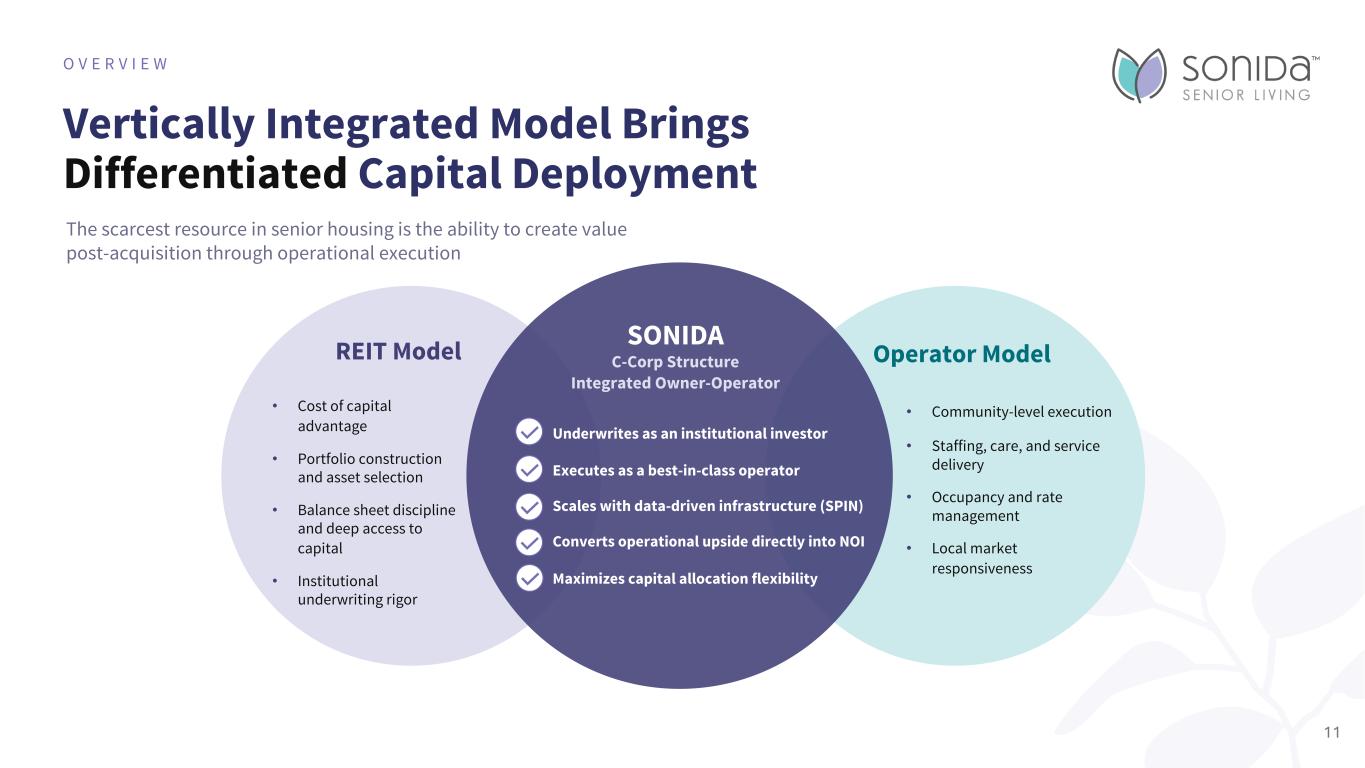
Vertically Integrated Model Brings Differentiated Capital Deployment O V E R V I E W The scarcest resource in senior housing is the ability to create value post-acquisition through operational execution REIT Model • Cost of capital advantage • Portfolio construction and asset selection • Balance sheet discipline and deep access to capital • Institutional underwriting rigor SONIDA C-Corp Structure Integrated Owner-Operator Underwrites as an institutional investor Executes as a best-in-class operator Scales with data-driven infrastructure (SPIN) Converts operational upside directly into NOI Maximizes capital allocation flexibility Operator Model • Community-level execution • Staffing, care, and service delivery • Occupancy and rate management • Local market responsiveness 11
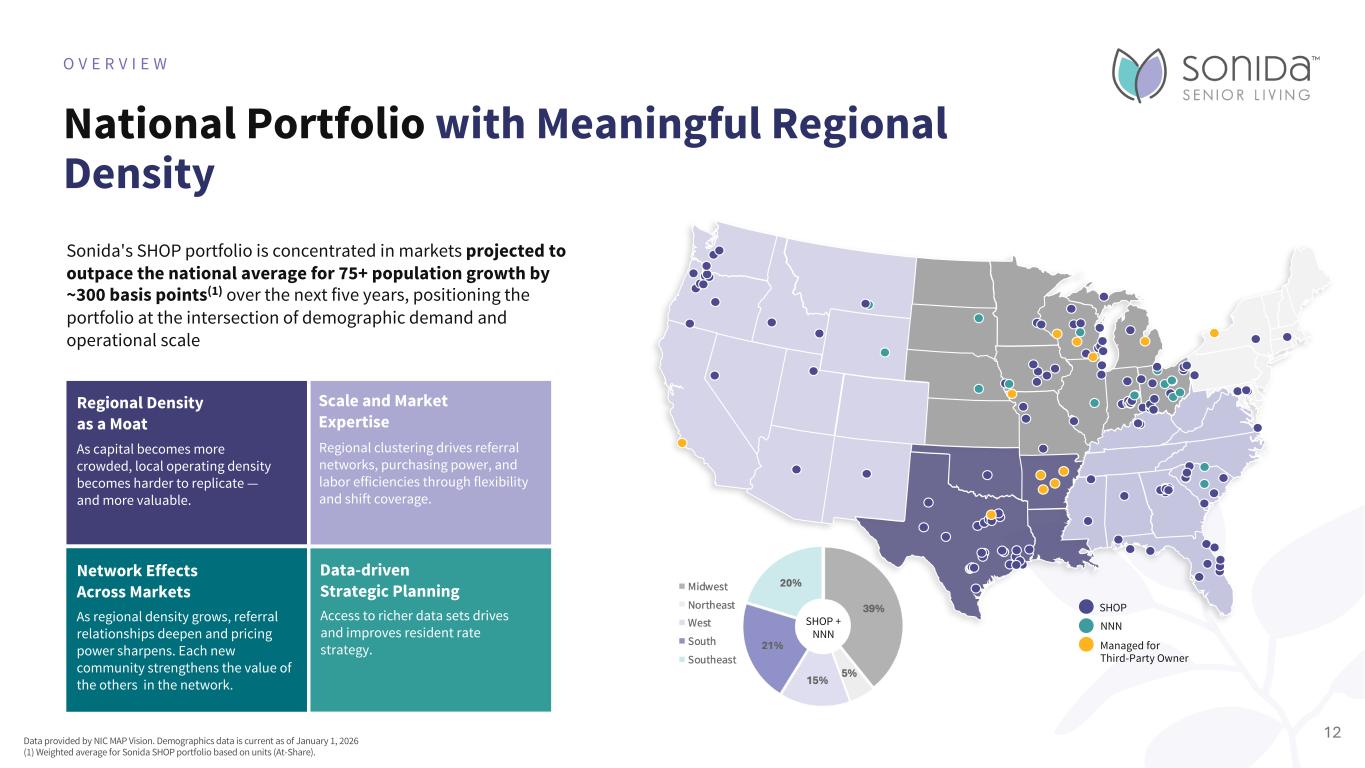
National Portfolio with Meaningful Regional Density O V E R V I E W Managed for Third-Party Owner SHOP NNN 12 Data provided by NIC MAP Vision. Demographics data is current as of January 1, 2026 (1) Weighted average for Sonida SHOP portfolio based on units (At-Share). Regional Density as a Moat As capital becomes more crowded, local operating density becomes harder to replicate — and more valuable. Scale and Market Expertise As regional density grows, referral relationships deepen and pricing power sharpens. Each new community strengthens the value of the others in the network. Network Effects Across Markets Regional clustering drives referral networks, purchasing power, and labor efficiencies through flexibility and shift coverage. Data-driven Strategic Planning Access to richer data sets drives and improves resident rate strategy. Sonida's SHOP portfolio is concentrated in markets projected to outpace the national average for 75+ population growth by ~300 basis points(1) over the next five years, positioning the portfolio at the intersection of demographic demand and operational scale SHOP + NNN
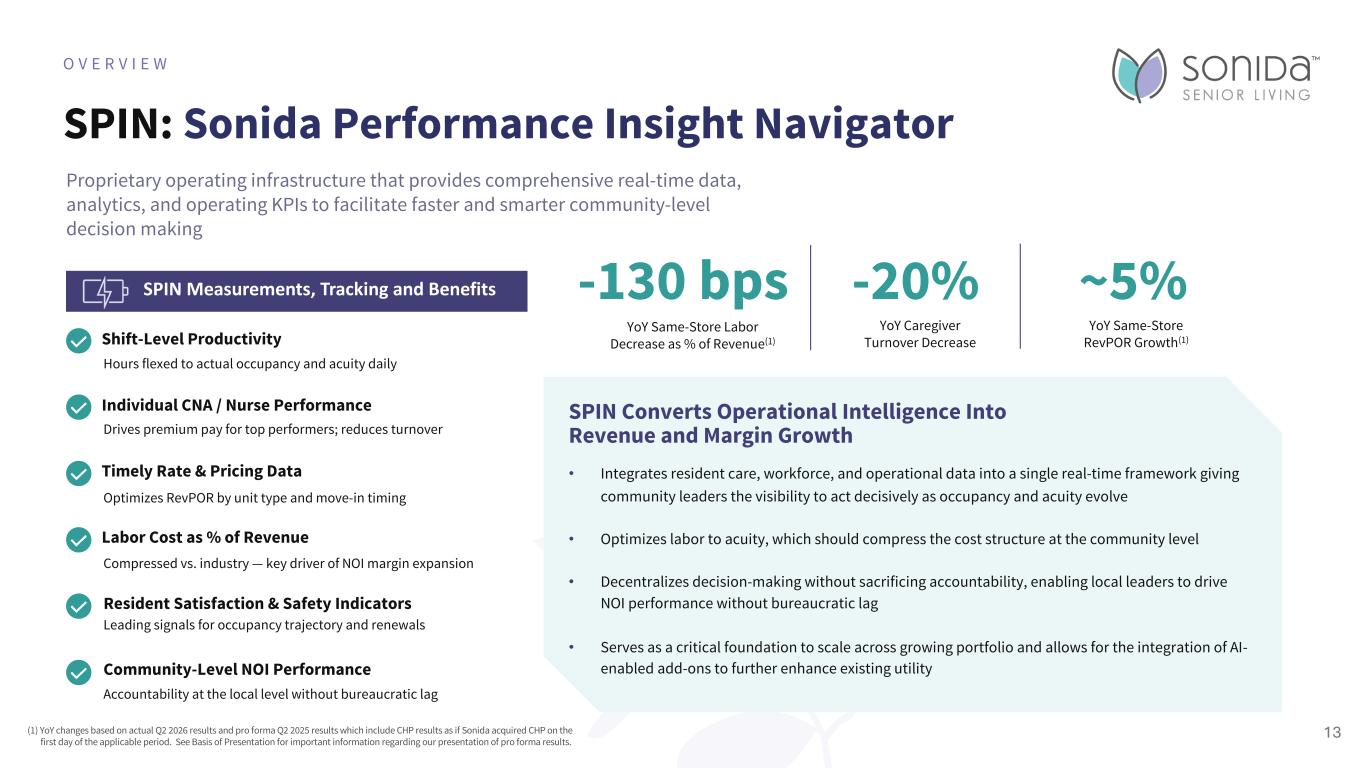
13 SPIN: Sonida Performance Insight Navigator O V E R V I E W Proprietary operating infrastructure that provides comprehensive real-time data, analytics, and operating KPIs to facilitate faster and smarter community-level decision making SPIN Measurements, Tracking and Benefits Shift-Level Productivity Hours flexed to actual occupancy and acuity daily Individual CNA / Nurse Performance Drives premium pay for top performers; reduces turnover Timely Rate & Pricing Data Optimizes RevPOR by unit type and move-in timing Labor Cost as % of Revenue Compressed vs. industry — key driver of NOI margin expansion Resident Satisfaction & Safety Indicators Leading signals for occupancy trajectory and renewals Community-Level NOI Performance Accountability at the local level without bureaucratic lag • Integrates resident care, workforce, and operational data into a single real-time framework giving community leaders the visibility to act decisively as occupancy and acuity evolve • Optimizes labor to acuity, which should compress the cost structure at the community level • Decentralizes decision-making without sacrificing accountability, enabling local leaders to drive NOI performance without bureaucratic lag • Serves as a critical foundation to scale across growing portfolio and allows for the integration of AI- enabled add-ons to further enhance existing utility SPIN Converts Operational Intelligence Into Revenue and Margin Growth -130 bps YoY Same-Store Labor Decrease as % of Revenue(1) -20% YoY Caregiver Turnover Decrease ~5% YoY Same-Store RevPOR Growth(1) (1) YoY changes based on actual Q2 2026 results and pro forma Q2 2025 results which include CHP results as if Sonida acquired CHP on the first day of the applicable period. See Basis of Presentation for important information regarding our presentation of pro forma results.
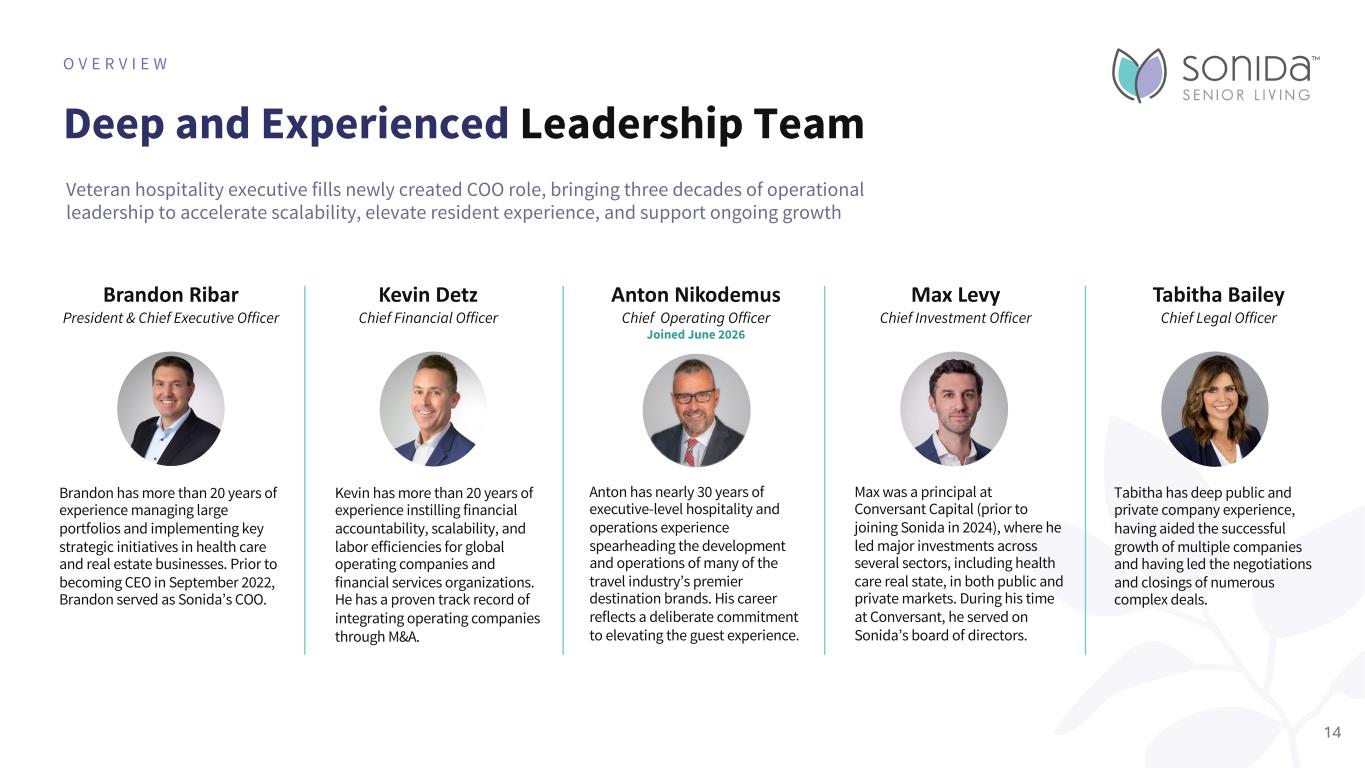
Deep and Experienced Leadership Team O V E R V I E W Brandon Ribar President & Chief Executive Officer Kevin Detz Chief Financial Officer Max Levy Chief Investment Officer Tabitha Bailey Chief Legal Officer Brandon has more than 20 years of experience managing large portfolios and implementing key strategic initiatives in health care and real estate businesses. Prior to becoming CEO in September 2022, Brandon served as Sonida’s COO. Kevin has more than 20 years of experience instilling financial accountability, scalability, and labor efficiencies for global operating companies and financial services organizations. He has a proven track record of integrating operating companies through M&A. Max was a principal at Conversant Capital (prior to joining Sonida in 2024), where he led major investments across several sectors, including health care real state, in both public and private markets. During his time at Conversant, he served on Sonida’s board of directors. Tabitha has deep public and private company experience, having aided the successful growth of multiple companies and having led the negotiations and closings of numerous complex deals. 14 Anton Nikodemus Chief Operating Officer Joined June 2026 Anton has nearly 30 years of executive-level hospitality and operations experience spearheading the development and operations of many of the travel industry’s premier destination brands. His career reflects a deliberate commitment to elevating the guest experience. Veteran hospitality executive fills newly created COO role, bringing three decades of operational leadership to accelerate scalability, elevate resident experience, and support ongoing growth
Financial Performance I N V E S T O R P R E S E N T A T I O N 15Heritage at The Plains at Parish Homestead
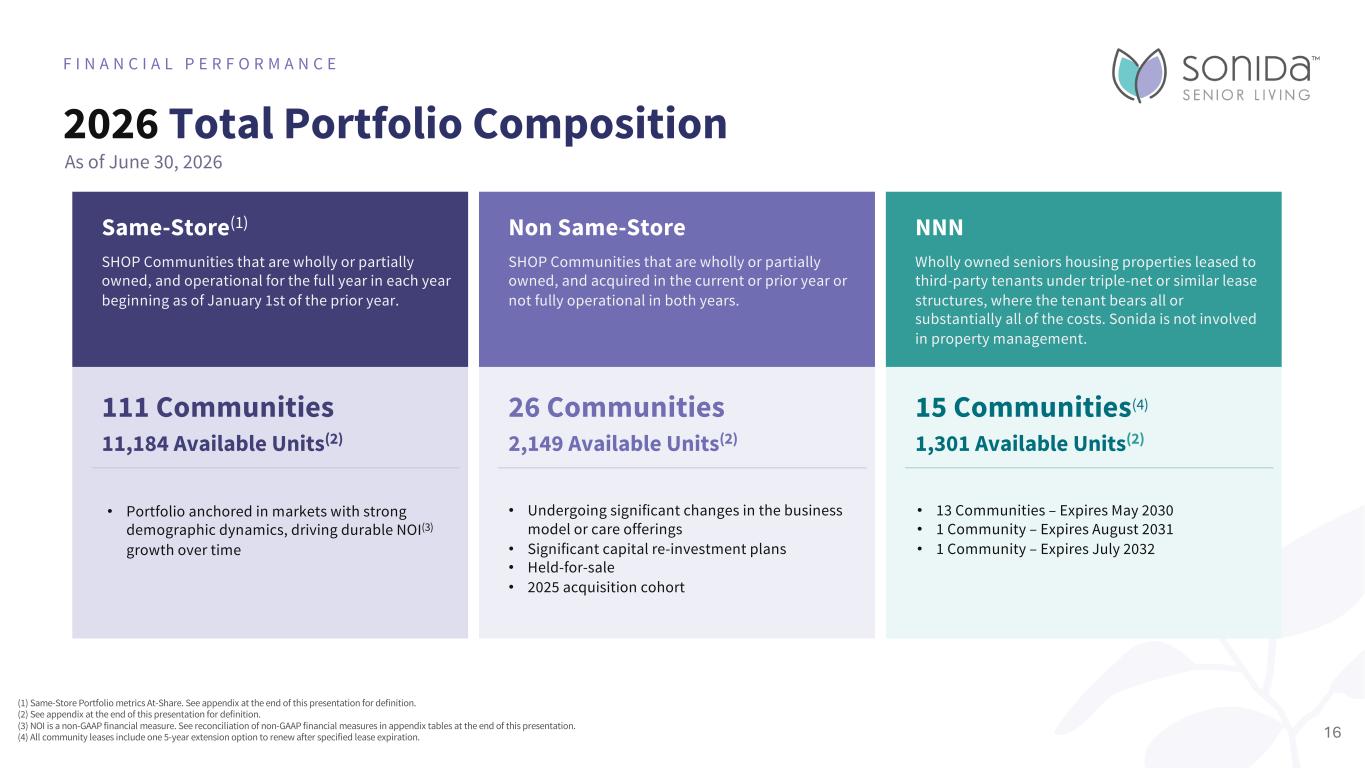
2026 Total Portfolio Composition F I N A N C I A L P E R F O R M A N C E (1) Same-Store Portfolio metrics At-Share. See appendix at the end of this presentation for definition. (2) See appendix at the end of this presentation for definition. (3) NOI is a non-GAAP financial measure. See reconciliation of non-GAAP financial measures in appendix tables at the end of this presentation. (4) All community leases include one 5-year extension option to renew after specified lease expiration. Same-Store(1) SHOP Communities that are wholly or partially owned, and operational for the full year in each year beginning as of January 1st of the prior year. 111 Communities 11,184 Available Units(2) • Portfolio anchored in markets with strong demographic dynamics, driving durable NOI(3) growth over time Non Same-Store SHOP Communities that are wholly or partially owned, and acquired in the current or prior year or not fully operational in both years. 26 Communities 2,149 Available Units(2) • Undergoing significant changes in the business model or care offerings • Significant capital re-investment plans • Held-for-sale • 2025 acquisition cohort NNN Wholly owned seniors housing properties leased to third-party tenants under triple-net or similar lease structures, where the tenant bears all or substantially all of the costs. Sonida is not involved in property management. 15 Communities(4) 1,301 Available Units(2) • 13 Communities – Expires May 2030 • 1 Community – Expires August 2031 • 1 Community – Expires July 2032 16 As of June 30, 2026
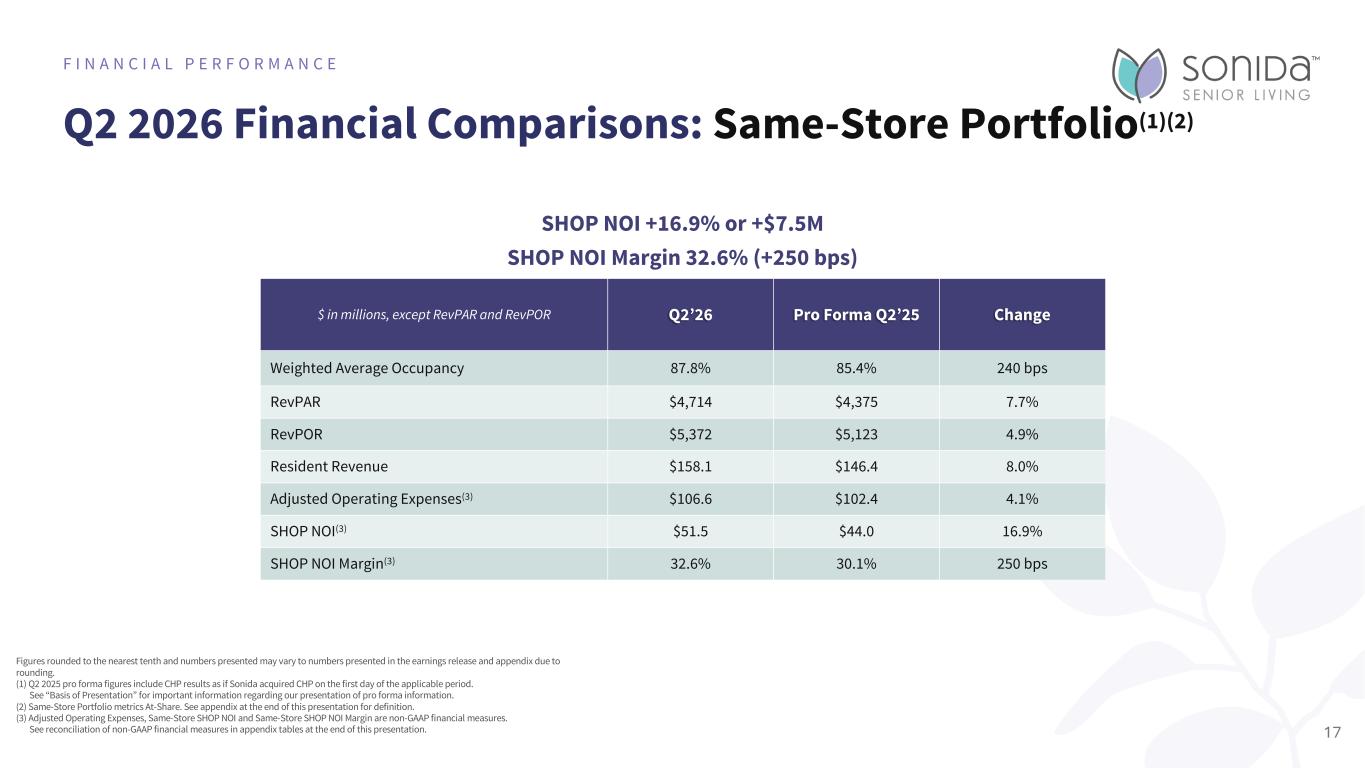
Q2 2026 Financial Comparisons: Same-Store Portfolio(1)(2) F I N A N C I A L P E R F O R M A N C E Figures rounded to the nearest tenth and numbers presented may vary to numbers presented in the earnings release and appendix due to rounding. (1) Q2 2025 pro forma figures include CHP results as if Sonida acquired CHP on the first day of the applicable period. See “Basis of Presentation” for important information regarding our presentation of pro forma information. (2) Same-Store Portfolio metrics At-Share. See appendix at the end of this presentation for definition. (3) Adjusted Operating Expenses, Same-Store SHOP NOI and Same-Store SHOP NOI Margin are non-GAAP financial measures. See reconciliation of non-GAAP financial measures in appendix tables at the end of this presentation. $ in millions, except RevPAR and RevPOR Q2’26 Pro Forma Q2’25 Change Weighted Average Occupancy 87.8% 85.4% 240 bps RevPAR $4,714 $4,375 7.7% RevPOR $5,372 $5,123 4.9% Resident Revenue $158.1 $146.4 8.0% Adjusted Operating Expenses(3) $106.6 $102.4 4.1% SHOP NOI(3) $51.5 $44.0 16.9% SHOP NOI Margin(3) 32.6% 30.1% 250 bps SHOP NOI +16.9% or +$7.5M SHOP NOI Margin 32.6% (+250 bps) 17
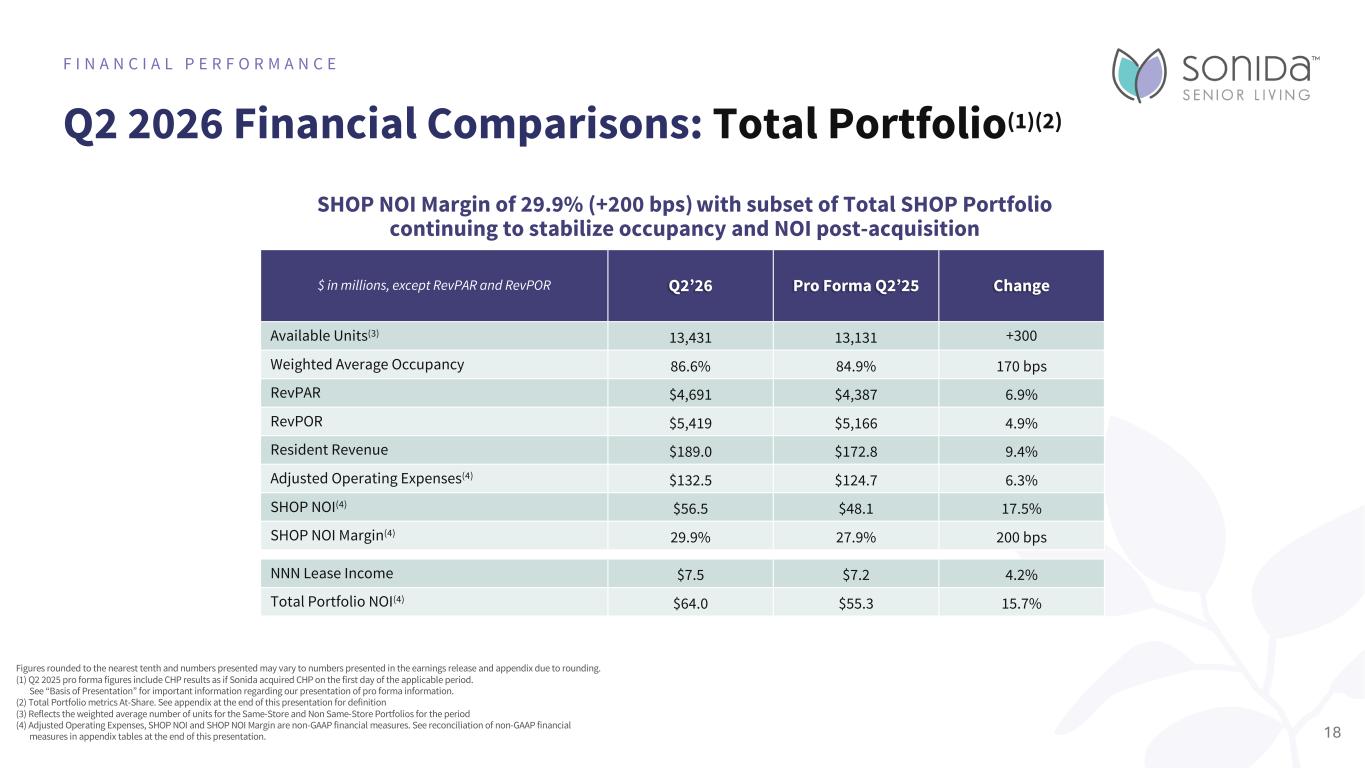
NNN Lease Income $7.5 $7.2 4.2% Total Portfolio NOI(4) $64.0 $55.3 15.7% Q2 2026 Financial Comparisons: Total Portfolio(1)(2) F I N A N C I A L P E R F O R M A N C E Figures rounded to the nearest tenth and numbers presented may vary to numbers presented in the earnings release and appendix due to rounding. (1) Q2 2025 pro forma figures include CHP results as if Sonida acquired CHP on the first day of the applicable period. See “Basis of Presentation” for important information regarding our presentation of pro forma information. (2) Total Portfolio metrics At-Share. See appendix at the end of this presentation for definition (3) Reflects the weighted average number of units for the Same-Store and Non Same-Store Portfolios for the period (4) Adjusted Operating Expenses, SHOP NOI and SHOP NOI Margin are non-GAAP financial measures. See reconciliation of non-GAAP financial measures in appendix tables at the end of this presentation. SHOP NOI Margin of 29.9% (+200 bps) with subset of Total SHOP Portfolio continuing to stabilize occupancy and NOI post-acquisition $ in millions, except RevPAR and RevPOR Q2’26 Pro Forma Q2’25 Change Available Units(3) 13,431 13,131 +300 Weighted Average Occupancy 86.6% 84.9% 170 bps RevPAR $4,691 $4,387 6.9% RevPOR $5,419 $5,166 4.9% Resident Revenue $189.0 $172.8 9.4% Adjusted Operating Expenses(4) $132.5 $124.7 6.3% SHOP NOI(4) $56.5 $48.1 17.5% SHOP NOI Margin(4) 29.9% 27.9% 200 bps 18
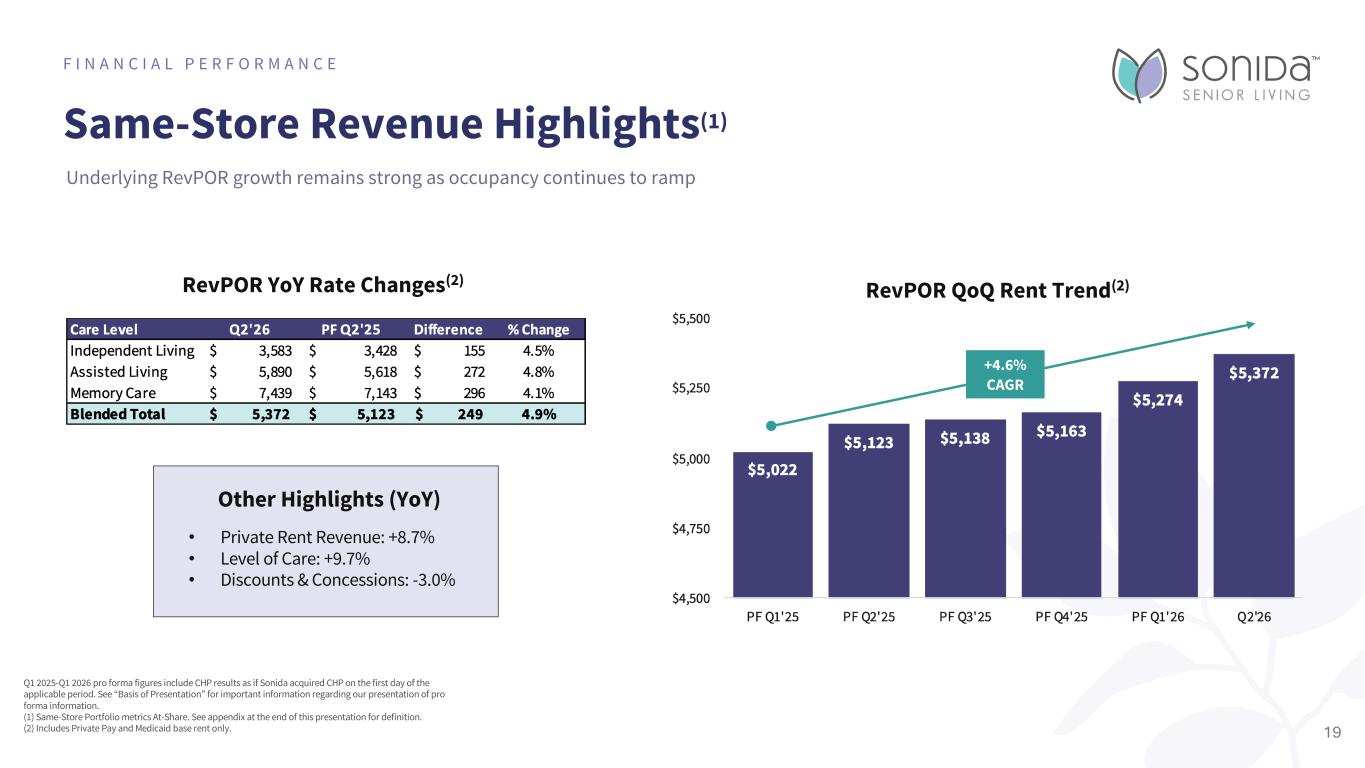
Same-Store Revenue Highlights(1) F I N A N C I A L P E R F O R M A N C E Q1 2025-Q1 2026 pro forma figures include CHP results as if Sonida acquired CHP on the first day of the applicable period. See “Basis of Presentation” for important information regarding our presentation of pro forma information. (1) Same-Store Portfolio metrics At-Share. See appendix at the end of this presentation for definition. (2) Includes Private Pay and Medicaid base rent only. RevPOR YoY Rate Changes(2) RevPOR QoQ Rent Trend(2) Other Highlights (YoY) • Private Rent Revenue: +8.7% • Level of Care: +9.7% • Discounts & Concessions: -3.0% 19 Underlying RevPOR growth remains strong as occupancy continues to ramp +4.6% CAGR
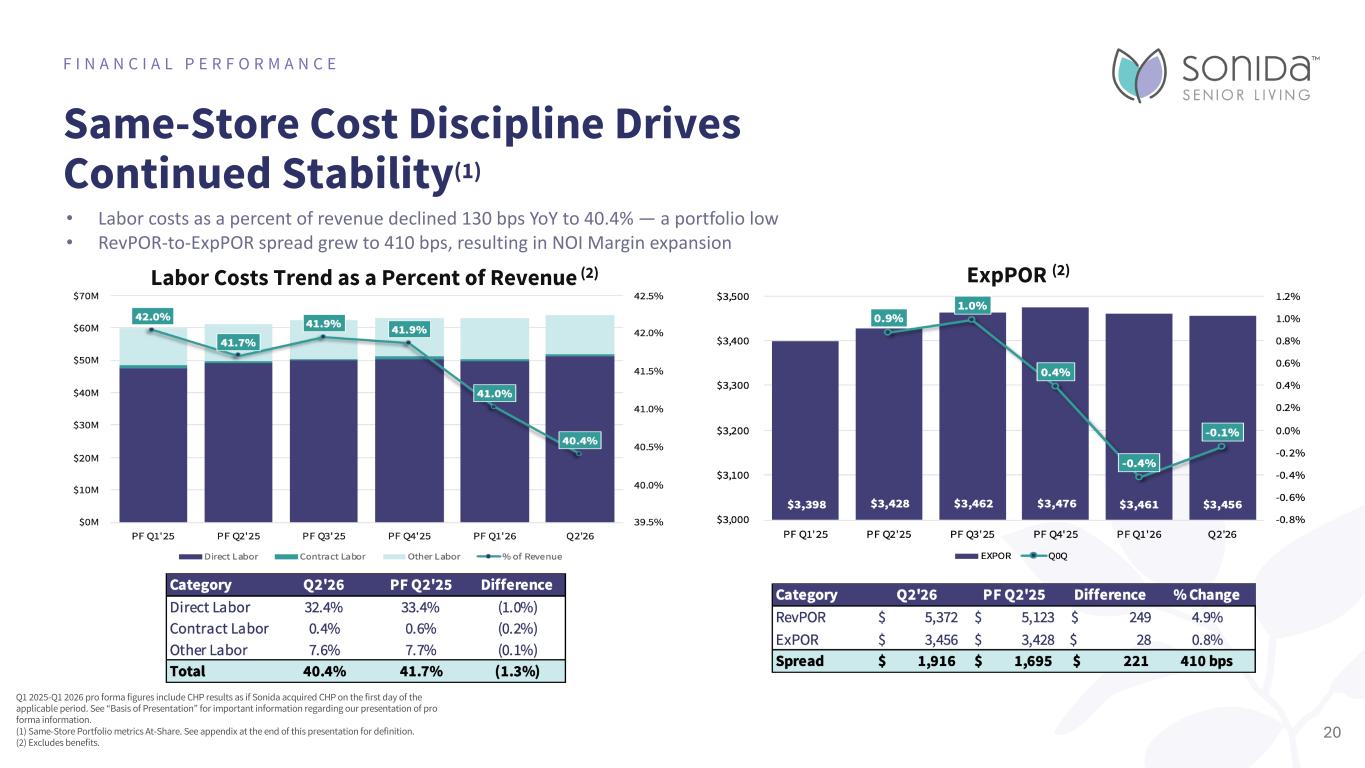
Same-Store Cost Discipline Drives Continued Stability(1) F I N A N C I A L P E R F O R M A N C E Q1 2025-Q1 2026 pro forma figures include CHP results as if Sonida acquired CHP on the first day of the applicable period. See “Basis of Presentation” for important information regarding our presentation of pro forma information. (1) Same-Store Portfolio metrics At-Share. See appendix at the end of this presentation for definition. (2) Excludes benefits. • Labor costs as a percent of revenue declined 130 bps YoY to 40.4% — a portfolio low • RevPOR-to-ExpPOR spread grew to 410 bps, resulting in NOI Margin expansion 20 Labor Costs Trend as a Percent of Revenue (2) ExpPOR (2)
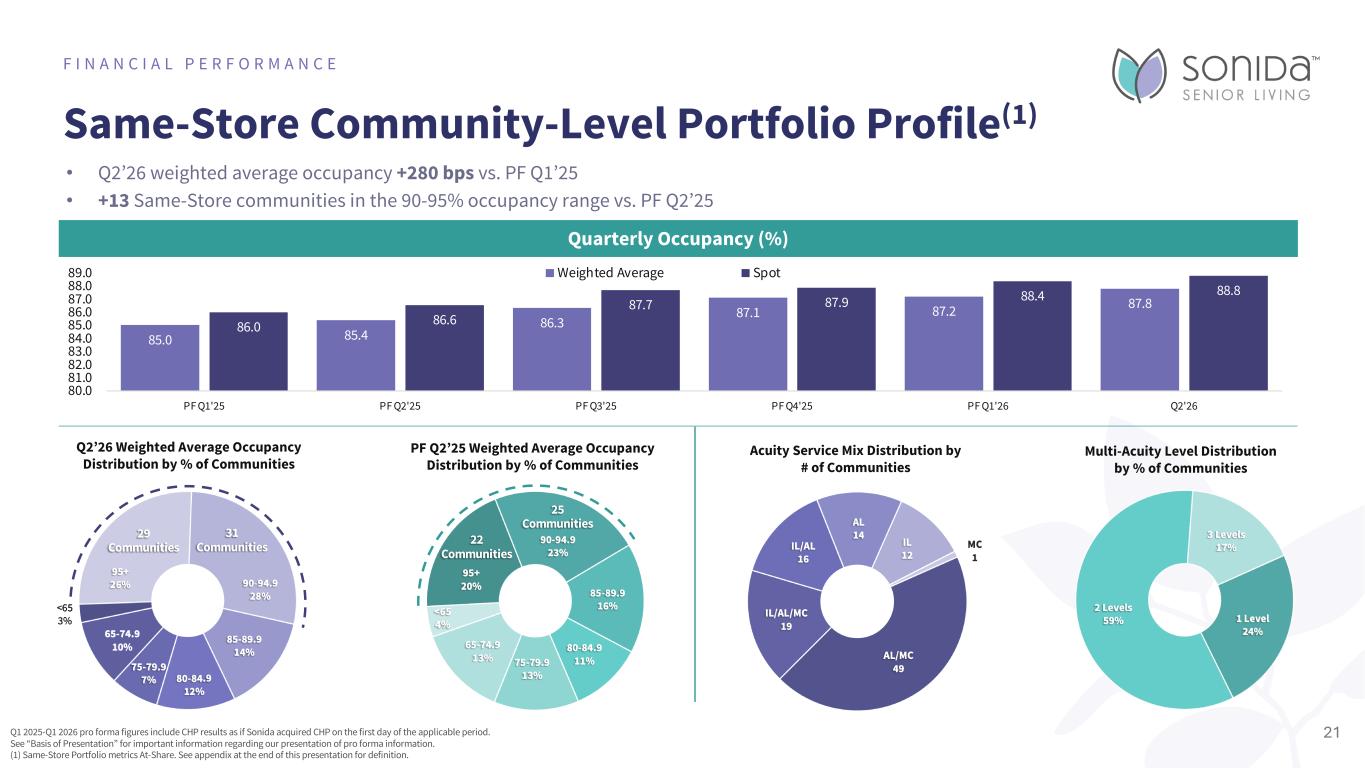
Same-Store Community-Level Portfolio Profile(1) F I N A N C I A L P E R F O R M A N C E 85.0 85.4 86.3 87.1 87.2 87.8 86.0 86.6 87.7 87.9 88.4 88.8 80.0 81.0 82.0 83.0 84.0 85.0 86.0 87.0 88.0 89.0 PF Q1'25 PF Q2'25 PF Q3'25 PF Q4'25 PF Q1'26 Q2'26 Weighted Average Spot Quarterly Occupancy (%) Acuity Service Mix Distribution by # of Communities Multi-Acuity Level Distribution by % of Communities 21 • Q2’26 weighted average occupancy +280 bps vs. PF Q1’25 Q2’26 Weighted Average Occupancy Distribution by % of Communities PF Q2’25 Weighted Average Occupancy Distribution by % of Communities Q1 2025-Q1 2026 pro forma figures include CHP results as if Sonida acquired CHP on the first day of the applicable period. See “Basis of Presentation” for important information regarding our presentation of pro forma information. (1) Same-Store Portfolio metrics At-Share. See appendix at the end of this presentation for definition. • +13 Same-Store communities in the 90-95% occupancy range vs. PF Q2’25 29 Communities 31 Communities 22 Communities 25 Communities
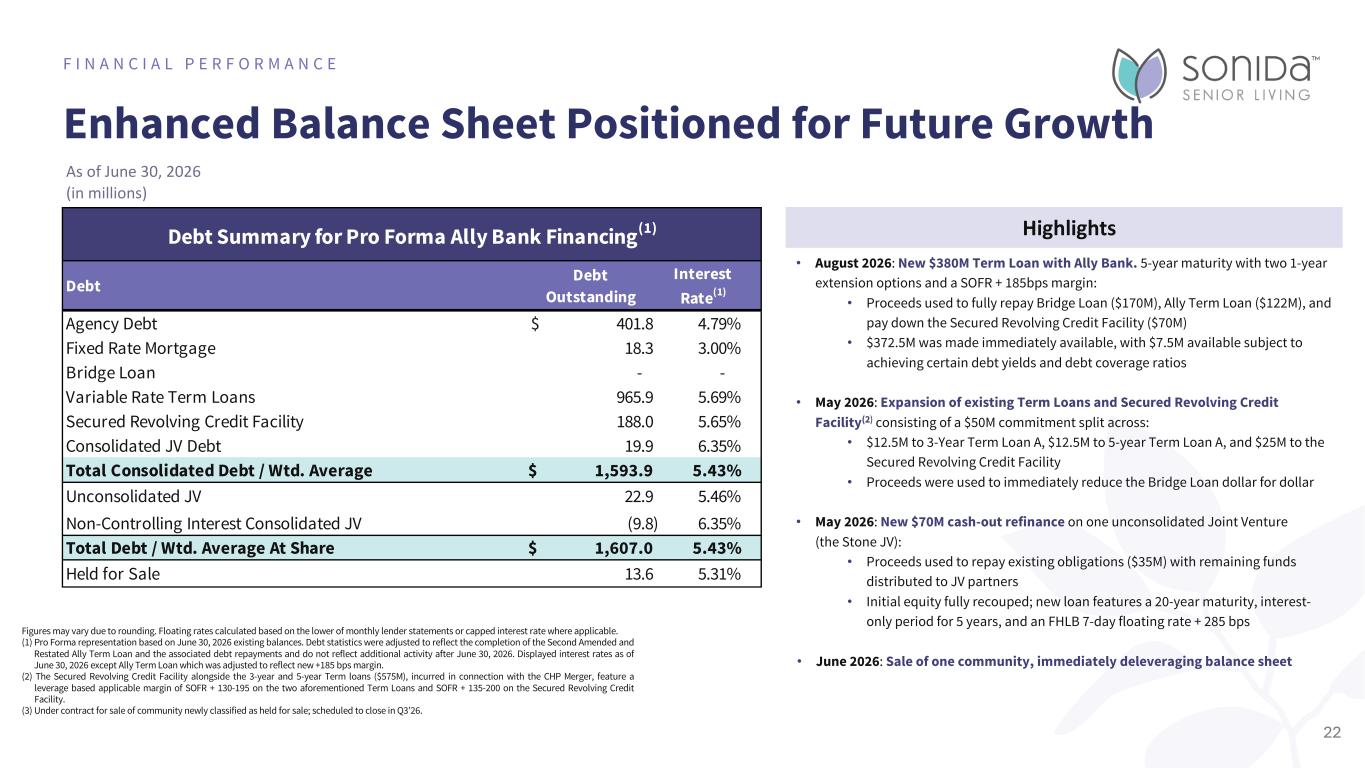
Enhanced Balance Sheet Positioned for Future Growth F I N A N C I A L P E R F O R M A N C E As of June 30, 2026 (in millions) 22 Figures may vary due to rounding. Floating rates calculated based on the lower of monthly lender statements or capped interest rate where applicable. (1) Pro Forma representation based on June 30, 2026 existing balances. Debt statistics were adjusted to reflect the completion of the Second Amended and Restated Ally Term Loan and the associated debt repayments and do not reflect additional activity after June 30, 2026. Displayed interest rates as of June 30, 2026 except Ally Term Loan which was adjusted to reflect new +185 bps margin. (2) The Secured Revolving Credit Facility alongside the 3-year and 5-year Term loans ($575M), incurred in connection with the CHP Merger, feature a leverage based applicable margin of SOFR + 130-195 on the two aforementioned Term Loans and SOFR + 135-200 on the Secured Revolving Credit Facility. (3) Under contract for sale of community newly classified as held for sale; scheduled to close in Q3’26. Highlights • August 2026: New $380M Term Loan with Ally Bank. 5-year maturity with two 1-year extension options and a SOFR + 185bps margin: • Proceeds used to fully repay Bridge Loan ($170M), Ally Term Loan ($122M), and pay down the Secured Revolving Credit Facility ($70M) • $372.5M was made immediately available, with $7.5M available subject to achieving certain debt yields and debt coverage ratios • May 2026: Expansion of existing Term Loans and Secured Revolving Credit Facility(2) consisting of a $50M commitment split across: • $12.5M to 3-Year Term Loan A, $12.5M to 5-year Term Loan A, and $25M to the Secured Revolving Credit Facility • Proceeds were used to immediately reduce the Bridge Loan dollar for dollar • May 2026: New $70M cash-out refinance on one unconsolidated Joint Venture (the Stone JV): • Proceeds used to repay existing obligations ($35M) with remaining funds distributed to JV partners • Initial equity fully recouped; new loan features a 20-year maturity, interest- only period for 5 years, and an FHLB 7-day floating rate + 285 bps • June 2026: Sale of one community, immediately deleveraging balance sheet Debt Debt Outstanding Interest Rate(1) Agency Debt 401.8$ 4.79% Fixed Rate Mortgage 18.3 3.00% Bridge Loan - - Variable Rate Term Loans 965.9 5.69% Secured Revolving Credit Facility 188.0 5.65% Consolidated JV Debt 19.9 6.35% Total Consolidated Debt / Wtd. Average 1,593.9$ 5.43% Unconsolidated JV 22.9 5.46% Non-Controlling Interest Consolidated JV (9.8) 6.35% Total Debt / Wtd. Average At Share 1,607.0$ 5.43% Held for Sale 13.6 5.31% Debt Summary for Pro Forma Ally Bank Financing(1)
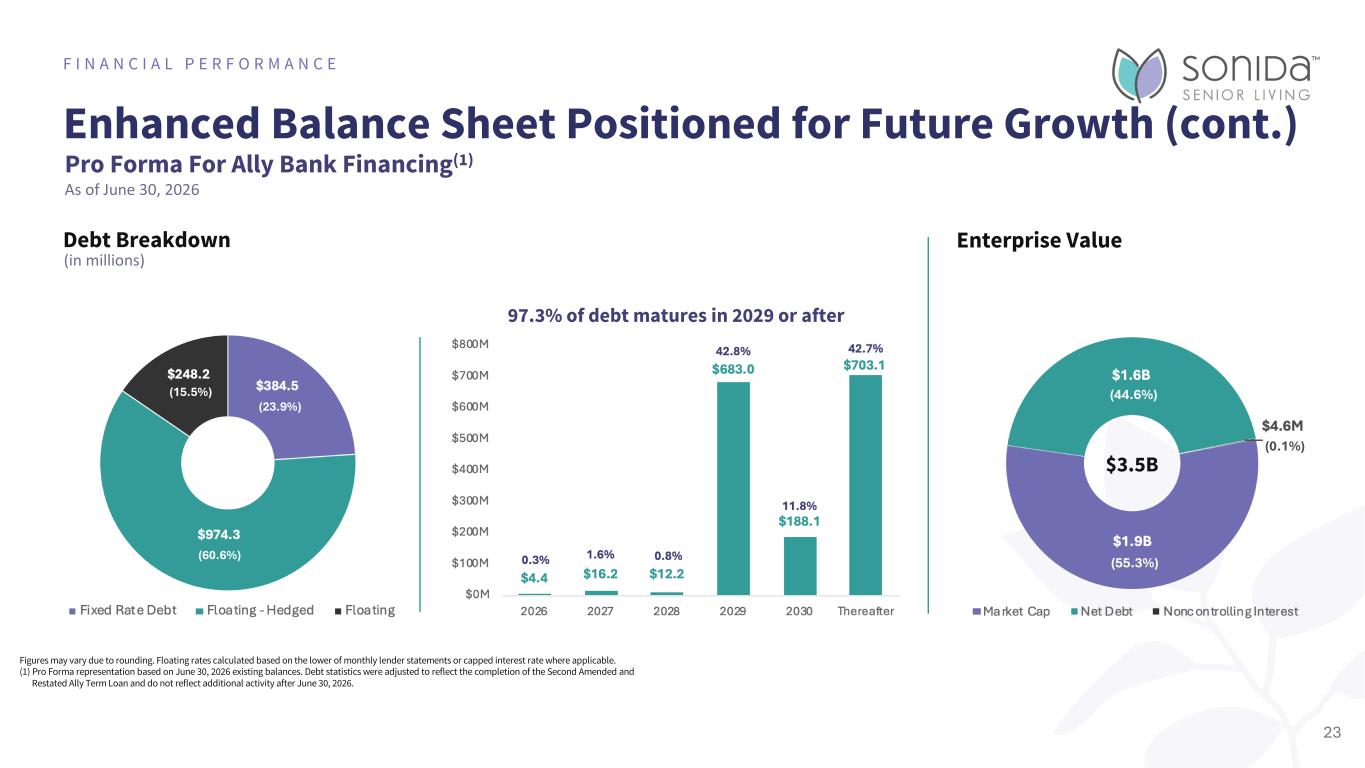
Enhanced Balance Sheet Positioned for Future Growth (cont.) F I N A N C I A L P E R F O R M A N C E 23 Debt Breakdown 97.3% of debt matures in 2029 or after $3.5B (0.1%) (23.9%) (60.6%) (15.5%) Enterprise Value Figures may vary due to rounding. Floating rates calculated based on the lower of monthly lender statements or capped interest rate where applicable. (1) Pro Forma representation based on June 30, 2026 existing balances. Debt statistics were adjusted to reflect the completion of the Second Amended and Restated Ally Term Loan and do not reflect additional activity after June 30, 2026. (in millions) (44.6%) (55.3%) Pro Forma For Ally Bank Financing(1) As of June 30, 2026

Capital Allocation Strategy I N V E S T O R P R E S E N T A T I O N 24The Ashton on Dorsey
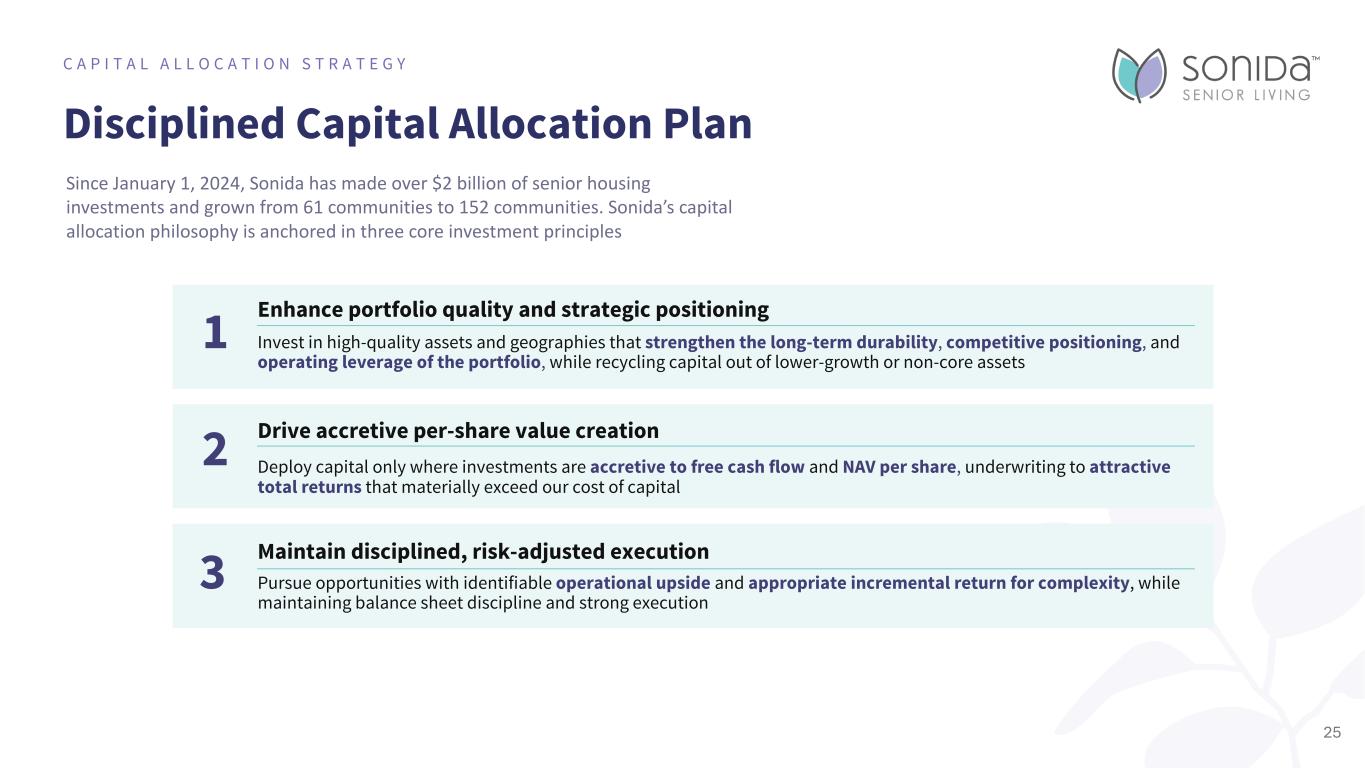
Disciplined Capital Allocation Plan C A P I T A L A L L O C A T I O N S T R A T E G Y Since January 1, 2024, Sonida has made over $2 billion of senior housing investments and grown from 61 communities to 152 communities. Sonida’s capital allocation philosophy is anchored in three core investment principles Enhance portfolio quality and strategic positioning Invest in high-quality assets and geographies that strengthen the long-term durability, competitive positioning, and operating leverage of the portfolio, while recycling capital out of lower-growth or non-core assets Drive accretive per-share value creation Deploy capital only where investments are accretive to free cash flow and NAV per share, underwriting to attractive total returns that materially exceed our cost of capital Maintain disciplined, risk-adjusted execution Pursue opportunities with identifiable operational upside and appropriate incremental return for complexity, while maintaining balance sheet discipline and strong execution 1 2 3 25
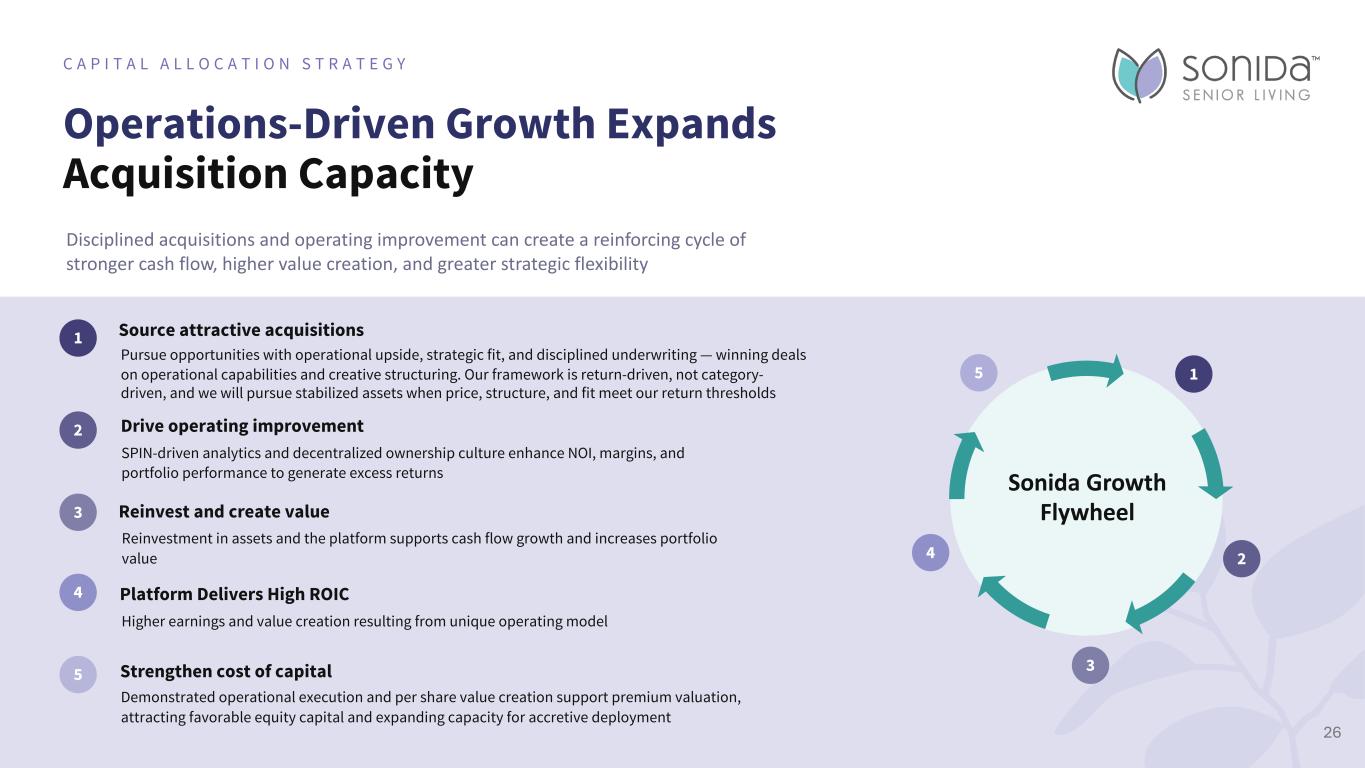
Operations-Driven Growth Expands Acquisition Capacity C A P I T A L A L L O C A T I O N S T R A T E G Y Disciplined acquisitions and operating improvement can create a reinforcing cycle of stronger cash flow, higher value creation, and greater strategic flexibility X X X X Strengthen cost of capital Demonstrated operational execution and per share value creation support premium valuation, attracting favorable equity capital and expanding capacity for accretive deployment 1 Source attractive acquisitions Pursue opportunities with operational upside, strategic fit, and disciplined underwriting — winning deals on operational capabilities and creative structuring. Our framework is return-driven, not category- driven, and we will pursue stabilized assets when price, structure, and fit meet our return thresholds 2 Drive operating improvement SPIN-driven analytics and decentralized ownership culture enhance NOI, margins, and portfolio performance to generate excess returns 3 Reinvest and create value Reinvestment in assets and the platform supports cash flow growth and increases portfolio value 5 Sonida Growth Flywheel Platform Delivers High ROIC Higher earnings and value creation resulting from unique operating model 4 1 2 3 4 5 26
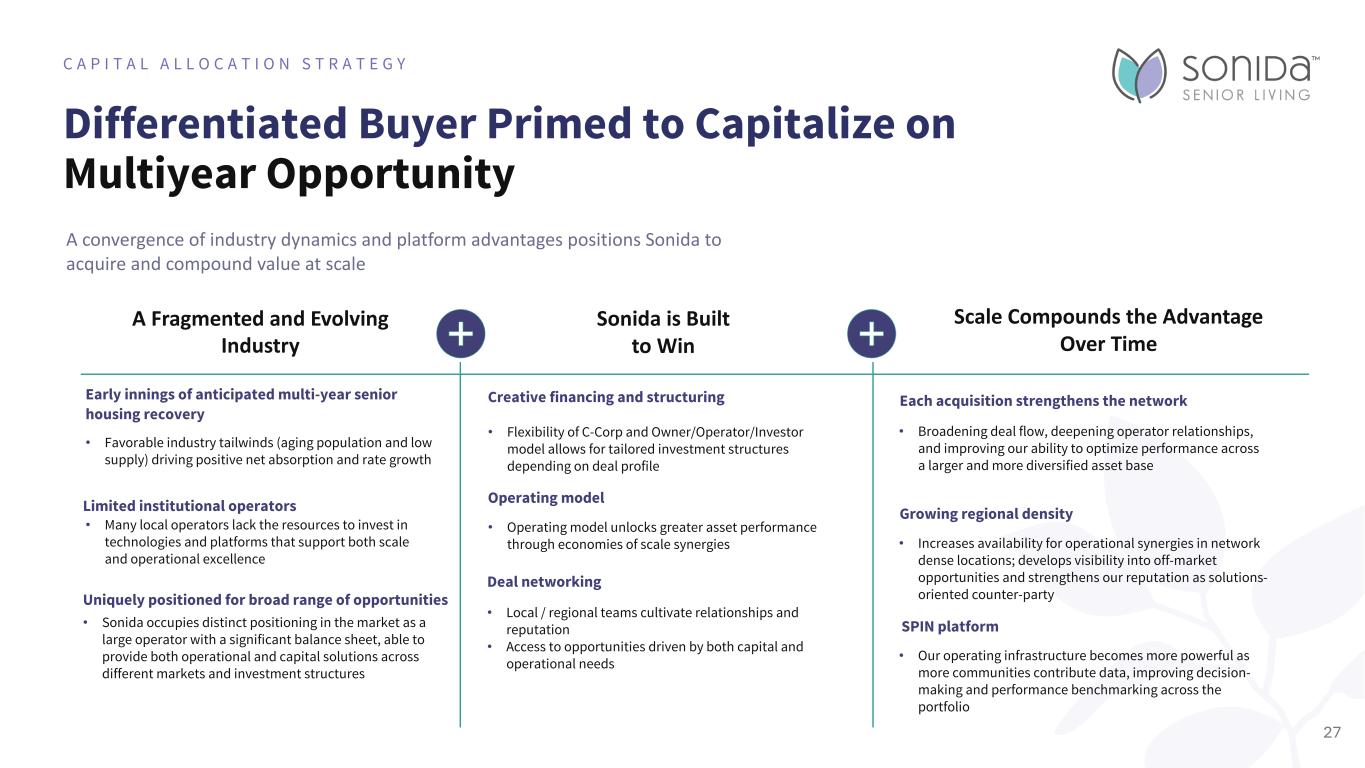
Differentiated Buyer Primed to Capitalize on Multiyear Opportunity C A P I T A L A L L O C A T I O N S T R A T E G Y A Fragmented and Evolving Industry Sonida is Built to Win Limited institutional operators • Many local operators lack the resources to invest in technologies and platforms that support both scale and operational excellence Early innings of anticipated multi-year senior housing recovery • Favorable industry tailwinds (aging population and low supply) driving positive net absorption and rate growth Creative financing and structuring Operating model Deal networking • Flexibility of C-Corp and Owner/Operator/Investor model allows for tailored investment structures depending on deal profile • Local / regional teams cultivate relationships and reputation • Access to opportunities driven by both capital and operational needs • Operating model unlocks greater asset performance through economies of scale synergies Scale Compounds the Advantage Over Time • Broadening deal flow, deepening operator relationships, and improving our ability to optimize performance across a larger and more diversified asset base • Increases availability for operational synergies in network dense locations; develops visibility into off-market opportunities and strengthens our reputation as solutions- oriented counter-party • Our operating infrastructure becomes more powerful as more communities contribute data, improving decision- making and performance benchmarking across the portfolio Uniquely positioned for broad range of opportunities • Sonida occupies distinct positioning in the market as a large operator with a significant balance sheet, able to provide both operational and capital solutions across different markets and investment structures Each acquisition strengthens the network Growing regional density SPIN platform A convergence of industry dynamics and platform advantages positions Sonida to acquire and compound value at scale 27
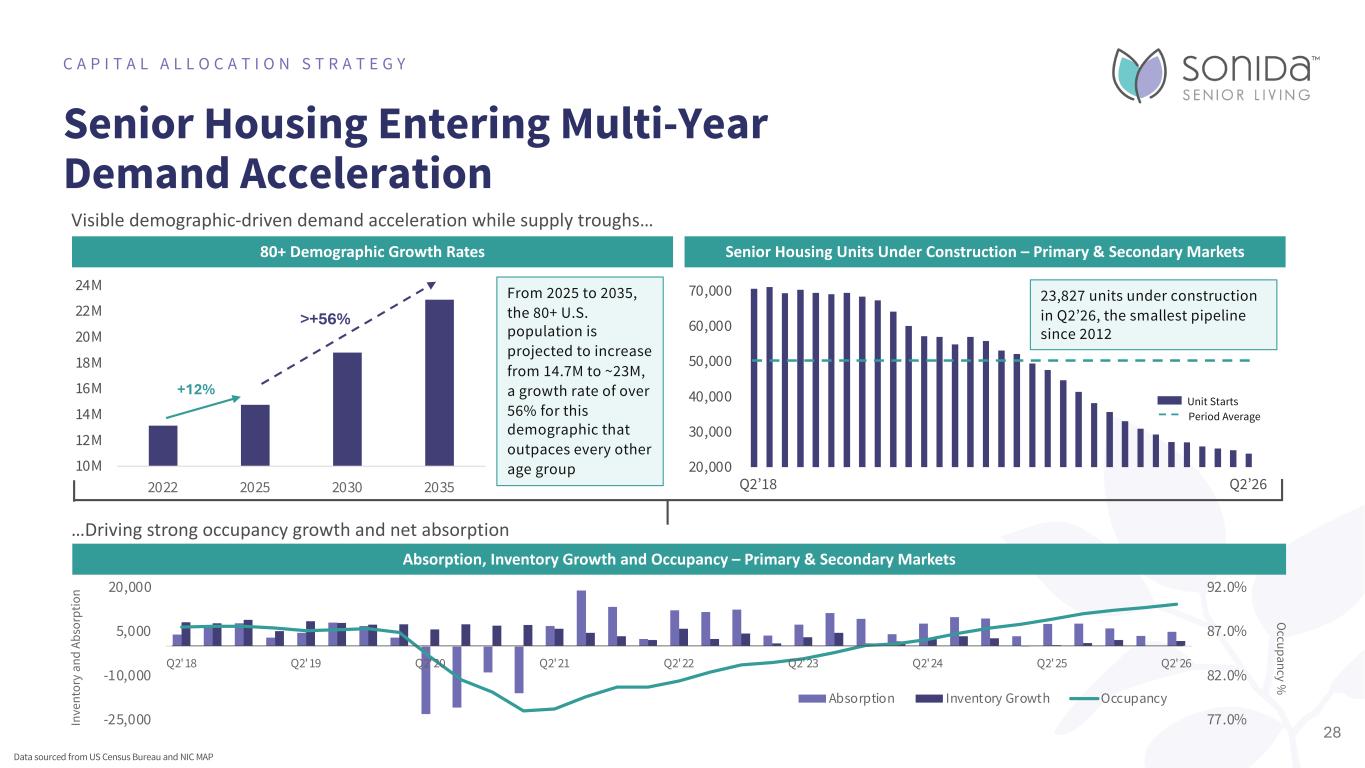
Senior Housing Entering Multi-Year Demand Acceleration C A P I T A L A L L O C A T I O N S T R A T E G Y Visible demographic-driven demand acceleration while supply troughs… Data sourced from US Census Bureau and NIC MAP 80+ Demographic Growth Rates Senior Housing Units Under Construction – Primary & Secondary Markets 20,000 30,000 40,000 50,000 60,000 70,000 Unit Starts Period Average Q2’18 Q2’26 Absorption, Inventory Growth and Occupancy – Primary & Secondary Markets In ve nt or y an d Ab so rp tio n …Driving strong occupancy growth and net absorption O ccupancy % 28 10M 12M 14M 16M 18M 20M 22M 24M 2022 2025 2030 2035 +12% >+56% From 2025 to 2035, the 80+ U.S. population is projected to increase from 14.7M to ~23M, a growth rate of over 56% for this demographic that outpaces every other age group 23,827 units under construction in Q2’26, the smallest pipeline since 2012 77.0% 82.0% 87.0% 92.0% -25,000 -10,000 5,000 20,000 Q2'18 Q2'19 Q2'20 Q2'21 Q2'22 Q2'23 Q2'24 Q2'25 Q2'26 Absorption Inventory Growth Occupancy
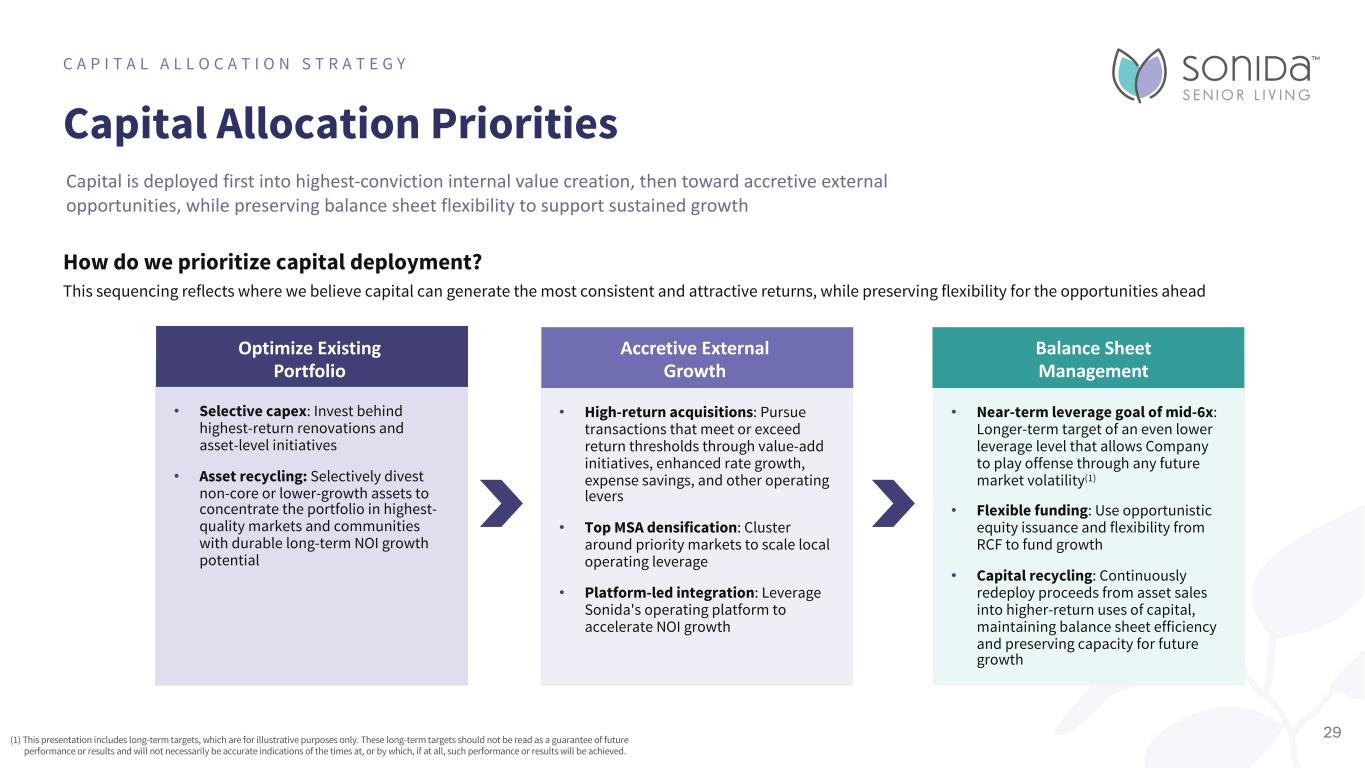
Capital Allocation Priorities C A P I T A L A L L O C A T I O N S T R A T E G Y (1) This presentation includes long-term targets, which are for illustrative purposes only. These long-term targets should not be read as a guarantee of future performance or results and will not necessarily be accurate indications of the times at, or by which, if at all, such performance or results will be achieved. Optimize Existing Portfolio • Selective capex: Invest behind highest-return renovations and asset-level initiatives • Asset recycling: Selectively divest non-core or lower-growth assets to concentrate the portfolio in highest- quality markets and communities with durable long-term NOI growth potential Accretive External Growth • High-return acquisitions: Pursue transactions that meet or exceed return thresholds through value-add initiatives, enhanced rate growth, expense savings, and other operating levers • Top MSA densification: Cluster around priority markets to scale local operating leverage • Platform-led integration: Leverage Sonida's operating platform to accelerate NOI growth Balance Sheet Management • Near-term leverage goal of mid-6x: Longer-term target of an even lower leverage level that allows Company to play offense through any future market volatility(1) • Flexible funding: Use opportunistic equity issuance and flexibility from RCF to fund growth • Capital recycling: Continuously redeploy proceeds from asset sales into higher-return uses of capital, maintaining balance sheet efficiency and preserving capacity for future growth Capital is deployed first into highest-conviction internal value creation, then toward accretive external opportunities, while preserving balance sheet flexibility to support sustained growth How do we prioritize capital deployment? This sequencing reflects where we believe capital can generate the most consistent and attractive returns, while preserving flexibility for the opportunities ahead 29
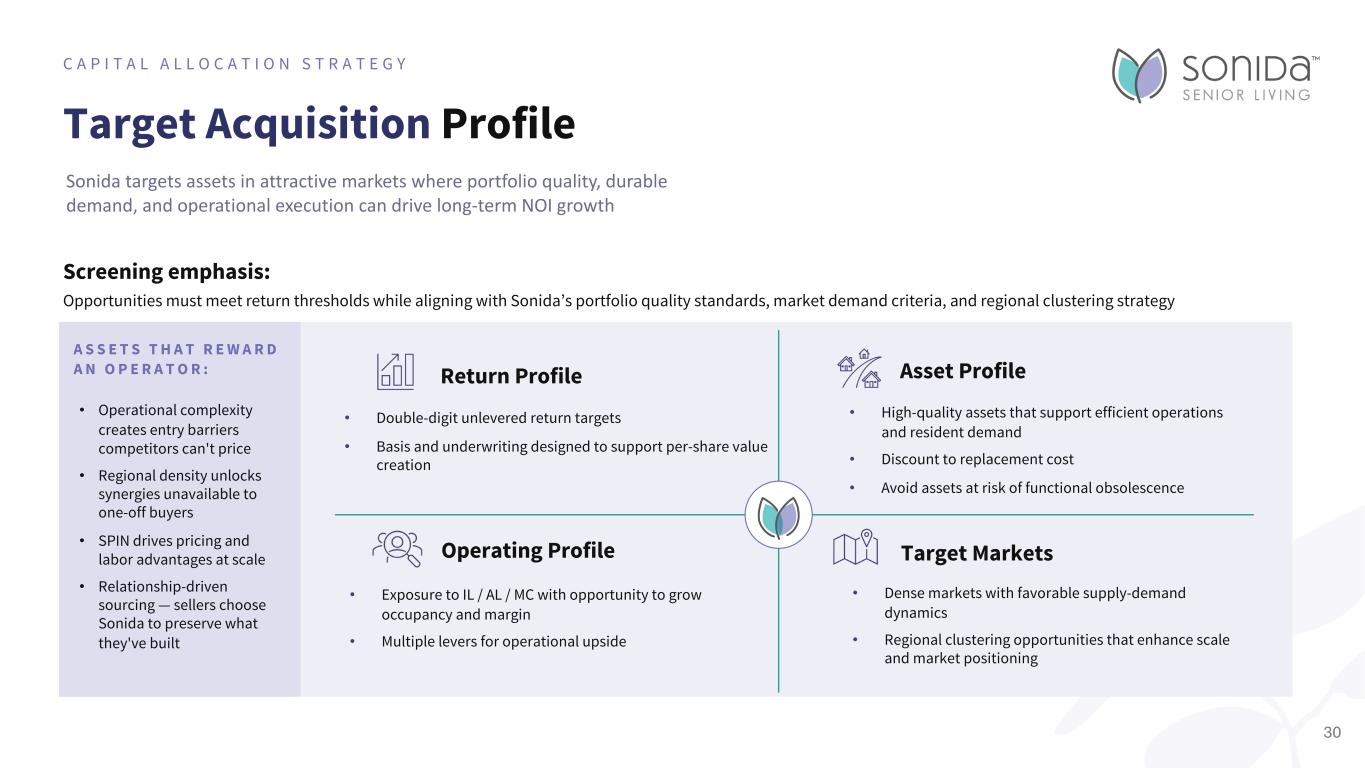
Target Acquisition Profile C A P I T A L A L L O C A T I O N S T R A T E G Y Sonida targets assets in attractive markets where portfolio quality, durable demand, and operational execution can drive long-term NOI growth • Double-digit unlevered return targets • Basis and underwriting designed to support per-share value creation • High-quality assets that support efficient operations and resident demand • Discount to replacement cost • Avoid assets at risk of functional obsolescence • Exposure to IL / AL / MC with opportunity to grow occupancy and margin • Multiple levers for operational upside • Dense markets with favorable supply-demand dynamics • Regional clustering opportunities that enhance scale and market positioning Return Profile Operating Profile Asset Profile Target Markets Screening emphasis: Opportunities must meet return thresholds while aligning with Sonida’s portfolio quality standards, market demand criteria, and regional clustering strategy 30 A S S E T S T H A T R E W A R D A N O P E R A T O R : • Operational complexity creates entry barriers competitors can't price • Regional density unlocks synergies unavailable to one-off buyers • SPIN drives pricing and labor advantages at scale • Relationship-driven sourcing — sellers choose Sonida to preserve what they've built
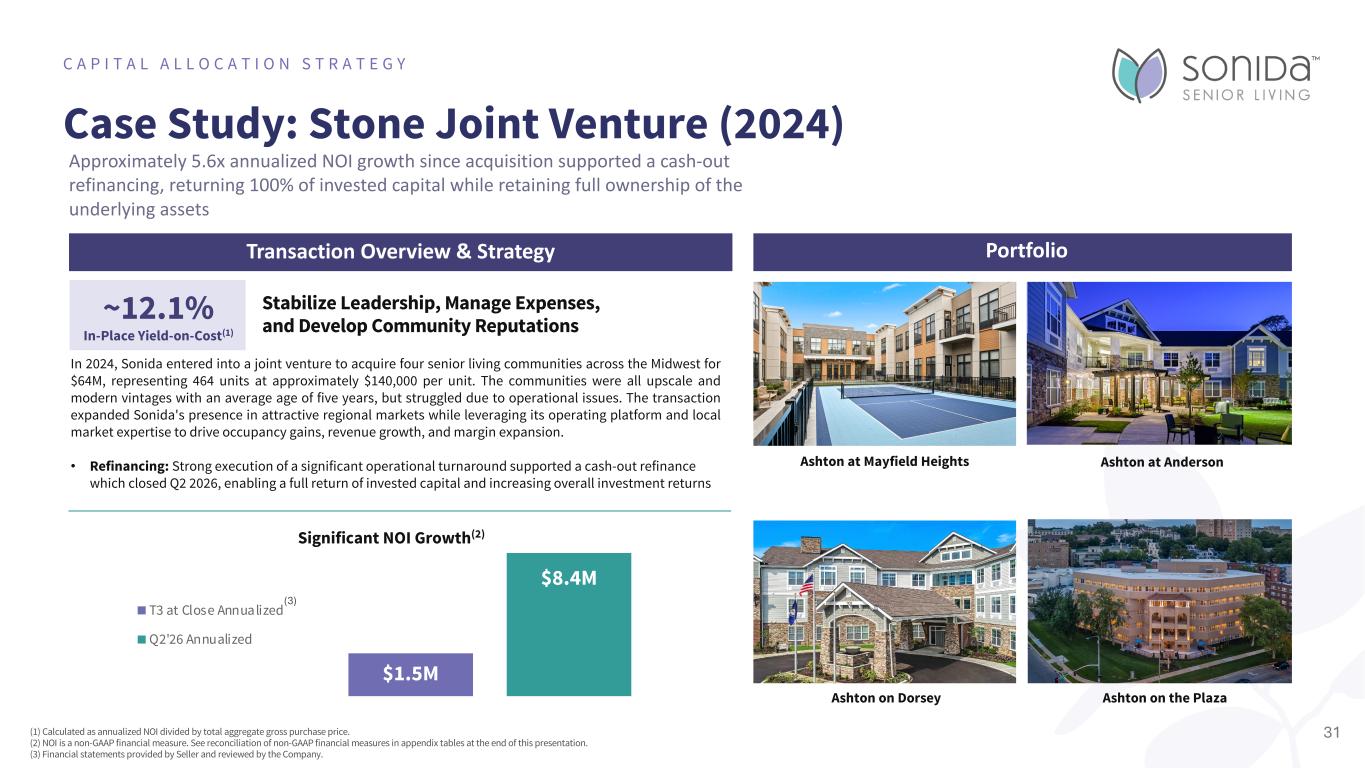
Case Study: Stone Joint Venture (2024) C A P I T A L A L L O C A T I O N S T R A T E G Y Transaction Overview & Strategy Stabilize Leadership, Manage Expenses, and Develop Community Reputations 31 In 2024, Sonida entered into a joint venture to acquire four senior living communities across the Midwest for $64M, representing 464 units at approximately $140,000 per unit. The communities were all upscale and modern vintages with an average age of five years, but struggled due to operational issues. The transaction expanded Sonida's presence in attractive regional markets while leveraging its operating platform and local market expertise to drive occupancy gains, revenue growth, and margin expansion. • Refinancing: Strong execution of a significant operational turnaround supported a cash-out refinance which closed Q2 2026, enabling a full return of invested capital and increasing overall investment returns Ashton at Mayfield Heights Ashton at Anderson Ashton on Dorsey Portfolio ~12.1% In-Place Yield-on-Cost(1) Significant NOI Growth(2) Approximately 5.6x annualized NOI growth since acquisition supported a cash-out refinancing, returning 100% of invested capital while retaining full ownership of the underlying assets Ashton on the Plaza $1.5M $8.4M T3 at Close Annualized Q2'26 Annualized (1) Calculated as annualized NOI divided by total aggregate gross purchase price. (2) NOI is a non-GAAP financial measure. See reconciliation of non-GAAP financial measures in appendix tables at the end of this presentation. (3) Financial statements provided by Seller and reviewed by the Company. (3)
CHP Integration Update I N V E S T O R P R E S E N T A T I O N The Ashton on Dorsey 32Park Place at Winghaven
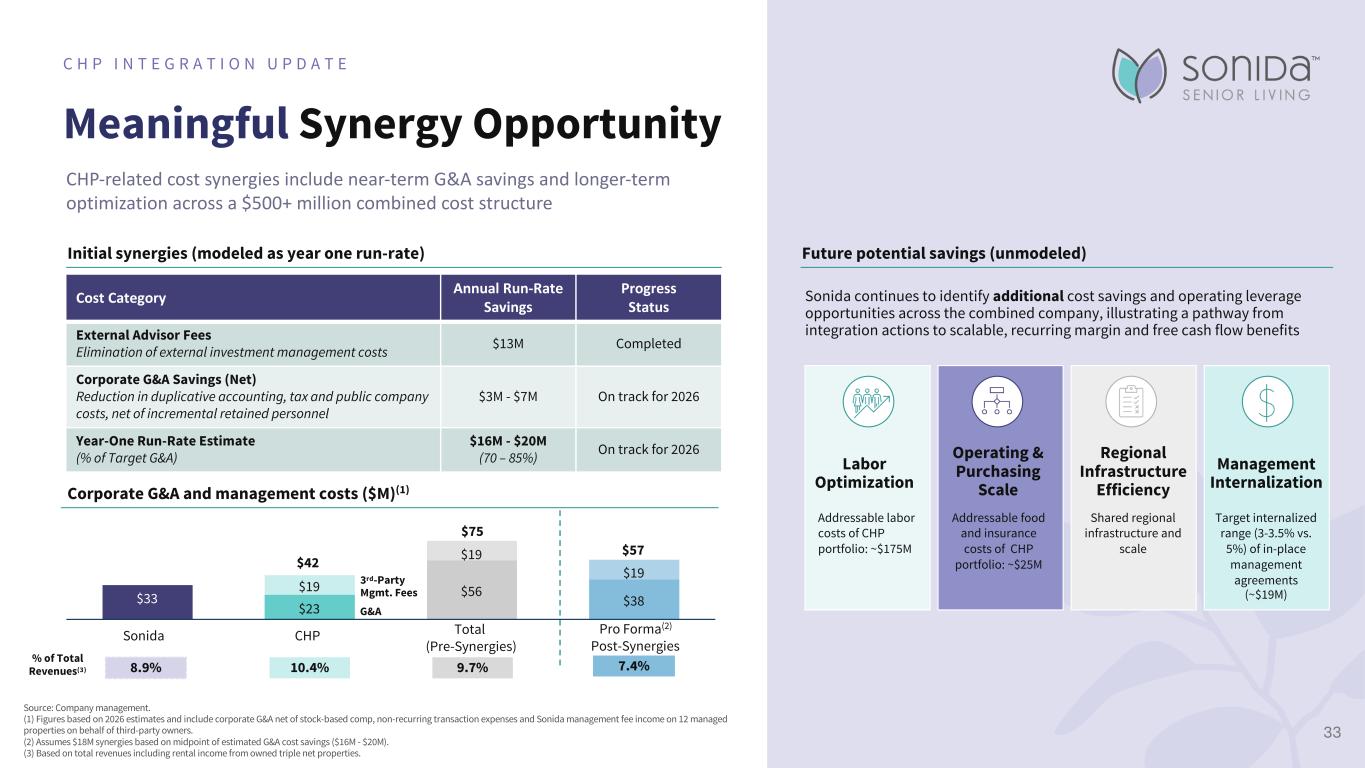
Meaningful Synergy Opportunity C H P I N T E G R A T I O N U P D A T E Source: Company management. (1) Figures based on 2026 estimates and include corporate G&A net of stock-based comp, non-recurring transaction expenses and Sonida management fee income on 12 managed properties on behalf of third-party owners. (2) Assumes $18M synergies based on midpoint of estimated G&A cost savings ($16M - $20M). (3) Based on total revenues including rental income from owned triple net properties. CHP-related cost synergies include near-term G&A savings and longer-term optimization across a $500+ million combined cost structure Cost Category Annual Run-Rate Savings Progress Status External Advisor Fees Elimination of external investment management costs $13M Completed Corporate G&A Savings (Net) Reduction in duplicative accounting, tax and public company costs, net of incremental retained personnel $3M - $7M On track for 2026 Year-One Run-Rate Estimate (% of Target G&A) $16M - $20M (70 – 85%) On track for 2026 Initial synergies (modeled as year one run-rate) 3rd-Party Mgmt. Fees 8.9% 10.4% 9.7% 7.4%% of Total Revenues(3) G&A$23 $56 $38$33 $19 $19 $19 Sonida CHP Total (Pre-Synergies) Pro Forma(2) Post-Synergies $75 $57 $42 Corporate G&A and management costs ($M)(1) Future potential savings (unmodeled) Sonida continues to identify additional cost savings and operating leverage opportunities across the combined company, illustrating a pathway from integration actions to scalable, recurring margin and free cash flow benefits Labor Optimization Operating & Purchasing Scale Regional Infrastructure Efficiency Management Internalization Addressable labor costs of CHP portfolio: ~$175M Addressable food and insurance costs of CHP portfolio: ~$25M Shared regional infrastructure and scale Target internalized range (3-3.5% vs. 5%) of in-place management agreements (~$19M) 33
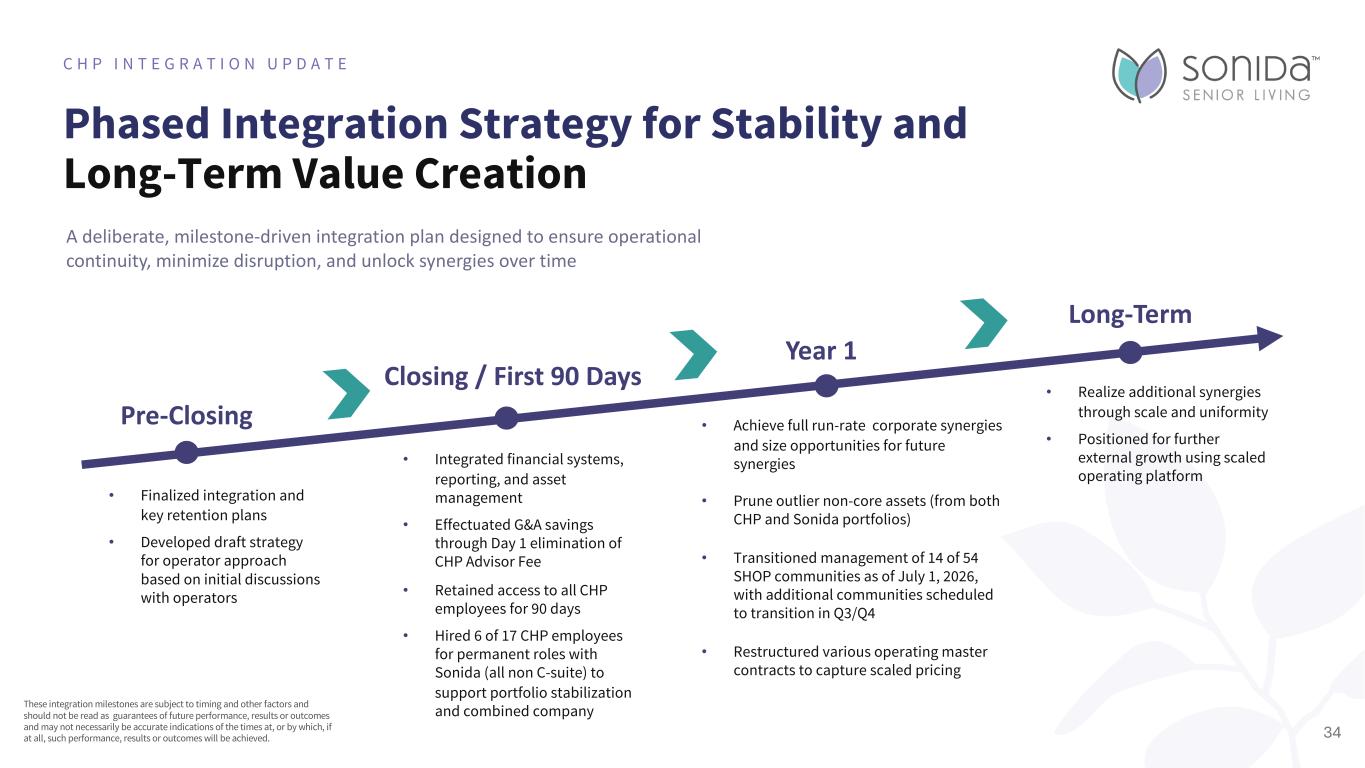
Pre-Closing Closing / First 90 Days Year 1 Long-Term • Finalized integration and key retention plans • Developed draft strategy for operator approach based on initial discussions with operators • Integrated financial systems, reporting, and asset management • Effectuated G&A savings through Day 1 elimination of CHP Advisor Fee • Retained access to all CHP employees for 90 days • Hired 6 of 17 CHP employees for permanent roles with Sonida (all non C-suite) to support portfolio stabilization and combined company • Realize additional synergies through scale and uniformity • Positioned for further external growth using scaled operating platform Phased Integration Strategy for Stability and Long-Term Value Creation C H P I N T E G R A T I O N U P D A T E A deliberate, milestone-driven integration plan designed to ensure operational continuity, minimize disruption, and unlock synergies over time These integration milestones are subject to timing and other factors and should not be read as guarantees of future performance, results or outcomes and may not necessarily be accurate indications of the times at, or by which, if at all, such performance, results or outcomes will be achieved. • Achieve full run-rate corporate synergies and size opportunities for future synergies • Prune outlier non-core assets (from both CHP and Sonida portfolios) • Transitioned management of 14 of 54 SHOP communities as of July 1, 2026, with additional communities scheduled to transition in Q3/Q4 • Restructured various operating master contracts to capture scaled pricing 34
Appendix – Supplemental Information I N V E S T O R P R E S E N T A T I O N The Ashton on Dorsey 35Dogwood F rest
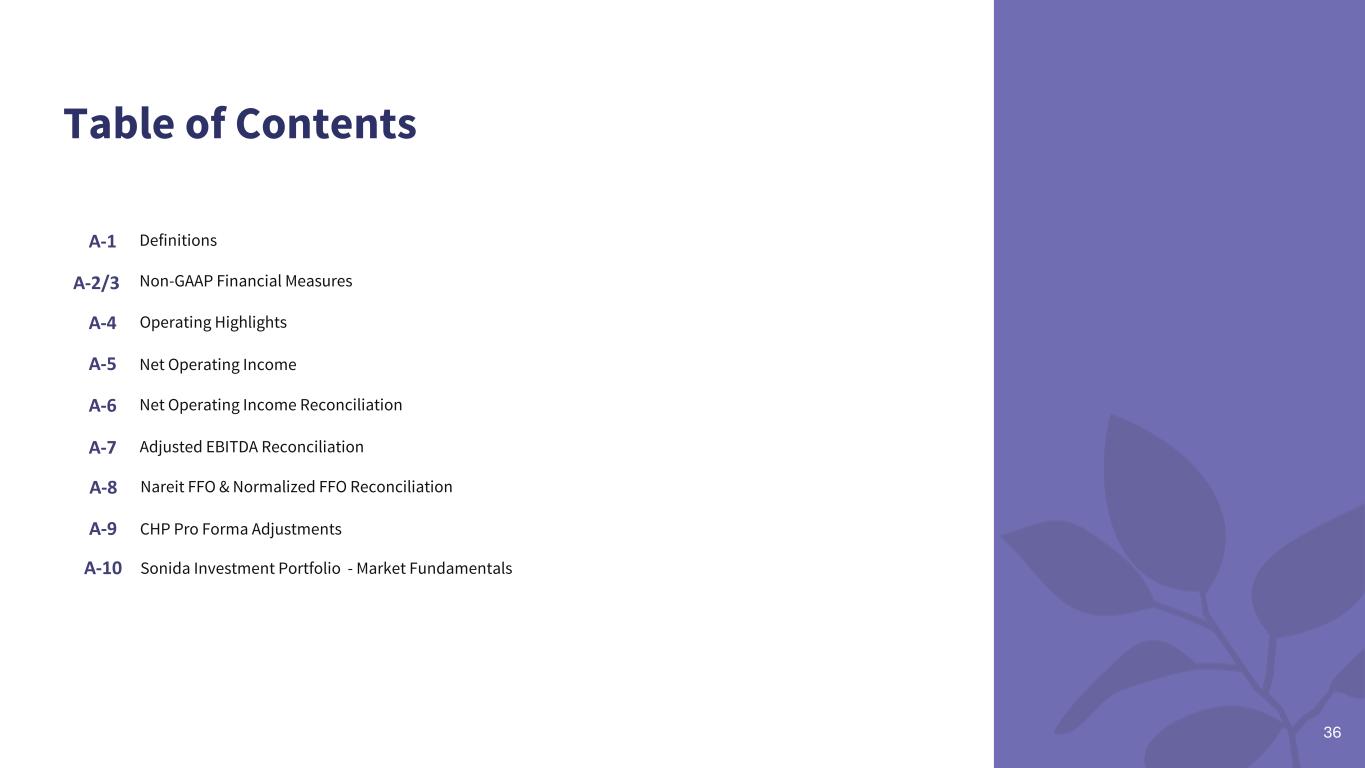
36 Table of Contents Net Operating Income Reconciliation Definitions Non-GAAP Financial Measures A-1 Operating Highlights Net Operating Income Adjusted EBITDA Reconciliation A-2/3 A-4 A-5 A-6 A-7 Nareit FFO & Normalized FFO Reconciliation A-8 CHP Pro Forma AdjustmentsA-9 Sonida Investment Portfolio - Market FundamentalsA-10
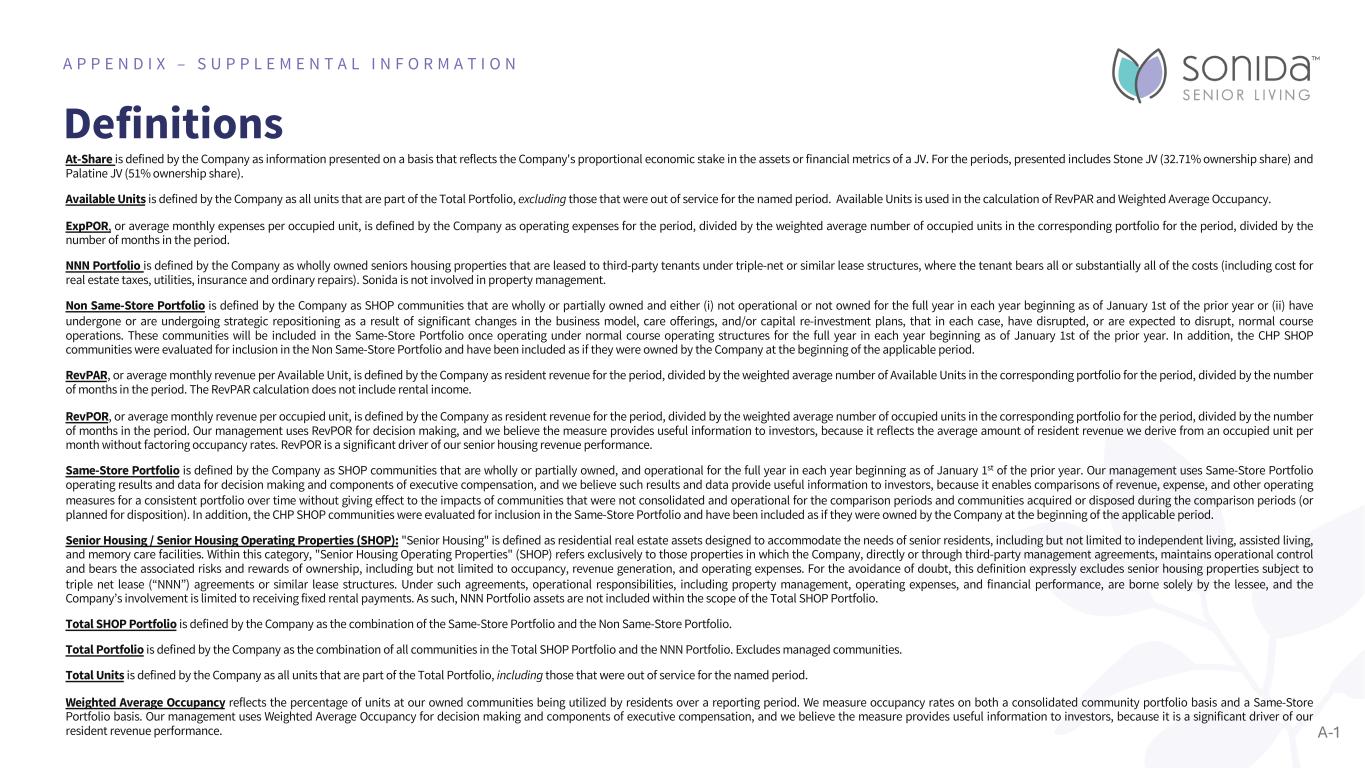
Definitions A P P E N D I X – S U P P L E M E N T A L I N F O R M A T I O N At-Share is defined by the Company as information presented on a basis that reflects the Company's proportional economic stake in the assets or financial metrics of a JV. For the periods, presented includes Stone JV (32.71% ownership share) and Palatine JV (51% ownership share). Available Units is defined by the Company as all units that are part of the Total Portfolio, excluding those that were out of service for the named period. Available Units is used in the calculation of RevPAR and Weighted Average Occupancy. ExpPOR, or average monthly expenses per occupied unit, is defined by the Company as operating expenses for the period, divided by the weighted average number of occupied units in the corresponding portfolio for the period, divided by the number of months in the period. NNN Portfolio is defined by the Company as wholly owned seniors housing properties that are leased to third-party tenants under triple-net or similar lease structures, where the tenant bears all or substantially all of the costs (including cost for real estate taxes, utilities, insurance and ordinary repairs). Sonida is not involved in property management. Non Same-Store Portfolio is defined by the Company as SHOP communities that are wholly or partially owned and either (i) not operational or not owned for the full year in each year beginning as of January 1st of the prior year or (ii) have undergone or are undergoing strategic repositioning as a result of significant changes in the business model, care offerings, and/or capital re-investment plans, that in each case, have disrupted, or are expected to disrupt, normal course operations. These communities will be included in the Same-Store Portfolio once operating under normal course operating structures for the full year in each year beginning as of January 1st of the prior year. In addition, the CHP SHOP communities were evaluated for inclusion in the Non Same-Store Portfolio and have been included as if they were owned by the Company at the beginning of the applicable period. RevPAR, or average monthly revenue per Available Unit, is defined by the Company as resident revenue for the period, divided by the weighted average number of Available Units in the corresponding portfolio for the period, divided by the number of months in the period. The RevPAR calculation does not include rental income. RevPOR, or average monthly revenue per occupied unit, is defined by the Company as resident revenue for the period, divided by the weighted average number of occupied units in the corresponding portfolio for the period, divided by the number of months in the period. Our management uses RevPOR for decision making, and we believe the measure provides useful information to investors, because it reflects the average amount of resident revenue we derive from an occupied unit per month without factoring occupancy rates. RevPOR is a significant driver of our senior housing revenue performance. Same-Store Portfolio is defined by the Company as SHOP communities that are wholly or partially owned, and operational for the full year in each year beginning as of January 1st of the prior year. Our management uses Same-Store Portfolio operating results and data for decision making and components of executive compensation, and we believe such results and data provide useful information to investors, because it enables comparisons of revenue, expense, and other operating measures for a consistent portfolio over time without giving effect to the impacts of communities that were not consolidated and operational for the comparison periods and communities acquired or disposed during the comparison periods (or planned for disposition). In addition, the CHP SHOP communities were evaluated for inclusion in the Same-Store Portfolio and have been included as if they were owned by the Company at the beginning of the applicable period. Senior Housing / Senior Housing Operating Properties (SHOP): "Senior Housing" is defined as residential real estate assets designed to accommodate the needs of senior residents, including but not limited to independent living, assisted living, and memory care facilities. Within this category, "Senior Housing Operating Properties" (SHOP) refers exclusively to those properties in which the Company, directly or through third-party management agreements, maintains operational control and bears the associated risks and rewards of ownership, including but not limited to occupancy, revenue generation, and operating expenses. For the avoidance of doubt, this definition expressly excludes senior housing properties subject to triple net lease (“NNN”) agreements or similar lease structures. Under such agreements, operational responsibilities, including property management, operating expenses, and financial performance, are borne solely by the lessee, and the Company’s involvement is limited to receiving fixed rental payments. As such, NNN Portfolio assets are not included within the scope of the Total SHOP Portfolio. Total SHOP Portfolio is defined by the Company as the combination of the Same-Store Portfolio and the Non Same-Store Portfolio. Total Portfolio is defined by the Company as the combination of all communities in the Total SHOP Portfolio and the NNN Portfolio. Excludes managed communities. Total Units is defined by the Company as all units that are part of the Total Portfolio, including those that were out of service for the named period. Weighted Average Occupancy reflects the percentage of units at our owned communities being utilized by residents over a reporting period. We measure occupancy rates on both a consolidated community portfolio basis and a Same-Store Portfolio basis. Our management uses Weighted Average Occupancy for decision making and components of executive compensation, and we believe the measure provides useful information to investors, because it is a significant driver of our resident revenue performance. A-1
Non-GAAP Financial Measures A P P E N D I X – S U P P L E M E N T A L I N F O R M A T I O N This investor presentation contains the financial measures (1) Net Operating Income (“NOI”), (2) Net Operating Income Margin, (3) Adjusted EBITDA, (4) Adjusted Operating Expenses, (5) Nareit Funds from Operations, (6) Normalized Funds from Operations and Normalized Funds from Operations per share, and (7) Same-Store and Non Same-Store amounts for certain of these metrics, each of which is not calculated in accordance with GAAP. Presentations of these non-GAAP financial measures are intended to aid investors in better understanding the factors and trends affecting the Company’s performance and liquidity. However, investors should not consider these non-GAAP financial measures as a substitute for financial measures determined in accordance with GAAP, including net income (loss), income (loss) from operations, net cash provided by (used in) operating activities or revenue. Investors are cautioned that amounts presented in accordance with the Company’s definitions of these non-GAAP financial measures may not be comparable to similar measures disclosed by other companies because not all companies calculate non-GAAP measures in the same manner. Investors are urged to review the reconciliations of these non-GAAP financial measures from the most comparable financial measures determined in accordance with GAAP, which are included below. Net Operating Income, Net Operating Income Margin, Adjusted EBITDA and Adjusted Operating Expenses have material limitations as performance measures, including the exclusion of certain expenses that are necessary to operate the Company and oversee its communities. Furthermore, such non-GAAP financial measures exclude (i) interest that is necessary to operate the Company’s business under its current financing and capital structure, and (ii) depreciation, amortization, and impairment charges that may represent the wear and tear and/or reduction in value of the Company’s communities and other assets and may be indicative of future needs for capital expenditures. The Company may also incur income/expense similar to those for which adjustments may be made and such income/expense may significantly affect the Company’s operating results. Net Operating Income and Net Operating Income Margin are non-GAAP performance measures that the Company defines as net income (loss) excluding: general and administrative expenses (inclusive of stock-based compensation expense), interest income, interest expense, other income (expense), provision for income taxes, management fee income, and further adjusted to exclude income/expense associated with non-cash, non-operational, transactional, or organizational restructuring items that management does not consider as part of the Company’s underlying core operating performance and that management believes impact the comparability of performance between periods. For the periods presented herein, such other items include depreciation and amortization expense, transaction, transition and restructuring costs, impairment of long-lived assets, gain on extinguishment of debt, loss from equity method investment, casualty loss, non- recurring settlement fees, non-income tax, and non-property tax. Net Operating Income Margin is calculated by dividing Net Operating Income by resident revenue. The Company presents these non-GAAP measures on a Total Portfolio, Same- Store, Non Same-Store and At-Share basis. In addition, for periods presented in which we did not own CHP during the full period, includes an adjustment representing the impact to NOI and NOI margin from CHP (calculated on the same basis as the Company) for the applicable period as if the Company had acquired CHP on the first day of such period. Adjusted EBITDA is a non-GAAP performance measure that the Company defines as net income (loss) excluding: depreciation and amortization expense, interest income, interest expense, gain on extinguishment of debt, other expense/income, provision for income taxes; and further adjusted to exclude income/expense associated with non-cash, non-operational, transactional, or organizational restructuring items that management does not consider as part of the Company’s underlying core operating performance and that management believes impact the comparability of performance between periods. For the periods presented herein, such other items include stock-based compensation expense, provision for credit losses, long-lived asset impairment, casualty losses, and transaction, transition and restructuring costs. The Company presents this non-GAAP measure on an at-share basis. In addition, for periods presented in which we did not own CHP during the full period, includes an adjustment representing the impact to Adjusted EBITDA from CHP (calculated on the same basis as the Company) for the applicable period as if the Company had acquired CHP on the first day of such period. Adjusted Operating Expenses is a non-GAAP performance measure that the Company defines as operating expenses excluding professional fees, settlement expense, income tax, personal property tax, casualty gains and losses, and other expenses (corporate operating expenses not allocated to the communities). The Company believes that presentation of Net Operating Income and Net Operating Income Margin as performance measures is useful to investors because such measures are some of the metrics used by the Company’s management to evaluate the performance of the Company’s owned portfolio of communities, to review the Company’s comparable historic and prospective core operating performance of the Company’s owned communities, and to make day-to-day operating decisions. The Company also believes that the presentation of such non-GAAP financial measures and Adjusted EBITDA is useful to investors because such measures provide an assessment of operational factors that management can impact in the short-term, primarily revenues and the controllable cost structure of the organization, by eliminating items related to the Company’s financing and capital structure and other items that management does not consider as part of the Company’s underlying core operating performance and that management believes impact the comparability of performance between periods. Funds from operations (“FFO”), established by the National Association of Real Estate Investment Trusts (“Nareit” and “Nareit FFO”) is a non-GAAP performance measure the Company uses which is defined as net income (loss) attributable to common shareholders (calculated in accordance with GAAP) excluding depreciation and amortization related to real estate, gains and losses from the sale of certain real estate assets, gains and losses from change in control, and impairment write- downs of certain real estate assets and investments in entities when the when the impairment is directly attributable to decreases in the value of depreciable real estate held by the entity. The Company defines Normalized FFO as Nareit FFO excluding other income (expense), net, transaction, transition and restructuring costs, net, expenses or recoveries related to significant disruptive events and casualty losses, non-recurring settlement fees, gains of extinguishment of debt, net, gains and losses on derivatives, net and changes in the fair value of financial instruments, and other normalized items related to noncontrolling interests and unconsolidated entities. Normalized FFO per share is calculated by dividing Normalized FFO by total weighted average diluted shares outstanding. A-2
Non-GAAP Financial Measures (cont.) A P P E N D I X – S U P P L E M E N T A L I N F O R M A T I O N A-3 Historical cost accounting for real estate assets implicitly assumes that the value of real estate assets diminish predictably over time. However, since real estate values historically have risen or fallen with market conditions, many industry investors deem presentations of operating results for real estate companies that use historical cost accounting to be insufficient by themselves. For that reason, the Company considers Nareit FFO and Normalized FFO to be appropriate supplemental measures of operating performance. Nareit FFO and Normalized FFO presented herein may not be comparable to those presented by other companies, which may define similarly titled measures differently than the Company does. Nareit FFO and Normalized FFO should not be considered as alternatives to net income attributable to common stockholders (determined in accordance with GAAP) as indicators of the Company’s financial performance or as alternatives to cash flow from operating activities (determined in accordance with GAAP) as measures of the Company’s liquidity, nor are they necessarily indicative of sufficient cash flow to fund all of the Company’s needs. The Company believes that in order to facilitate a clear understanding of the consolidated historical operating results of the Company, Nareit FFO and Normalized FFO should be examined in conjunction with net income attributable to common stockholders as presented elsewhere herein.
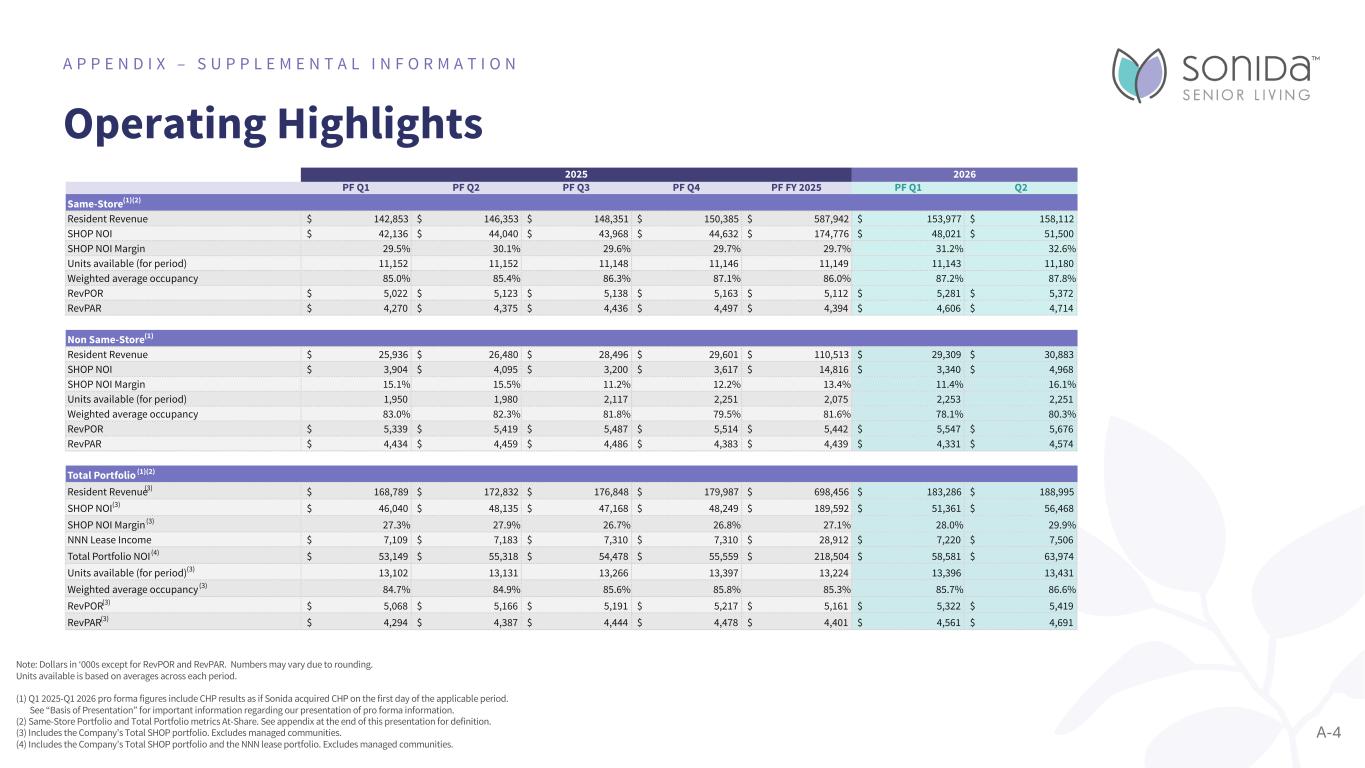
PF Q1 PF Q2 PF Q3 PF Q4 PF FY 2025 PF Q1 Q2 Same-Store(1)(2) Resident Revenue 142,853$ 146,353$ 148,351$ 150,385$ 587,942$ 153,977$ 158,112$ SHOP NOI 42,136$ 44,040$ 43,968$ 44,632$ 174,776$ 48,021$ 51,500$ SHOP NOI Margin 29.5% 30.1% 29.6% 29.7% 29.7% 31.2% 32.6% Units available (for period) 11,152 11,152 11,148 11,146 11,149 11,143 11,180 Weighted average occupancy 85.0% 85.4% 86.3% 87.1% 86.0% 87.2% 87.8% RevPOR 5,022$ 5,123$ 5,138$ 5,163$ 5,112$ 5,281$ 5,372$ RevPAR 4,270$ 4,375$ 4,436$ 4,497$ 4,394$ 4,606$ 4,714$ Non Same-Store(1) Resident Revenue 25,936$ 26,480$ 28,496$ 29,601$ 110,513$ 29,309$ 30,883$ SHOP NOI 3,904$ 4,095$ 3,200$ 3,617$ 14,816$ 3,340$ 4,968$ SHOP NOI Margin 15.1% 15.5% 11.2% 12.2% 13.4% 11.4% 16.1% Units available (for period) 1,950 1,980 2,117 2,251 2,075 2,253 2,251 Weighted average occupancy 83.0% 82.3% 81.8% 79.5% 81.6% 78.1% 80.3% RevPOR 5,339$ 5,419$ 5,487$ 5,514$ 5,442$ 5,547$ 5,676$ RevPAR 4,434$ 4,459$ 4,486$ 4,383$ 4,439$ 4,331$ 4,574$ Total Portfolio (1)(2) Resident Revenue(3) 168,789$ 172,832$ 176,848$ 179,987$ 698,456$ 183,286$ 188,995$ SHOP NOI(3) 46,040$ 48,135$ 47,168$ 48,249$ 189,592$ 51,361$ 56,468$ SHOP NOI Margin (3) 27.3% 27.9% 26.7% 26.8% 27.1% 28.0% 29.9% NNN Lease Income 7,109$ 7,183$ 7,310$ 7,310$ 28,912$ 7,220$ 7,506$ Total Portfolio NOI (4) 53,149$ 55,318$ 54,478$ 55,559$ 218,504$ 58,581$ 63,974$ Units available (for period)(3) 13,102 13,131 13,266 13,397 13,224 13,396 13,431 Weighted average occupancy (3) 84.7% 84.9% 85.6% 85.8% 85.3% 85.7% 86.6% RevPOR(3) 5,068$ 5,166$ 5,191$ 5,217$ 5,161$ 5,322$ 5,419$ RevPAR(3) 4,294$ 4,387$ 4,444$ 4,478$ 4,401$ 4,561$ 4,691$ 2025 2026 Operating Highlights A P P E N D I X – S U P P L E M E N T A L I N F O R M A T I O N Note: Dollars in ‘000s except for RevPOR and RevPAR. Numbers may vary due to rounding. Units available is based on averages across each period. (1) Q1 2025-Q1 2026 pro forma figures include CHP results as if Sonida acquired CHP on the first day of the applicable period. See “Basis of Presentation” for important information regarding our presentation of pro forma information. (2) Same-Store Portfolio and Total Portfolio metrics At-Share. See appendix at the end of this presentation for definition. (3) Includes the Company’s Total SHOP portfolio. Excludes managed communities. (4) Includes the Company’s Total SHOP portfolio and the NNN lease portfolio. Excludes managed communities. A-4
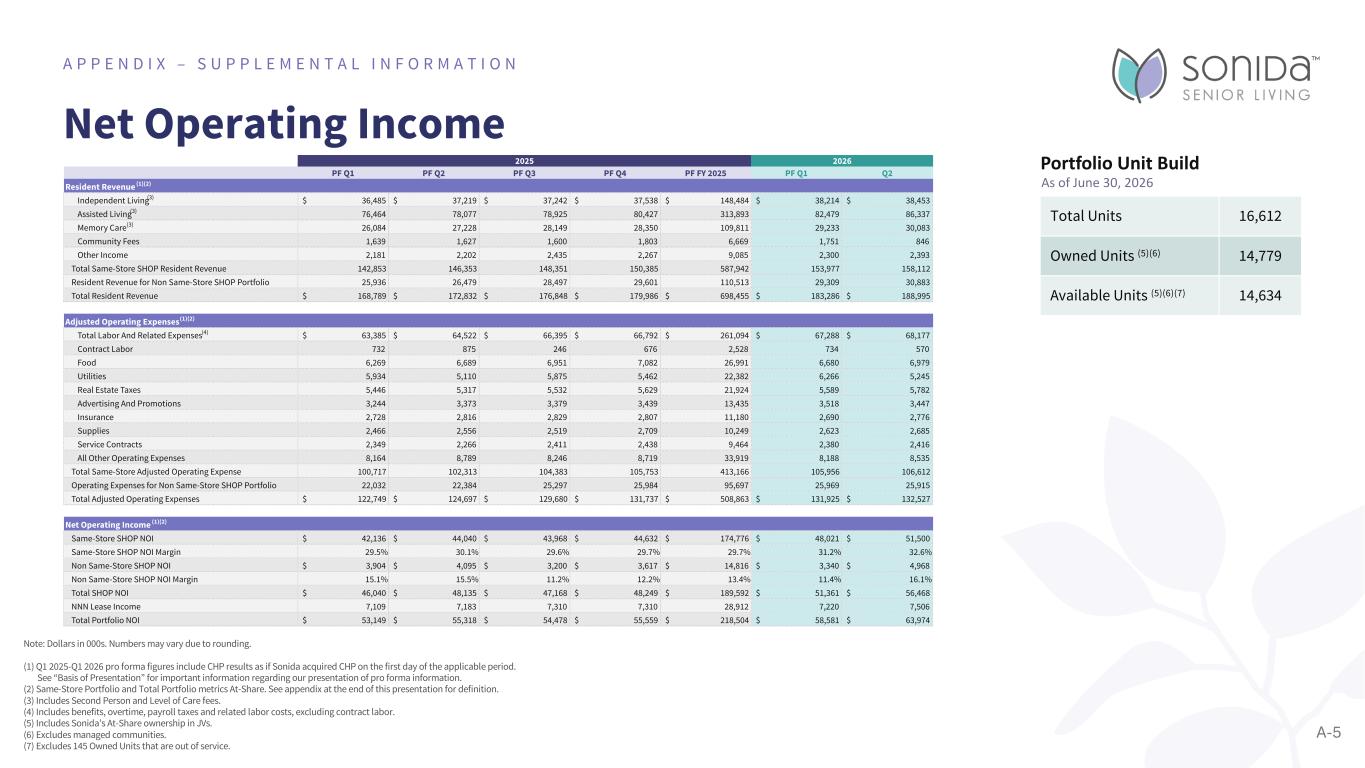
PF Q1 PF Q2 PF Q3 PF Q4 PF FY 2025 PF Q1 Q2 Resident Revenue (1)(2) Independent Living(3) 36,485$ 37,219$ 37,242$ 37,538$ 148,484$ 38,214$ 38,453$ Assisted Living(3) 76,464 78,077 78,925 80,427 313,893 82,479 86,337 Memory Care(3) 26,084 27,228 28,149 28,350 109,811 29,233 30,083 Community Fees 1,639 1,627 1,600 1,803 6,669 1,751 846 Other Income 2,181 2,202 2,435 2,267 9,085 2,300 2,393 Total Same-Store SHOP Resident Revenue 142,853 146,353 148,351 150,385 587,942 153,977 158,112 Resident Revenue for Non Same-Store SHOP Portfolio 25,936 26,479 28,497 29,601 110,513 29,309 30,883 Total Resident Revenue 168,789$ 172,832$ 176,848$ 179,986$ 698,455$ 183,286$ 188,995$ Adjusted Operating Expenses(1)(2) Total Labor And Related Expenses(4) 63,385$ 64,522$ 66,395$ 66,792$ 261,094$ 67,288$ 68,177$ Contract Labor 732 875 246 676 2,528 734 570 Food 6,269 6,689 6,951 7,082 26,991 6,680 6,979 Utilities 5,934 5,110 5,875 5,462 22,382 6,266 5,245 Real Estate Taxes 5,446 5,317 5,532 5,629 21,924 5,589 5,782 Advertising And Promotions 3,244 3,373 3,379 3,439 13,435 3,518 3,447 Insurance 2,728 2,816 2,829 2,807 11,180 2,690 2,776 Supplies 2,466 2,556 2,519 2,709 10,249 2,623 2,685 Service Contracts 2,349 2,266 2,411 2,438 9,464 2,380 2,416 All Other Operating Expenses 8,164 8,789 8,246 8,719 33,919 8,188 8,535 Total Same-Store Adjusted Operating Expense 100,717 102,313 104,383 105,753 413,166 105,956 106,612 Operating Expenses for Non Same-Store SHOP Portfolio 22,032 22,384 25,297 25,984 95,697 25,969 25,915 Total Adjusted Operating Expenses 122,749$ 124,697$ 129,680$ 131,737$ 508,863$ 131,925$ 132,527$ Net Operating Income (1)(2) Same-Store SHOP NOI 42,136$ 44,040$ 43,968$ 44,632$ 174,776$ 48,021$ 51,500$ Same-Store SHOP NOI Margin 29.5% 30.1% 29.6% 29.7% 29.7% 31.2% 32.6% Non Same-Store SHOP NOI 3,904$ 4,095$ 3,200$ 3,617$ 14,816$ 3,340$ 4,968$ Non Same-Store SHOP NOI Margin 15.1% 15.5% 11.2% 12.2% 13.4% 11.4% 16.1% Total SHOP NOI 46,040$ 48,135$ 47,168$ 48,249$ 189,592$ 51,361$ 56,468$ NNN Lease Income 7,109 7,183 7,310 7,310 28,912 7,220 7,506 Total Portfolio NOI 53,149$ 55,318$ 54,478$ 55,559$ 218,504$ 58,581$ 63,974$ 2025 2026 Net Operating Income A P P E N D I X – S U P P L E M E N T A L I N F O R M A T I O N Note: Dollars in 000s. Numbers may vary due to rounding. (1) Q1 2025-Q1 2026 pro forma figures include CHP results as if Sonida acquired CHP on the first day of the applicable period. See “Basis of Presentation” for important information regarding our presentation of pro forma information. (2) Same-Store Portfolio and Total Portfolio metrics At-Share. See appendix at the end of this presentation for definition. (3) Includes Second Person and Level of Care fees. (4) Includes benefits, overtime, payroll taxes and related labor costs, excluding contract labor. (5) Includes Sonida’s At-Share ownership in JVs. (6) Excludes managed communities. (7) Excludes 145 Owned Units that are out of service. Total Units 16,612 Owned Units (5)(6) 14,779 Available Units (5)(6)(7) 14,634 Portfolio Unit Build A-5 As of June 30, 2026
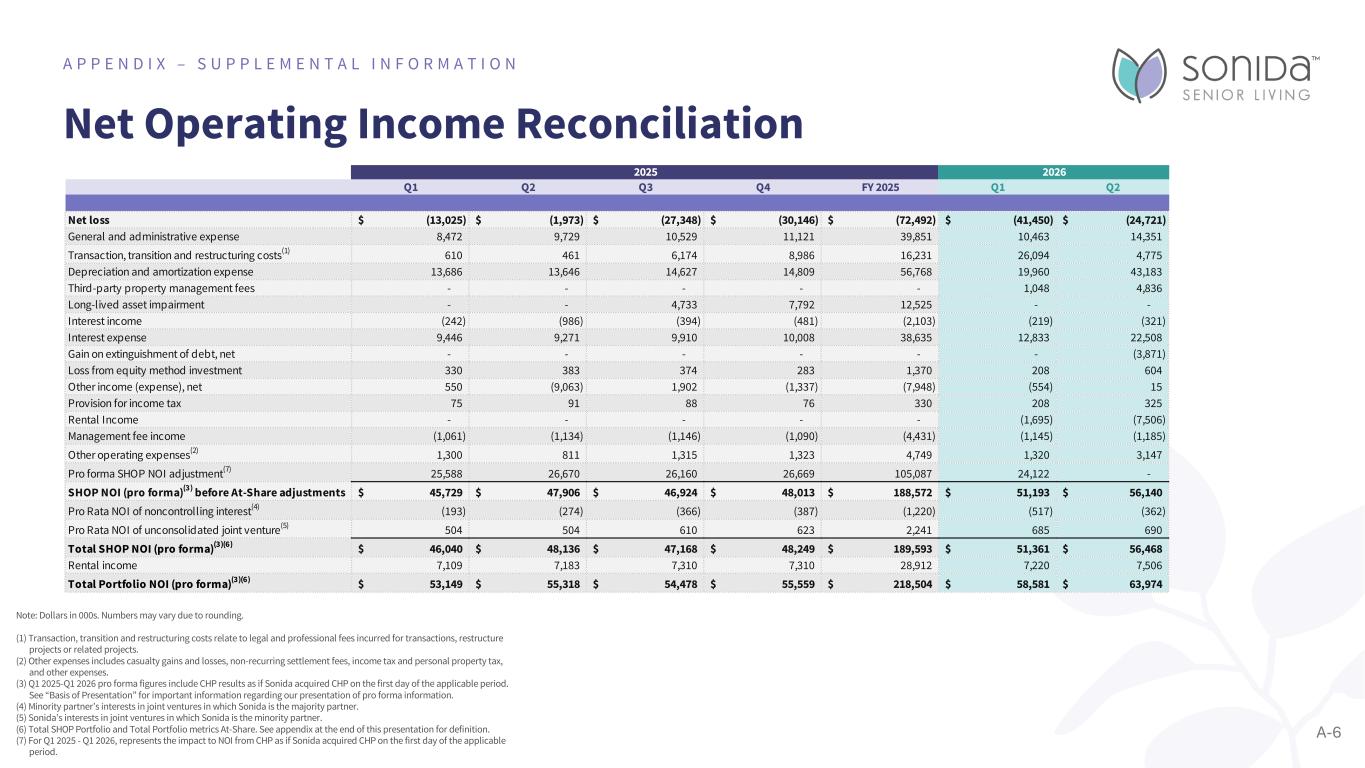
Net Operating Income Reconciliation A P P E N D I X – S U P P L E M E N T A L I N F O R M A T I O N Note: Dollars in 000s. Numbers may vary due to rounding. (1) Transaction, transition and restructuring costs relate to legal and professional fees incurred for transactions, restructure projects or related projects. (2) Other expenses includes casualty gains and losses, non-recurring settlement fees, income tax and personal property tax, and other expenses. (3) Q1 2025-Q1 2026 pro forma figures include CHP results as if Sonida acquired CHP on the first day of the applicable period. See “Basis of Presentation” for important information regarding our presentation of pro forma information. (4) Minority partner’s interests in joint ventures in which Sonida is the majority partner. (5) Sonida’s interests in joint ventures in which Sonida is the minority partner. (6) Total SHOP Portfolio and Total Portfolio metrics At-Share. See appendix at the end of this presentation for definition. (7) For Q1 2025 - Q1 2026, represents the impact to NOI from CHP as if Sonida acquired CHP on the first day of the applicable period. A-6 Q1 Q2 Q3 Q4 FY 2025 Q1 Q2 Net loss (13,025)$ (1,973)$ (27,348)$ (30,146)$ (72,492)$ (41,450)$ (24,721)$ General and administrative expense 8,472 9,729 10,529 11,121 39,851 10,463 14,351 Transaction, transition and restructuring costs(1) 610 461 6,174 8,986 16,231 26,094 4,775 Depreciation and amortization expense 13,686 13,646 14,627 14,809 56,768 19,960 43,183 Third-party property management fees - - - - - 1,048 4,836 Long-lived asset impairment - - 4,733 7,792 12,525 - - Interest income (242) (986) (394) (481) (2,103) (219) (321) Interest expense 9,446 9,271 9,910 10,008 38,635 12,833 22,508 Gain on extinguishment of debt, net - - - - - - (3,871) Loss from equity method investment 330 383 374 283 1,370 208 604 Other income (expense), net 550 (9,063) 1,902 (1,337) (7,948) (554) 15 Provision for income tax 75 91 88 76 330 208 325 Rental Income - - - - - (1,695) (7,506) Management fee income (1,061) (1,134) (1,146) (1,090) (4,431) (1,145) (1,185) Other operating expenses(2) 1,300 811 1,315 1,323 4,749 1,320 3,147 Pro forma SHOP NOI adjustment(7) 25,588 26,670 26,160 26,669 105,087 24,122 - SHOP NOI (pro forma)(3) before At-Share adjustments 45,729$ 47,906$ 46,924$ 48,013$ 188,572$ 51,193$ 56,140$ Pro Rata NOI of noncontrolling interest(4) (193) (274) (366) (387) (1,220) (517) (362) Pro Rata NOI of unconsolidated joint venture(5) 504 504 610 623 2,241 685 690 Total SHOP NOI (pro forma)(3)(6) 46,040$ 48,136$ 47,168$ 48,249$ 189,593$ 51,361$ 56,468$ Rental income 7,109 7,183 7,310 7,310 28,912 7,220 7,506 Total Portfolio NOI (pro forma)(3)(6) 53,149$ 55,318$ 54,478$ 55,559$ 218,504$ 58,581$ 63,974$ 20262025
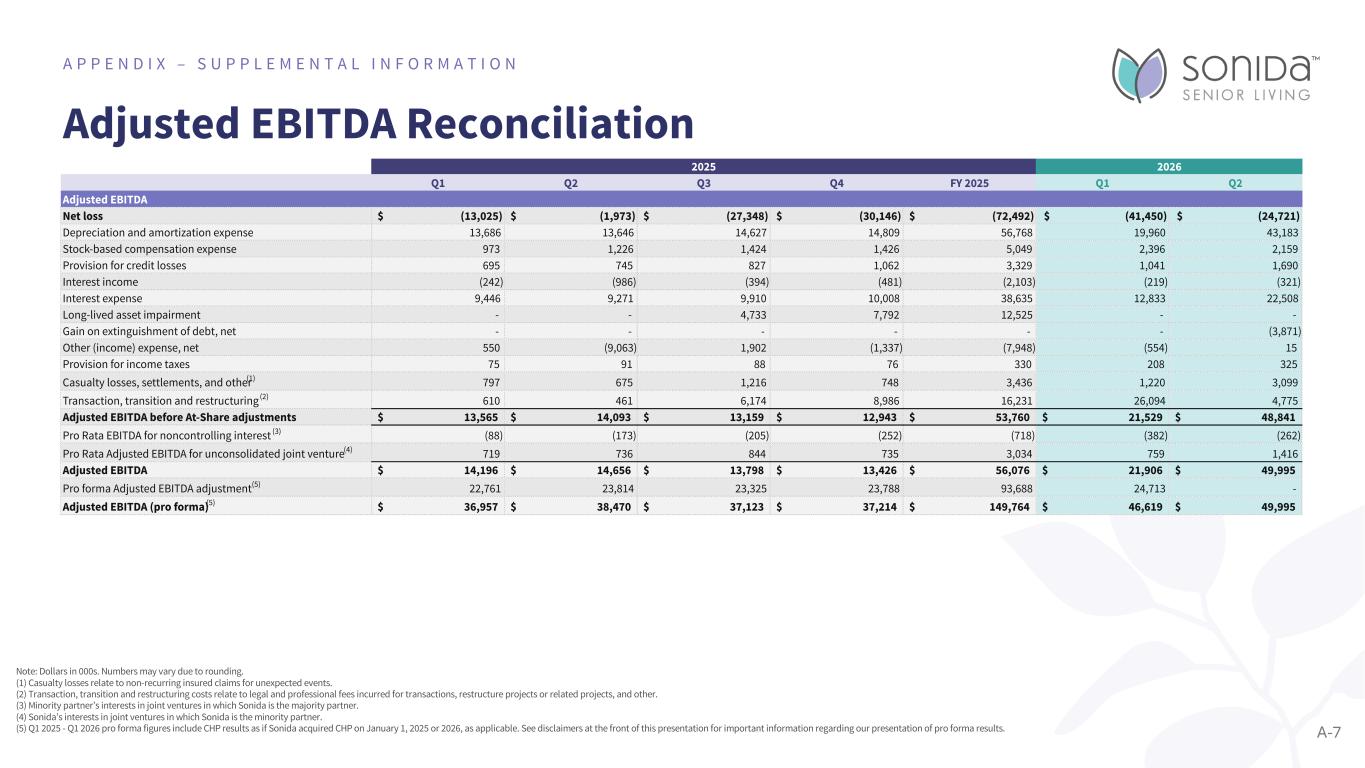
2026 Q1 Q2 Q3 Q4 FY 2025 Q1 Q2 Adjusted EBITDA Net loss (13,025)$ (1,973)$ (27,348)$ (30,146)$ (72,492)$ (41,450)$ (24,721)$ Depreciation and amortization expense 13,686 13,646 14,627 14,809 56,768 19,960 43,183 Stock-based compensation expense 973 1,226 1,424 1,426 5,049 2,396 2,159 Provision for credit losses 695 745 827 1,062 3,329 1,041 1,690 Interest income (242) (986) (394) (481) (2,103) (219) (321) Interest expense 9,446 9,271 9,910 10,008 38,635 12,833 22,508 Long-lived asset impairment - - 4,733 7,792 12,525 - - Gain on extinguishment of debt, net - - - - - - (3,871) Other (income) expense, net 550 (9,063) 1,902 (1,337) (7,948) (554) 15 Provision for income taxes 75 91 88 76 330 208 325 Casualty losses, settlements, and other(1) 797 675 1,216 748 3,436 1,220 3,099 Transaction, transition and restructuring (2) 610 461 6,174 8,986 16,231 26,094 4,775 Adjusted EBITDA before At-Share adjustments 13,565$ 14,093$ 13,159$ 12,943$ 53,760$ 21,529$ 48,841$ Pro Rata EBITDA for noncontrolling interest (3) (88) (173) (205) (252) (718) (382) (262) Pro Rata Adjusted EBITDA for unconsolidated joint venture(4) 719 736 844 735 3,034 759 1,416 Adjusted EBITDA 14,196$ 14,656$ 13,798$ 13,426$ 56,076$ 21,906$ 49,995$ Pro forma Adjusted EBITDA adjustment(5) 22,761 23,814 23,325 23,788 93,688 24,713 - Adjusted EBITDA (pro forma)(5) 36,957$ 38,470$ 37,123$ 37,214$ 149,764$ 46,619$ 49,995$ 2025 Adjusted EBITDA Reconciliation A P P E N D I X – S U P P L E M E N T A L I N F O R M A T I O N Note: Dollars in 000s. Numbers may vary due to rounding. (1) Casualty losses relate to non-recurring insured claims for unexpected events. (2) Transaction, transition and restructuring costs relate to legal and professional fees incurred for transactions, restructure projects or related projects, and other. (3) Minority partner’s interests in joint ventures in which Sonida is the majority partner. (4) Sonida’s interests in joint ventures in which Sonida is the minority partner. (5) Q1 2025 - Q1 2026 pro forma figures include CHP results as if Sonida acquired CHP on January 1, 2025 or 2026, as applicable. See disclaimers at the front of this presentation for important information regarding our presentation of pro forma results. A-7
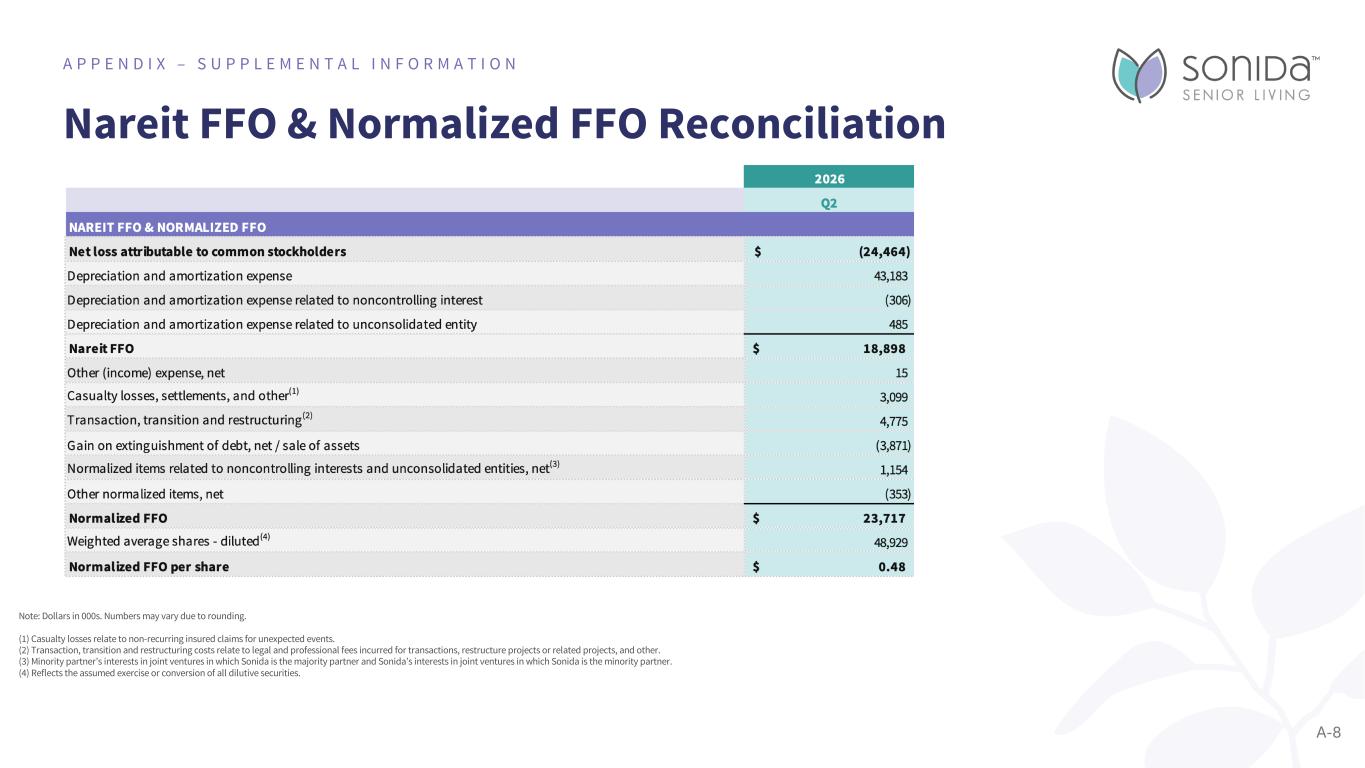
Nareit FFO & Normalized FFO Reconciliation A P P E N D I X – S U P P L E M E N T A L I N F O R M A T I O N A-8 Note: Dollars in 000s. Numbers may vary due to rounding. (1) Casualty losses relate to non-recurring insured claims for unexpected events. (2) Transaction, transition and restructuring costs relate to legal and professional fees incurred for transactions, restructure projects or related projects, and other. (3) Minority partner’s interests in joint ventures in which Sonida is the majority partner and Sonida’s interests in joint ventures in which Sonida is the minority partner. (4) Reflects the assumed exercise or conversion of all dilutive securities.
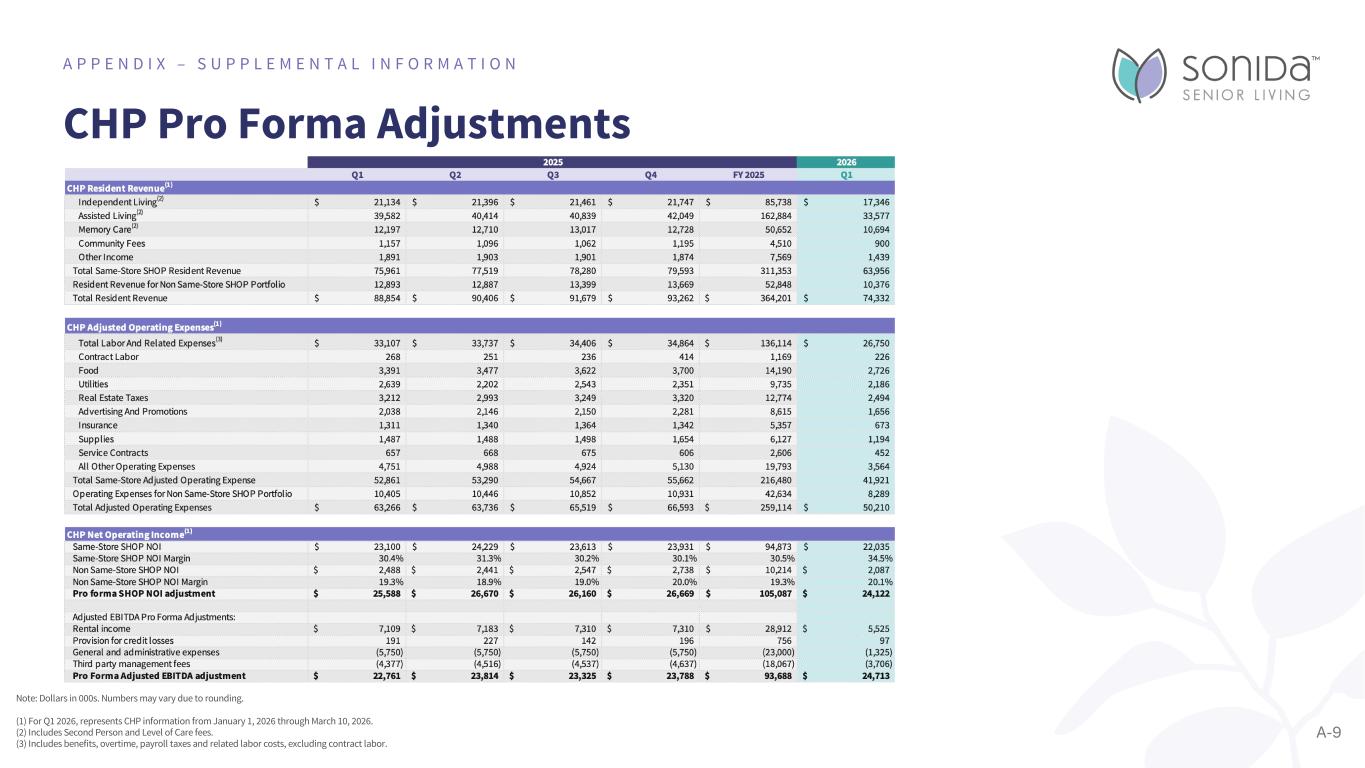
CHP Pro Forma Adjustments A P P E N D I X – S U P P L E M E N T A L I N F O R M A T I O N Note: Dollars in 000s. Numbers may vary due to rounding. (1) For Q1 2026, represents CHP information from January 1, 2026 through March 10, 2026. (2) Includes Second Person and Level of Care fees. (3) Includes benefits, overtime, payroll taxes and related labor costs, excluding contract labor. A-9
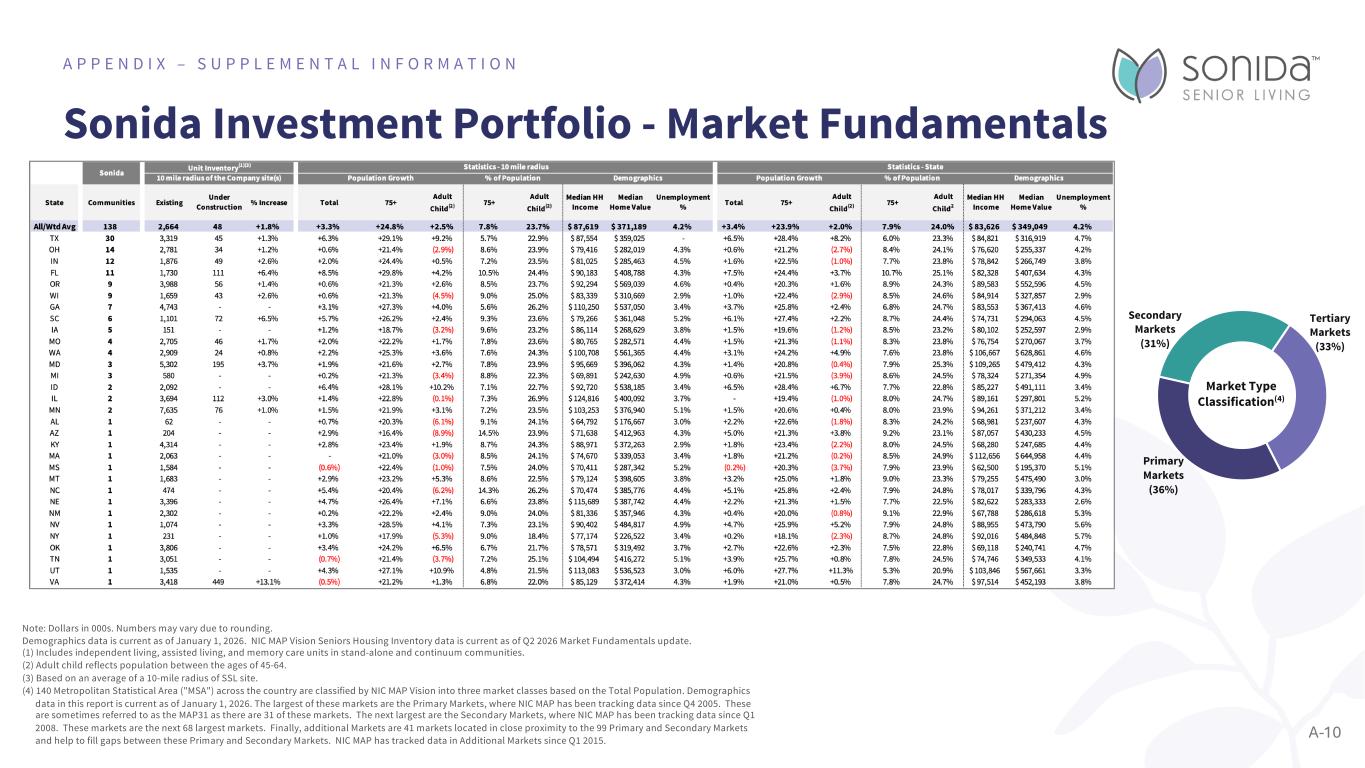
Sonida Investment Portfolio - Market Fundamentals A P P E N D I X – S U P P L E M E N T A L I N F O R M A T I O N Note: Dollars in 000s. Numbers may vary due to rounding. Demographics data is current as of January 1, 2026. NIC MAP Vision Seniors Housing Inventory data is current as of Q2 2026 Market Fundamentals update. (1) Includes independent living, assisted living, and memory care units in stand-alone and continuum communities. (2) Adult child reflects population between the ages of 45-64. (3) Based on an average of a 10-mile radius of SSL site. (4) 140 Metropolitan Statistical Area ("MSA") across the country are classified by NIC MAP Vision into three market classes based on the Total Population. Demographics data in this report is current as of January 1, 2026. The largest of these markets are the Primary Markets, where NIC MAP has been tracking data since Q4 2005. These are sometimes referred to as the MAP31 as there are 31 of these markets. The next largest are the Secondary Markets, where NIC MAP has been tracking data since Q1 2008. These markets are the next 68 largest markets. Finally, additional Markets are 41 markets located in close proximity to the 99 Primary and Secondary Markets and help to fill gaps between these Primary and Secondary Markets. NIC MAP has tracked data in Additional Markets since Q1 2015. A-10 Primary Markets (36%) Secondary Markets (31%) Tertiary Markets (33%) Market Type Classification(4)