Shareholder Report
May 31, 2026
USD ($)
$ / shares
WHAT WERE THE FUND COSTS FOR THE PAST YEAR? (based on a hypothetical $10,000 investment)
|
Fund Name
|
Costs of a $10,000 investment
|
Costs paid as a percentage of a $10,000 investment
|
|
Twin Oak Active Opportunities ETF
|
$39
|
0.35%
|
HOW DID THE FUND PERFORM LAST YEAR AND WHAT AFFECTED ITS PERFORMANCE?
For the fiscal year ended May 31, 2026, the Twin Oak Active Opportunities ETF delivered a total return of 22.56% at net asset value (NAV) and 22.39% at market price. Over the same period, the Fund’s blended benchmark — 50% S&P 500 TR Index / 50% Bloomberg U.S. Aggregate Bond Index — returned 17.05%, and the S&P 500 TR Index, the Fund’s broad-based securities market index, returned 29.78%. The Fund is actively managed and pursues an opportunistic strategy that allocates between equity and fixed-income exposures, adjusting those allocations as market conditions evolve. Asset allocation was the principal driver of the Fund’s results, with the Fund’s equity allocation serving as the primary contributor to return during a period of strong equity market performance. As of May 31, 2026, the Fund’s net assets were $273,353,782, with approximately 9.11 million shares outstanding, and the Fund’s net expense ratio was 0.35% after voluntary fee waivers.
WHAT FACTORS INFLUENCED PERFORMANCE
U.S. equity markets rose strongly over the period, extending the recovery that followed the spring 2025 tariff-driven decline, with gains concentrated in large-capitalization technology companies. The Federal Reserve reduced the federal funds rate by 25 basis points at each of its September, October, and December 2025 meetings and has held the target range unchanged since, as inflation remained above its 2% target — in part reflecting higher global energy prices associated with the conflict involving Iran — causing market expectations for further rate cuts to recede. Investment-grade fixed income posted positive but comparatively modest returns, while short-term interest rates remained elevated. The Fund’s equity allocation, which exceeded the 50% equity weighting of the blended benchmark, was the primary reason the Fund outperformed that benchmark; the same less-than-full equity allocation, combined with the Fund’s short-duration fixed-income holdings, was the primary reason the Fund trailed the all-equity S&P 500 TR Index. The Fund’s mixed allocation is not designed to fully capture broad equity market appreciation.
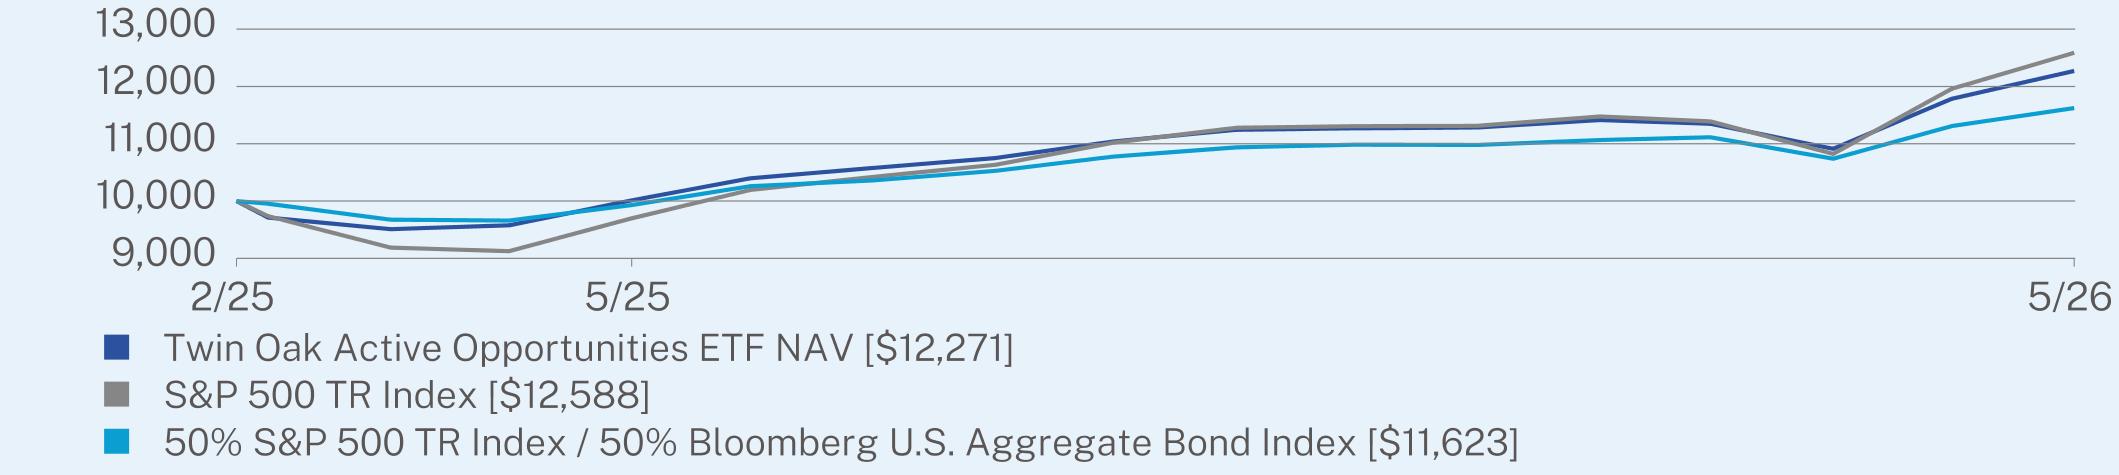
ANNUAL AVERAGE TOTAL RETURN (%)
|
|
1 Year
|
Since Inception
(02/20/2025) |
|
Twin Oak Active Opportunities ETF NAV
|
22.56
|
17.42
|
|
S&P 500 TR Index
|
29.78
|
19.80
|
|
50% S&P 500 TR Index / 50% Bloomberg U.S. Aggregate Bond Index
|
17.05
|
12.53
|
Visit https://twinoaketfs.com/TSPX for more recent performance information.
KEY FUND STATISTICS (as of May 31, 2026)
|
Net Assets
|
$273,353,782
|
|
Number of Holdings
|
3
|
|
Net Advisory Fee Paid
|
$868,422
|
|
Portfolio Turnover Rate
|
2%
|
WHAT DID THE FUND INVEST IN? (as of May 31, 2026)
|
Security Type
|
(% of Net Assets)
|
|
Exchange Traded Funds
|
100.0%
|
|
Cash & Other
|
0.0%
|
|
Top Holdings
|
(% of Net Assets)
|
|
Vanguard S&P 500 ETF
|
78.0%
|
|
iShares Ultra Short Duration Bond Active ETF
|
13.2%
|
|
JPMorgan Ultra-Short Income ETF
|
8.8%
|
WHAT WERE THE FUND COSTS FOR THE PAST YEAR? (based on a hypothetical $10,000 investment)
|
Fund Name
|
Costs of a $10,000 investment
|
Costs paid as a percentage of a $10,000 investment
|
|
Twin Oak Short Horizon Absolute Return ETF
|
$26
|
0.26%
|
HOW DID THE FUND PERFORM LAST YEAR AND WHAT AFFECTED ITS PERFORMANCE?
For the fiscal year ended May 31, 2026, the Twin Oak Short Horizon Absolute Return ETF delivered a total return of 3.85% at NAV (3.75% at market price), consistent with the Fund’s objective of providing capital appreciation with low price volatility. The Fund’s 52-week NAV range of $27.71 to $28.78 reflects continued stability, with returns accruing in a steady, incremental pattern across the fiscal year. Performance was driven primarily by the Fund’s actively managed, defined risk options strategy, which utilizes long calls, long puts, and debit spread positions in FLEX Options referencing the SPDR S&P 500 ETF Trust, each with maturities of less than one year and designed to limit maximum loss on each position to the premium invested. As of May 31, 2026, the Fund’s net assets were $90,354,077 with approximately 3.14 million shares outstanding, and the Fund’s net operating expense ratio was maintained at 0.25%, not including interest of 0.01%, through a contractual fee reduction agreement extending through September 30, 2027.
WHAT FACTORS INFLUENCED PERFORMANCE
The interest rate environment shifted from monetary easing to an extended pause during the fiscal year. The Federal Reserve reduced the federal funds rate by 25 basis points at each of its September, October, and December 2025 meetings, bringing the target range from 4.25%–4.50% to 3.50%–3.75%, and has held rates unchanged since, as inflation remained above its 2% target, in part reflecting increases in global energy prices associated with the conflict in the Middle East. Equity markets experienced meaningful volatility, including a drawdown in March 2026 followed by a sharp recovery. The Fund’s short duration profile, maintaining exposure between zero and one year, minimized sensitivity to shifting rate expectations, while its defined risk options structure enabled the Fund to maintain NAV stability through the equity market’s drawdown and recovery cycle. The strategy sought to generate returns independent of directional equity and interest rate movements, and is not designed to capture broader equity market appreciation.
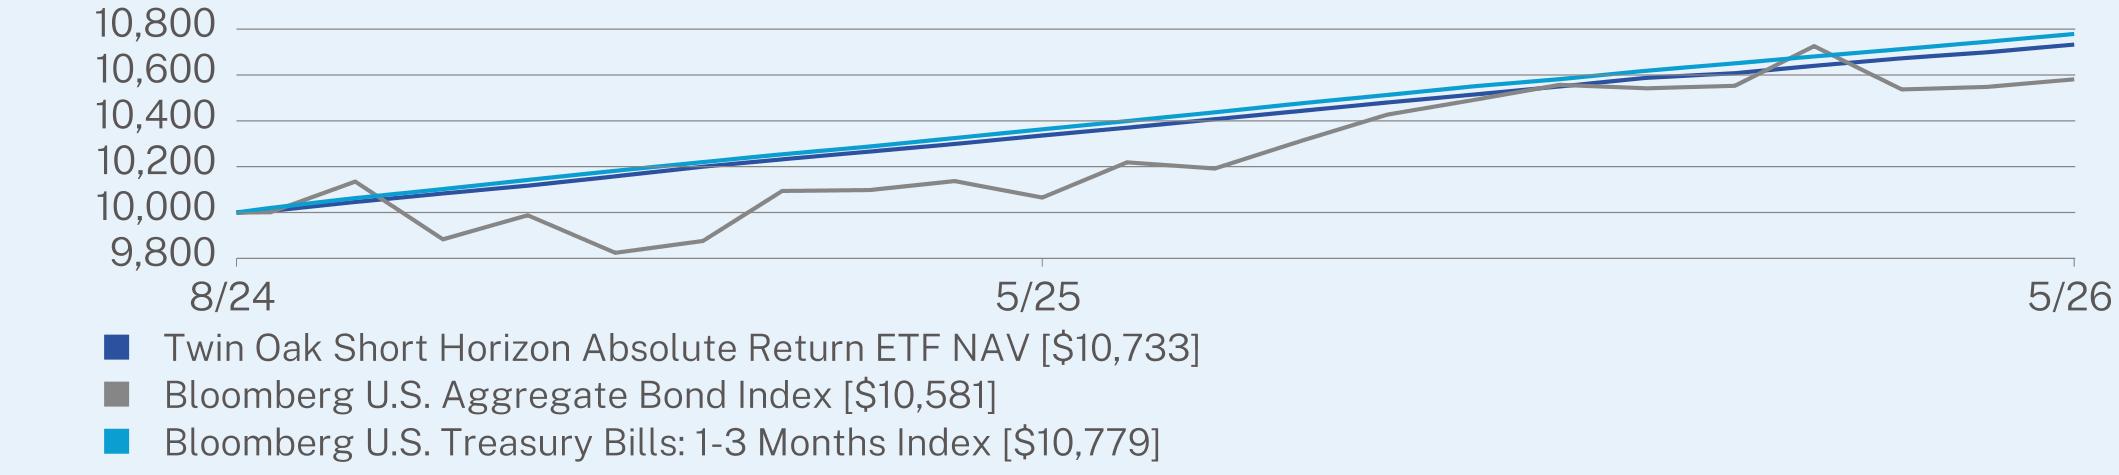
ANNUAL AVERAGE TOTAL RETURN (%)
|
|
1 Year
|
Since Inception
(08/19/2024) |
|
Twin Oak Short Horizon Absolute Return ETF NAV
|
3.85
|
4.05
|
|
Bloomberg U.S. Aggregate Bond Index
|
5.13
|
3.22
|
|
Bloomberg U.S. Treasury Bills: 1-3 Months Index
|
4.01
|
4.30
|
Visit https://twinoaketfs.com/TOAK for more recent performance information.
KEY FUND STATISTICS (as of May 31, 2026)
|
Net Assets
|
$90,354,077
|
|
Number of Holdings
|
2
|
|
Net Advisory Fee Paid
|
$137,063
|
|
Portfolio Turnover Rate
|
0%
|
WHAT DID THE FUND INVEST IN? (as of May 31, 2026)
|
Top Holdings
|
(% of Net Assets)
|
|
State Street SPDR S&P 500 ETF Trust Call Options
|
74.1%
|
|
State Street SPDR S&P 500 ETF Trust Put Options
|
25.8%
|
|
Cash & Cash Equivalents
|
0.1%
|
|
Credit Breakdown1
|
(% of Net Assets)
|
|
AA
|
99.9%
|
|
Cash & Cash Equivalents
|
0.1%
|
| [1] |
|