Shareholder Report
May 31, 2026
USD ($)
$ / shares
WHAT WERE THE FUND COSTS FOR THE PAST YEAR? (based on a hypothetical $10,000 investment)
|
Fund Name
|
Costs of a $10,000 investment
|
Costs paid as a percentage of a $10,000 investment
|
|
SanJac Alpha Core Plus Bond ETF
|
$67
|
0.65%
|
HOW DID THE FUND PERFORM LAST YEAR AND WHAT AFFECTED ITS PERFORMANCE?
For the fiscal year ended May 31, 2026, the Fund delivered total returns of 4.69% (based on net asset value).
WHAT FACTORS INFLUENCED PERFORMANCE
The Fund’s results reflected the income generated by its core government holdings alongside a complement of selected credit securities, including mREIT exchange-traded debt and preferred shares. The Federal Reserve’s three rate cuts in the second half of 2025, which brought the target range to 3.50%–3.75%, supported the exposure to mREITs which tend to benefit from lower funding costs on their borrowings.
The Fund’s primary test came in late February and March 2026. U.S.-led strikes on Iran beginning February 28 led to a tactical closure of the Strait of Hormuz, the maritime chokepoint through which roughly a fifth of the world’s petroleum passes. Brent crude spiked from around $72 to nearly $120 per barrel in a matter of days, and the inflationary implications pushed the 10-year Treasury yield from approximately 3.96% to a multi-month high near 4.48%.
The Fund’s U.S. Treasury holdings had some sensitivity to the rapid rate selloff, though our durations in the Fund were held at low levels for defensiveness. Our exchange-traded credit products and preferred shares can carry some beta to markets as well and experienced a temporary mark-to-market drawdown during the stress. As the conflict moved toward a provisional resolution and markets stabilized into the late spring, those positions recovered, and the income they generated throughout the episode provided extra ballast when prices wobbled.
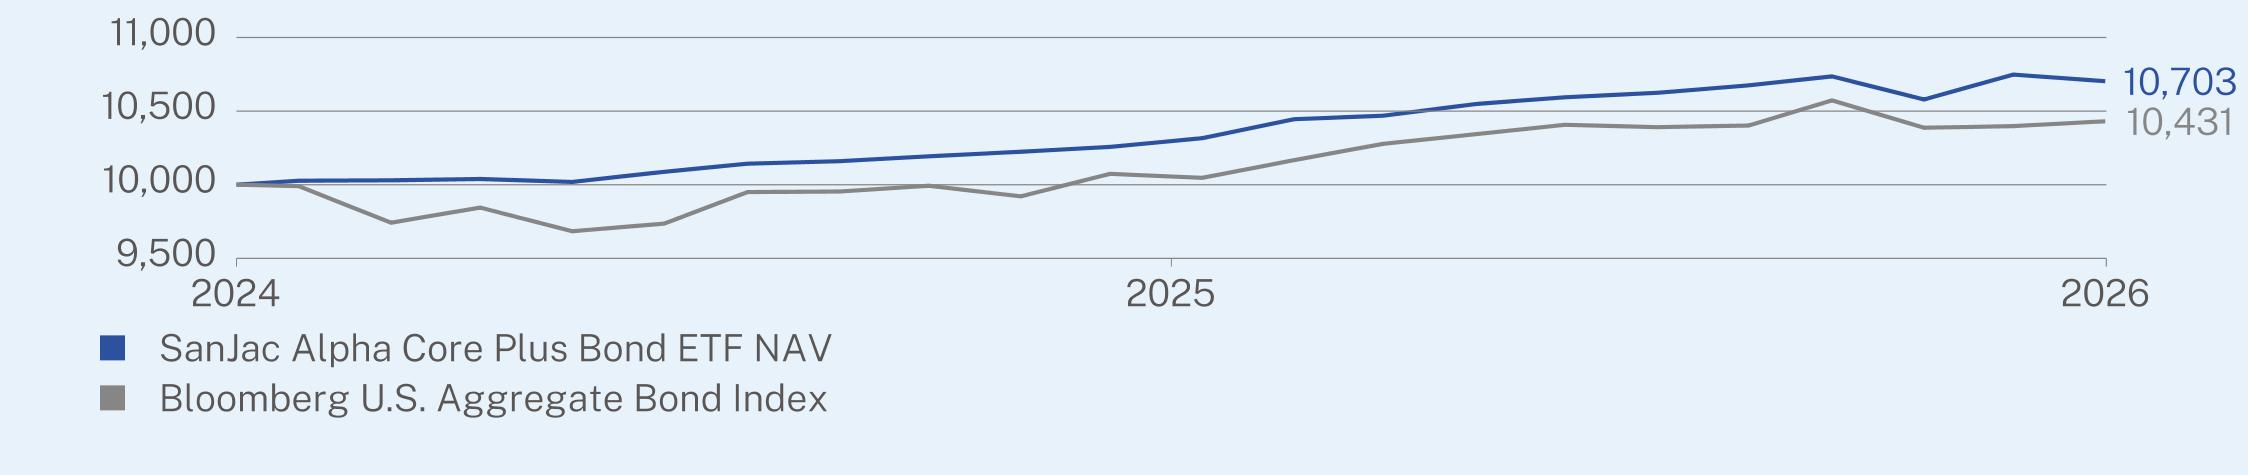
ANNUAL AVERAGE TOTAL RETURN (%)
|
|
1 Year
|
Since Inception
(09/10/2024) |
|
SanJac Alpha Core Plus Bond ETF NAV
|
4.69
|
4.02
|
|
Bloomberg U.S. Aggregate Bond Index
|
5.13
|
2.48
|
Visit https://sanjacalpha.com/etf-sjcp/ for more recent performance information.
KEY FUND STATISTICS (as of May 31, 2026)
|
Net Assets
|
$7,538,243
|
|
Number of Holdings
|
19
|
|
Net Advisory Fee Paid
|
$15,523
|
|
Portfolio Turnover Rate
|
83%
|
WHAT DID THE FUND INVEST IN? (as of May 31, 2026)
|
Security Type
|
(% of Net Assets)
|
|
U.S. Treasury Securities
|
33.4%
|
|
Exchange Traded Debt
|
12.7%
|
|
Real Estate Investment Trusts - Preferred Stock
|
9.9%
|
|
U.S. Treasury Bills
|
3.3%
|
|
Collateralized Mortgage Obligations
|
1.1%
|
|
Real Estate Investment Trusts - Common Stock
|
1.0%
|
|
Cash & Other
|
38.6%
|
|
Top 10 Issuers
|
(% of Net Assets)
|
|
United States Treasury Note/Bond
|
24.4%
|
|
United States Treasury Inflation Indexed Bonds
|
9.0%
|
|
Rithm Capital Corp.
|
8.0%
|
|
PennyMac Mortgage Investment Trust
|
5.6%
|
|
United States Treasury Bill
|
3.3%
|
|
Babcock & Wilcox Enterprises, Inc.
|
2.8%
|
|
Chimera Investment Corp.
|
2.2%
|
|
Xcel Energy, Inc.
|
2.2%
|
|
NextEra Energy Capital Holdings, Inc.
|
1.2%
|
|
Duke Energy Corp.
|
0.9%
|
WHAT WERE THE FUND COSTS FOR THE PAST YEAR? (based on a hypothetical $10,000 investment)
|
Fund Name
|
Costs of a $10,000 investment
|
Costs paid as a percentage of a $10,000 investment
|
|
SanJac Alpha Low Duration ETF
|
$36
|
0.35%
|
HOW DID THE FUND PERFORM LAST YEAR AND WHAT AFFECTED ITS PERFORMANCE?
For the fiscal year ended May 31, 2026, the Fund delivered total returns of 5.20% (based on net asset value).
WHAT FACTORS INFLUENCED PERFORMANCE
The Fund’s results were driven by a disciplined commitment to short-duration positioning in a year that tested experts in predicting the path of interest rates. We built the portfolio around very short-maturity U.S. Treasuries and high-quality short-term credit, which let us capture attractive front-end yields in a fairly flat curve while keeping interest-rate sensitivity low.
Developments that shaped the macroeconomic backdrop
The Federal Reserve resumed cutting in the second half of 2025, lowering its target range by 75 basis points across its September, October, and December meetings to 3.50%–3.75%. A softening labor market, underscored by a record 43-day government shutdown that clouded the economic data into November, gave policymakers room to ease.
Volatile tariff policy continued throughout 2025 and into 2026 and kept inflation stubbornly above the Fed’s 2% target. That limited how far policymakers were willing to go in cutting rates and kept the front end of the curve well-anchored rather than collapsing, which helped preserve the income on our short-dated holdings.
A sharp geopolitical shock caused by the US/Iran conflict and subsequent oil supply constraints during late February through May 2026 sent rates broadly higher, a move our short-duration stance was specifically built to withstand.
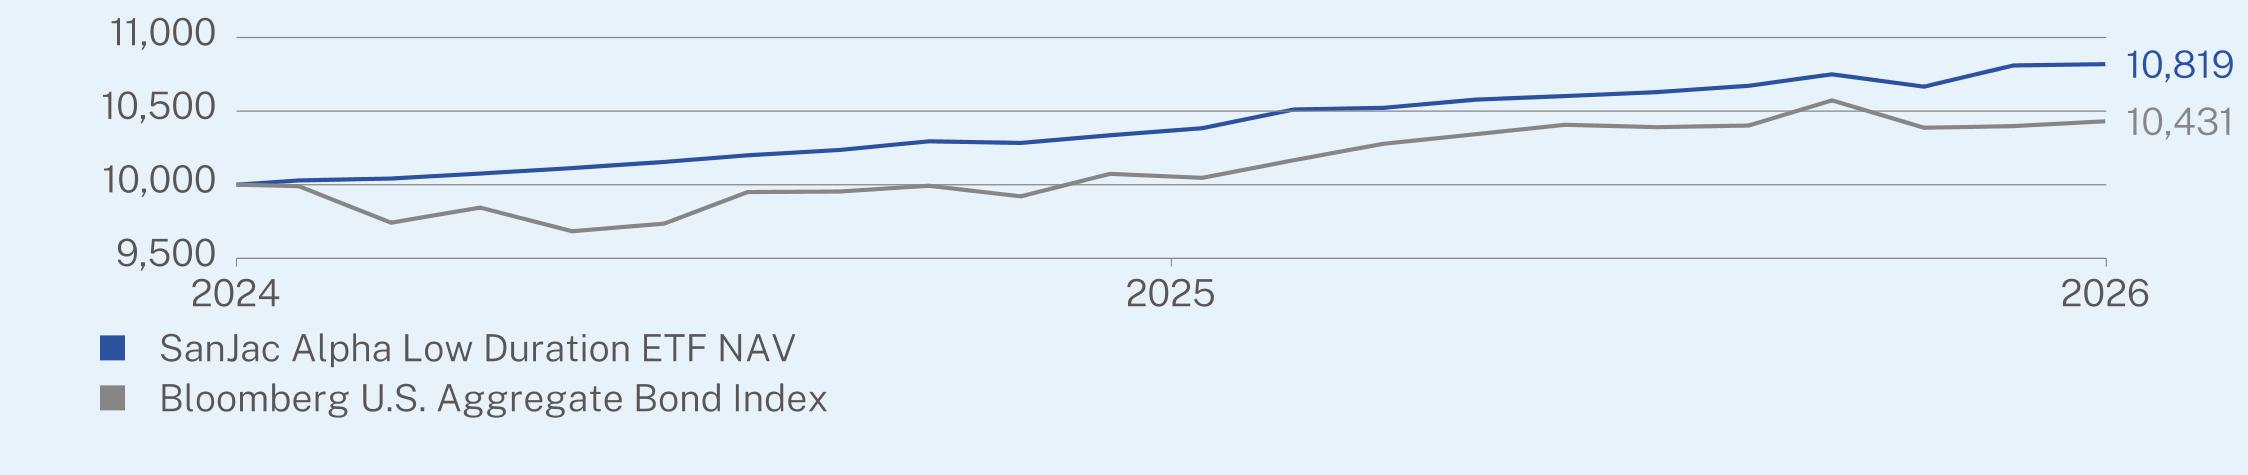
ANNUAL AVERAGE TOTAL RETURN (%)
|
|
1 Year
|
Since Inception
(09/10/2024) |
|
SanJac Alpha Low Duration ETF NAV
|
5.20
|
4.67
|
|
Bloomberg U.S. Aggregate Bond Index
|
5.13
|
2.48
|
Visit https://sanjacalpha.com/etf-sjld/ for more recent performance information.
KEY FUND STATISTICS (as of May 31, 2026)
|
Net Assets
|
$2,548,453
|
|
Number of Holdings
|
10
|
|
Net Advisory Fee Paid
|
$6,497
|
|
Portfolio Turnover Rate
|
66%
|
WHAT DID THE FUND INVEST IN? (as of May 31, 2026)
|
Security Type
|
(% of Net Assets)
|
|
U.S. Treasury Bills
|
39.1%
|
|
Exchange Traded Debt
|
34.1%
|
|
U.S. Treasury Securities
|
24.3%
|
|
Cash & Other
|
2.5%
|
|
Top Issuers
|
(% of Net Assets)
|
|
United States Treasury Bill
|
39.1%
|
|
United States Treasury Inflation Indexed Bonds
|
24.3%
|
|
PennyMac Mortgage Investment Trust
|
11.9%
|
|
MFA Financial, Inc.
|
6.9%
|
|
Babcock & Wilcox Enterprises, Inc.
|
5.0%
|
|
NextEra Energy Capital Holdings, Inc.
|
4.4%
|
|
Chimera Investment Corp.
|
3.0%
|
|
TPG Mortgage Investment Trust, Inc.
|
3.0%
|