Shareholder Report
May 31, 2026
USD ($)
Holding
What were the Fund costs for the last year ?
(based on a hypothetical $10,000 investment)
| Class name | Costs of a $10,000 investment |
Costs paid as a percentage of a $10,000 investment |
| $50 | 0.43% |
How did the Fund perform last year ?
- For the reporting period ended May 31, 2026, the Fund’s Class K Shares returned 32.67%.
- For the same period, the Fund’s benchmark, the Russell 1000 Index returned 28.85%.
What contributed to performance?
Positive contributions to performance were driven by macro thematic and sentiment measures, which kept the portfolio aligned with an evolving market backdrop. In this vein, trend-following measures helped capture stocks benefiting from key themes while other sentiment measures evaluating investor positioning and shorting behavior on stocks also contributed. Macro thematic measures designed to evaluate economic regime similarities and style timing models were additive within communication services and information technology, aligning the portfolio with firms that benefitted from the AI-driven, risk-on momentum. Fundamental insights then amplified these gains, notably growth-focused measures that track research and development spending, sales growth and employee sentiment which reflected the market focus on AI trends. Similarly, sustainability measures designed to evaluate employee benefits contributed to performance. Finally, during periods of market volatility fundamental quality outperformed as investors refocused on balance sheet strength.
What detracted from performance?
Some stability-related measures with a preference for lower volatility stocks detracted amid the risk-on market tone. Additionally, consumer intent insights designed to evaluate product ranking trends and mobile app usage incorrectly positioned the portfolio within consumer staples. Finally, select sustainability insights ran against market trends, notably environmental measures evaluating green patent filings and human capital insights designed to evaluate employee safety.
The views expressed reflect the opinions of BlackRock as of the date of this report and are subject to change based on changes in market, economic or other conditions. These views are not intended to be a forecast of future events and are no guarantee of future results.
Fund performance
Cumulative performance: June 1, 2016 through May 31, 2026
Initial investment of $10,000
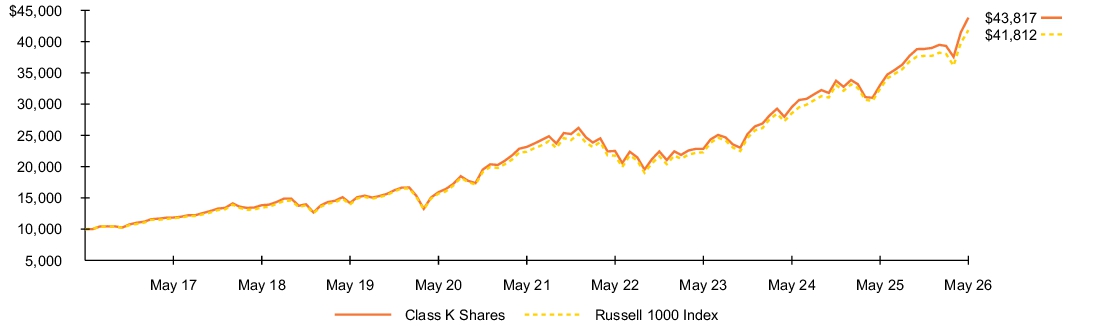
See “Average annual total returns” for additional information on fund performance.
| Average annual total returns | ||||||
| 1 Year | 5 Years | 10 Years | ||||
| 32.67 | % | 13.61 | % | 15.92 | % | |
| 28.85 | 13.33 | 15.38 |
| Key Fund statistics | |
| $1,224,851,694 | |
| 211 | |
| $3,302,796 | |
| 115% |
What did the Fund invest in?
(as of May 31, 2026)
| Sector allocation | ||
| Sector(a) | Percent of Net Assets |
|
| 37.4 | % | |
| 11.0 | ||
| 10.6 | ||
| 10.3 | ||
| 9.7 | ||
| 9.2 | ||
| 3.4 | ||
| 3.2 | ||
| 1.9 | ||
| 1.8 | ||
| 0.7 | ||
| 0.4 | ||
| 0.4 | ||
| Ten largest holdings | ||
| Security(b) | Percent of Net Assets |
|
| 6.8 | % | |
| 6.3 | ||
| 4.7 | ||
| 4.1 | ||
| 3.1 | ||
| 3.0 | ||
| 2.3 | ||
| 2.3 | ||
| 1.9 | ||
| 1.7 | ||
| For purposes of this report, sector sub-classifications may differ from those utilized by the Fund for compliance purposes. |
| Excludes short-term securities. |
| Ten largest holdings | ||
| Security(b) | Percent of Net Assets |
|
| 6.8 | % | |
| 6.3 | ||
| 4.7 | ||
| 4.1 | ||
| 3.1 | ||
| 3.0 | ||
| 2.3 | ||
| 2.3 | ||
| 1.9 | ||
| 1.7 | ||
What were the Fund costs for the last year ?
(based on a hypothetical $10,000 investment)
| Class name | Costs of a $10,000 investment |
Costs paid as a percentage of a $10,000 investment |
| $171 | 1.48% |
How did the Fund perform last year ?
- For the reporting period ended May 31, 2026, the Fund’s Investor C Shares returned 31.26%.
- For the same period, the Fund’s benchmark, the Russell 1000 Index returned 28.85%.
What contributed to performance?
Positive contributions to performance were driven by macro thematic and sentiment measures, which kept the portfolio aligned with an evolving market backdrop. In this vein, trend-following measures helped capture stocks benefiting from key themes while other sentiment measures evaluating investor positioning and shorting behavior on stocks also contributed. Macro thematic measures designed to evaluate economic regime similarities and style timing models were additive within communication services and information technology, aligning the portfolio with firms that benefitted from the AI-driven, risk-on momentum. Fundamental insights then amplified these gains, notably growth-focused measures that track research and development spending, sales growth and employee sentiment which reflected the market focus on AI trends. Similarly, sustainability measures designed to evaluate employee benefits contributed to performance. Finally, during periods of market volatility fundamental quality outperformed as investors refocused on balance sheet strength.
What detracted from performance?
Some stability-related measures with a preference for lower volatility stocks detracted amid the risk-on market tone. Additionally, consumer intent insights designed to evaluate product ranking trends and mobile app usage incorrectly positioned the portfolio within consumer staples. Finally, select sustainability insights ran against market trends, notably environmental measures evaluating green patent filings and human capital insights designed to evaluate employee safety.
The views expressed reflect the opinions of BlackRock as of the date of this report and are subject to change based on changes in market, economic or other conditions. These views are not intended to be a forecast of future events and are no guarantee of future results.
Fund performance
Cumulative performance: June 1, 2016 through May 31, 2026
Initial investment of $10,000
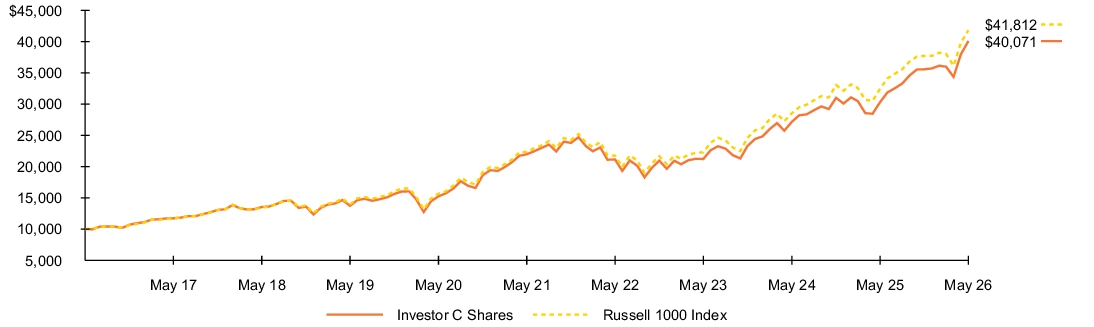
See “Average annual total returns” for additional information on fund performance.
| Average annual total returns | ||||||
| 1 Year | 5 Years | 10 Years | ||||
| 31.26 | % | 12.42 | % | 14.89 | % | |
| 30.26 | 12.42 | 14.89 | ||||
| 28.85 | 13.33 | 15.38 |
| Key Fund statistics | |
| $1,224,851,694 | |
| 211 | |
| $3,302,796 | |
| 115% |
What did the Fund invest in?
(as of May 31, 2026)
| Sector allocation | ||
| Sector(a) | Percent of Net Assets |
|
| 37.4 | % | |
| 11.0 | ||
| 10.6 | ||
| 10.3 | ||
| 9.7 | ||
| 9.2 | ||
| 3.4 | ||
| 3.2 | ||
| 1.9 | ||
| 1.8 | ||
| 0.7 | ||
| 0.4 | ||
| 0.4 | ||
| Ten largest holdings | ||
| Security(b) | Percent of Net Assets |
|
| 6.8 | % | |
| 6.3 | ||
| 4.7 | ||
| 4.1 | ||
| 3.1 | ||
| 3.0 | ||
| 2.3 | ||
| 2.3 | ||
| 1.9 | ||
| 1.7 | ||
| For purposes of this report, sector sub-classifications may differ from those utilized by the Fund for compliance purposes. |
| Excludes short-term securities. |
| Ten largest holdings | ||
| Security(b) | Percent of Net Assets |
|
| 6.8 | % | |
| 6.3 | ||
| 4.7 | ||
| 4.1 | ||
| 3.1 | ||
| 3.0 | ||
| 2.3 | ||
| 2.3 | ||
| 1.9 | ||
| 1.7 | ||
What were the Fund costs for the last year ?
(based on a hypothetical $10,000 investment)
| Class name | Costs of a $10,000 investment |
Costs paid as a percentage of a $10,000 investment |
| $85 | 0.73% |
How did the Fund perform last year ?
- For the reporting period ended May 31, 2026, the Fund’s Investor A Shares returned 32.22%.
- For the same period, the Fund’s benchmark, the Russell 1000 Index returned 28.85%.
What contributed to performance?
Positive contributions to performance were driven by macro thematic and sentiment measures, which kept the portfolio aligned with an evolving market backdrop. In this vein, trend-following measures helped capture stocks benefiting from key themes while other sentiment measures evaluating investor positioning and shorting behavior on stocks also contributed. Macro thematic measures designed to evaluate economic regime similarities and style timing models were additive within communication services and information technology, aligning the portfolio with firms that benefitted from the AI-driven, risk-on momentum. Fundamental insights then amplified these gains, notably growth-focused measures that track research and development spending, sales growth and employee sentiment which reflected the market focus on AI trends. Similarly, sustainability measures designed to evaluate employee benefits contributed to performance. Finally, during periods of market volatility fundamental quality outperformed as investors refocused on balance sheet strength.
What detracted from performance?
Some stability-related measures with a preference for lower volatility stocks detracted amid the risk-on market tone. Additionally, consumer intent insights designed to evaluate product ranking trends and mobile app usage incorrectly positioned the portfolio within consumer staples. Finally, select sustainability insights ran against market trends, notably environmental measures evaluating green patent filings and human capital insights designed to evaluate employee safety.
The views expressed reflect the opinions of BlackRock as of the date of this report and are subject to change based on changes in market, economic or other conditions. These views are not intended to be a forecast of future events and are no guarantee of future results.
Fund performance
Cumulative performance: June 1, 2016 through May 31, 2026
Initial investment of $10,000
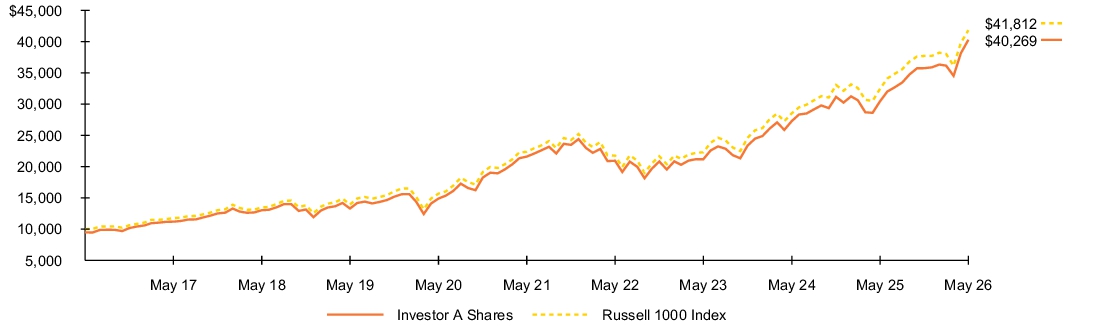
See “Average annual total returns” for additional information on fund performance.
| Average annual total returns | ||||||
| 1 Year | 5 Years | 10 Years | ||||
| 32.22 | % | 13.27 | % | 15.57 | % | |
| 25.27 | 12.05 | 14.95 | ||||
| 28.85 | 13.33 | 15.38 |
| Key Fund statistics | |
| $1,224,851,694 | |
| 211 | |
| $3,302,796 | |
| 115% |
What did the Fund invest in?
(as of May 31, 2026)
| Sector allocation | ||
| Sector(a) | Percent of Net Assets |
|
| 37.4 | % | |
| 11.0 | ||
| 10.6 | ||
| 10.3 | ||
| 9.7 | ||
| 9.2 | ||
| 3.4 | ||
| 3.2 | ||
| 1.9 | ||
| 1.8 | ||
| 0.7 | ||
| 0.4 | ||
| 0.4 | ||
| Ten largest holdings | ||
| Security(b) | Percent of Net Assets |
|
| 6.8 | % | |
| 6.3 | ||
| 4.7 | ||
| 4.1 | ||
| 3.1 | ||
| 3.0 | ||
| 2.3 | ||
| 2.3 | ||
| 1.9 | ||
| 1.7 | ||
| For purposes of this report, sector sub-classifications may differ from those utilized by the Fund for compliance purposes. |
| Excludes short-term securities. |
| Ten largest holdings | ||
| Security(b) | Percent of Net Assets |
|
| 6.8 | % | |
| 6.3 | ||
| 4.7 | ||
| 4.1 | ||
| 3.1 | ||
| 3.0 | ||
| 2.3 | ||
| 2.3 | ||
| 1.9 | ||
| 1.7 | ||
What were the Fund costs for the last year ?
(based on a hypothetical $10,000 investment)
| Class name | Costs of a $10,000 investment |
Costs paid as a percentage of a $10,000 investment |
| $56 | 0.48% |
How did the Fund perform last year ?
- For the reporting period ended May 31, 2026, the Fund’s Institutional Shares returned 32.59%.
- For the same period, the Fund’s benchmark, the Russell 1000 Index returned 28.85%.
What contributed to performance?
Positive contributions to performance were driven by macro thematic and sentiment measures, which kept the portfolio aligned with an evolving market backdrop. In this vein, trend-following measures helped capture stocks benefiting from key themes while other sentiment measures evaluating investor positioning and shorting behavior on stocks also contributed. Macro thematic measures designed to evaluate economic regime similarities and style timing models were additive within communication services and information technology, aligning the portfolio with firms that benefitted from the AI-driven, risk-on momentum. Fundamental insights then amplified these gains, notably growth-focused measures that track research and development spending, sales growth and employee sentiment which reflected the market focus on AI trends. Similarly, sustainability measures designed to evaluate employee benefits contributed to performance. Finally, during periods of market volatility fundamental quality outperformed as investors refocused on balance sheet strength.
What detracted from performance?
Some stability-related measures with a preference for lower volatility stocks detracted amid the risk-on market tone. Additionally, consumer intent insights designed to evaluate product ranking trends and mobile app usage incorrectly positioned the portfolio within consumer staples. Finally, select sustainability insights ran against market trends, notably environmental measures evaluating green patent filings and human capital insights designed to evaluate employee safety.
The views expressed reflect the opinions of BlackRock as of the date of this report and are subject to change based on changes in market, economic or other conditions. These views are not intended to be a forecast of future events and are no guarantee of future results.
Fund performance
Cumulative performance: June 1, 2016 through May 31, 2026
Initial investment of $10,000
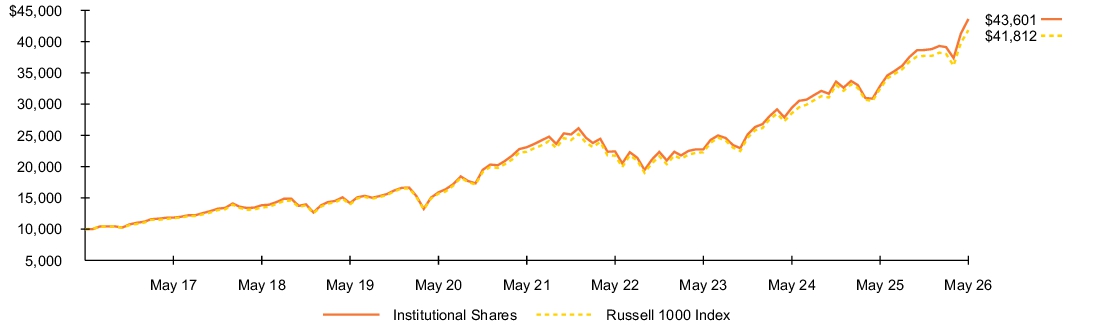
See “Average annual total returns” for additional information on fund performance.
| Average annual total returns | ||||||
| 1 Year | 5 Years | 10 Years | ||||
| 32.59 | % | 13.55 | % | 15.86 | % | |
| 28.85 | 13.33 | 15.38 |
| Key Fund statistics | |
| $1,224,851,694 | |
| 211 | |
| $3,302,796 | |
| 115% |
What did the Fund invest in?
(as of May 31, 2026)
| Sector allocation | ||
| Sector(a) | Percent of Net Assets |
|
| 37.4 | % | |
| 11.0 | ||
| 10.6 | ||
| 10.3 | ||
| 9.7 | ||
| 9.2 | ||
| 3.4 | ||
| 3.2 | ||
| 1.9 | ||
| 1.8 | ||
| 0.7 | ||
| 0.4 | ||
| 0.4 | ||
| Ten largest holdings | ||
| Security(b) | Percent of Net Assets |
|
| 6.8 | % | |
| 6.3 | ||
| 4.7 | ||
| 4.1 | ||
| 3.1 | ||
| 3.0 | ||
| 2.3 | ||
| 2.3 | ||
| 1.9 | ||
| 1.7 | ||
| For purposes of this report, sector sub-classifications may differ from those utilized by the Fund for compliance purposes. |
| Excludes short-term securities. |
| Ten largest holdings | ||
| Security(b) | Percent of Net Assets |
|
| 6.8 | % | |
| 6.3 | ||
| 4.7 | ||
| 4.1 | ||
| 3.1 | ||
| 3.0 | ||
| 2.3 | ||
| 2.3 | ||
| 1.9 | ||
| 1.7 | ||