Shareholder Report
May 31, 2026
USD ($)
Holding
What were the Fund costs for the last year ?
(based on a hypothetical $10,000 investment)
| Class name | Costs of a $10,000 investment |
Costs paid as a percentage of a $10,000 investment |
| $45 | 0.44% |
How did the Fund perform last year ?
- For the reporting period ended May 31, 2026, the Fund’s Class K Shares returned 5.87%.
- For the same period, the Fund’s benchmark, the Bloomberg Municipal Bond Index, returned 6.67% and the Fund’s customized reference benchmark, the California Customized Reference Benchmark, returned 6.38%.
What contributed to performance?
Holdings in AA rated bonds made the largest contribution to absolute performance, reflecting their positive returns and sizable portfolio weighting. With respect to maturities, 15- to 25-year issues were the leading contributors. At the sector level, the utilities, school districts, and corporate-backed categories made the largest contributions. Positions in select high yield securities, particularly Puerto Rico Contingent Value Instruments and Puerto Rico Electric and Power Authority, further helped results. The Fund’s cash position had no material impact on performance.
What detracted from performance?
At a time of robust returns for the Fund and the broader market, all segments of the portfolio contributed positively. However, a few individual holdings detracted. Positions in the bonds of Brightline East and Brightline West, which were issued to finance high-speed rail projects, were notable detractors at the individual security level.
The views expressed reflect the opinions of BlackRock as of the date of this report and are subject to change based on changes in market, economic or other conditions. These views are not intended to be a forecast of future events and are no guarantee of future results.
Fund performance
Cumulative performance: June 1, 2016 through May 31, 2026
Initial investment of $10,000
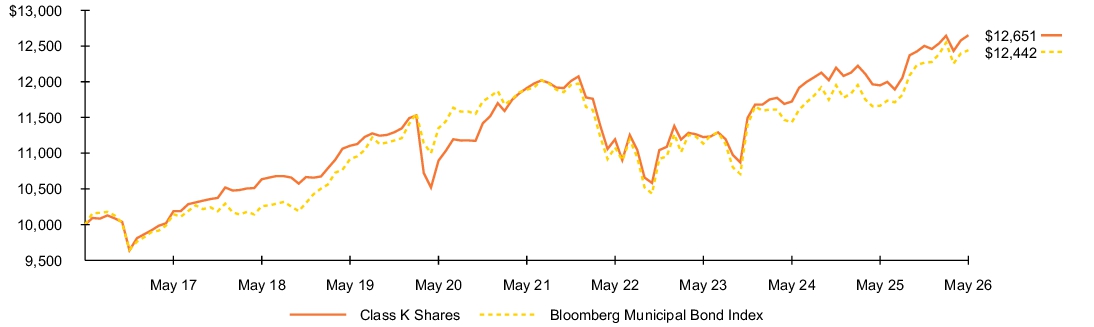
See “Average annual total returns” for additional information on fund performance.
| Average annual total returns | ||||||
| 1 Year | 5 Years | 10 Years | ||||
| 5.87 | % | 1.21 | % | 2.38 | % | |
| 6.67 | 0.92 | 2.21 | ||||
| 6.38 | 0.73 |
| Key Fund statistics | |
| $2,447,515,998 | |
| 283 | |
| $8,590,542 | |
| 79% |
What did the Fund invest in?
(as of May 31, 2026)
| Sector allocation | ||
| Sector(a) | Percent of Total Investments(b) |
|
| 28.7 | % | |
| 17.1 | ||
| 14.6 | ||
| 13.6 | ||
| 8.9 | ||
| 4.9 | ||
| 4.5 | ||
| 3.0 | ||
| 2.6 | ||
| 2.1 | ||
| (c) | ||
| Credit quality allocation | ||
| Credit Rating(d) | Percent of Total Investments(b) |
|
| 10.9 | % | |
| 64.8 | ||
| 7.6 | ||
| 1.2 | ||
| (c) | ||
| 0.1 | ||
| 15.4 | ||
| For purposes of this report, sector sub-classifications may differ from those utilized by the Fund for compliance purposes. |
| Excludes short-term securities. |
| Rounds to less than 0.1%. |
| For purposes of this report, credit quality ratings shown above reflect the highest rating assigned by either S&P Global Ratings or Moody’s Investors Service, Inc. if ratings differ. These rating agencies are independent, nationally recognized statistical rating organizations and are widely used. Investment grade ratings are credit ratings of BBB/Baa or higher. Below investment grade ratings are credit ratings of BB/Ba or lower. Investments designated N/R are not rated by either rating agency. Unrated investments do not necessarily indicate low credit quality. Credit quality ratings are subject to change. |
What were the Fund costs for the last year ?
(based on a hypothetical $10,000 investment)
| Class name | Costs of a $10,000 investment |
Costs paid as a percentage of a $10,000 investment |
| $154 | 1.50% |
How did the Fund perform last year ?
- For the reporting period ended May 31, 2026, the Fund’s Investor C Shares returned 4.86%.
- For the same period, the Fund’s benchmark, the Bloomberg Municipal Bond Index, returned 6.67% and the Fund’s customized reference benchmark, the California Customized Reference Benchmark, returned 6.38%.
What contributed to performance?
Holdings in AA rated bonds made the largest contribution to absolute performance, reflecting their positive returns and sizable portfolio weighting. With respect to maturities, 15- to 25-year issues were the leading contributors. At the sector level, the utilities, school districts, and corporate-backed categories made the largest contributions. Positions in select high yield securities, particularly Puerto Rico Contingent Value Instruments and Puerto Rico Electric and Power Authority, further helped results. The Fund’s cash position had no material impact on performance.
What detracted from performance?
At a time of robust returns for the Fund and the broader market, all segments of the portfolio contributed positively. However, a few individual holdings detracted. Positions in the bonds of Brightline East and Brightline West, which were issued to finance high-speed rail projects, were notable detractors at the individual security level.
The views expressed reflect the opinions of BlackRock as of the date of this report and are subject to change based on changes in market, economic or other conditions. These views are not intended to be a forecast of future events and are no guarantee of future results.
Fund performance
Cumulative performance: June 1, 2016 through May 31, 2026
Initial investment of $10,000
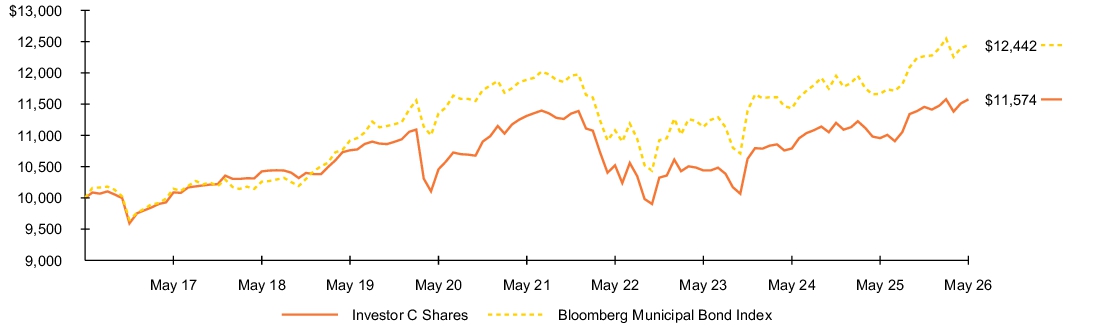
See “Average annual total returns” for additional information on fund performance.
| Average annual total returns | ||||||
| 1 Year | 5 Years | 10 Years | ||||
| 4.86 | % | 0.16 | % | 1.47 | % | |
| 3.86 | 0.16 | 1.47 | ||||
| 6.67 | 0.92 | 2.21 | ||||
| 6.38 | 0.73 |
| Key Fund statistics | |
| $2,447,515,998 | |
| 283 | |
| $8,590,542 | |
| 79% |
What did the Fund invest in?
(as of May 31, 2026)
| Sector allocation | ||
| Sector(a) | Percent of Total Investments(b) |
|
| 28.7 | % | |
| 17.1 | ||
| 14.6 | ||
| 13.6 | ||
| 8.9 | ||
| 4.9 | ||
| 4.5 | ||
| 3.0 | ||
| 2.6 | ||
| 2.1 | ||
| (c) | ||
| Credit quality allocation | ||
| Credit Rating(d) | Percent of Total Investments(b) |
|
| 10.9 | % | |
| 64.8 | ||
| 7.6 | ||
| 1.2 | ||
| (c) | ||
| 0.1 | ||
| 15.4 | ||
| For purposes of this report, sector sub-classifications may differ from those utilized by the Fund for compliance purposes. |
| Excludes short-term securities. |
| Rounds to less than 0.1%. |
| For purposes of this report, credit quality ratings shown above reflect the highest rating assigned by either S&P Global Ratings or Moody’s Investors Service, Inc. if ratings differ. These rating agencies are independent, nationally recognized statistical rating organizations and are widely used. Investment grade ratings are credit ratings of BBB/Baa or higher. Below investment grade ratings are credit ratings of BB/Ba or lower. Investments designated N/R are not rated by either rating agency. Unrated investments do not necessarily indicate low credit quality. Credit quality ratings are subject to change. |
What were the Fund costs for the last year ?
(based on a hypothetical $10,000 investment)
| Class name | Costs of a $10,000 investment |
Costs paid as a percentage of a $10,000 investment |
| $60 | 0.58% |
How did the Fund perform last year ?
- For the reporting period ended May 31, 2026, the Fund’s Investor A1 Shares returned 5.73%.
- For the same period, the Fund’s benchmark, the Bloomberg Municipal Bond Index, returned 6.67% and the Fund’s customized reference benchmark, the California Customized Reference Benchmark, returned 6.38%.
What contributed to performance?
Holdings in AA rated bonds made the largest contribution to absolute performance, reflecting their positive returns and sizable portfolio weighting. With respect to maturities, 15- to 25-year issues were the leading contributors. At the sector level, the utilities, school districts, and corporate-backed categories made the largest contributions. Positions in select high yield securities, particularly Puerto Rico Contingent Value Instruments and Puerto Rico Electric and Power Authority, further helped results. The Fund’s cash position had no material impact on performance.
What detracted from performance?
At a time of robust returns for the Fund and the broader market, all segments of the portfolio contributed positively. However, a few individual holdings detracted. Positions in the bonds of Brightline East and Brightline West, which were issued to finance high-speed rail projects, were notable detractors at the individual security level.
The views expressed reflect the opinions of BlackRock as of the date of this report and are subject to change based on changes in market, economic or other conditions. These views are not intended to be a forecast of future events and are no guarantee of future results.
Fund performance
Cumulative performance: June 1, 2016 through May 31, 2026
Initial investment of $10,000
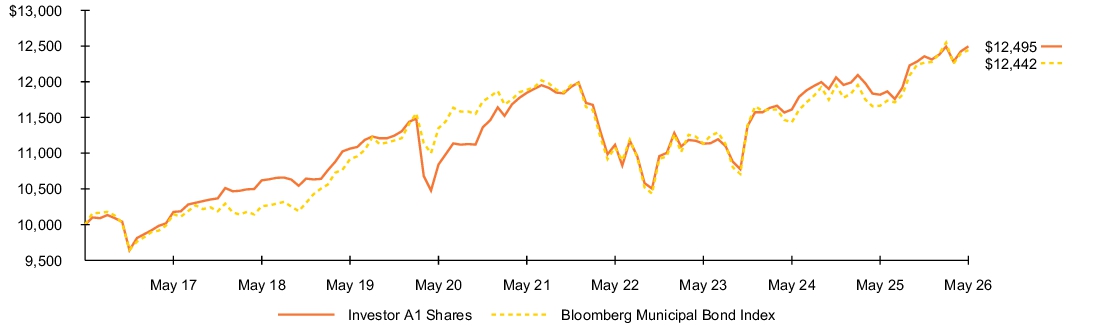
See “Average annual total returns” for additional information on fund performance.
| Average annual total returns | ||||||
| 1 Year | 5 Years | 10 Years | ||||
| 5.73 | % | 1.07 | % | 2.25 | % | |
| 6.67 | 0.92 | 2.21 | ||||
| 6.38 | 0.73 |
| Key Fund statistics | |
| $2,447,515,998 | |
| 283 | |
| $8,590,542 | |
| 79% |
What did the Fund invest in?
(as of May 31, 2026)
| Sector allocation | ||
| Sector(a) | Percent of Total Investments(b) |
|
| 28.7 | % | |
| 17.1 | ||
| 14.6 | ||
| 13.6 | ||
| 8.9 | ||
| 4.9 | ||
| 4.5 | ||
| 3.0 | ||
| 2.6 | ||
| 2.1 | ||
| (c) | ||
| Credit quality allocation | ||
| Credit Rating(d) | Percent of Total Investments(b) |
|
| 10.9 | % | |
| 64.8 | ||
| 7.6 | ||
| 1.2 | ||
| (c) | ||
| 0.1 | ||
| 15.4 | ||
| For purposes of this report, sector sub-classifications may differ from those utilized by the Fund for compliance purposes. |
| Excludes short-term securities. |
| Rounds to less than 0.1%. |
| For purposes of this report, credit quality ratings shown above reflect the highest rating assigned by either S&P Global Ratings or Moody’s Investors Service, Inc. if ratings differ. These rating agencies are independent, nationally recognized statistical rating organizations and are widely used. Investment grade ratings are credit ratings of BBB/Baa or higher. Below investment grade ratings are credit ratings of BB/Ba or lower. Investments designated N/R are not rated by either rating agency. Unrated investments do not necessarily indicate low credit quality. Credit quality ratings are subject to change. |
What were the Fund costs for the last year ?
(based on a hypothetical $10,000 investment)
| Class name | Costs of a $10,000 investment |
Costs paid as a percentage of a $10,000 investment |
| $76 | 0.74% |
How did the Fund perform last year ?
- For the reporting period ended May 31, 2026, the Fund’s Investor A Shares returned 5.65%.
- For the same period, the Fund’s benchmark, the Bloomberg Municipal Bond Index, returned 6.67% and the Fund’s customized reference benchmark, the California Customized Reference Benchmark, returned 6.38%.
What contributed to performance?
Holdings in AA rated bonds made the largest contribution to absolute performance, reflecting their positive returns and sizable portfolio weighting. With respect to maturities, 15- to 25-year issues were the leading contributors. At the sector level, the utilities, school districts, and corporate-backed categories made the largest contributions. Positions in select high yield securities, particularly Puerto Rico Contingent Value Instruments and Puerto Rico Electric and Power Authority, further helped results. The Fund’s cash position had no material impact on performance.
What detracted from performance?
At a time of robust returns for the Fund and the broader market, all segments of the portfolio contributed positively. However, a few individual holdings detracted. Positions in the bonds of Brightline East and Brightline West, which were issued to finance high-speed rail projects, were notable detractors at the individual security level.
The views expressed reflect the opinions of BlackRock as of the date of this report and are subject to change based on changes in market, economic or other conditions. These views are not intended to be a forecast of future events and are no guarantee of future results.
Fund performance
Cumulative performance: June 1, 2016 through May 31, 2026
Initial investment of $10,000
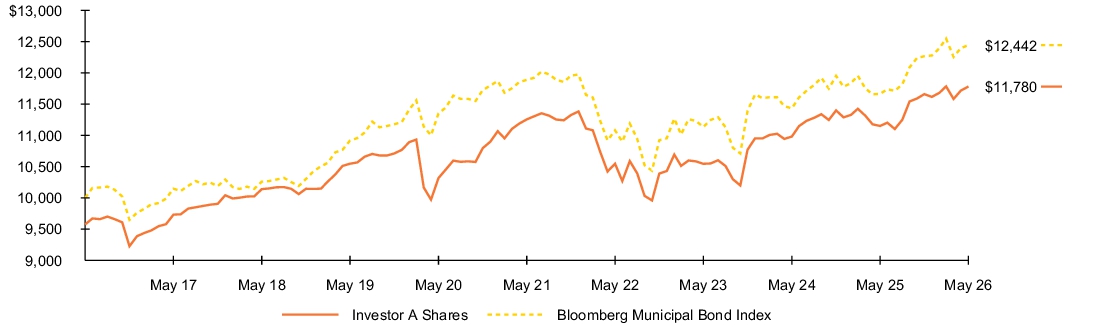
See “Average annual total returns” for additional information on fund performance.
| Average annual total returns | ||||||
| 1 Year | 5 Years | 10 Years | ||||
| 5.65 | % | 0.92 | % | 2.09 | % | |
| 1.16 | 0.04 | 1.65 | ||||
| 6.67 | 0.92 | 2.21 | ||||
| 6.38 | 0.73 |
| Key Fund statistics | |
| $2,447,515,998 | |
| 283 | |
| $8,590,542 | |
| 79% |
What did the Fund invest in?
(as of May 31, 2026)
| Sector allocation | ||
| Sector(a) | Percent of Total Investments(b) |
|
| 28.7 | % | |
| 17.1 | ||
| 14.6 | ||
| 13.6 | ||
| 8.9 | ||
| 4.9 | ||
| 4.5 | ||
| 3.0 | ||
| 2.6 | ||
| 2.1 | ||
| (c) | ||
| Credit quality allocation | ||
| Credit Rating(d) | Percent of Total Investments(b) |
|
| 10.9 | % | |
| 64.8 | ||
| 7.6 | ||
| 1.2 | ||
| (c) | ||
| 0.1 | ||
| 15.4 | ||
| For purposes of this report, sector sub-classifications may differ from those utilized by the Fund for compliance purposes. |
| Excludes short-term securities. |
| Rounds to less than 0.1%. |
| For purposes of this report, credit quality ratings shown above reflect the highest rating assigned by either S&P Global Ratings or Moody’s Investors Service, Inc. if ratings differ. These rating agencies are independent, nationally recognized statistical rating organizations and are widely used. Investment grade ratings are credit ratings of BBB/Baa or higher. Below investment grade ratings are credit ratings of BB/Ba or lower. Investments designated N/R are not rated by either rating agency. Unrated investments do not necessarily indicate low credit quality. Credit quality ratings are subject to change. |
What were the Fund costs for the last year ?
(based on a hypothetical $10,000 investment)
| Class name | Costs of a $10,000 investment |
Costs paid as a percentage of a $10,000 investment |
| $50 | 0.49% |
How did the Fund perform last year ?
- For the reporting period ended May 31, 2026, the Fund’s Institutional Shares returned 5.90%.
- For the same period, the Fund’s benchmark, the Bloomberg Municipal Bond Index, returned 6.67% and the Fund’s customized reference benchmark, the California Customized Reference Benchmark, returned 6.38%.
What contributed to performance?
Holdings in AA rated bonds made the largest contribution to absolute performance, reflecting their positive returns and sizable portfolio weighting. With respect to maturities, 15- to 25-year issues were the leading contributors. At the sector level, the utilities, school districts, and corporate-backed categories made the largest contributions. Positions in select high yield securities, particularly Puerto Rico Contingent Value Instruments and Puerto Rico Electric and Power Authority, further helped results. The Fund’s cash position had no material impact on performance.
What detracted from performance?
At a time of robust returns for the Fund and the broader market, all segments of the portfolio contributed positively. However, a few individual holdings detracted. Positions in the bonds of Brightline East and Brightline West, which were issued to finance high-speed rail projects, were notable detractors at the individual security level.
The views expressed reflect the opinions of BlackRock as of the date of this report and are subject to change based on changes in market, economic or other conditions. These views are not intended to be a forecast of future events and are no guarantee of future results.
Fund performance
Cumulative performance: June 1, 2016 through May 31, 2026
Initial investment of $10,000
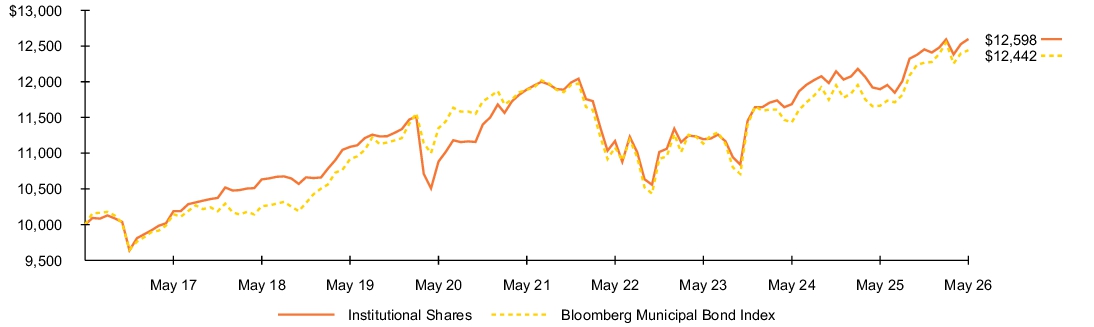
See “Average annual total returns” for additional information on fund performance.
| Average annual total returns | ||||||
| 1 Year | 5 Years | 10 Years | ||||
| 5.90 | % | 1.16 | % | 2.34 | % | |
| 6.67 | 0.92 | 2.21 | ||||
| 6.38 | 0.73 |
| Key Fund statistics | |
| $2,447,515,998 | |
| 283 | |
| $8,590,542 | |
| 79% |
What did the Fund invest in?
(as of May 31, 2026)
| Sector allocation | ||
| Sector(a) | Percent of Total Investments(b) |
|
| 28.7 | % | |
| 17.1 | ||
| 14.6 | ||
| 13.6 | ||
| 8.9 | ||
| 4.9 | ||
| 4.5 | ||
| 3.0 | ||
| 2.6 | ||
| 2.1 | ||
| (c) | ||
| Credit quality allocation | ||
| Credit Rating(d) | Percent of Total Investments(b) |
|
| 10.9 | % | |
| 64.8 | ||
| 7.6 | ||
| 1.2 | ||
| (c) | ||
| 0.1 | ||
| 15.4 | ||
| For purposes of this report, sector sub-classifications may differ from those utilized by the Fund for compliance purposes. |
| Excludes short-term securities. |
| Rounds to less than 0.1%. |
| For purposes of this report, credit quality ratings shown above reflect the highest rating assigned by either S&P Global Ratings or Moody’s Investors Service, Inc. if ratings differ. These rating agencies are independent, nationally recognized statistical rating organizations and are widely used. Investment grade ratings are credit ratings of BBB/Baa or higher. Below investment grade ratings are credit ratings of BB/Ba or lower. Investments designated N/R are not rated by either rating agency. Unrated investments do not necessarily indicate low credit quality. Credit quality ratings are subject to change. |