Shareholder Report
|
6 Months Ended |
|
May 31, 2026
USD ($)
Holding
|
|---|
| Shareholder Report [Line Items] |
|
|
| Document Type |
N-CSRS
|
|
| Amendment Flag |
false
|
|
| Registrant Name |
Northern Lights Fund Trust IV
|
|
| Entity Central Index Key |
0001644419
|
|
| Entity Investment Company Type |
N-1A
|
|
| Document Period End Date |
May 31, 2026
|
|
| Shareholder Report Annual or Semi-Annual |
Semi-Annual Shareholder Report
|
|
| C000194706 |
|
|
| Shareholder Report [Line Items] |
|
|
| Fund Name |
Inspire 100 ETF
|
|
| Trading Symbol |
BIBL
|
|
| Security Exchange Name |
NYSEArca
|
|
| Annual or Semi-Annual Statement [Text Block] |
This semi-annual shareholder report contains important information about Inspire 100 ETF for the period of December 1, 2025 to May 31, 2026.
|
|
| Additional Information [Text Block] |
You can find additional information about the Fund at www.inspireetf.com/etf/bibl. You can also request this information by contacting us at 1-877-658-9473.
|
|
| Additional Information Phone Number |
1-877-658-9473
|
|
| Additional Information Website |
www.inspireetf.com/etf/bibl
|
|
| Expenses [Text Block] |
What were the Fund’s costs for the last six months?(based on a hypothetical $10,000 investment) Table SummaryFund Name | Costs of a $10,000 investment | Costs paid as a percentage of a $10,000 investment |
|---|
Inspire 100 ETF | $19 | 0.35%Footnote Reference* |
|---|
| Footnote | Description | Footnote* | Annualized |
|
|
| Expenses Paid, Amount |
$ 19
|
|
| Expense Ratio, Percent |
0.35%
|
[1] |
| Factors Affecting Performance [Text Block] |
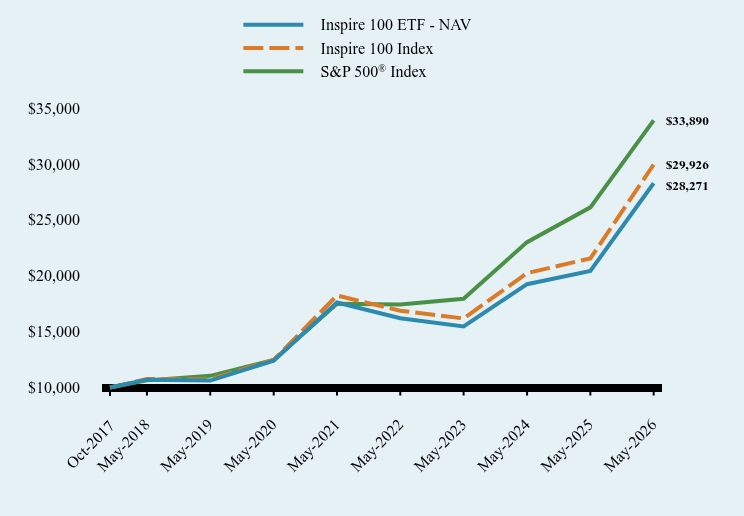
How did the Fund perform during the reporting period? The Fund had a NAV return of 19.77% for the first 6 months of the 2026 fiscal year. This strong performance was driven predominantly by the upward momentum in the US large-cap equity market, even with the short correction in March due to the military actions in Iran. The sectors that helped support the Fund's positive performance were Materials, Information Technology, Energy, and Industrials. The sectors that caused the most drag on performance were Consumer Discretionary and Health Care. Although there was volatility in the markets during the period due to uncertainty about the resolution of the Iran conflict, the Fund performed in line with the broader large-cap market. During the six-month period ended May 31, 2026, the Fund's use of the current investment strategies did not cause the Fund's performance to materially deviate from the manager's expectations, considering the uncertainty of the markets. |
|
| Performance Past Does Not Indicate Future [Text] |
The Fund’s past performance is not a good predictor of how the Fund will perform in the future.
|
|
| Line Graph [Table Text Block] |
Table Summary | Inspire 100 ETF - NAV | Inspire 100 Index | S&P 500® Index |
|---|
Oct-2017 | $10,000 | $10,000 | $10,000 |
|---|
May-2018 | $10,707 | $10,758 | $10,642 |
|---|
May-2019 | $10,626 | $10,742 | $11,045 |
|---|
May-2020 | $12,398 | $12,477 | $12,463 |
|---|
May-2021 | $17,602 | $18,230 | $17,488 |
|---|
May-2022 | $16,200 | $16,872 | $17,435 |
|---|
May-2023 | $15,461 | $16,178 | $17,945 |
|---|
May-2024 | $19,243 | $20,230 | $23,003 |
|---|
May-2025 | $20,424 | $21,552 | $26,113 |
|---|
May-2026 | $28,271 | $29,926 | $33,890 |
|---|
|
|
| Average Annual Return [Table Text Block] |
Table Summary | 6 Months | 1 Year | 5 years | Since Inception (October 30, 2017) |
|---|
Inspire 100 ETF - NAV | 19.77% | 38.42% | 9.94% | 12.87% |
|---|
Inspire 100 Index | 19.91% | 38.86% | 10.42% | 13.62% |
|---|
S&P 500® Index | 11.34% | 29.78% | 14.15% | 15.28% |
|---|
|
|
| Performance Inception Date |
Oct. 30, 2017
|
|
| No Deduction of Taxes [Text Block] |
The graph and table do not reflect the deduction of taxes that a shareholder would pay on fund distributions or redemption of fund shares.
|
|
| AssetsNet |
$ 459,983,965
|
|
| Holdings Count | Holding |
101
|
|
| Advisory Fees Paid, Amount |
$ 479,113
|
|
| InvestmentCompanyPortfolioTurnover |
5.00%
|
|
| Additional Fund Statistics [Text Block] |
- Net Assets$459,983,965
- Number of Portfolio Holdings101
- Advisory Fee (net of waivers)$479,113
- Portfolio Turnover5%
|
|
| Holdings [Text Block] |
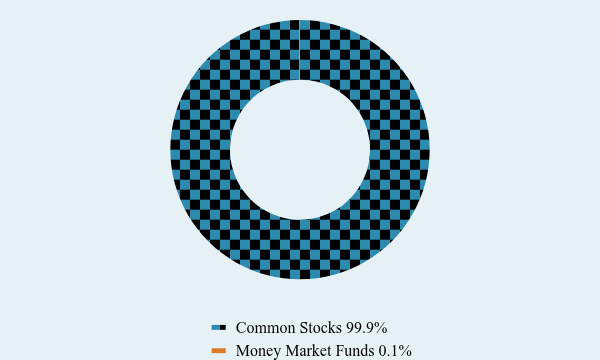
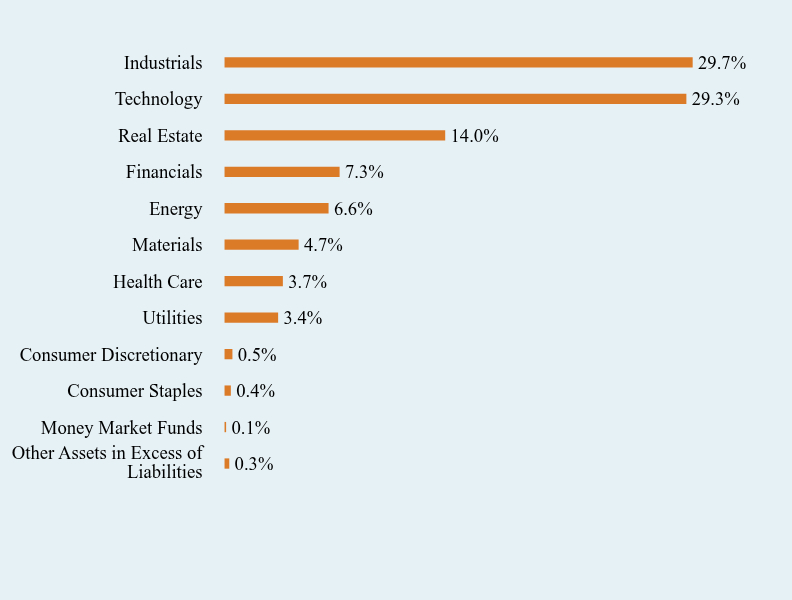
Asset Weighting (% of total investments)Table SummaryValue | Value |
|---|
Common Stocks | 99.9% | Money Market Funds | 0.1% | Sector Weighting (% of net assets)Table SummaryValue | Value |
|---|
Other Assets in Excess of Liabilities | 0.3% | Money Market Funds | 0.1% | Consumer Staples | 0.4% | Consumer Discretionary | 0.5% | Utilities | 3.4% | Health Care | 3.7% | Materials | 4.7% | Energy | 6.6% | Financials | 7.3% | Real Estate | 14.0% | Technology | 29.3% | Industrials | 29.7% | |
|
| Largest Holdings [Text Block] |
Top 10 Holdings (% of net assets)Table SummaryHolding Name | % of Net Assets |
|---|
Caterpillar, Inc. | 8.8% |
|---|
KLA Corporation | 5.4% |
|---|
Arista Networks, Inc. | 4.8% |
|---|
Amphenol Corporation, Class A | 4.3% |
|---|
Welltower, Inc. | 3.3% |
|---|
Interactive Brokers Group, Inc., Class A | 3.3% |
|---|
Prologis, Inc. | 3.0% |
|---|
Vertiv Holdings Company, Class A | 2.8% |
|---|
Progressive Corporation (The) | 2.5% |
|---|
Parker-Hannifin Corporation | 2.3% |
|---|
|
|
| Material Fund Change [Text Block] |
No material changes occurred during the period ended May 31, 2026. |
|
| C000248596 |
|
|
| Shareholder Report [Line Items] |
|
|
| Fund Name |
Inspire 500 ETF
|
|
| Trading Symbol |
PTL
|
|
| Security Exchange Name |
NYSEArca
|
|
| Annual or Semi-Annual Statement [Text Block] |
This semi-annual shareholder report contains important information about Inspire 500 ETF for the period of December 1, 2025 to May 31, 2026.
|
|
| Additional Information [Text Block] |
You can find additional information about the Fund at www.inspireetf.com/etf/ptl. You can also request this information by contacting us at 1-877-658-9473.
|
|
| Additional Information Phone Number |
1-877-658-9473
|
|
| Additional Information Website |
www.inspireetf.com/etf/ptl
|
|
| Expenses [Text Block] |
What were the Fund’s costs for the last six months?(based on a hypothetical $10,000 investment) Table SummaryFund Name | Costs of a $10,000 investment | Costs paid as a percentage of a $10,000 investment |
|---|
Inspire 500 ETF | $5 | 0.09%Footnote Reference* |
|---|
| Footnote | Description | Footnote* | Annualized |
|
|
| Expenses Paid, Amount |
$ 5
|
|
| Expense Ratio, Percent |
0.09%
|
[2] |
| Factors Affecting Performance [Text Block] |
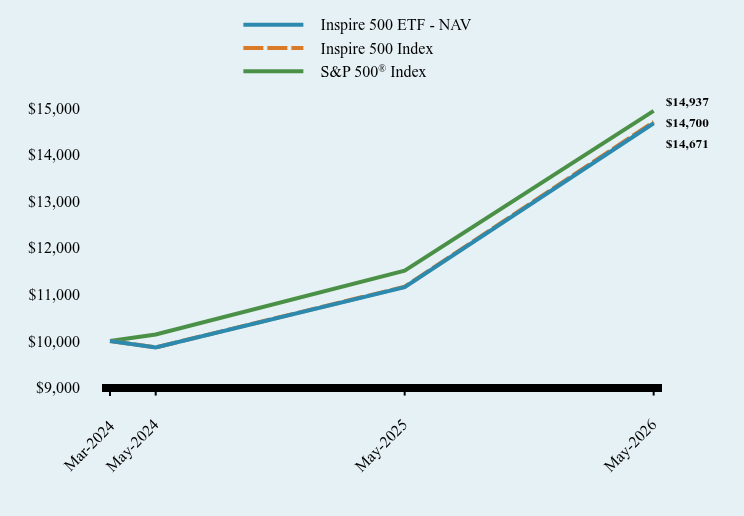
How did the Fund perform during the reporting period? The Fund had a return on the NAV for the first 6 months of the 2026 fiscal year of 13.17%. This strong positive performance was driven by upward momentum over the past several months in the broader US large cap markets. The sectors that contributed most to the positive performance within the Fund were Energy, Information Technology, Materials, and Industrials. The sectors that caused the largest drag on performance were Health Care, Financials, and Consumer Discretionary. During the last several months, the adviser has seen a minor correction and strong recovery in the broader US large cap market due to uncertainty about the path forward in the Iran war. The Fund performed better than the broader large-cap market during the period due to the Fund having minimal exposure to the Mega Cap Growth stocks that have been the driving force in the US large-cap markets for the past couple of years but have been a drag on the market during the last several months. During the six-month period ended May 31, 2026, the Fund's use of the current investment strategies did not cause the Fund's performance to materially deviate from the manager's expectations considering the uncertainty of the markets. |
|
| Performance Past Does Not Indicate Future [Text] |
The Fund’s past performance is not a good predictor of how the Fund will perform in the future.
|
|
| Line Graph [Table Text Block] |
Table Summary | Inspire 500 ETF - NAV | Inspire 500 Index | S&P 500® Index |
|---|
Mar-2024 | $10,000 | $10,000 | $10,000 |
|---|
May-2024 | $9,860 | $9,862 | $10,138 |
|---|
May-2025 | $11,155 | $11,163 | $11,509 |
|---|
May-2026 | $14,671 | $14,700 | $14,937 |
|---|
|
|
| Average Annual Return [Table Text Block] |
Table Summary | 6 Months | 1 Year | Since Inception (March 25, 2024) |
|---|
Inspire 500 ETF - NAV | 13.17% | 31.52% | 19.19% |
|---|
Inspire 500 Index | 13.20% | 31.68% | 19.30% |
|---|
S&P 500® Index | 11.34% | 29.78% | 20.17% |
|---|
|
|
| Performance Inception Date |
Mar. 25, 2024
|
|
| No Deduction of Taxes [Text Block] |
The graph and table do not reflect the deduction of taxes that a shareholder would pay on fund distributions or redemption of fund shares.
|
|
| AssetsNet |
$ 843,201,434
|
|
| Holdings Count | Holding |
484
|
|
| Advisory Fees Paid, Amount |
$ 307,362
|
|
| InvestmentCompanyPortfolioTurnover |
2.00%
|
|
| Additional Fund Statistics [Text Block] |
- Net Assets$843,201,434
- Number of Portfolio Holdings484
- Advisory Fee $307,362
- Portfolio Turnover2%
|
|
| Holdings [Text Block] |
Asset Weighting (% of total investments)Table SummaryValue | Value |
|---|
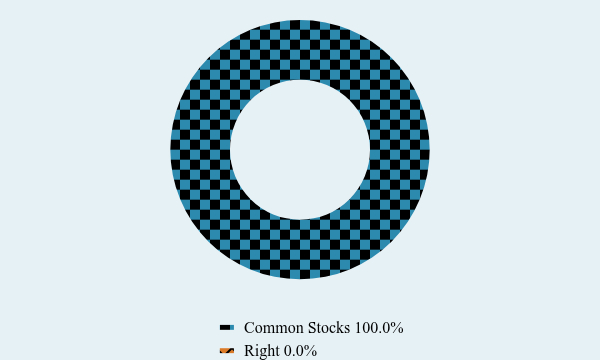
Common Stocks | 100.0% | Right | 0.0% | Sector Weighting (% of net assets)Table SummaryValue | Value |
|---|
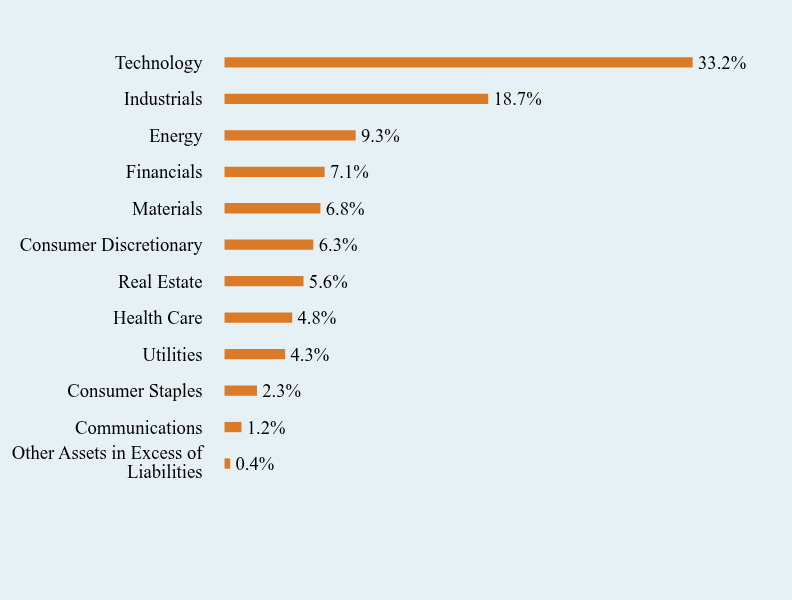
Other Assets in Excess of Liabilities | 0.4% | Communications | 1.2% | Consumer Staples | 2.3% | Utilities | 4.3% | Health Care | 4.8% | Real Estate | 5.6% | Consumer Discretionary | 6.3% | Materials | 6.8% | Financials | 7.1% | Energy | 9.3% | Industrials | 18.7% | Technology | 33.2% | |
|
| Largest Holdings [Text Block] |
Top 10 Holdings (% of net assets)Table SummaryHolding Name | % of Net Assets |
|---|
Broadcom, Inc. | 12.9% |
|---|
Exxon Mobil Corporation | 3.5% |
|---|
Caterpillar, Inc. | 2.1% |
|---|
Home Depot, Inc. (The) | 1.9% |
|---|
Palantir Technologies, Inc., Class A | 1.9% |
|---|
QUALCOMM, Inc. | 1.5% |
|---|
GE Vernova, Inc. | 1.5% |
|---|
Linde PLC | 1.4% |
|---|
KLA Corporation | 1.2% |
|---|
Arista Networks, Inc. | 1.1% |
|---|
|
|
| Material Fund Change [Text Block] |
No material changes occurred during the period ended May 31, 2026. |
|
| C000176728 |
|
|
| Shareholder Report [Line Items] |
|
|
| Fund Name |
Inspire Corporate Bond ETF
|
|
| Trading Symbol |
IBD
|
|
| Security Exchange Name |
NYSEArca
|
|
| Annual or Semi-Annual Statement [Text Block] |
This semi-annual shareholder report contains important information about Inspire Corporate Bond ETF for the period of December 1, 2025 to May 31, 2026.
|
|
| Additional Information [Text Block] |
You can find additional information about the Fund at www.inspireetf.com/etf/ibd. You can also request this information by contacting us at 1-877-658-9473.
|
|
| Additional Information Phone Number |
1-877-658-9473
|
|
| Additional Information Website |
www.inspireetf.com/etf/ibd
|
|
| Expenses [Text Block] |
What were the Fund’s costs for the last six months?(based on a hypothetical $10,000 investment) Table SummaryFund Name | Costs of a $10,000 investment | Costs paid as a percentage of a $10,000 investment |
|---|
Inspire Corporate Bond ETF | $21 | 0.41%Footnote Reference* |
|---|
| Footnote | Description | Footnote* | Annualized |
|
|
| Expenses Paid, Amount |
$ 21
|
|
| Expense Ratio, Percent |
0.41%
|
[3] |
| Factors Affecting Performance [Text Block] |
How did the Fund perform during the reporting period? The Fund had a return on the NAV for the first 6 months of the 2026 fiscal year of 0.66%. This slightly positive performance was driven by falling interest rates on the short end of the yield curve versus interest rates rising on the intermediate and long end of the yield curve, as expectations for rate cuts by the Federal Reserve may be off the table until 2027. The investment-grade quality bond portfolio of the Fund performed in line with the broader fixed income market even though the Fund had no exposure to US Treasuries or mortgage-backed securities. During the six-month period ended May 31, 2026, the Fund's use of the current investment strategies did not cause the Fund's performance to materially deviate from the manager's expectations considering the uncertainty of the markets. |
|
| Performance Past Does Not Indicate Future [Text] |
The Fund’s past performance is not a good predictor of how the Fund will perform in the future.
|
|
| Line Graph [Table Text Block] |
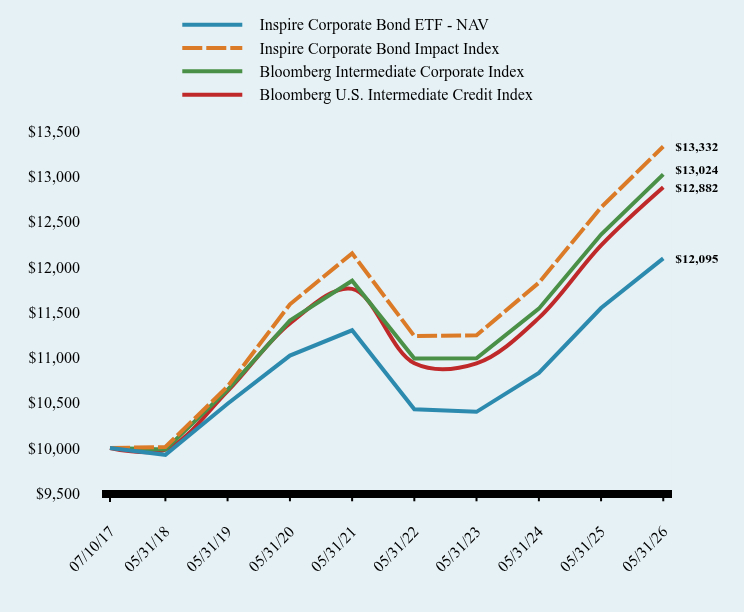
Table Summary | Inspire Corporate Bond ETF - NAV | Inspire Corporate Bond Impact Index | Bloomberg Intermediate Corporate Index | Bloomberg U.S. Intermediate Credit Index |
|---|
07/10/17 | $10,000 | $10,000 | $10,000 | $10,000 |
|---|
05/31/18 | $9,925 | $10,011 | $9,983 | $9,982 |
|---|
05/31/19 | $10,490 | $10,680 | $10,644 | $10,629 |
|---|
05/31/20 | $11,022 | $11,588 | $11,410 | $11,377 |
|---|
05/31/21 | $11,301 | $12,151 | $11,849 | $11,759 |
|---|
05/31/22 | $10,428 | $11,237 | $10,989 | $10,937 |
|---|
05/31/23 | $10,400 | $11,245 | $10,992 | $10,936 |
|---|
05/31/24 | $10,830 | $11,827 | $11,540 | $11,438 |
|---|
05/31/25 | $11,547 | $12,659 | $12,359 | $12,240 |
|---|
05/31/26 | $12,095 | $13,332 | $13,024 | $12,882 |
|---|
|
|
| Average Annual Return [Table Text Block] |
Table Summary | 6 Months | 1 Year | 5 years | Since Inception (July 10, 2017) |
|---|
Inspire Corporate Bond ETF - NAV | 0.66% | 4.74% | 1.37% | 2.16% |
|---|
Inspire Corporate Bond Impact Index | 0.99% | 5.31% | 1.87% | 3.29% |
|---|
Bloomberg Intermediate Corporate Index | 0.82% | 5.38% | 1.91% | 3.02% |
|---|
Bloomberg U.S. Intermediate Credit Index | 0.78% | 5.25% | 1.84% | 2.89% |
|---|
|
|
| Performance Inception Date |
Jul. 10, 2017
|
|
| No Deduction of Taxes [Text Block] |
The graph and table do not reflect the deduction of taxes that a shareholder would pay on fund distributions or redemption of fund shares.
|
|
| AssetsNet |
$ 466,800,827
|
|
| Holdings Count | Holding |
251
|
|
| Advisory Fees Paid, Amount |
$ 701,348
|
|
| InvestmentCompanyPortfolioTurnover |
9.00%
|
|
| Additional Fund Statistics [Text Block] |
- Net Assets$466,800,827
- Number of Portfolio Holdings251
- Advisory Fee $701,348
- Portfolio Turnover9%
|
|
| Holdings [Text Block] |
Asset Weighting (% of total investments)Table SummaryValue | Value |
|---|
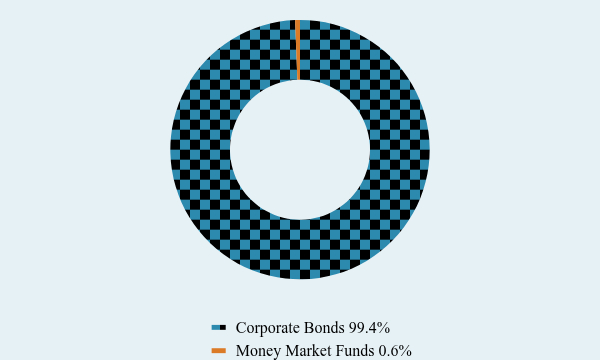
Corporate Bonds | 99.4% | Money Market Funds | 0.6% | Sector Weighting (% of net assets)Table SummaryValue | Value |
|---|
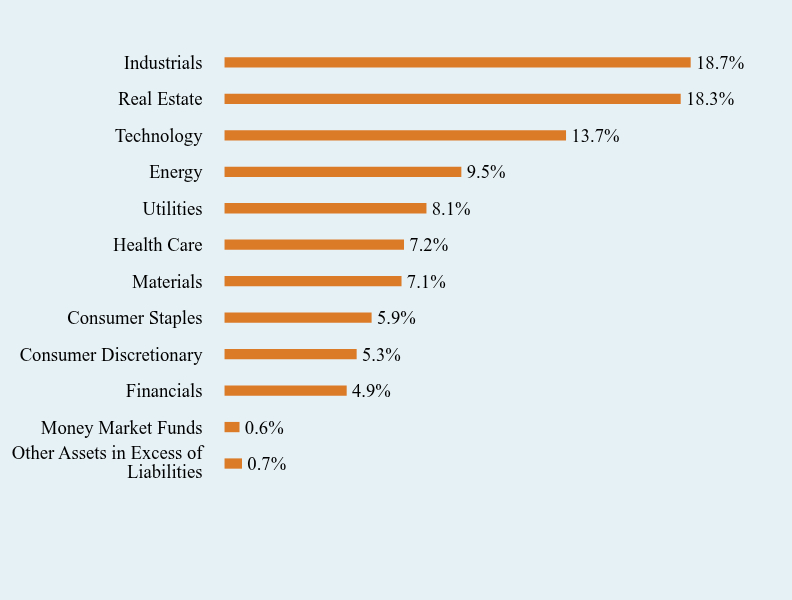
Other Assets in Excess of Liabilities | 0.7% | Money Market Funds | 0.6% | Financials | 4.9% | Consumer Discretionary | 5.3% | Consumer Staples | 5.9% | Materials | 7.1% | Health Care | 7.2% | Utilities | 8.1% | Energy | 9.5% | Technology | 13.7% | Real Estate | 18.3% | Industrials | 18.7% | |
|
| Largest Holdings [Text Block] |
Top 10 Holdings (% of net assets)Table SummaryHolding Name | % of Net Assets |
|---|
Trimble, Inc., 4.900%, 06/15/28 | 2.2% |
|---|
Amphenol Corporation, 4.350%, 06/01/29 | 2.2% |
|---|
Alexandria Real Estate Equities, Inc., 4.900%, 12/15/30 | 2.2% |
|---|
Valero Energy Corporation, 4.350%, 06/01/28 | 2.2% |
|---|
Cboe Global Markets, Inc., 3.650%, 01/12/27 | 2.2% |
|---|
Camden Property Trust, 4.900%, 01/15/34 | 2.2% |
|---|
AutoZone, Inc., 3.750%, 06/01/27 | 2.2% |
|---|
Automatic Data Processing, Inc., 4.450%, 09/09/34 | 2.1% |
|---|
Baxter International, Inc., 3.950%, 04/01/30 | 2.1% |
|---|
Jabil, Inc., 3.600%, 01/15/30 | 2.1% |
|---|
|
|
| Material Fund Change [Text Block] |
No material changes occurred during the period ended May 31, 2026. |
|
| C000223048 |
|
|
| Shareholder Report [Line Items] |
|
|
| Fund Name |
Inspire Growth ETF
|
|
| Trading Symbol |
GLRY
|
|
| Security Exchange Name |
NYSEArca
|
|
| Annual or Semi-Annual Statement [Text Block] |
semi-annual shareholder report
|
|
| Additional Information Phone Number |
1-877-658-9473
|
|
| Additional Information Website |
www.inspireetf.com/etf/glry
|
|
| Expenses [Text Block] |
What were the Fund’s costs for the last six months?(based on a hypothetical $10,000 investment) Table SummaryFund Name | Costs of a $10,000 investment | Costs paid as a percentage of a $10,000 investment |
|---|
Inspire Growth ETF | $43 | 0.80%Footnote Reference* |
|---|
| Footnote | Description | Footnote* | Annualized |
|
|
| Expenses Paid, Amount |
$ 43
|
|
| Expense Ratio, Percent |
0.80%
|
[4] |
| Factors Affecting Performance [Text Block] |
How did the Fund perform during the reporting period? The Fund had a return on the NAV for the first 6 months of the 2026 fiscal year of 13.68%. This strong positive performance was driven predominantly by the upward trajectory of the US large-cap and mid-cap markets during the period. The Fund’s focus on the momentum factor, which was in favor over the period, as well as security selection in the Energy, Industrials and Information Technology sectors helped achieve the positive performance within the Fund during the period. The sectors that caused the largest drag on performance were Communication Services and Utilities. Although there was volatility in the markets during the period due to uncertainty about the resolution of the Iran war, the Fund performed well versus the broader large-cap and mid-cap markets. During the six-month period
ended May 31, 2026, the Fund's use of the current investment strategies did not cause the Fund's performance to materially deviate from the manager's expectations considering the uncertainty of the markets. |
|
| Performance Past Does Not Indicate Future [Text] |
The Fund’s past performance is not a good predictor of how the Fund will perform in the future.
|
|
| Line Graph [Table Text Block] |
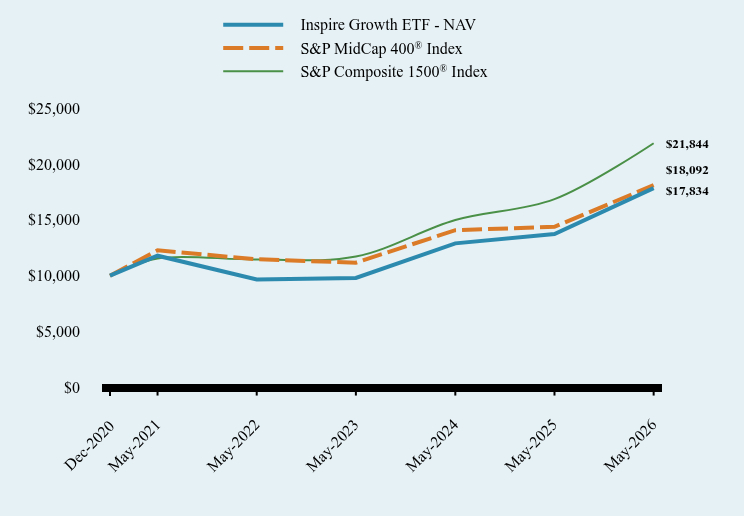
Table Summary | Inspire Growth ETF - NAV | S&P MidCap 400® Index | S&P Composite 1500® Index |
|---|
Dec-2020 | $10,000 | $10,000 | $10,000 |
|---|
May-2021 | $11,788 | $12,269 | $11,548 |
|---|
May-2022 | $9,660 | $11,469 | $11,443 |
|---|
May-2023 | $9,806 | $11,168 | $11,712 |
|---|
May-2024 | $12,893 | $14,068 | $14,975 |
|---|
May-2025 | $13,732 | $14,373 | $16,845 |
|---|
May-2026 | $17,834 | $18,092 | $21,844 |
|---|
|
|
| Average Annual Return [Table Text Block] |
Table Summary | 6 Months | 1 Year | 5 years | Since Inception (December 7, 2020) |
|---|
Inspire Growth ETF - NAV | 13.68% | 29.88% | 8.63% | 11.14% |
|---|
S&P MidCap 400® Index | 13.35% | 25.88% | 8.08% | 11.43% |
|---|
S&P Composite 1500® Index | 11.54% | 29.67% | 13.60% | 15.33% |
|---|
|
|
| Performance Inception Date |
Dec. 07, 2020
|
|
| No Deduction of Taxes [Text Block] |
The graph and table do not reflect the deduction of taxes that a shareholder would pay on fund distributions or redemption of fund shares.
|
|
| AssetsNet |
$ 163,666,611
|
|
| Holdings Count | Holding |
33
|
|
| Advisory Fees Paid, Amount |
$ 461,291
|
|
| InvestmentCompanyPortfolioTurnover |
15.00%
|
|
| Additional Fund Statistics [Text Block] |
- Net Assets$163,666,611
- Number of Portfolio Holdings33
- Advisory Fee $461,291
- Portfolio Turnover15%
|
|
| Holdings [Text Block] |
Asset Weighting (% of total investments)Table SummaryValue | Value |
|---|
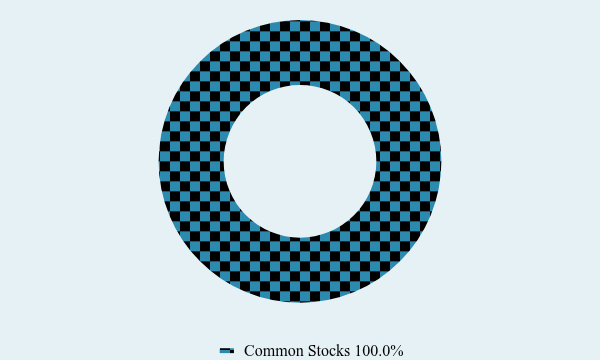
Common Stocks | 100.0% | Sector Weighting (% of net assets)Table SummaryValue | Value |
|---|
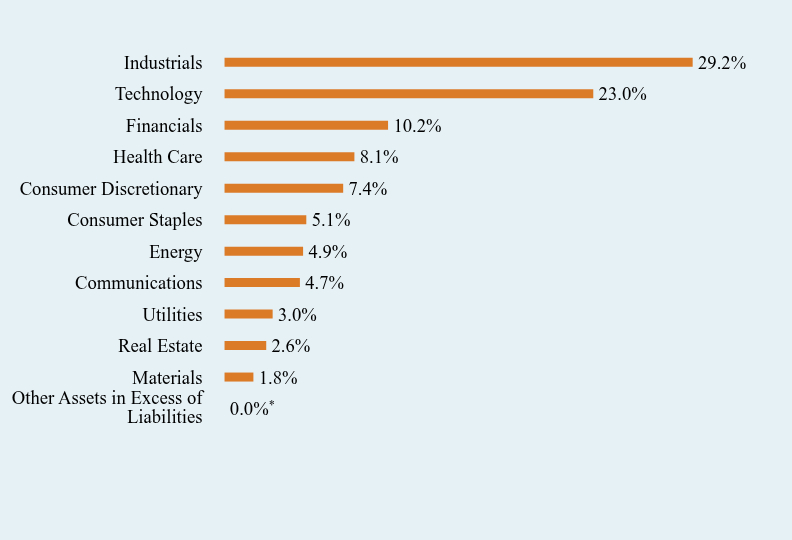
Other Assets in Excess of Liabilities | 0.0%Footnote Reference* | Materials | 1.8% | Real Estate | 2.6% | Utilities | 3.0% | Communications | 4.7% | Energy | 4.9% | Consumer Staples | 5.1% | Consumer Discretionary | 7.4% | Health Care | 8.1% | Financials | 10.2% | Technology | 23.0% | Industrials | 29.2% | | Footnote | Description | Footnote* | Percentage rounds to less than 0.1% |
|
|
| Largest Holdings [Text Block] |
Top 10 Holdings (% of net assets)Table SummaryHolding Name | % of Net Assets |
|---|
KLA Corporation | 5.9% |
|---|
Monolithic Power Systems, Inc. | 5.6% |
|---|
Broadcom, Inc. | 5.6% |
|---|
Curtiss-Wright Corporation | 5.0% |
|---|
AppLovin Corporation, Class A | 4.7% |
|---|
EMCOR Group, Inc. | 4.7% |
|---|
Amphenol Corporation, Class A | 4.7% |
|---|
BWX Technologies, Inc. | 4.1% |
|---|
United Therapeutics Corporation | 3.8% |
|---|
Casey's General Stores, Inc. | 3.8% |
|---|
|
|
| Material Fund Change [Text Block] |
No material changes occurred during the period ended May 31, 2026. |
|
| C000237005 |
|
|
| Shareholder Report [Line Items] |
|
|
| Fund Name |
Inspire Fidelis Multi Factor ETF
|
|
| Trading Symbol |
FDLS
|
|
| Security Exchange Name |
NYSEArca
|
|
| Annual or Semi-Annual Statement [Text Block] |
This semi-annual shareholder report contains important information about Inspire Fidelis Multi Factor ETF for the period of December 1, 2025 to May 31, 2026.
|
|
| Additional Information [Text Block] |
You can find additional information about the Fund at www.inspireetf.com/etf/fdls. You can also request this information by contacting us at 1-877-658-9473.
|
|
| Additional Information Phone Number |
1-877-658-9473
|
|
| Additional Information Website |
www.inspireetf.com/etf/fdls
|
|
| Expenses [Text Block] |
What were the Fund’s costs for the last six months?(based on a hypothetical $10,000 investment) Table SummaryFund Name | Costs of a $10,000 investment | Costs paid as a percentage of a $10,000 investment |
|---|
Inspire Fidelis Multi Factor ETF | $31 | 0.58%Footnote Reference* |
|---|
| Footnote | Description | Footnote* | Annualized |
|
|
| Expenses Paid, Amount |
$ 31
|
|
| Expense Ratio, Percent |
0.58%
|
[5] |
| Factors Affecting Performance [Text Block] |
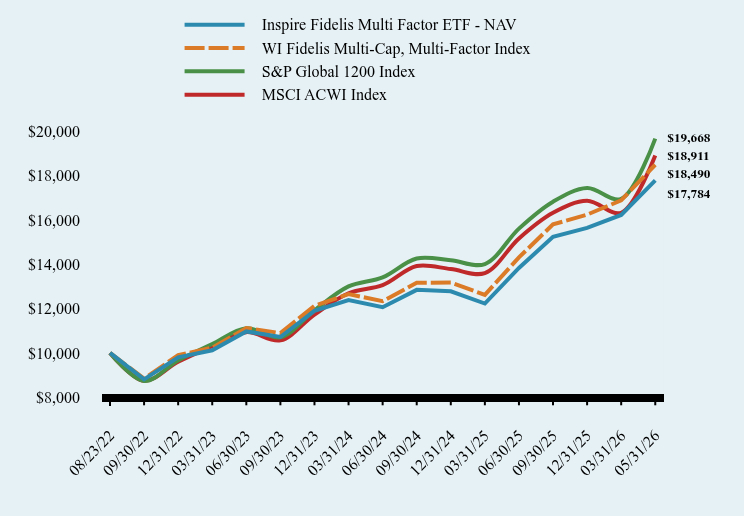
How did the Fund perform during the reporting period? The Fund had a return on the NAV for the first 6 months of the 2026 fiscal year of 13.27%. This strong positive performance was driven predominantly by the upward momentum in the US equity markets, and in particular the small and mid-cap segments of the markets, during the period. It is also worth noting that the international markets helped with positive performance during the period. Security selection in the Information Technology, Real Estate, and Energy sectors contributed most to the positive performance. The sectors that caused the largest drag on performance were Health Care, Utilities, and Consumer Discretionary. Although there was volatility in the global markets during the period due to the Iran war and geopolitical tensions with Russia and China, the Fund performed in line with the broader global markets. During the six-month period ended May 31, 2026, the Fund's use of the current investment strategies did not cause the Fund's performance to materially deviate from the manager's expectations considering the uncertainty of the markets. |
|
| Performance Past Does Not Indicate Future [Text] |
The Fund’s past performance is not a good predictor of how the Fund will perform in the future.
|
|
| Line Graph [Table Text Block] |
Table Summary | Inspire Fidelis Multi Factor ETF - NAV | WI Fidelis Multi-Cap, Multi-Factor Index | S&P Global 1200 Index | MSCI ACWI Index |
|---|
08/23/22 | $10,000 | $10,000 | $10,000 | $10,000 |
|---|
09/30/22 | $8,808 | $8,841 | $8,736 | $8,746 |
|---|
12/31/22 | $9,799 | $9,899 | $9,661 | $9,600 |
|---|
03/31/23 | $10,120 | $10,239 | $10,404 | $10,301 |
|---|
06/30/23 | $10,970 | $11,126 | $11,118 | $10,938 |
|---|
09/30/23 | $10,721 | $10,896 | $10,711 | $10,566 |
|---|
12/31/23 | $11,897 | $12,125 | $11,920 | $11,731 |
|---|
03/31/24 | $12,384 | $12,654 | $13,001 | $12,693 |
|---|
06/30/24 | $12,064 | $12,336 | $13,409 | $13,057 |
|---|
09/30/24 | $12,846 | $13,164 | $14,261 | $13,921 |
|---|
12/31/24 | $12,782 | $13,173 | $14,181 | $13,783 |
|---|
03/31/25 | $12,230 | $12,622 | $14,008 | $13,601 |
|---|
06/30/25 | $13,834 | $14,312 | $15,609 | $15,168 |
|---|
09/30/25 | $15,242 | $15,801 | $16,824 | $16,325 |
|---|
12/31/25 | $15,642 | $16,239 | $17,440 | $16,862 |
|---|
03/31/26 | $16,226 | $16,885 | $16,953 | $16,322 |
|---|
05/31/26 | $17,784 | $18,490 | $19,668 | $18,911 |
|---|
|
|
| Average Annual Return [Table Text Block] |
Table Summary | 6 Months | 1 Year | Since Inception (August 23, 2022) |
|---|
Inspire Fidelis Multi Factor ETF - NAV | 13.27% | 35.72% | 16.50% |
|---|
WI Fidelis Multi-Cap, Multi-Factor Index | 13.45% | 36.53% | 17.71% |
|---|
S&P Global 1200 Index | 14.04% | 31.64% | 19.65% |
|---|
MSCI ACWI Index | 13.32% | 30.27% | 18.41% |
|---|
|
|
| Performance Inception Date |
Aug. 23, 2022
|
|
| No Deduction of Taxes [Text Block] |
The graph and table do not reflect the deduction of taxes that a shareholder would pay on fund distributions or redemption of fund shares.
|
|
| AssetsNet |
$ 201,576,203
|
|
| Holdings Count | Holding |
101
|
|
| Advisory Fees Paid, Amount |
$ 360,108
|
|
| InvestmentCompanyPortfolioTurnover |
119.00%
|
|
| Additional Fund Statistics [Text Block] |
- Net Assets$201,576,203
- Number of Portfolio Holdings101
- Advisory Fee $360,108
- Portfolio Turnover119%
|
|
| Holdings [Text Block] |
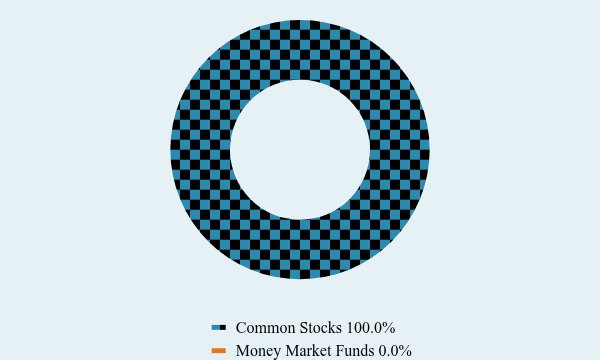
Asset Weighting (% of total investments)Table SummaryValue | Value |
|---|
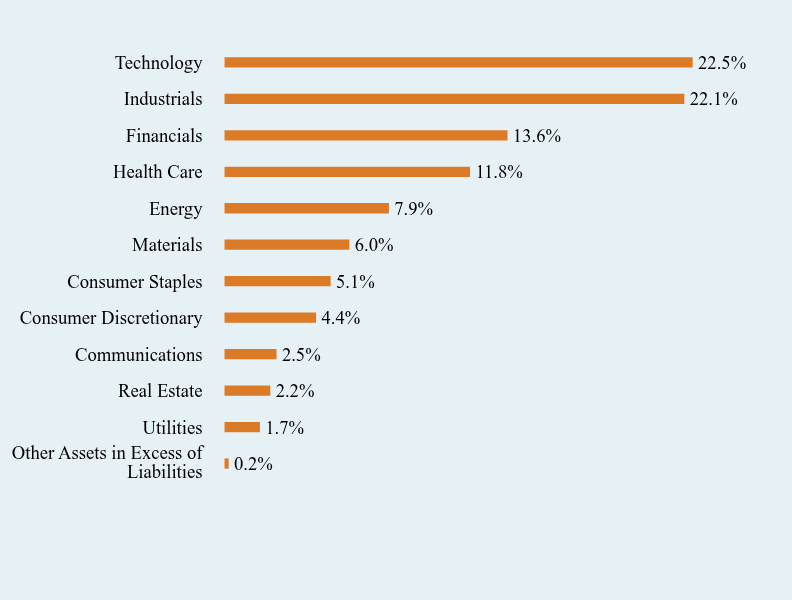
Common Stocks | 100.0% | Money Market Funds | 0.0% | Sector Weighting (% of net assets)Table SummaryValue | Value |
|---|
Other Assets in Excess of Liabilities | 0.2% | Utilities | 1.7% | Real Estate | 2.2% | Communications | 2.5% | Consumer Discretionary | 4.4% | Consumer Staples | 5.1% | Materials | 6.0% | Energy | 7.9% | Health Care | 11.8% | Financials | 13.6% | Industrials | 22.1% | Technology | 22.5% | |
|
| Largest Holdings [Text Block] |
Top 10 Holdings (% of net assets)Table SummaryHolding Name | % of Net Assets |
|---|
Sanmina Corporation | 1.9% |
|---|
MYR Group, Inc. | 1.6% |
|---|
ViaSat, Inc. | 1.5% |
|---|
Taboola.com Ltd. | 1.4% |
|---|
ArcBest Corporation | 1.4% |
|---|
Amkor Technology, Inc. | 1.4% |
|---|
Microchip Technology, Inc. | 1.3% |
|---|
China Yuchai International Ltd. | 1.3% |
|---|
Industrial Logistics Properties Trust | 1.3% |
|---|
Constellium S.E. | 1.3% |
|---|
|
|
| Material Fund Change [Text Block] |
No material changes occurred during the period ended May 31, 2026. |
|
| C000176729 |
|
|
| Shareholder Report [Line Items] |
|
|
| Fund Name |
Inspire Global Hope ETF
|
|
| Trading Symbol |
BLES
|
|
| Security Exchange Name |
NYSEArca
|
|
| Annual or Semi-Annual Statement [Text Block] |
This semi-annual shareholder report contains important information about Inspire Global Hope ETF for the period of December 1, 2025 to May 31, 2026.
|
|
| Additional Information [Text Block] |
You can find additional information about the Fund at www.inspireetf.com/etf/bles. You can also request this information by contacting us at 1-877-658-9473.
|
|
| Additional Information Phone Number |
1-877-658-9473
|
|
| Additional Information Website |
www.inspireetf.com/etf/bles
|
|
| Expenses [Text Block] |
What were the Fund’s costs for the last six months?(based on a hypothetical $10,000 investment) Table SummaryFund Name | Costs of a $10,000 investment | Costs paid as a percentage of a $10,000 investment |
|---|
Inspire Global Hope ETF | $29 | 0.54%Footnote Reference* |
|---|
| Footnote | Description | Footnote* | Annualized |
|
|
| Expenses Paid, Amount |
$ 29
|
|
| Expense Ratio, Percent |
0.54%
|
[6] |
| Factors Affecting Performance [Text Block] |
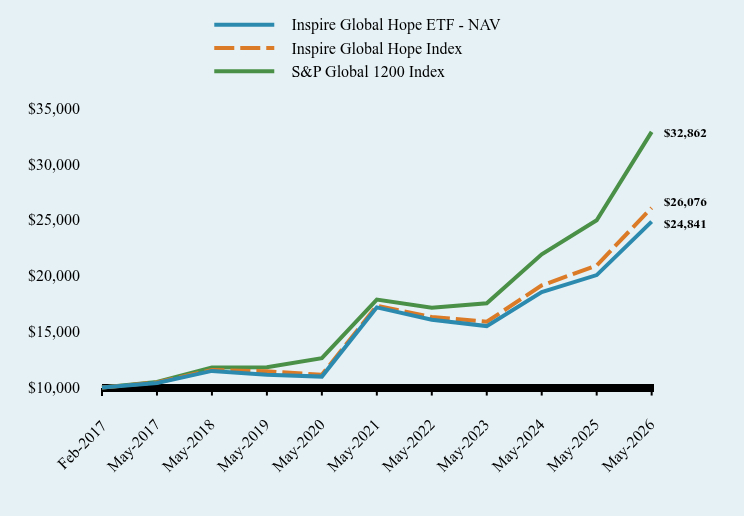
How did the Fund perform during the reporting period? The Fund had a return on the NAV for the first 6 months of the 2026 fiscal year of 12.43%. This strong performance was driven by the upward momentum and global security selection in the Information Technology, Energy and Materials sectors. The other sectors that helped achieve this positive performance came from Industrials, Utilities, and Communication Services. The sectors that caused the largest drag on performance were Health Care and Consumer Discretionary. Although the adviser did see volatility in the global markets during the period due to the war in Iran as well as geopolitical tensions with Russia and China, the Fund performed in line with the broader international large-cap market. During the six-month period ended May 31, 2026, the Fund's use of the current investment strategies did not cause the Fund's performance to materially deviate from the manager's expectations, considering the uncertainty of the markets. |
|
| Performance Past Does Not Indicate Future [Text] |
The Fund’s past performance is not a good predictor of how the Fund will perform in the future.
|
|
| Line Graph [Table Text Block] |
Table Summary | Inspire Global Hope ETF - NAV | Inspire Global Hope Index | S&P Global 1200 Index |
|---|
Feb-2017 | $10,000 | $10,000 | $10,000 |
|---|
May-2017 | $10,408 | $10,461 | $10,496 |
|---|
May-2018 | $11,488 | $11,565 | $11,794 |
|---|
May-2019 | $11,150 | $11,448 | $11,817 |
|---|
May-2020 | $10,979 | $11,135 | $12,628 |
|---|
May-2021 | $17,169 | $17,304 | $17,872 |
|---|
May-2022 | $16,061 | $16,310 | $17,129 |
|---|
May-2023 | $15,496 | $15,880 | $17,532 |
|---|
May-2024 | $18,542 | $19,132 | $21,913 |
|---|
May-2025 | $20,055 | $20,918 | $24,964 |
|---|
May-2026 | $24,841 | $26,076 | $32,862 |
|---|
|
|
| Average Annual Return [Table Text Block] |
Table Summary | 6 Months | 1 Year | 5 years | Since Inception (February 27, 2017) |
|---|
Inspire Global Hope ETF - NAV | 12.43% | 23.86% | 7.67% | 10.33% |
|---|
Inspire Global Hope Index | 12.64% | 24.66% | 8.55% | 10.91% |
|---|
S&P Global 1200 Index | 14.04% | 31.64% | 12.95% | 13.72% |
|---|
|
|
| Performance Inception Date |
Feb. 27, 2017
|
|
| No Deduction of Taxes [Text Block] |
The graph and table do not reflect the deduction of taxes that a shareholder would pay on fund distributions or redemption of fund shares.
|
|
| AssetsNet |
$ 156,108,716
|
|
| Holdings Count | Holding |
401
|
|
| Advisory Fees Paid, Amount |
$ 208,671
|
|
| InvestmentCompanyPortfolioTurnover |
11.00%
|
|
| Additional Fund Statistics [Text Block] |
Table SummaryNet Assets | $156,108,716 |
|---|
Number of Portfolio Holdings | 401 |
|---|
Advisory Fee | $208,671 |
|---|
Portfolio Turnover | 11% |
|---|
|
|
| Holdings [Text Block] |
Asset Weighting (% of total investments)Table SummaryValue | Value |
|---|
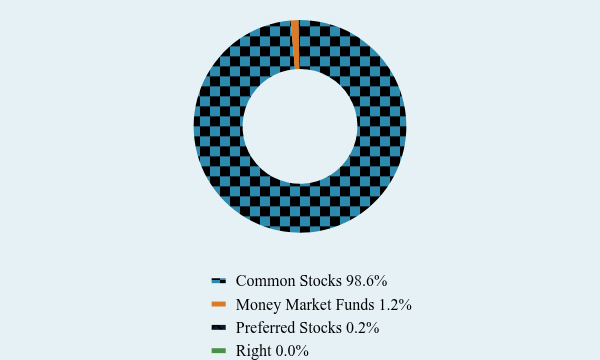
Common Stocks | 98.6% | Money Market Funds | 1.2% | Preferred Stocks | 0.2% | Right | 0.0% | Sector Weighting (% of net assets)Table SummaryValue | Value |
|---|
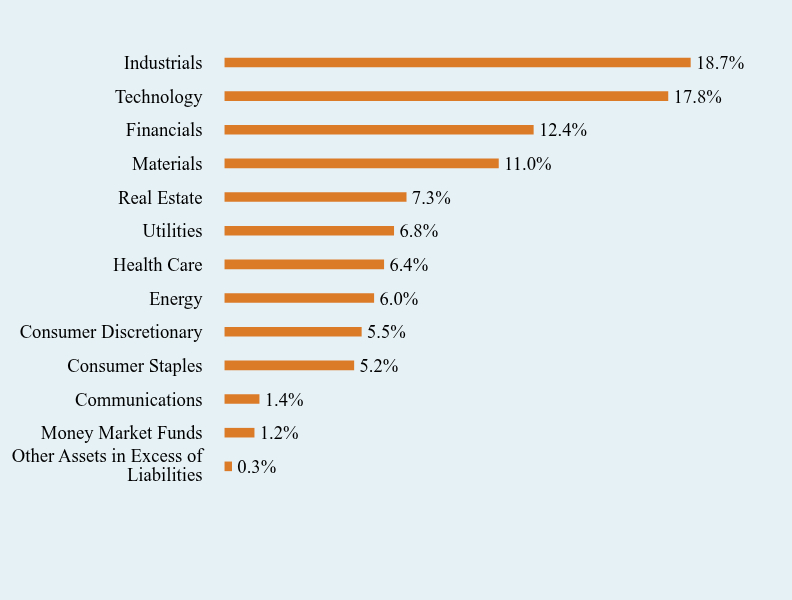
Other Assets in Excess of Liabilities | 0.3% | Money Market Funds | 1.2% | Communications | 1.4% | Consumer Staples | 5.2% | Consumer Discretionary | 5.5% | Energy | 6.0% | Health Care | 6.4% | Utilities | 6.8% | Real Estate | 7.3% | Materials | 11.0% | Financials | 12.4% | Technology | 17.8% | Industrials | 18.7% | |
|
| Largest Holdings [Text Block] |
Top 10 Holdings (% of net assets)Table SummaryHolding Name | % of Net Assets |
|---|
Fidelity Investments Money Market Government Portfolio, Institutional Class | 1.2% |
|---|
Bloom Energy Corporation, Class A | 0.5% |
|---|
Marvell Technology, Inc. | 0.5% |
|---|
Infineon Technologies A.G. | 0.5% |
|---|
Super Micro Computer, Inc. | 0.5% |
|---|
ON Semiconductor Corporation | 0.5% |
|---|
Semtech Corporation | 0.5% |
|---|
STMicroelectronics N.V. | 0.5% |
|---|
Datadog, Inc., Class A | 0.5% |
|---|
Western Digital Corporation | 0.5% |
|---|
|
|
| Material Fund Change [Text Block] |
No material changes occurred during the period ended May 31, 2026. |
|
| C000214760 |
|
|
| Shareholder Report [Line Items] |
|
|
| Fund Name |
Inspire International ETF
|
|
| Trading Symbol |
WWJD
|
|
| Security Exchange Name |
NYSEArca
|
|
| Annual or Semi-Annual Statement [Text Block] |
This semi-annual shareholder report contains important information about Inspire International ETF for the period of December 1, 2025 to May 31, 2026.
|
|
| Additional Information [Text Block] |
You can find additional information about the Fund at www.inspireetf.com/etf/wwjd. You can also request this information by contacting us at 1-877-658-9473.
|
|
| Additional Information Phone Number |
1-877-658-9473
|
|
| Additional Information Website |
www.inspireetf.com/etf/wwjd
|
|
| Expenses [Text Block] |
What were the Fund’s costs for the last six months?(based on a hypothetical $10,000 investment) Table SummaryFund Name | Costs of a $10,000 investment | Costs paid as a percentage of a $10,000 investment |
|---|
Inspire International ETF | $34 | 0.65%Footnote Reference* |
|---|
| Footnote | Description | Footnote* | Annualized |
|
|
| Expenses Paid, Amount |
$ 34
|
|
| Expense Ratio, Percent |
0.65%
|
[7] |
| Factors Affecting Performance [Text Block] |
How did the Fund perform during the reporting period? The Fund had a return on the NAV for the first 6 months of the 2026 fiscal year of 11.03%. This positive performance was driven predominantly by the upward momentum in the International and Emerging markets during the period. Security selection in the Information Technology, Energy, and Materials sectors helped achieve this positive performance. The sectors that caused the largest drag on performance were Health Care and Consumer Discretionary. Although there was volatility in the international markets during the period due to the war in Iran and the closure of the Hormuz Strait, the Fund performed in line with the broader global international markets. During the six-month period ended May 31, 2026, the Fund's use of the current investment strategies did not cause the Fund's performance to materially deviate from the manager's expectations considering the uncertainty of the markets. |
|
| Performance Past Does Not Indicate Future [Text] |
The Fund’s past performance is not a good predictor of how the Fund will perform in the future.
|
|
| Line Graph [Table Text Block] |
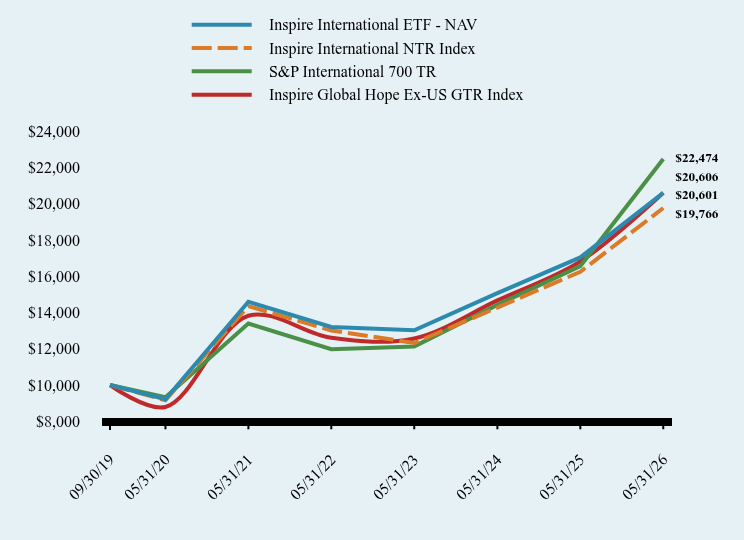
Table Summary | Inspire International ETF - NAV | Inspire International NTR Index | S&P International 700 TR | Inspire Global Hope Ex-US GTR Index |
|---|
09/30/19 | $10,000 | $10,000 | $10,000 | $10,000 |
|---|
05/31/20 | $9,215 | $9,166 | $9,323 | $8,789 |
|---|
05/31/21 | $14,592 | $14,352 | $13,393 | $13,823 |
|---|
05/31/22 | $13,202 | $13,013 | $11,981 | $12,609 |
|---|
05/31/23 | $13,019 | $12,320 | $12,132 | $12,570 |
|---|
05/31/24 | $15,072 | $14,275 | $14,422 | $14,670 |
|---|
05/31/25 | $17,042 | $16,247 | $16,566 | $16,821 |
|---|
05/31/26 | $20,601 | $19,766 | $22,474 | $20,606 |
|---|
|
|
| Average Annual Return [Table Text Block] |
Table Summary | 6 Months | 1 Year | 5 years | Since Inception (September 30, 2019) |
|---|
Inspire International ETF - NAV | 11.03% | 20.88% | 7.14% | 11.45% |
|---|
Inspire International NTR Index | 11.37% | 21.66% | 6.61% | 10.76% |
|---|
S&P International 700 TR | 20.06% | 35.66% | 10.91% | 12.91% |
|---|
Inspire Global Hope Ex-US GTR Index | 11.86% | 22.50% | 8.31% | 11.45% |
|---|
|
|
| Performance Inception Date |
Sep. 30, 2019
|
|
| No Deduction of Taxes [Text Block] |
The graph and table do not reflect the deduction of taxes that a shareholder would pay on fund distributions or redemption of fund shares.
|
|
| AssetsNet |
$ 514,290,410
|
|
| Holdings Count | Holding |
201
|
|
| Advisory Fees Paid, Amount |
$ 1,048,338
|
|
| InvestmentCompanyPortfolioTurnover |
14.00%
|
|
| Additional Fund Statistics [Text Block] |
Table SummaryNet Assets | $514,290,410 |
|---|
Number of Portfolio Holdings | 201 |
|---|
Advisory Fee | $1,048,338 |
|---|
Portfolio Turnover | 14% |
|---|
|
|
| Holdings [Text Block] |
Asset Weighting (% of total investments)Table SummaryValue | Value |
|---|
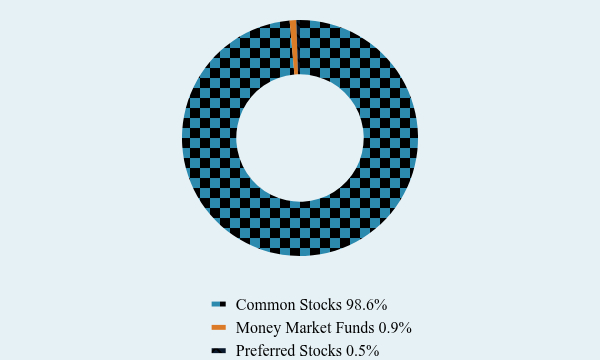
Common Stocks | 98.6% | Money Market Funds | 0.9% | Preferred Stocks | 0.5% | Sector Weighting (% of net assets)Table SummaryValue | Value |
|---|
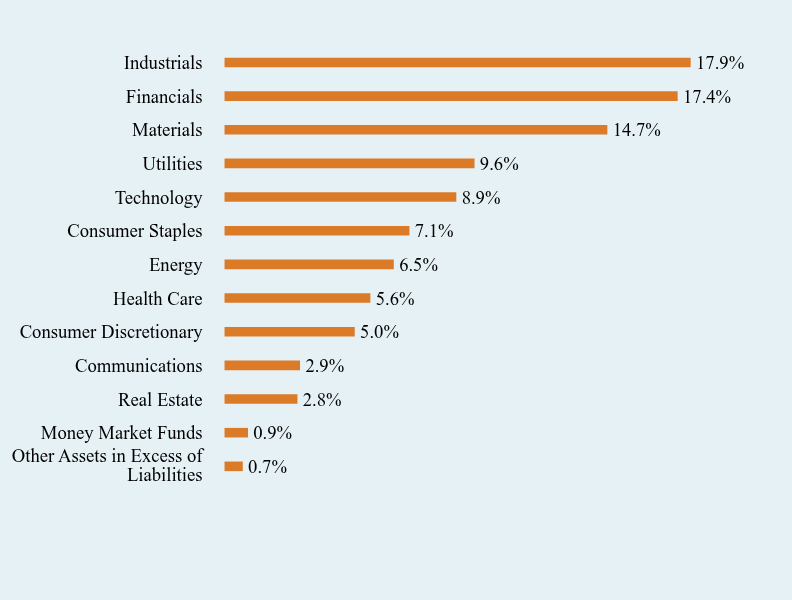
Other Assets in Excess of Liabilities | 0.7% | Money Market Funds | 0.9% | Real Estate | 2.8% | Communications | 2.9% | Consumer Discretionary | 5.0% | Health Care | 5.6% | Energy | 6.5% | Consumer Staples | 7.1% | Technology | 8.9% | Utilities | 9.6% | Materials | 14.7% | Financials | 17.4% | Industrials | 17.9% | |
|
| Largest Holdings [Text Block] |
Top 10 Holdings (% of net assets)Table SummaryHolding Name | % of Net Assets |
|---|
Infineon Technologies A.G. | 1.0% |
|---|
STMicroelectronics N.V. | 1.0% |
|---|
Renesas Electronics Corporation | 0.9% |
|---|
Fidelity Investments Money Market Government Portfolio, Institutional Class | 0.9% |
|---|
NXP Semiconductors N.V. | 0.8% |
|---|
Samsung SDI Company Ltd. | 0.7% |
|---|
Intertek Group plc | 0.7% |
|---|
Edenred S.E. | 0.7% |
|---|
FANUC Corporation | 0.7% |
|---|
Tate & Lyle plc | 0.7% |
|---|
|
|
| Material Fund Change [Text Block] |
No material changes occurred during the period ended May 31, 2026. |
|
| C000176730 |
|
|
| Shareholder Report [Line Items] |
|
|
| Fund Name |
Inspire Small/Mid Cap ETF
|
|
| Trading Symbol |
ISMD
|
|
| Security Exchange Name |
NYSEArca
|
|
| Annual or Semi-Annual Statement [Text Block] |
This semi-annual shareholder report contains important information about Inspire Small/Mid Cap ETF for the period of December 1, 2025 to May 31, 2026.
|
|
| Additional Information [Text Block] |
You can find additional information about the Fund at www.inspireetf.com/etf/ismd. You can also request this information by contacting us at 1-877-658-9473.
|
|
| Additional Information Phone Number |
1-877-658-9473
|
|
| Additional Information Website |
www.inspireetf.com/etf/ismd
|
|
| Expenses [Text Block] |
What were the Fund’s costs for the last six months?(based on a hypothetical $10,000 investment) Table SummaryFund Name | Costs of a $10,000 investment | Costs paid as a percentage of a $10,000 investment |
|---|
Inspire Small/Mid Cap ETF | $24 | 0.44%Footnote Reference* |
|---|
| Footnote | Description | Footnote* | Annualized |
|
|
| Expenses Paid, Amount |
$ 24
|
|
| Expense Ratio, Percent |
0.44%
|
[8] |
| Factors Affecting Performance [Text Block] |
How did the Fund perform during the reporting period? The Fund had a return on the NAV for the first 6 months of the 2026 fiscal year of 22.90%. This strong positive performance was driven predominantly by the upward momentum of the US midcap and small cap markets during the period. Security selection in the Energy, Information Technology, and Materials sectors helped the performance of the Fund from a positive perspective but the sectors that caused the largest drag to performance were Consumer Staples and Utilities. Although there was volatility and a market correction in the markets during the period due to uncertainty about the path forward in the Iran war, the Fund performed in line with the broader small and mid-cap markets. During the six-month period ended May 31, 2026, the Fund's use of the current investment strategies did not cause the Fund's performance to materially deviate from the manager's expectations considering the uncertainty of the markets. |
|
| Performance Past Does Not Indicate Future [Text] |
The Fund’s past performance is not a good predictor of how the Fund will perform in the future.
|
|
| Line Graph [Table Text Block] |
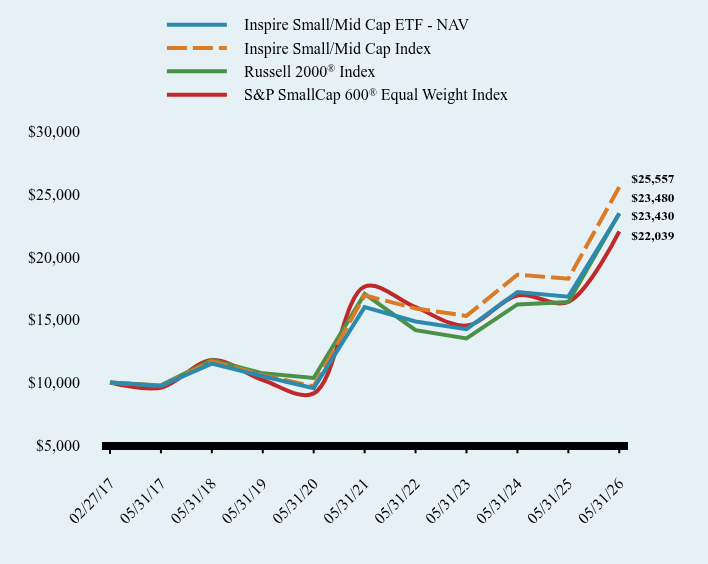
Table Summary | Inspire Small/Mid Cap ETF - NAV | Inspire Small/Mid Cap Index | Russell 2000® Index | S&P SmallCap 600® Equal Weight Index |
|---|
02/27/17 | $10,000 | $10,000 | $10,000 | $10,000 |
|---|
05/31/17 | $9,728 | $9,734 | $9,767 | $9,579 |
|---|
05/31/18 | $11,504 | $11,689 | $11,796 | $11,782 |
|---|
05/31/19 | $10,492 | $10,580 | $10,729 | $10,196 |
|---|
05/31/20 | $9,549 | $9,694 | $10,360 | $9,131 |
|---|
05/31/21 | $15,997 | $16,937 | $17,048 | $17,639 |
|---|
05/31/22 | $14,856 | $15,892 | $14,165 | $15,993 |
|---|
05/31/23 | $14,244 | $15,301 | $13,502 | $14,536 |
|---|
05/31/24 | $17,194 | $18,579 | $16,218 | $16,926 |
|---|
05/31/25 | $16,835 | $18,265 | $16,410 | $16,424 |
|---|
05/31/26 | $23,430 | $25,557 | $23,480 | $22,039 |
|---|
|
|
| Average Annual Return [Table Text Block] |
Table Summary | 6 Months | 1 Year | 5 years | Since Inception (February 27, 2017) |
|---|
Inspire Small/Mid Cap ETF - NAV | 22.90% | 39.18% | 7.93% | 9.64% |
|---|
Inspire Small/Mid Cap Index | 23.18% | 39.93% | 8.58% | 10.67% |
|---|
Russell 2000® Index | 17.47% | 43.08% | 6.61% | 9.66% |
|---|
S&P SmallCap 600® Equal Weight Index | 16.48% | 34.19% | 4.55% | 8.91% |
|---|
|
|
| Performance Inception Date |
Feb. 27, 2017
|
|
| No Deduction of Taxes [Text Block] |
The graph and table do not reflect the deduction of taxes that a shareholder would pay on fund distributions or redemption of fund shares.
|
|
| AssetsNet |
$ 316,824,054
|
|
| Holdings Count | Holding |
499
|
|
| Advisory Fees Paid, Amount |
$ 392,704
|
|
| InvestmentCompanyPortfolioTurnover |
17.00%
|
|
| Additional Fund Statistics [Text Block] |
- Net Assets$316,824,054
- Number of Portfolio Holdings499
- Advisory Fee $392,704
- Portfolio Turnover17%
|
|
| Holdings [Text Block] |
Asset Weighting (% of total investments)Table SummaryValue | Value |
|---|
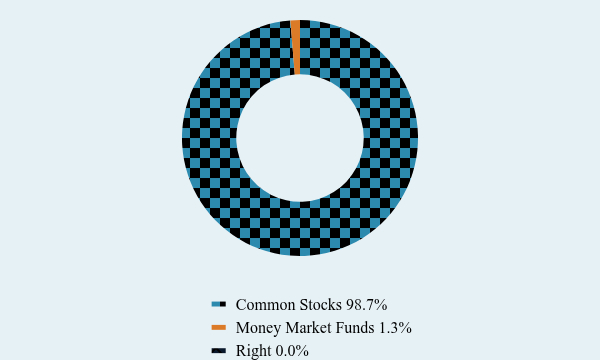
Common Stocks | 98.7% | Money Market Funds | 1.3% | Right | 0.0% | Sector Weighting (% of net assets)Table SummaryValue | Value |
|---|
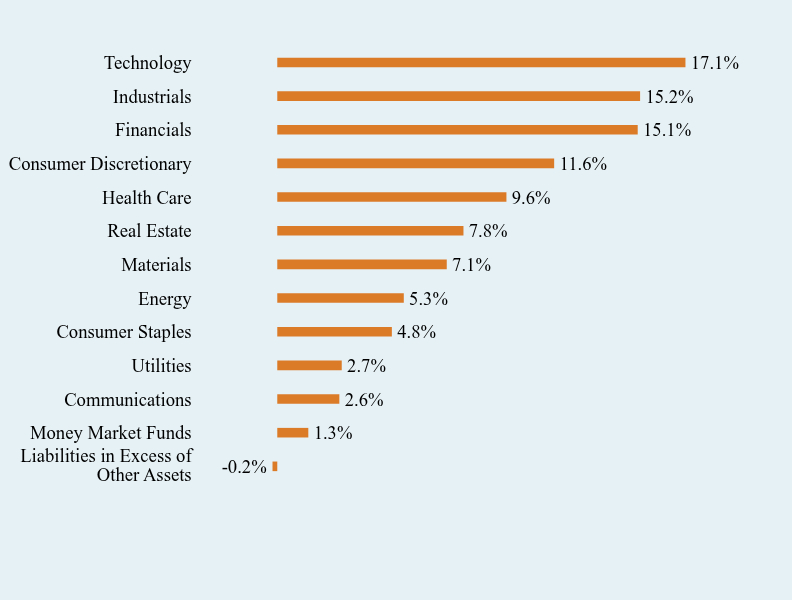
Liabilities in Excess of Other Assets | -0.2% | Money Market Funds | 1.3% | Communications | 2.6% | Utilities | 2.7% | Consumer Staples | 4.8% | Energy | 5.3% | Materials | 7.1% | Real Estate | 7.8% | Health Care | 9.6% | Consumer Discretionary | 11.6% | Financials | 15.1% | Industrials | 15.2% | Technology | 17.1% | |
|
| Largest Holdings [Text Block] |
Top 10 Holdings (% of net assets)Table SummaryHolding Name | % of Net Assets |
|---|
agilon health, Inc. | 2.0% |
|---|
Fidelity Investments Money Market Government Portfolio, Institutional Class | 1.3% |
|---|
MaxLinear, Inc., Class A | 0.9% |
|---|
Ambiq Micro, Inc. | 0.5% |
|---|
Penguin Solutions, Inc. | 0.5% |
|---|
Vishay Intertechnology, Inc. | 0.5% |
|---|
Redwire Corporation | 0.5% |
|---|
Kopin Corporation | 0.4% |
|---|
Aehr Test Systems | 0.4% |
|---|
T1 Energy, Inc. | 0.4% |
|---|
|
|
| Material Fund Change [Text Block] |
No material changes occurred during the period ended May 31, 2026. |
|
| C000220340 |
|
|
| Shareholder Report [Line Items] |
|
|
| Fund Name |
Inspire Capital Appreciation ETF
|
|
| Trading Symbol |
RISN
|
|
| Security Exchange Name |
NYSEArca
|
|
| Annual or Semi-Annual Statement [Text Block] |
This semi-annual shareholder report contains important information about Inspire Capital Appreciation ETF for the period of December 1, 2025 to May 31, 2026.
|
|
| Additional Information [Text Block] |
You can find additional information about the Fund at www.inspireetf.com/etf/risn. You can also request this information by contacting us at 1-877-658-9473.
|
|
| Additional Information Phone Number |
1-877-658-9473
|
|
| Additional Information Website |
www.inspireetf.com/etf/risn
|
|
| Expenses [Text Block] |
What were the Fund’s costs for the last six months?(based on a hypothetical $10,000 investment) Table SummaryFund Name | Costs of a $10,000 investment | Costs paid as a percentage of a $10,000 investment |
|---|
Inspire Capital Appreciation ETF | $36 | 0.70%Footnote Reference* |
|---|
| Footnote | Description | Footnote* | Annualized |
|
|
| Expenses Paid, Amount |
$ 36
|
|
| Expense Ratio, Percent |
0.70%
|
[9] |
| Factors Affecting Performance [Text Block] |
How did the Fund perform during the reporting period? The Fund had a return on the NAV for the first 6 months of the 2026 fiscal year of 4.64%. Since the Fund has a current target of 80% to be invested in US large cap stocks, most of this positive performance was driven by the upward momentum in the US large-cap equity markets during the period. Security selection in the Communication Services and Energy sectors helped with positive performance, but the sectors that caused the largest drag on performance were the Health Care and Consumer Discretionary sectors. The Fund is also currently invested at a 20% level in Treasury exposure, which was only slightly positive within the Fund for the period due to the belief that interest rate cuts by the Federal Reserve will not resume until 2027 at the earliest. Although there was volatility in both the equity and fixed income markets during the period, the Fund performed in line with the broader large-cap market as well as the intermediate fixed income markets. During the six-month period ended May 31, 2026, the Fund's use of the current investment strategies did not cause the Fund's performance to materially deviate from the manager's expectations considering the uncertainty of the markets. |
|
| Performance Past Does Not Indicate Future [Text] |
The Fund’s past performance is not a good predictor of how the Fund will perform in the future.
|
|
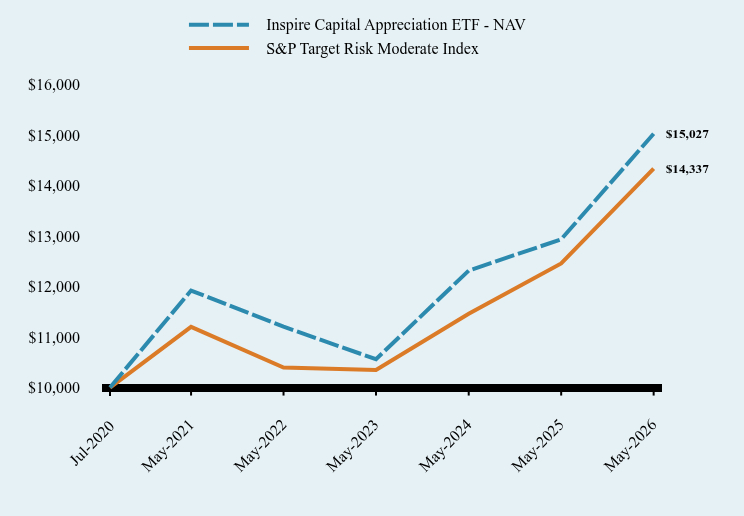
| Line Graph [Table Text Block] |
Table Summary | Inspire Capital Appreciation ETF - NAV | S&P Target Risk Moderate Index |
|---|
Jul-2020 | $10,000 | $10,000 |
|---|
May-2021 | $11,922 | $11,202 |
|---|
May-2022 | $11,205 | $10,396 |
|---|
May-2023 | $10,561 | $10,348 |
|---|
May-2024 | $12,317 | $11,462 |
|---|
May-2025 | $12,936 | $12,457 |
|---|
May-2026 | $15,027 | $14,337 |
|---|
|
|
| Average Annual Return [Table Text Block] |
Table Summary | 6 Months | 1 Year | 5 years | Since Inception (July 15, 2020) |
|---|
Inspire Capital Appreciation ETF - NAV | 4.64% | 16.17% | 4.74% | 7.18% |
|---|
S&P Target Risk Moderate Index | 5.60% | 15.09% | 5.06% | 6.32% |
|---|
|
|
| Performance Inception Date |
Jul. 15, 2020
|
|
| No Deduction of Taxes [Text Block] |
The graph and table do not reflect the deduction of taxes that a shareholder would pay on fund distributions or redemption of fund shares.
|
|
| AssetsNet |
$ 87,303,103
|
|
| Holdings Count | Holding |
28
|
|
| Advisory Fees Paid, Amount |
$ 215,493
|
|
| InvestmentCompanyPortfolioTurnover |
9.00%
|
|
| Additional Fund Statistics [Text Block] |
- Net Assets$87,303,103
- Number of Portfolio Holdings28
- Advisory Fee $215,493
- Portfolio Turnover9%
|
|
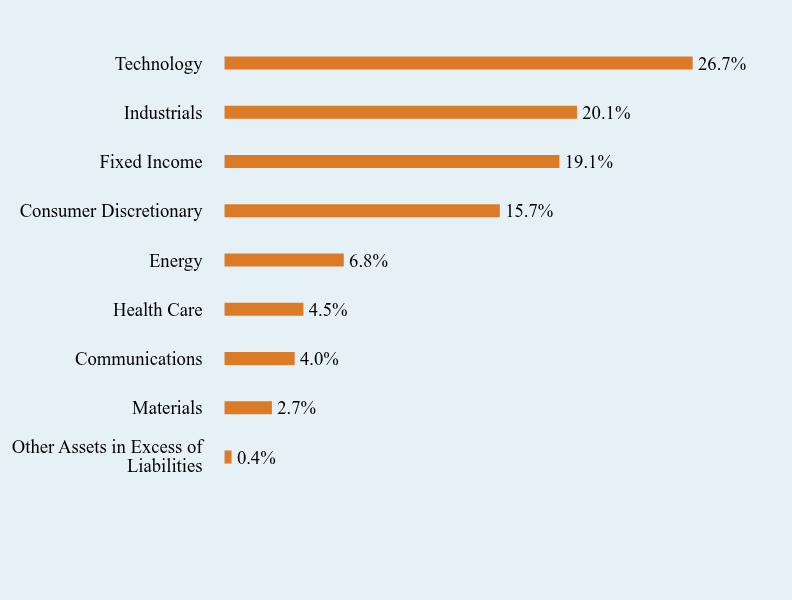
| Holdings [Text Block] |
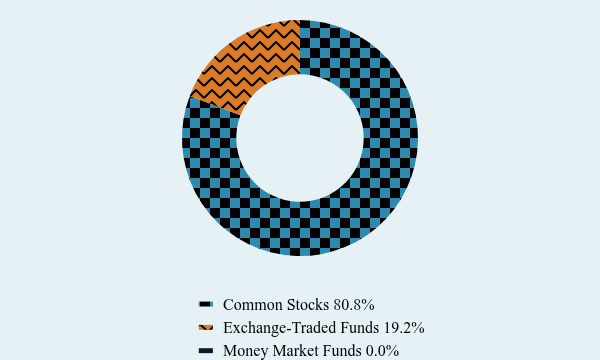
Asset Weighting (% of total investments)Table SummaryValue | Value |
|---|
Common Stocks | 80.8% | Exchange-Traded Funds | 19.2% | Money Market Funds | 0.0% | Sector Weighting (% of net assets)Table SummaryValue | Value |
|---|
Other Assets in Excess of Liabilities | 0.4% | Materials | 2.7% | Communications | 4.0% | Health Care | 4.5% | Energy | 6.8% | Consumer Discretionary | 15.7% | Fixed Income | 19.1% | Industrials | 20.1% | Technology | 26.7% | |
|
| Largest Holdings [Text Block] |
Top 10 Holdings (% of net assets)Table SummaryHolding Name | % of Net Assets |
|---|
Schwab Short-Term U.S. Treasury ETF | 19.1% |
|---|
Fortinet, Inc. | 4.9% |
|---|
Super Micro Computer, Inc. | 4.2% |
|---|
Old Dominion Freight Line, Inc. | 4.1% |
|---|
Landstar System, Inc. | 4.1% |
|---|
Sirius XM Holdings, Inc. | 4.0% |
|---|
Texas Pacific Land Corporation | 3.7% |
|---|
Deckers Outdoor Corporation | 3.3% |
|---|
Mueller Industries, Inc. | 3.2% |
|---|
Hess Midstream, L.P., Class A | 3.1% |
|---|
|
|
| Material Fund Change [Text Block] |
No material changes occurred during the period ended May 31, 2026. |
|
|
|