Shareholder Report
May 31, 2026
USD ($)
$ / shares
WHAT WERE THE FUND COSTS FOR THE PAST YEAR? (based on a hypothetical $10,000 investment)
|
Class Name
|
Costs of a $10,000 investment
|
Costs paid as a percentage of a $10,000 investment*,**
|
|
Kurv Copper & Mining Enhanced Income ETF
|
$30
|
0.99%
|
HOW DID THE FUND PERFORM LAST YEAR AND WHAT AFFECTED ITS PERFORMANCE?
For the period ended May 31, 2026, the Fund generated positive returns with consistent monthly distributions. Option premiums received from option strategies contributed negatively to total return.
WHAT FACTORS INFLUENCED PERFORMANCE
- Performance of the copper and copper miner ETFs
- Amount of premium received from option strategies
- Amount of premium received from option strategies
POSITIONING
The Fund maintained long exposure to copper and copper miner ETFs via synthetic long positions (long call options and short put options both with the same strike) and in-the-money calls. The Fund employed option strategies to receive premiums to generate income while allowing upside price appreciation potential. The remaining cash was invested in U.S. T-Bills to generate additional income.
|
Top Contributors
|
|
|
↑
|
Long exposure to copper
|
|
Top Detractors
|
|
|
↓
|
Long exposure to copper miners
|
PERFORMANCE
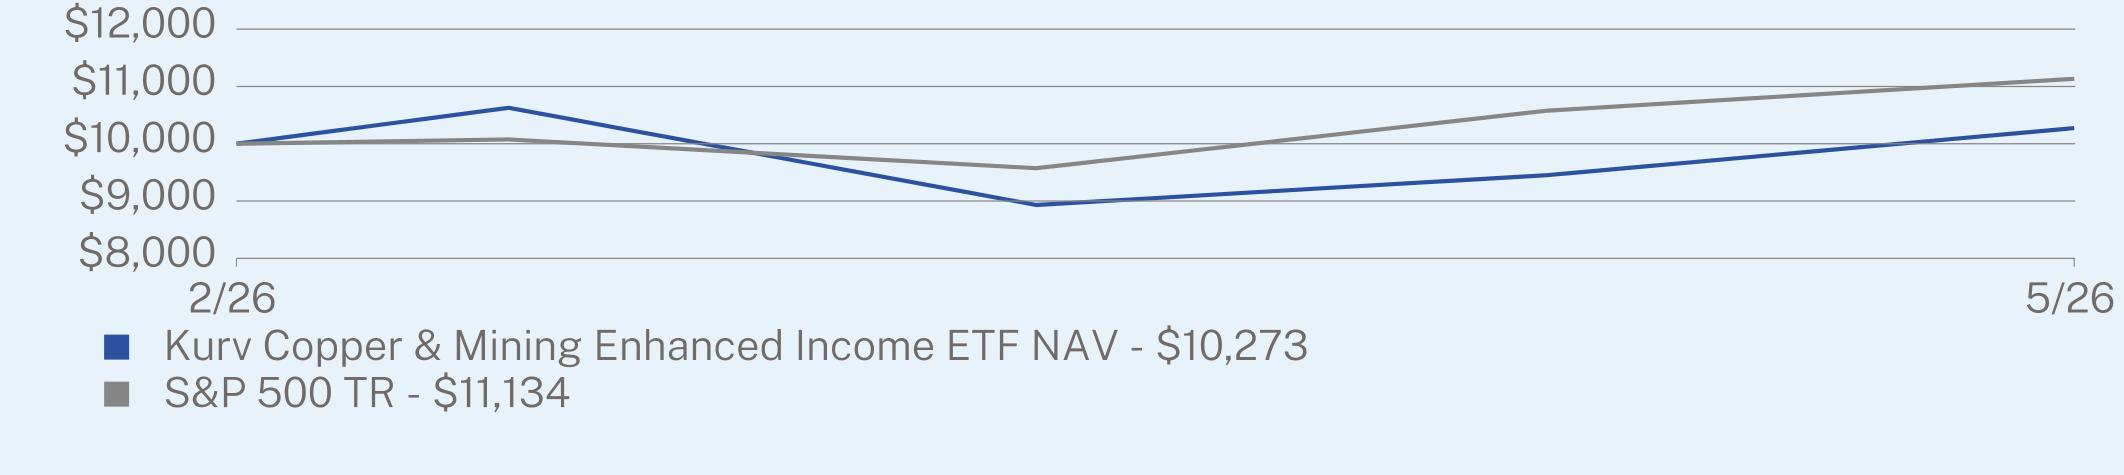
For the period from inception date to May 31, 2026, the Fund’s performance was 2.71% (NAV).
|
|
Since Inception
(02/12/2026) |
|
Kurv Copper & Mining Enhanced Income ETF NAV
|
2.71
|
|
S&P 500 TR
|
11.34
|
Visit https://www.kurvinvest.com/etf/kcop for more recent performance information.
KEY FUND STATISTICS (as of May 31, 2026)
|
Net Assets
|
$29,469,095
|
|
Number of Holdings
|
13
|
|
Net Advisory Fee
|
$48,160
|
|
Portfolio Turnover
|
0%
|
|
30-Day SEC Yield
|
2.22%
|
|
30-Day SEC Yield Unsubsidized
|
2.22%
|
|
Distribution Yield
|
14.26%
|
WHAT DID THE FUND INVEST IN? (% of Net Assets as of May 31, 2026)
|
Security Type
|
(%)
|
|
U.S. Treasury Bills
|
83.9%
|
|
Purchased Options
|
19.8%
|
|
Money Market Funds
|
1%
|
|
Written Options
|
-4.5%
|
|
Cash & Other
|
-0.2%
|
|
Top 10 Issuers
|
(%)
|
|
United States Treasury Bill
|
83.9%
|
|
Global X Copper Miners ETF
|
10.8%
|
|
United States Copper ETF
|
4.5%
|
|
Fidelity Government Portfolio
|
1.0%
|
WHAT WERE THE FUND COSTS FOR THE PAST YEAR? (based on a hypothetical $10,000 investment)
|
Fund Name
|
Costs of a $10,000 investment
|
Costs paid as a percentage of a $10,000 investment*,**
|
|
Kurv Gold Enhanced Income ETF
|
$119
|
1.12%
|
HOW DID THE FUND PERFORM LAST YEAR AND WHAT AFFECTED ITS PERFORMANCE?
For the period ended May 31, 2026, the Fund generated positive returns with consistent monthly distributions. Option premiums received from option strategies contributed positively to total return.
WHAT FACTORS INFLUENCED PERFORMANCE
- Performance of the gold ETFs
- Amount of premium received from option strategies
- Amount of premium received from option strategies
POSITIONING
The Fund maintained long exposure to gold ETFs via synthetic long positions (long call options and short put options both with the same strike) and in-the-money calls. The Fund employed option strategies to receive premiums to generate income while allowing upside price appreciation potential. The remaining cash was invested in U.S. T-Bills to generate additional income.
|
Top Contributors
|
|
|
↑
|
Long exposure to gold
|
|
↑
|
Exposure to certain option positions
|
PERFORMANCE
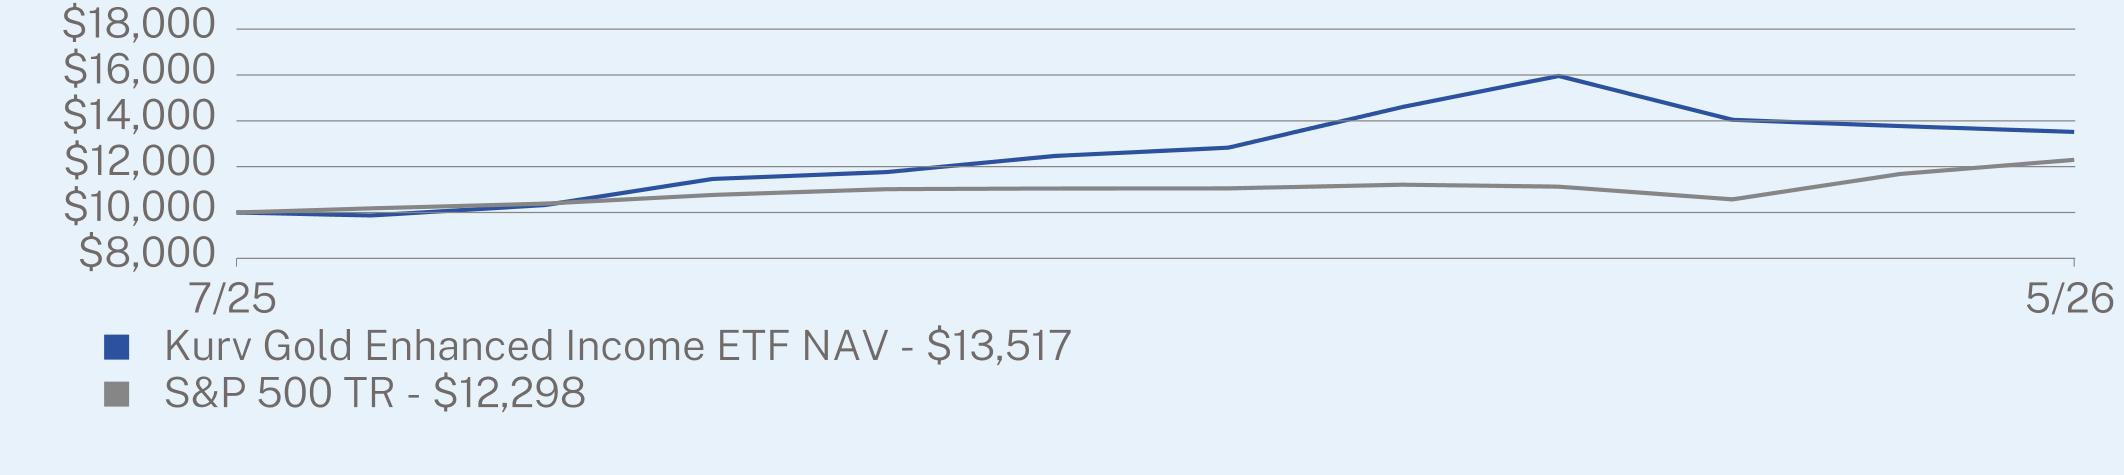
For the period from inception date to May 31, 2026, the Fund’s performance was 35.17% (NAV).
|
|
Since Inception
(07/07/2025) |
|
Kurv Gold Enhanced Income ETF NAV
|
35.17
|
|
S&P 500 TR
|
22.98
|
Visit https://www.kurvinvest.com/etf/kgld for more recent performance information.
KEY FUND STATISTICS (as of May 31, 2026)
|
Net Assets
|
$101,043,491
|
|
Number of Holdings
|
12
|
|
Net Advisory Fee
|
$439,271
|
|
Portfolio Turnover
|
0%
|
|
30-Day SEC Yield
|
2.48%
|
|
30-Day SEC Yield Unsubsidized
|
2.48%
|
|
Distribution Yield
|
15.52%
|
WHAT DID THE FUND INVEST IN? (% of Net Assets as of May 31, 2026)
|
Security Type
|
(%)
|
|
U.S. Treasury Bills
|
89.3%
|
|
Purchased Options
|
12.4%
|
|
Money Market Funds
|
1.3%
|
|
Written Options
|
-3.7%
|
|
Cash & Other
|
0.7%
|
|
Top 10 Issuers
|
(%)
|
|
United States Treasury Bill
|
89.3%
|
|
SPDR Gold Shares
|
5.6%
|
|
iShares Gold Trust
|
3.2%
|
|
Fidelity Government Portfolio
|
1.3%
|
WHAT WERE THE FUND COSTS FOR THE PAST YEAR? (based on a hypothetical $10,000 investment)
|
Fund Name
|
Costs of a $10,000 investment
|
Costs paid as a percentage of a $10,000 investment*,**
|
|
Kurv High Income ETF
|
$67
|
1.10%
|
HOW DID THE FUND PERFORM LAST YEAR AND WHAT AFFECTED ITS PERFORMANCE?
For the period ended May 31, 2026, the Fund generated positive returns with consistent monthly distributions. Option premiums received from option strategies contributed positively to total return.
WHAT FACTORS INFLUENCED PERFORMANCE
- Security selection
- Performance of high-growth stock and assets
- Amount of premium received from writing out-of–the-money call option
- Performance of high-growth stock and assets
- Amount of premium received from writing out-of–the-money call option
POSITIONING
The Fund invests in a portfolio of high-growth stocks and assets with high implied volatility via both stock and synthetic long positions (long call options and short put options both with the same strike). The Fund employs option strategies to receive premiums to generate income while allowing upside price appreciation potential. The remaining cash was invested in U.S. T-Bills to generate additional income.
|
Top Contributors
|
|
|
↑
|
Long exposure to semiconductor companies
|
|
↑
|
Long exposure to precious metals miners
|
|
↑
|
Premiums received from writing out-of-the money call options
|
|
Top Detractors
|
|
|
↓
|
Exposure to web3 companies
|
PERFORMANCE
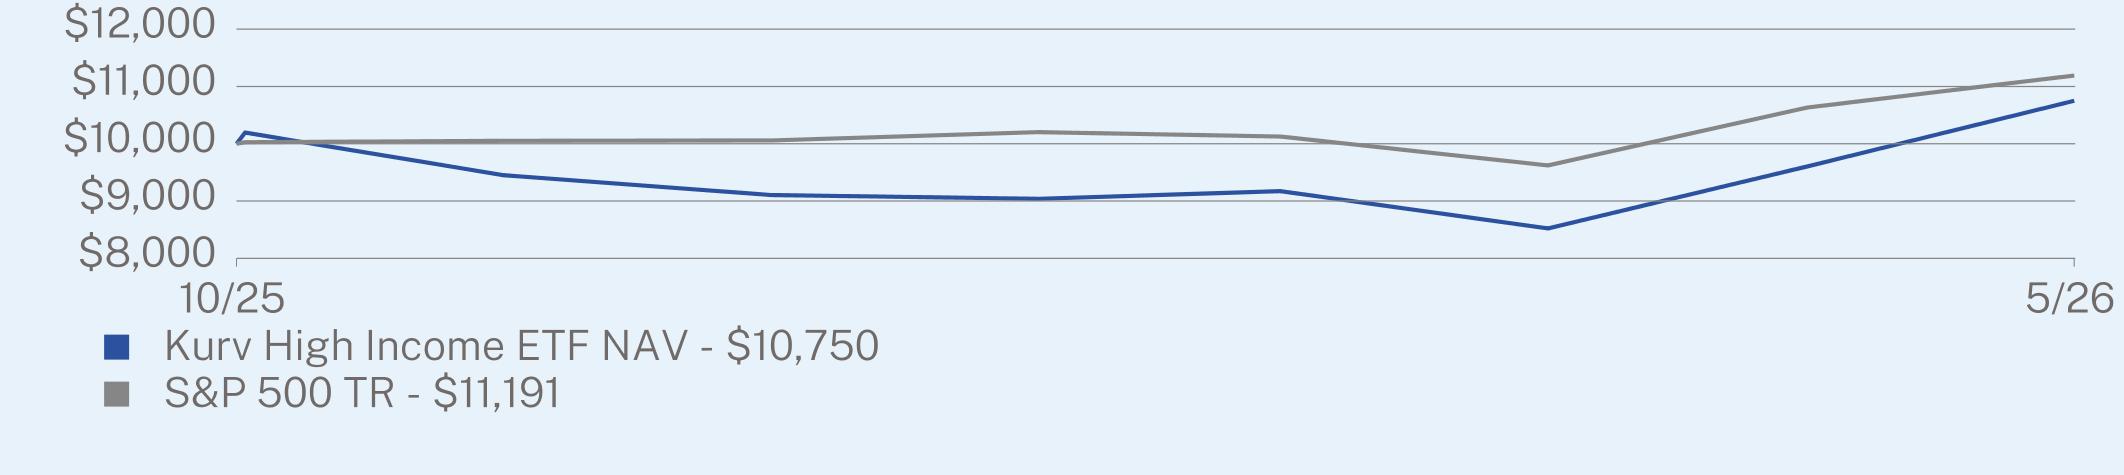
For the period from inception date to May 31, 2026, the Fund’s performance was 7.50% (NAV).
|
|
Since Inception
(10/30/2025) |
|
Kurv High Income ETF NAV
|
7.50
|
|
S&P 500 TR
|
11.91
|
Visit https://www.kurvinvest.com/etf/kyld for more recent performance information.
KEY FUND STATISTICS (as of May 31, 2026)
|
Net Assets
|
$41,079,772
|
|
Number of Holdings
|
46
|
|
Net Advisory Fee
|
$164,903
|
|
Portfolio Turnover
|
12%
|
|
30-Day SEC Yield
|
(0.05)%
|
|
30-Day SEC Yield Unsubsidized
|
(0.20)%
|
|
Distribution Yield
|
23.70%
|
WHAT DID THE FUND INVEST IN? (% of Net Assets as of May 31, 2026)
Sector Breakdown (% of net assets)
|
Top Sectors
|
(%)
|
|
Manufacturing
|
34.4%
|
|
Cash & Other
|
31.4%
|
|
Finance and Insurance
|
18.3%
|
|
Information
|
6.7%
|
|
Professional, Scientific, and Technical Services
|
4.8%
|
|
Utilities
|
4.3%
|
|
Top 10 Issuers
|
(%)
|
|
United States Treasury Bill
|
22.3%
|
|
Global X Silver Miners ETF
|
6.5%
|
|
VanEck Gold Miners ETF
|
5.8%
|
|
Advanced Micro Devices, Inc.
|
5.7%
|
|
Howmet Aerospace, Inc.
|
5.5%
|
|
Fidelity Government Portfolio
|
5.4%
|
|
Teradyne, Inc.
|
5.2%
|
|
BWX Technologies, Inc.
|
4.9%
|
|
AppLovin Corp.
|
4.8%
|
|
Intel Corp.
|
4.6%
|
WHAT WERE THE FUND COSTS FOR THE PAST YEAR? (based on a hypothetical $10,000 investment)
|
Fund Name
|
Costs of a $10,000 investment
|
Costs paid as a percentage of a $10,000 investment*,**
|
|
Kurv Silver Enhanced Income ETF
|
$88
|
1.03%
|
HOW DID THE FUND PERFORM LAST YEAR AND WHAT AFFECTED ITS PERFORMANCE?
For the period ended May 31, 2026, the Fund generated positive returns with consistent monthly distributions. Option premiums received from option strategies contributed negatively to total return.
WHAT FACTORS INFLUENCED PERFORMANCE
POSITIONING
The Fund maintained long exposure to silver ETFs via synthetic long positions (long call options and short put options both with the same strike) and in-the-money calls. The Fund employed option strategies to receive premiums to generate income while allowing upside price appreciation potential. The remaining cash was invested in U.S. T-Bills to generate additional income.
|
Top Contributors
|
|
|
↑
|
Long exposure to silver
|
|
Top Detractors
|
|
|
↓
|
Exposure to certain option positions
|
PERFORMANCE
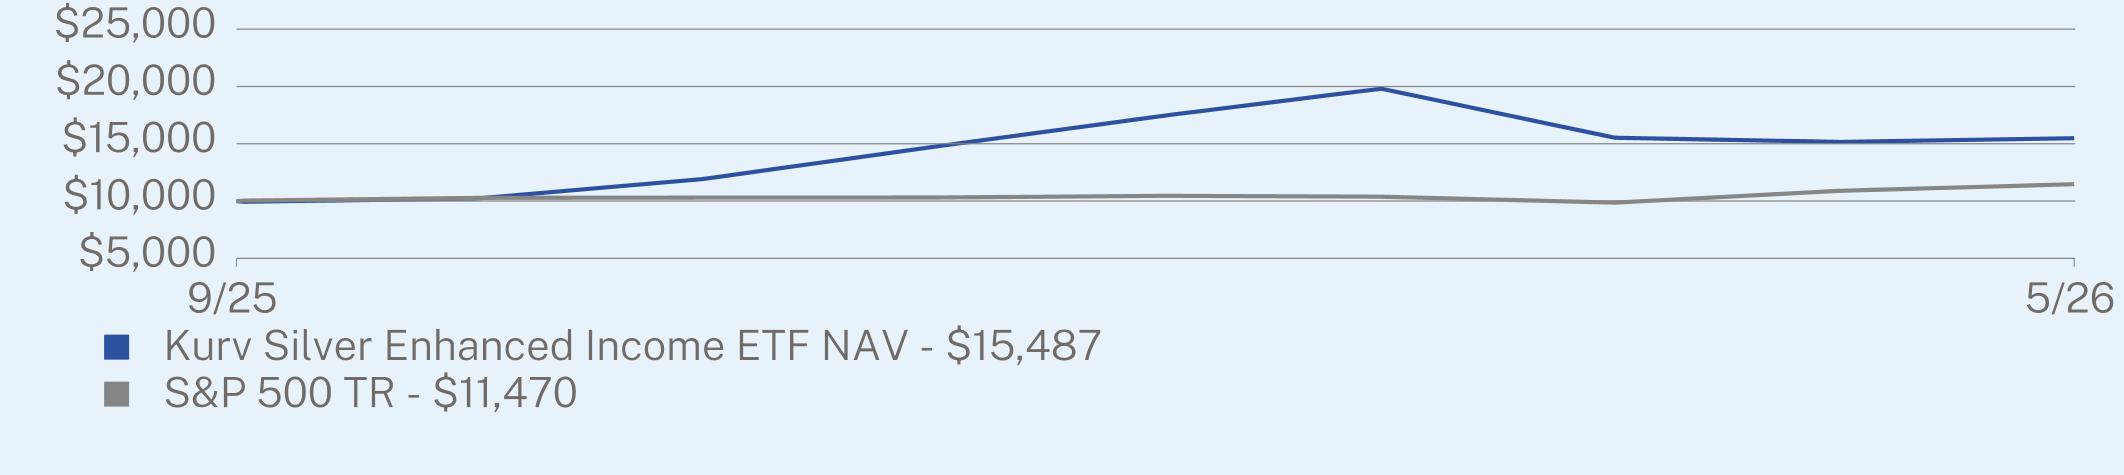
For the period from inception date to May 31, 2026, the Fund’s performance was 54.86% (NAV).
|
|
Since Inception
(09/29/2025) |
|
Kurv Silver Enhanced Income ETF NAV
|
54.86
|
|
S&P 500 TR
|
14.70
|
Visit https://www.kurvinvest.com/etf/kslv for more recent performance information.
KEY FUND STATISTICS (as of May 31, 2026)
|
Net Assets
|
$106,928,733
|
|
Number of Holdings
|
13
|
|
Net Advisory Fee
|
$423,173
|
|
Portfolio Turnover
|
0%
|
|
30-Day SEC Yield
|
2.23%
|
|
30-Day SEC Yield Unsubsidized
|
2.23%
|
|
Distribution Yield
|
26.67%
|
WHAT DID THE FUND INVEST IN? (% of Net Assets as of May 31, 2026)
|
Security Type
|
(%)
|
|
U.S. Treasury Bills
|
82.4%
|
|
Purchased Options
|
21.7%
|
|
Money Market Funds
|
2.4%
|
|
Written Options
|
-9.0%
|
|
Cash & Other
|
2.5%
|
|
Top 10 Issuers
|
(%)
|
|
United States Treasury Bill
|
82.4%
|
|
iShares Silver Trust
|
8.7%
|
|
Abrdn Physical Silver Shares ETF
|
4.0%
|
|
Fidelity Government Portfolio
|
2.4%
|
WHAT WERE THE FUND COSTS FOR THE PAST YEAR? (based on a hypothetical $10,000 investment)
|
Fund Name
|
Costs of a $10,000 investment
|
Costs paid as a percentage of a $10,000 investment*
|
|
Kurv Technology Titans Select ETF
|
$147
|
1.19%
|
HOW DID THE FUND PERFORM LAST YEAR AND WHAT AFFECTED ITS PERFORMANCE?
For the fiscal year ended May 31, 2026, the Fund generated positive returns with consistent monthly distributions. Option premiums received from option strategies contributed negatively to total return.
WHAT FACTORS INFLUENCED PERFORMANCE
- Security selection
- Performance of top tech stock
- Amount of premium received from writing out-of–the-money call option
- Performance of top tech stock
- Amount of premium received from writing out-of–the-money call option
POSITIONING
The Fund invests in a portfolio of top tech stocks via both stock and synthetic long positions (long call options and short put options both with the same strike). The Fund employes option strategties to receive premiums to generate income while allowing upside price appreciation potential. The remaining cash was invested in U.S. T-Bills to generate additional income.
|
Top Contributors
|
|
|
↑
|
Overweight to semiconductor companies
|
|
↑
|
Overweight to non-Nasdaq listed technology companies
|
|
Top Detractors
|
|
|
↓
|
Exposure to certain option postions
|
PERFORMANCE
For the fiscal year ended May 31, 2026, the Fund’s performance was 46.38% (NAV).
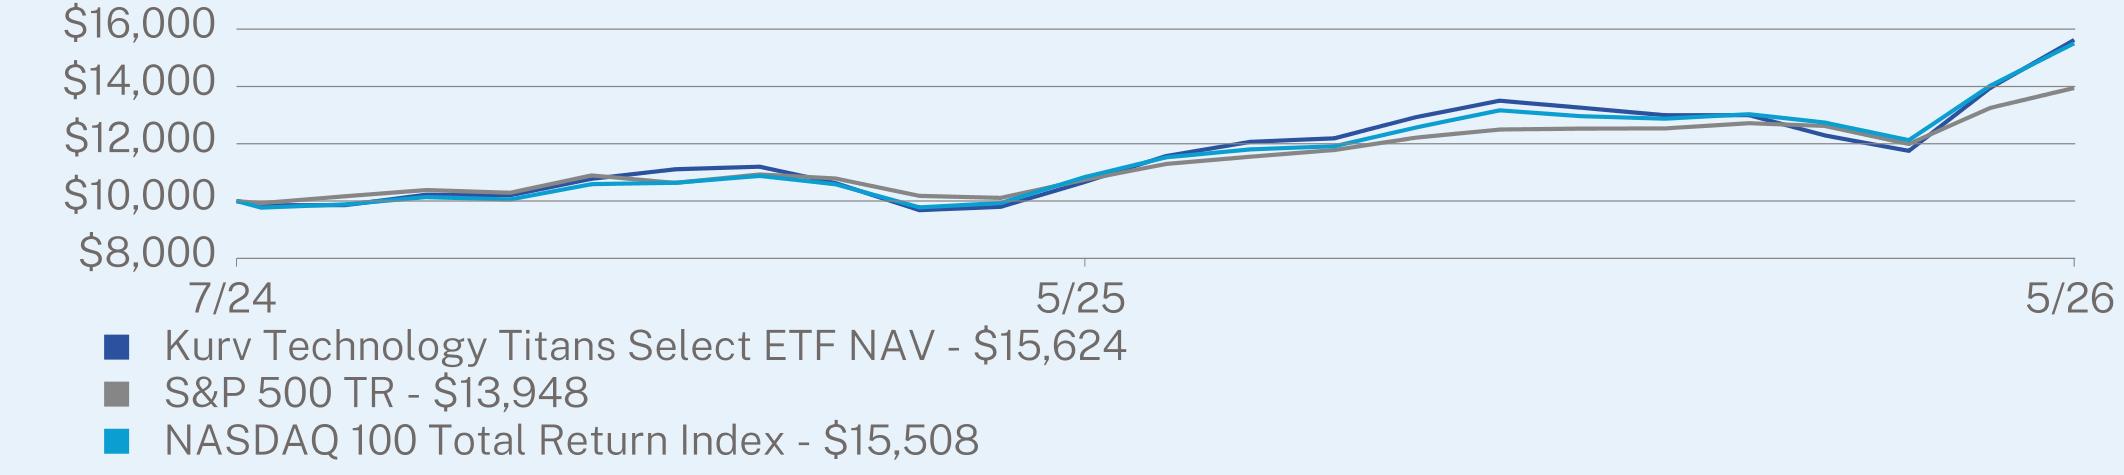
|
|
1 Year
|
Since Inception
(07/22/2024) |
|
Kurv Technology Titans Select ETF NAV
|
46.38
|
27.11
|
|
S&P 500 TR
|
29.78
|
19.62
|
|
NASDAQ 100 Total Return Index
|
43.09
|
26.64
|
Visit https://www.kurvinvest.com/etf/kqqq for more recent performance information.
KEY FUND STATISTICS (as of May 31, 2026)
|
Net Assets
|
$126,417,346
|
|
Number of Holdings
|
56
|
|
Net Advisory Fee
|
$585,226
|
|
Portfolio Turnover
|
35%
|
|
30-Day SEC Yield
|
(0.11)%
|
|
30-Day SEC Yield Unsubsidized
|
(0.18)%
|
|
Distribution Yield
|
13.10%
|
WHAT DID THE FUND INVEST IN? (% of Net Assets as of May 31, 2026)
|
Security Type
|
(%)
|
|
Common Stocks
|
71.8%
|
|
U.S. Treasury Bills
|
14.1%
|
|
Money Market Funds
|
5.3%
|
|
Purchased Options
|
4.5%
|
|
Exchange Traded Funds
|
1.3%
|
|
Investments Purchased with Proceeds from Securities Lending
|
0.1%
|
|
Written Options
|
-1.5%
|
|
Cash & Other
|
4.4%
|
|
Top 10 Issuers
|
(%)
|
|
United States Treasury Bill
|
14.1%
|
|
Alphabet, Inc.
|
11.9%
|
|
Amazon.com, Inc.
|
10.2%
|
|
Broadcom, Inc.
|
7.5%
|
|
Intel Corp.
|
6.4%
|
|
Fidelity Government Portfolio
|
5.3%
|
|
Apple, Inc.
|
5.1%
|
|
Advanced Micro Devices, Inc.
|
4.7%
|
|
Meta Platforms, Inc.
|
4.5%
|
|
NVIDIA Corp.
|
3.5%
|
WHAT WERE THE FUND COSTS FOR THE PAST YEAR? (based on a hypothetical $10,000 investment)
|
Fund Name
|
Costs of a $10,000 investment
|
Costs paid as a percentage of a $10,000 investment*
|
|
Kurv Yield Premium Strategy Amazon (AMZN) ETF
|
$120
|
1.03%
|
HOW DID THE FUND PERFORM LAST YEAR AND WHAT AFFECTED ITS PERFORMANCE?
For the fiscal year ended May 31, 2026, the Fund generated positive returns with consistent monthly distributions. Option premiums received from covered calls (short call position) contributed to total return.
WHAT FACTORS INFLUENCED PERFORMANCE
- Performance of Amazon stock
- Amount of premiums received from writing out-of-the-money call options
- Amount of premiums received from writing out-of-the-money call options
POSITIONING
The Fund maintained long exposure to Amazon stock via synthetic long positions (long call options and short put options both with the same strike). The Fund wrote out-of-the-money call options, receiving premiums to generate income while allowing some upside price appreciation potential. The remaining cash was invested in U.S. T-Bills to generate additional income.
|
Top Contributors
|
|
|
↑
|
Long exposure to Amazon Stock
|
|
↑
|
Exposure to certain option postions
|
PERFORMANCE
For the fiscal year ended May 31, 2026, the Fund’s performance was 32.93% (NAV).
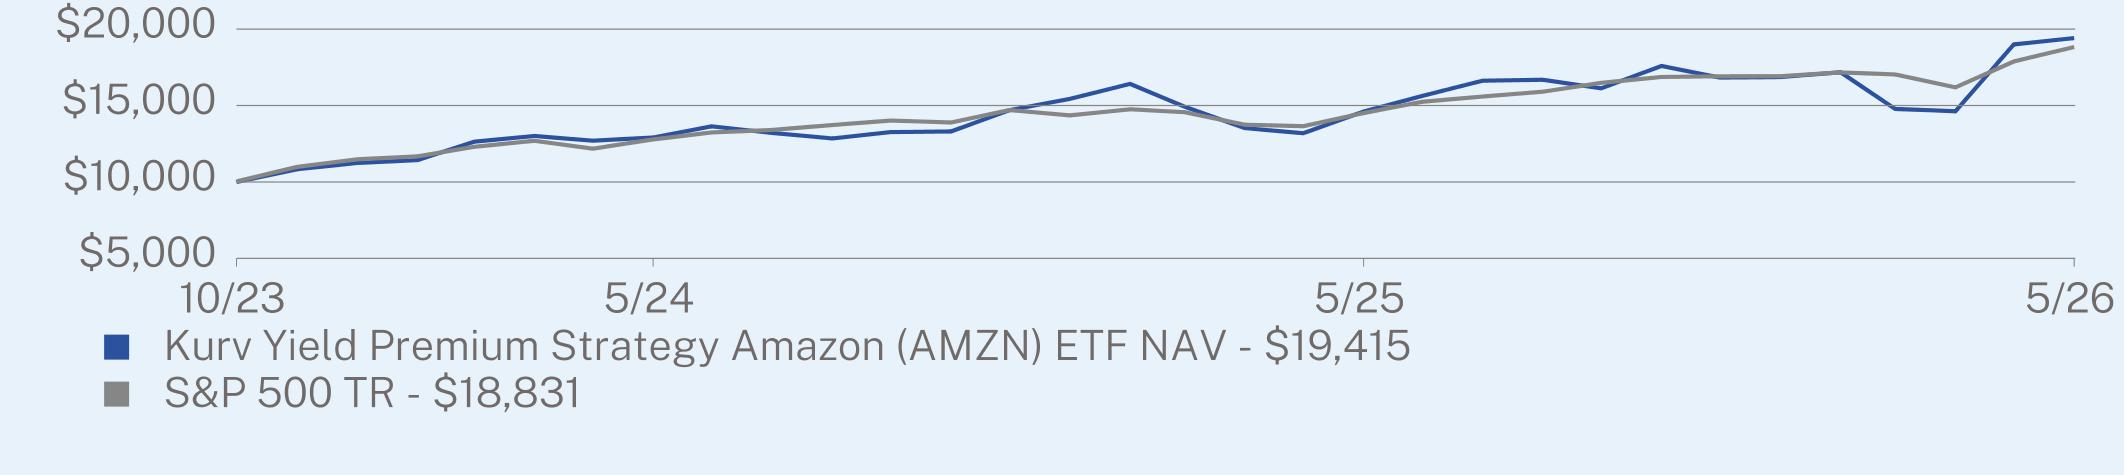
|
|
1 Year
|
Since Inception
(10/30/2023) |
|
Kurv Yield Premium Strategy Amazon (AMZN) ETF NAV
|
32.93
|
29.24
|
|
S&P 500 TR
|
29.78
|
27.73
|
Visit https://www.kurvinvest.com/etf/amzp for more recent performance information.
KEY FUND STATISTICS (as of May 31, 2026)
|
Net Assets
|
$23,228,845
|
|
Number of Holdings
|
10
|
|
Net Advisory Fee
|
$157,158
|
|
Portfolio Turnover
|
0%
|
|
30-Day SEC Yield
|
1.48%
|
|
30-Day SEC Yield Unsubsidized
|
1.32%
|
|
Distribution Yield
|
13.66%
|
WHAT DID THE FUND INVEST IN? (% of Net Assets as of May 31, 2026)
|
Security Type
|
(%)
|
|
U.S. Treasury Bills
|
66.2%
|
|
Money Market Funds
|
24.4%
|
|
Purchased Options
|
16.9%
|
|
Written Options
|
-6.8%
|
|
Cash & Other
|
-0.7%
|
|
Top 10 Issuers
|
(%)
|
|
United States Treasury Bill
|
66.2%
|
|
Fidelity Government Portfolio
|
24.4%
|
|
Amazon.Com, Inc.
|
10.1%
|
WHAT WERE THE FUND COSTS FOR THE PAST YEAR? (based on a hypothetical $10,000 investment)
|
Fund Name
|
Costs of a $10,000 investment
|
Costs paid as a percentage of a $10,000 investment*
|
|
Kurv Yield Premium Strategy Apple (AAPL) ETF
|
$122
|
0.99%
|
HOW DID THE FUND PERFORM LAST YEAR AND WHAT AFFECTED ITS PERFORMANCE?
For the fiscal year ended May 31, 2026, the Fund generated positive returns with consistent monthly distributions. Option premiums received from option strategies contributed positively to total return.
WHAT FACTORS INFLUENCED PERFORMANCE
- Performance of the Apple stock
- Amount of premium received from option strategies
POSITIONING
The Fund maintained long exposure to Apple stock via synthetic long positions (long call options and short put options both with the same strike) and in-the-money calls. The Fund employed option strategies to receive premiums to generate income while allowing upside price appreciation potential. The remaining cash was invested in U.S. T-Bills to generate additional income.
|
Top Contributors
|
|
|
↑
|
Long exposure to Apple Stock
|
|
↑
|
Exposure to certain option postions
|
PERFORMANCE
For the fiscal year ended May 31, 2026, the Fund’s performance was 46.16% (NAV).
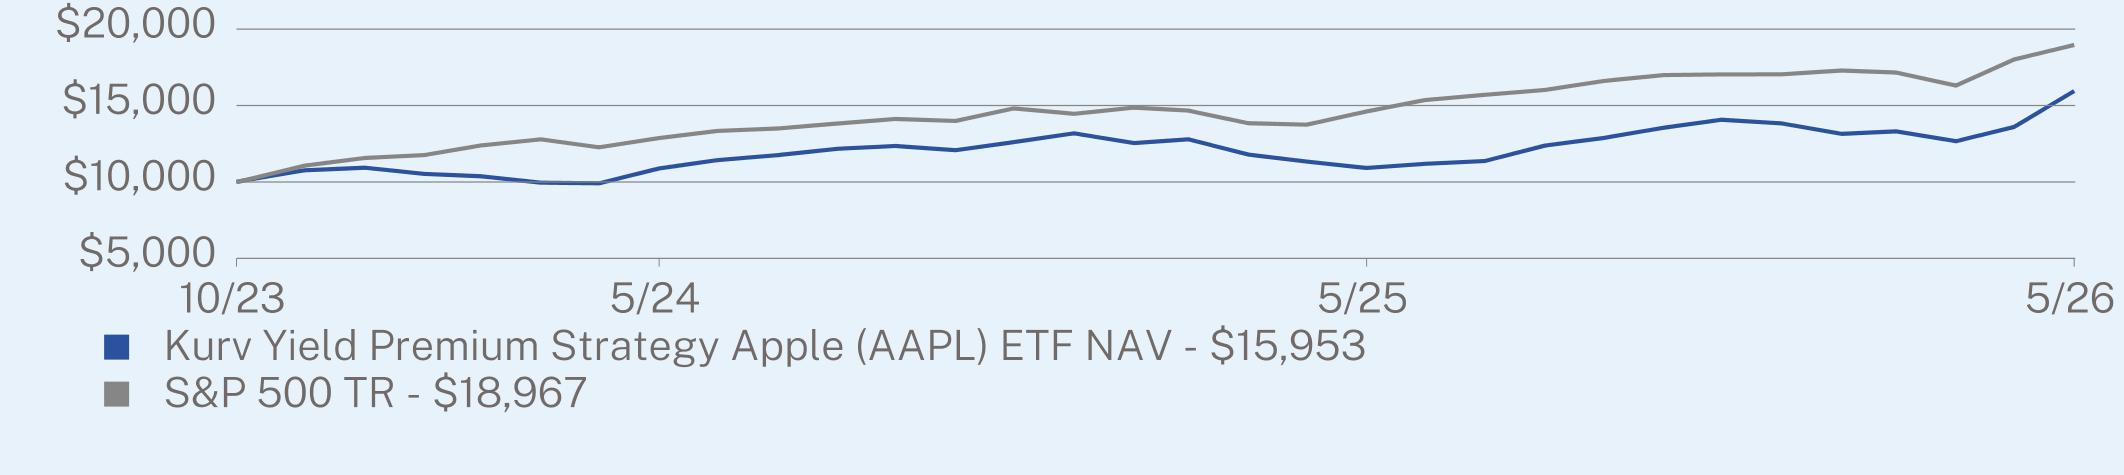
|
|
1 Year
|
Since Inception
(10/26/2023) |
|
Kurv Yield Premium Strategy Apple (AAPL) ETF NAV
|
46.16
|
19.70
|
|
S&P 500 TR
|
29.78
|
27.95
|
Visit https://www.kurvinvest.com/etf/aapy for more recent performance information.
KEY FUND STATISTICS (as of May 31, 2026)
|
Net Assets
|
$6,240,282
|
|
Number of Holdings
|
9
|
|
Net Advisory Fee
|
$48,748
|
|
Portfolio Turnover
|
0%
|
|
30-Day SEC Yield
|
1.80%
|
|
30-Day SEC Yield Unsubsidized
|
1.65%
|
|
Distribution Yield
|
13.02%
|
WHAT DID THE FUND INVEST IN? (% of Net Assets as of May 31, 2026)
|
Security Type
|
(%)
|
|
U.S. Treasury Bills
|
84.9%
|
|
Purchased Options
|
13.8%
|
|
Money Market Funds
|
4.2%
|
|
Written Options
|
-4.5%
|
|
Cash & Other
|
1.6%
|
|
Top 10 Issuers
|
(%)
|
|
United States Treasury Bill
|
84.9%
|
|
Apple, Inc.
|
9.3%
|
|
Fidelity Government Portfolio
|
4.2%
|
WHAT WERE THE FUND COSTS FOR THE PAST YEAR? (based on a hypothetical $10,000 investment)
|
Fund Name
|
Costs of a $10,000 investment
|
Costs paid as a percentage of a $10,000 investment*
|
|
Kurv Yield Premium Strategy Google (GOOGL) ETF
|
$149
|
0.99%
|
HOW DID THE FUND PERFORM LAST YEAR AND WHAT AFFECTED ITS PERFORMANCE?
For the fiscal year ended May 31, 2026, the Fund generated positive returns with consistent monthly distributions. Option premiums received from option strategies contributed negatively to total return.
WHAT FACTORS INFLUENCED PERFORMANCE
- Performance of the Google stock
- Amount of premium received from option strategies
- Amount of premium received from option strategies
POSITIONING
The Fund maintained long exposure to Google stock via synthetic long positions (long call options and short put options both with the same strike) and in-the-money calls. The Fund employed option strategies to receive premiums to generate income while allowing upside price appreciation potential. The remaining cash was invested in U.S. T-Bills to generate additional income.
|
Top Contributors
|
|
|
↑
|
Long exposure to Google Stock
|
|
Top Detractors
|
|
|
↓
|
Exposure to certain option postions
|
PERFORMANCE
For the fiscal year ended May 31, 2026, the Fund’s performance was 101.97% (NAV).
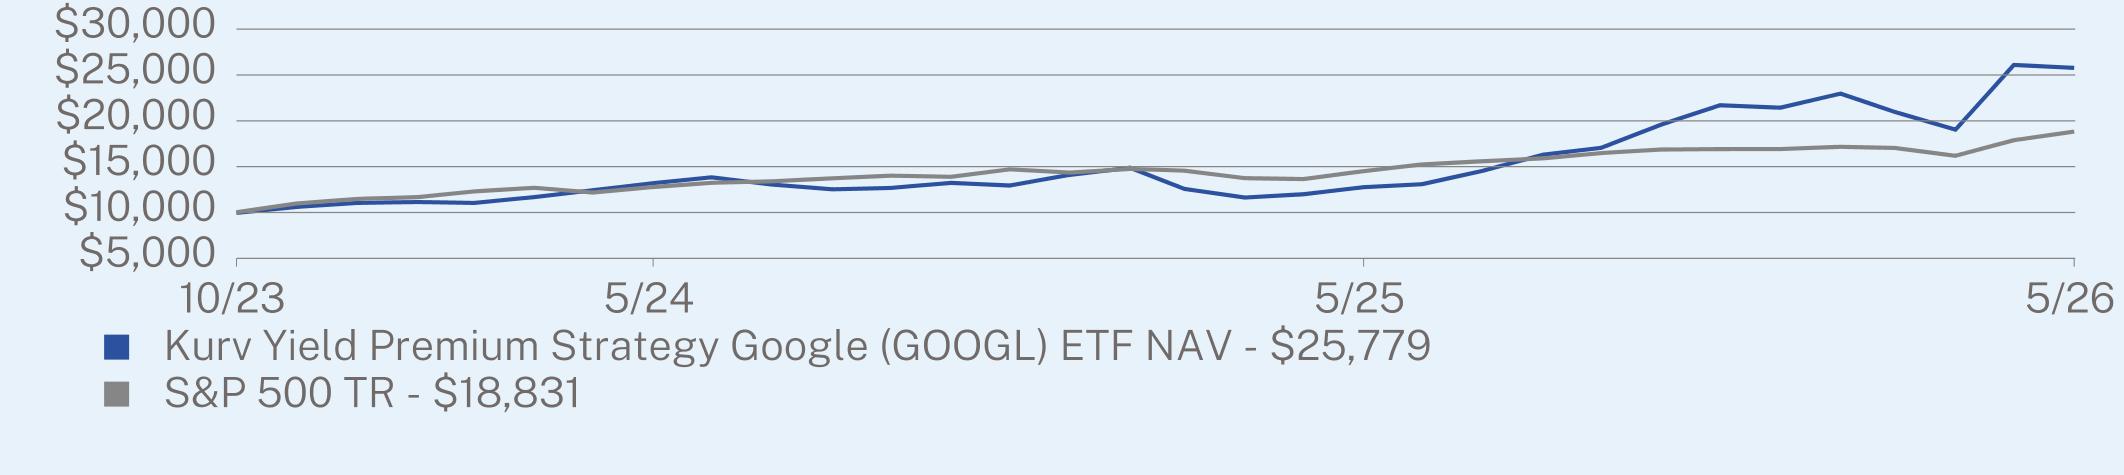
|
|
1 Year
|
Since Inception
(10/30/2023) |
|
Kurv Yield Premium Strategy Google (GOOGL) ETF NAV
|
101.97
|
44.22
|
|
S&P 500 TR
|
29.78
|
27.73
|
Visit https://www.kurvinvest.com/etf/goop for more recent performance information.
KEY FUND STATISTICS (as of May 31, 2026)
|
Net Assets
|
$28,188,012
|
|
Number of Holdings
|
10
|
|
Net Advisory Fee
|
$152,877
|
|
Portfolio Turnover
|
0%
|
|
30-Day SEC Yield
|
1.62%
|
|
30-Day SEC Yield Unsubsidized
|
1.45%
|
|
Distribution Yield
|
16.04%
|
WHAT DID THE FUND INVEST IN? (% of Net Assets as of May 31, 2026)
|
Security Type
|
(%)
|
|
U.S. Treasury Bills
|
67.0%
|
|
Money Market Funds
|
19.6%
|
|
Purchased Options
|
16.3%
|
|
Written Options
|
-7.0%
|
|
Cash & Other
|
4.1%
|
|
Top 10 Issuers
|
(%)
|
|
United States Treasury Bill
|
67.0%
|
|
Fidelity Government Portfolio
|
19.6%
|
|
Alphabet, Inc.
|
9.3%
|
WHAT WERE THE FUND COSTS FOR THE PAST YEAR? (based on a hypothetical $10,000 investment)
|
Fund Name
|
Costs of a $10,000 investment
|
Costs paid as a percentage of a $10,000 investment*
|
|
Kurv Yield Premium Strategy Microsoft (MSFT) ETF
|
$104
|
1.05%
|
HOW DID THE FUND PERFORM LAST YEAR AND WHAT AFFECTED ITS PERFORMANCE?
For the fiscal year ended May 31, 2026, the Fund generated negative returns with consistent monthly distributions. Option premiums received from option strategies was neutral to total return.
WHAT FACTORS INFLUENCED PERFORMANCE
- Performance of the Microsoft stock
- Amount of premium received from option strategies
- Amount of premium received from option strategies
POSITIONING
The Fund maintained long exposure to Microsoft stock via synthetic long positions (long call options and short put options both with the same strike) and in-the-money calls. The Fund employed option strategies to receive premiums to generate income while allowing upside price appreciation potential. The remaining cash was invested in U.S. T-Bills to generate additional income.
|
Top Contributors
|
|
|
↑
|
Premiums received from writing out-of-the money call options
|
|
Top Detractors
|
|
|
↓
|
Long exposure to Microsoft Stock
|
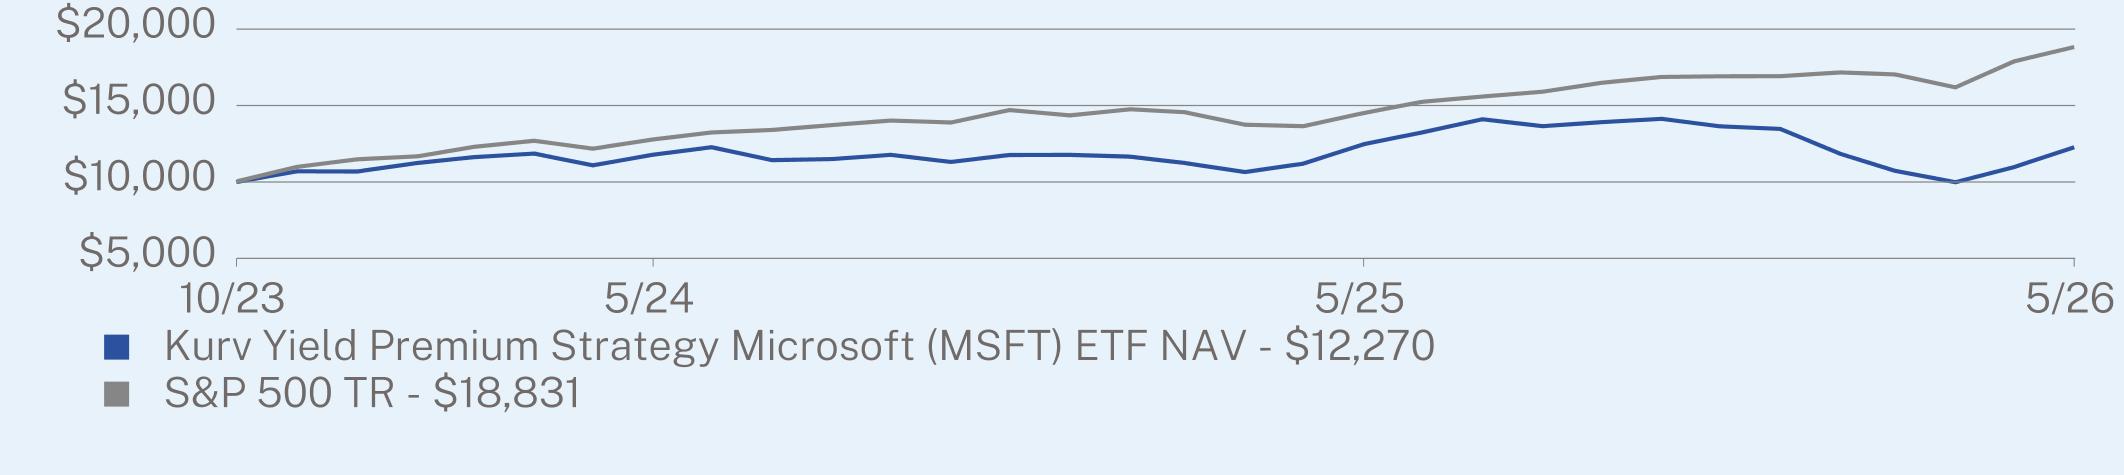
PERFORMANCE
For the fiscal year ended May 31, 2026, the Fund’s performance was -1.60% (NAV).
|
|
1 Year
|
Since Inception
(10/30/2023) |
|
Kurv Yield Premium Strategy Microsoft (MSFT) ETF NAV
|
-1.60
|
8.23
|
|
S&P 500 TR
|
29.78
|
27.73
|
Visit https://www.kurvinvest.com/etf/msfy for more recent performance information.
KEY FUND STATISTICS (as of May 31, 2026)
|
Net Assets
|
$12,244,462
|
|
Number of Holdings
|
10
|
|
Net Advisory Fee
|
$71,934
|
|
Portfolio Turnover
|
0%
|
|
30-Day SEC Yield
|
2.02%
|
|
30-Day SEC Yield Unsubsidized
|
1.88%
|
|
Distribution Yield
|
11.54%
|
WHAT DID THE FUND INVEST IN? (% of Net Assets as of May 31, 2026)
|
Security Type
|
(%)
|
|
U.S. Treasury Bills
|
80.9%
|
|
Purchased Options
|
19.8%
|
|
Money Market Funds
|
1.0%
|
|
Written Options
|
-0.9%
|
|
Cash & Other
|
-0.8%
|
|
Top 10 Issuers
|
(%)
|
|
United States Treasury Bill
|
80.9%
|
|
Microsoft Corp.
|
19.0%
|
|
Fidelity Government Portfolio
|
1.0%
|
WHAT WERE THE FUND COSTS FOR THE PAST YEAR? (based on a hypothetical $10,000 investment)
|
Fund Name
|
Costs of a $10,000 investment
|
Costs paid as a percentage of a $10,000 investment*
|
|
Kurv Yield Premium Strategy Netflix (NFLX) ETF
|
$83
|
0.99%
|
HOW DID THE FUND PERFORM LAST YEAR AND WHAT AFFECTED ITS PERFORMANCE?
For the fiscal year ended May 31, 2026, the Fund generated negative returns with consistent monthly distributions. Option premiums received from option strategies contributed negatively to total return.
WHAT FACTORS INFLUENCED PERFORMANCE
- Performance of the Netflix stock
- Amount of premium received from option strategies
- Amount of premium received from option strategies
POSITIONING
The Fund maintained long exposure to Netflix stock via synthetic long positions (long call options and short put options both with the same strike) and in-the-money calls. The Fund employed option strategies to receive premiums to generate income while allowing upside price appreciation potential. The remaining cash was invested in U.S. T-Bills to generate additional income.
|
Top Contributors
|
|
|
↑
|
Premiums received from writing out-of-the money call options
|
|
Top Detractors
|
|
|
↓
|
Long exposure to Netflix Stock
|
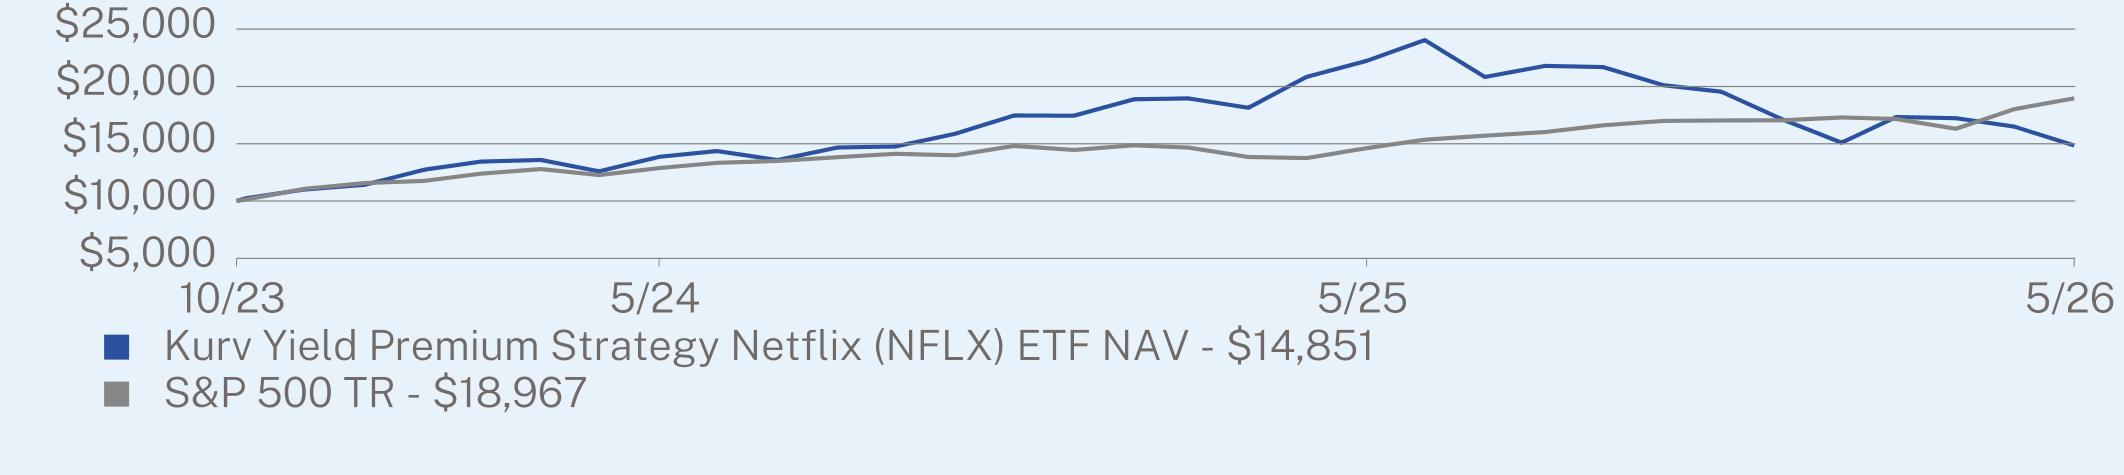
PERFORMANCE
For the fiscal year ended May 31, 2026, the Fund’s performance was -33.22% (NAV).
|
|
1 Year
|
Since Inception
(10/26/2023) |
|
Kurv Yield Premium Strategy Netflix (NFLX) ETF NAV
|
-33.22
|
16.44
|
|
S&P 500 TR
|
29.78
|
27.95
|
Visit https://www.kurvinvest.com/etf/nflp for more recent performance information.
KEY FUND STATISTICS (as of May 31, 2026)
|
Net Assets
|
$5,997,585
|
|
Number of Holdings
|
9
|
|
Net Advisory Fee
|
$94,728
|
|
Portfolio Turnover
|
0%
|
|
30-Day SEC Yield
|
2.76%
|
|
30-Day SEC Yield Unsubsidized
|
2.59%
|
|
Distribution Yield
|
15.90%
|
WHAT DID THE FUND INVEST IN? (% of Net Assets as of May 31, 2026)
|
Security Type
|
(%)
|
|
U.S. Treasury Bills
|
104.7%
|
|
Purchased Options
|
6.3%
|
|
Money Market Funds
|
1.9%
|
|
Written Options
|
-13.0%
|
|
Cash & Other
|
0.1%
|
|
Top 10 Issuers
|
(%)
|
|
United States Treasury Bill
|
104.7%
|
|
Fidelity Government Portfolio
|
1.9%
|
|
Netflix, Inc.
|
-6.7%
|
WHAT WERE THE FUND COSTS FOR THE PAST YEAR? (based on a hypothetical $10,000 investment)
|
Fund Name
|
Costs of a $10,000 investment
|
Costs paid as a percentage of a $10,000 investment*
|
|
Kurv Yield Premium Strategy Tesla (TSLA) ETF
|
$132
|
1.20%
|
HOW DID THE FUND PERFORM LAST YEAR AND WHAT AFFECTED ITS PERFORMANCE?
For the fiscal year ended May 31, 2026, the Fund generated positive returns with consistent monthly distributions. Option premiums received from option strategies contributed negatively to total return.
WHAT FACTORS INFLUENCED PERFORMANCE
- Performance of the Tesla stock
- Amount of premium received from option strategies
- Amount of premium received from option strategies
POSITIONING
The Fund maintained long exposure to Tesla stock via synthetic long positions (long call options and short put options both with the same strike) and in-the-money calls. The Fund employed option strategies to receive premiums to generate income while allowing upside price appreciation potential. The remaining cash was invested in U.S. T-Bills to generate additional income.
|
Top Contributors
|
|
|
↑
|
Long exposure to Tesla Stock
|
|
Top Detractors
|
|
|
↓
|
Exposure to certain option postions
|
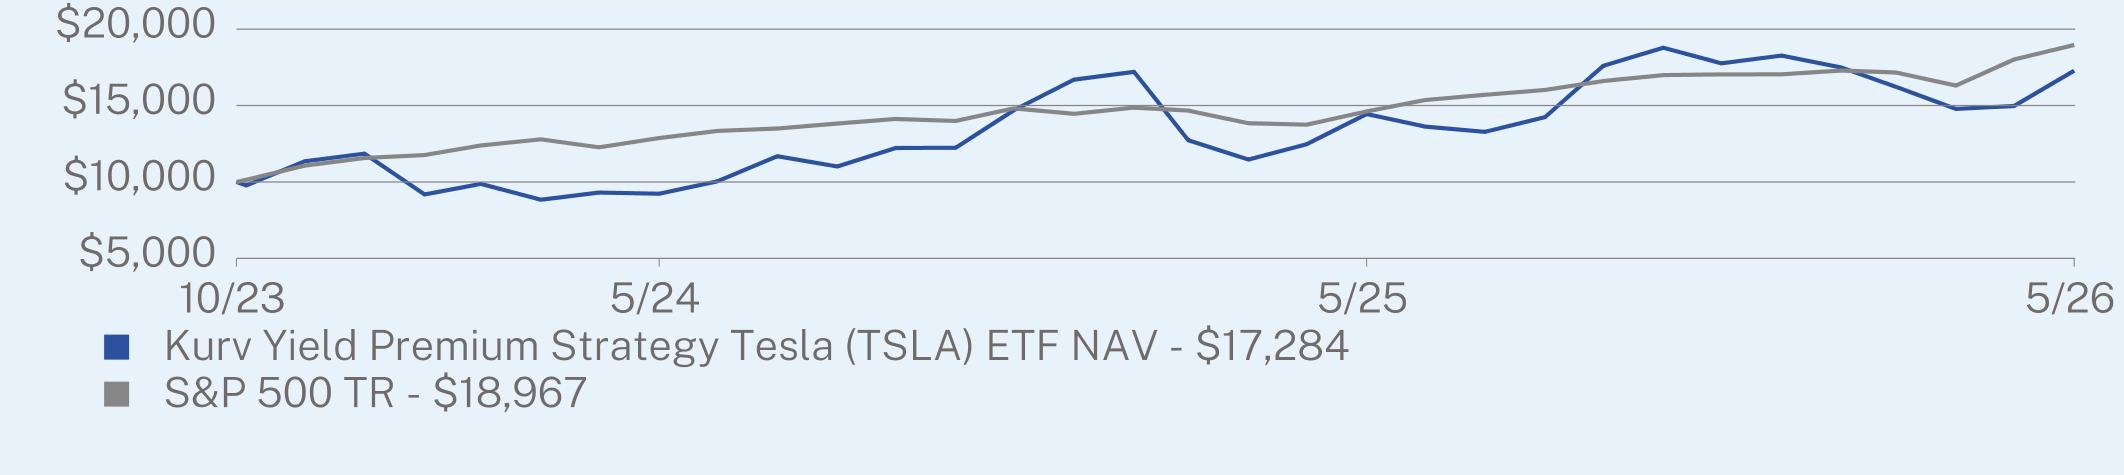
PERFORMANCE
For the fiscal year ended May 31, 2026, the Fund’s performance was 19.66% (NAV).
|
|
1 Year
|
Since Inception
(10/26/2023) |
|
Kurv Yield Premium Strategy Tesla (TSLA) ETF NAV
|
19.66
|
23.45
|
|
S&P 500 TR
|
29.78
|
27.95
|
Visit https://www.kurvinvest.com/etf/tslp for more recent performance information.
KEY FUND STATISTICS (as of May 31, 2026)
|
Net Assets
|
$23,771,860
|
|
Number of Holdings
|
10
|
|
Net Advisory Fee
|
$217,553
|
|
Portfolio Turnover
|
0%
|
|
30-Day SEC Yield
|
1.79%
|
|
30-Day SEC Yield Unsubsidized
|
1.64%
|
|
Distribution Yield
|
20.28%
|
WHAT DID THE FUND INVEST IN? (% of Net Assets as of May 31, 2026)
|
Security Type
|
(%)
|
|
U.S. Treasury Bills
|
75.1%
|
|
Purchased Options
|
22.2%
|
|
Money Market Funds
|
1.3%
|
|
Written Options
|
-1.1%
|
|
Cash & Other
|
2.5%
|
|
Top 10 Issuers
|
(%)
|
|
United States Treasury Bill
|
75.1%
|
|
Tesla, Inc.
|
21.1%
|
|
Fidelity Government Portfolio
|
1.3%
|
| [1] |
|
||
| [2] |
|
||
| [3] |
|
||
| [4] |
|
||
| [5] |
|
||
| [6] |
|
||
| [7] |
|
||
| [8] |
|
||
| [9] |
|
||
| [10] |
|
||
| [11] |
|
||
| [12] |
|
||
| [13] |
|
||
| [14] |
|
||
| [15] |
|