
Management's Discussion and Analysis
For the three and six months ended June 30, 2026 and 2025
(Expressed in United States dollars, unless otherwise stated)
| GALIANO GOLD INC. Management's Discussion and Analysis For the three and six months ended June 30, 2026 and 2025 |
This Management's Discussion and Analysis ("MD&A") of Galiano Gold Inc. ("Galiano" or the "Company") has been prepared by management and approved by the Board of Directors as of August 6, 2026 and should be read in conjunction with the Company's unaudited condensed consolidated interim financial statements and the notes thereto for the three and six months ended June 30, 2026 and 2025, the audited consolidated annual financial statements and the notes thereto for the year ended December 31, 2025 and the related MD&A. The unaudited condensed consolidated interim financial statements have been prepared in accordance with International Accounting Standard 34 - Interim Financial Reporting of the International Financial Reporting Standards ("IFRS") as issued by the International Accounting Standards Board ("IASB").
This discussion covers the three and six months ended June 30, 2026 and the subsequent period up to the date of issuance of this MD&A. All dollar amounts herein are expressed in United States dollars ("US dollars") unless otherwise stated. References to $ means US dollars and C$ are to Canadian dollars. The first, second, third, and fourth quarters of the Company's fiscal years ("FY") are referred to as "Q1", "Q2", "Q3", and "Q4", respectively.
The Company has included certain non-IFRS performance measures throughout this MD&A. These performance measures are employed by management to assess the Company's operating and financial performance and to assist in business decision-making. The Company believes that, in addition to conventional measures prepared in accordance with IFRS, certain investors and other stakeholders use this information to evaluate the Company's operating and financial performance; however, as explained elsewhere herein, these non-IFRS performance measures do not have any standardized meaning and therefore may not be comparable to similar measures presented by other issuers. Accordingly, these performance measures are intended to provide additional information and should not be considered in isolation or as a substitute for measures of performance prepared in accordance with IFRS. Refer to section "Non-IFRS Measures" of this MD&A for additional information regarding these non-IFRS measures.
This MD&A contains forward-looking statements and should be read in conjunction with the risk factors described under the headings "Risks and Uncertainties" and "Cautionary Statements" at the end of this MD&A.
| GALIANO GOLD INC. Management's Discussion and Analysis For the three and six months ended June 30, 2026 and 2025 |
TABLE OF CONTENTS
| GALIANO GOLD INC. Management's Discussion and Analysis For the three and six months ended June 30, 2026 and 2025 |
BUSINESS OVERVIEW
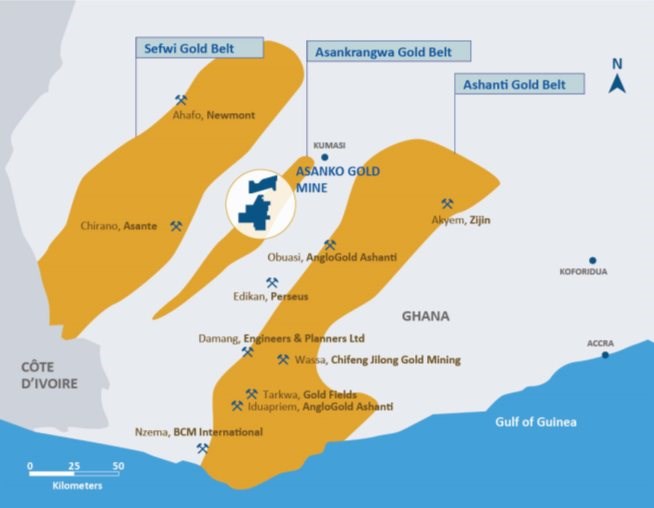
Galiano was incorporated on September 23, 1999, under the Business Corporations Act of British Columbia, Canada. Galiano is a gold mining company with a strategic vision to become a mid-tier producer. The Company's operating gold mine is the Asanko Gold Mine ("AGM") located on the Asankrangwa Gold Belt in the Republic of Ghana ("Ghana"), West Africa. The AGM consists of four main open-pit deposits: Abore, Nkran, Esaase and Miradani North, multiple satellite deposits and a carbon-in-leach processing plant, with a capacity of 5.8 million tonnes ("Mt") per annum. The AGM also owns various exploration licenses across the highly prospective and underexplored Asankrangwa Gold Belt.
Galiano is focused on creating a sustainable business capable of value creation for all stakeholders through production, exploration, and disciplined deployment of its financial resources.
The Company's common shares trade under the symbol "GAU" on the Toronto Stock Exchange in Canada and the NYSE American Stock Exchange in the United States.
Additional information on the Company, including its most recent Annual Information Form ("AIF"), is available under the Company's SEDAR+ profile at www.sedarplus.ca and the Company's website: www.galianogold.com.
| GALIANO GOLD INC. Management's Discussion and Analysis For the three and six months ended June 30, 2026 and 2025 |
Q2 2026 AND YEAR-TO-DATE HIGHLIGHTS
Safety
No lost-time injuries ("LTI") nor total recordable injuries (inclusive of LTIs) ("TRI") recorded during Q2 2026. The AGM has achieved 11.0 million hours worked without an LTI, equating to 456 accident-free days, as of June 30, 2026.
12‐month rolling LTI and TRI frequency rates as of June 30, 2026 of 0.00 and 0.11 per million hours worked, respectively.
Financial
Cash and cash equivalents of $80.0 million and restricted cash of $25.9 million as of June 30, 2026 and no debt.
Generated cash flow from operating activities, before legal restrictions, of $31.9 million during Q2 2026.
Income from mine operations of $92.8 million during Q2 2026.
Net income of $0.24 and adjusted net income1 of $0.09 per common share (basic) during Q2 2026.
Earnings before interest, taxes, depreciation, and amortization ("EBITDA") of $105.6 million and Adjusted EBITDA1 of $78.5 million during Q2 2026.
Mining Operations
Processing
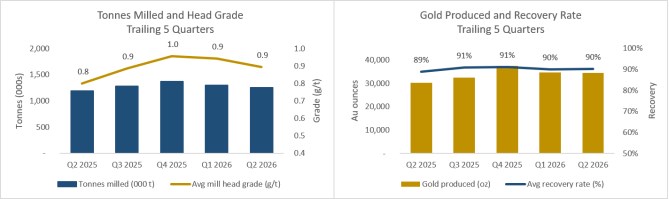
1.3 Mt of ore was milled at an average feed grade of 0.9 g/t, with metallurgical recovery averaging 90% during Q2 2026. Mill availability during the quarter was 90% partly due to downtime required to replace a failed ball mill gearbox.
Produced 34,391 ounces of gold during the quarter and 69,138 ounces of gold produced year-to-date, in line with the Company's indicative first half production guidance range of between 60,000 ounces to 70,000 ounces.
Sold 35,247 ounces of gold during the quarter and 69,428 ounces of gold year-to-date at average prices of $4,432 per ounce ("/oz") and $4,641/oz, respectively, excluding the effect of realized losses on gold hedging instruments.
Nkran Cut 3 Development
Development of Cut 3 at the Nkran deposit continued with 6.1 Mt of waste mined, an increase of 30% from Q1 2026. Additional mining equipment is expected to be mobilized during Q3 2026, leading to a further acceleration of mining rates at Nkran in the second half of 2026.
Capitalized development pre-stripping costs at Nkran Cut 3 of $22.1 million during Q2 2026 and $35.6 million year-to-date.
Costs
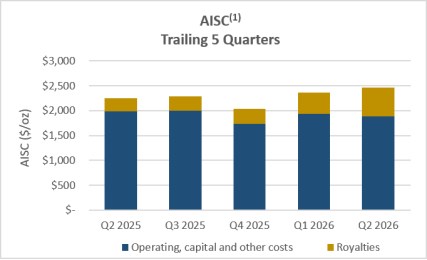
All-in sustaining costs1 ("AISC") of $2,473/oz for the quarter, a 10% increase compared to Q2 2025 primarily resulting from higher royalties expense under Ghana's new sliding scale royalty framework.
Year-to-date AISC1 of $2,418/oz, tracking in line with FY 2026 cost guidance of between $2,300/oz and $2,600/oz.
Exploration
| GALIANO GOLD INC. Management's Discussion and Analysis For the three and six months ended June 30, 2026 and 2025 |
2026 GUIDANCE AND OUTLOOK
FY 2026 production guidance for the AGM remains between 140,000 ounces and 160,000 ounces of gold and FY 2026 AISC1 remains guided to between $2,300/oz and $2,600/oz.
AISC1 for the AGM is anticipated to reduce over 2026 and in 2027 as grades from Abore increase and drive higher production.
The Abore deposit is expected to provide the majority of mill feed in FY 2026, with the Esaase deposit providing supplementary ore. Higher mined grades are expected from Abore in the second half of the year, therefore gold production continues to be weighted to the back half of 2026. Given the expected ramp-up of gold production over FY 2026, the Company's indicative production ranges for the first and second half of 2026 are as follows.
| Unit | H1 2026 | H2 2026 | ||
| Actual | Guidance | Guidance | ||
| Gold production | Oz | 69,138 | 60,000 to 70,000 | 80,000 to 90,000 |
Total sustaining capital expenditures remain guided to between $16 million and $18 million for FY 2026, excluding sustaining capitalized stripping costs. Sustaining capital expenditures in FY 2026 include the expansion of the tailings facility, minor upgrades to the processing plant, and upgrades to mine camp infrastructure.
Development capital for FY 2026 is revised to between $105 million to $125 million from $120 million to $140 million, which primarily relates to Nkran Cut 3 waste stripping ($100 million to $120 million) and village resettlement costs. Mined volumes at Nkran Cut 3 are expected to increase significantly as the year progresses as additional mining equipment continues to be mobilized to the AGM; however, delays in certain village relocation projects are forecast to be approximately $15 million lower in 2026 and deferred into future periods.
Exploration expenditures at the AGM remain guided to between $24 million to $26 million, targeting Mineral Reserve growth at Esaase, underground Mineral Resource expansion at Abore, and priority greenfield areas on the AGM's tenements.
(1) Non-IFRS measure. Refer to section "Non-IFRS Measures" of this MD&A.
| GALIANO GOLD INC. Management's Discussion and Analysis For the three and six months ended June 30, 2026 and 2025 |
SELECTED OPERATIONAL AND FINANCIAL HIGHLIGHTS
| Q2 2026 | Q1 2026 | Q4 2025 | Q3 2025 | Q2 2025 | |
| Mining Operations | |||||
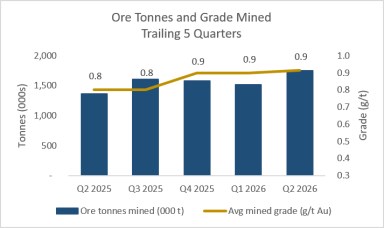
| Ore mined ('000t) | 1,751 | 1,521 | 1,575 | 1,605 | 1,365 |
| Waste mined ('000t) | 6,529 | 9,084 | 8,337 | 9,067 | 8,101 |
| Strip ratio (waste-to-ore) | 3.7 | 6.0 | 5.3 | 5.7 | 5.9 |
| Average gold grade mined (g/t) | 0.9 | 0.9 | 0.9 | 0.8 | 0.8 |
| Mining costs ($/t mined) | 4.56 | 3.73 | 3.94 | 3.38 | 3.59 |
| Ore tonnes trucked ('000 t) | 1,192 | 1,163 | 1,069 | 1,288 | 1,030 |
| Ore transportation costs ($/t trucked) | 4.96 | 4.42 | 4.45 | 4.35 | 4.49 |
| Processing | |||||
| Ore milled ('000t) | 1,255 | 1,305 | 1,369 | 1,283 | 1,193 |
| Average mill head grade (g/t) | 0.9 | 0.9 | 1.0 | 0.9 | 0.8 |
| Average recovery rate (%) | 90 | 90 | 91 | 91 | 89 |
| Processing costs ($/t milled) | 14.05 | 12.79 | 12.13 | 12.57 | 12.89 |
| General and administrative costs ($/t milled) | 8.48 | 7.04 | 7.58 | 6.62 | 6.24 |
| Gold produced (oz) | 34,391 | 34,747 | 37,574 | 32,533 | 30,350 |
| Development Stripping - Nkran Cut 3 | |||||
| Waste mined ('000t) | 6,113 | 4,707 | 4,324 | 3,426 | 1,723 |
| Mining costs ($/t mined) | 3.58 | 2.85 | 2.48 | 3.29 | 4.00 |
| Development capitalized stripping costs ($m) | 22.1 | 13.5 | 11.1 | 12.0 | 6.9 |
| Capital Expenditures | |||||
| Sustaining capital ($m) | 2.0 | 3.6 | 4.4 | 4.2 | 2.2 |
| Development capital ($m) | 2.4 | 3.4 | 0.7 | 2.9 | 4.9 |
| Sustaining capitalized stripping costs ($m) | 8.5 | 6.4 | 11.7 | 11.9 | 15.1 |
| Financial, Costs and Cash Flow | |||||
| Revenue ($m) | 156.6 | 166.5 | 159.7 | 114.2 | 97.3 |
| Gold sold (oz) | 35,247 | 34,181 | 38,276 | 32,577 | 29,287 |
| Average gold sales price - gross ($/oz)(1) | 4,432 | 4,857 | 4,164 | 3,501 | 3,317 |
| Average gold sales price - net ($/oz)(2) | 3,853 | 4,122 | 3,744 | 3,099 | 2,951 |
| AISC ($/oz sold)(3) | 2,473 | 2,361 | 2,033 | 2,283 | 2,251 |
| Income from mine operations ($m) | 92.8 | 72.5 | 51.1 | 10.0 | 24.7 |
| Adjusted net income (loss) ($m)(3) | 23.1 | 29.5 | 40.0 | (2.8) | 21.0 |
| Adjusted EBITDA ($m)(3) | 78.5 | 93.9 | 85.5 | 37.8 | 42.2 |
| Cash flow from operating activities ($m) | 6.0 | 46.7 | 55.8 | 40.4 | 35.8 |
(1) Gross average gold sales price is a non-IFRS measure and calculated by dividing revenue, as reported in the Company's consolidated financial statements, by the number of gold ounces sold during the period.
(2) Net average gold sales price is a non-IFRS measure and calculated by dividing revenue less realized losses on gold hedge derivative instruments, as reported in the Company's consolidated financial statements, by the number of gold ounces sold during the period.
(3) Non-IFRS measure. Refer to "Non-IFRS Measures" in this MD&A.
| GALIANO GOLD INC. Management's Discussion and Analysis For the three and six months ended June 30, 2026 and 2025 |
Q2 2026 Operational Analysis for the Asanko Gold Mine
Mining Operations
Abore
Mined 1.4 Mt of ore, an increase of 22% from Q1 2026, at an average grade of 1.0 g/t gold. Mined grades were largely in line with Q1 2026.
Strip ratio of 3.7:1, a decrease of 39% from Q1 2026, resulting from Abore transitioning into a lower waste phase as future ore benches have been exposed.
Esaase
Mined 0.3 Mt of ore at an average grade of 0.7 g/t gold. Mined ore volume and grade were consistent with Q1 2026.
Strip ratio of 4.8:1, a decrease of 19% from Q1 2026.
Mining Operating Costs
Mining costs per tonne at Abore and Esaase averaged $4.56 per tonne ("/t") in Q2 2026, compared to $3.59/t in Q2 2025. The 27% increase in mining costs per tonne in Q2 2026 was attributable to 13% fewer tonnes mined, which increased fixed mining costs on a per tonne basis, higher drill and blast costs resulting from mining a higher proportion of fresh rock at Abore, and higher diesel prices.
Ore Transportation
Ore transportation reflects ore transported from mined deposits located greater than 5 kilometers ("km") from the processing plant, which currently includes the Abore and Esaase deposits. Ore transported from closer deposits is considered rehandling, the costs of which are included within mining costs. During the quarter, 1.2 Mt of ore was trucked from the Abore and Esaase deposits to the processing plant, consistent with Q1 2026.
Ore transportation unit costs in Q2 2026 were 12% higher than Q2 2025 due to higher diesel prices.
| GALIANO GOLD INC. Management's Discussion and Analysis For the three and six months ended June 30, 2026 and 2025 |
Processing
Gold Production
The AGM produced 34,391 ounces of gold during Q2 2026, consistent with Q1 2026 gold production, as the processing plant milled 1.3 Mt of ore at an average grade of 0.9 g/t with metallurgical recovery averaging 90%. Approximately 79% of the mill feed was sourced from mined ore at Abore, with the remainder of mill feed primarily from the Esaase deposit.
Milled Tonnes
Mill throughput in Q2 2026 was 4% lower than Q1 2026 due to ongoing maintenance of the pitman arm on the primary crusher, which is expected to be completed in Q3 2026, and downtime required to replace a failed ball mill gearbox. These factors resulted in mill availability of 90% during Q2 2026.
Average Head Grade
Average mill head grades in Q2 2026 were in line with Q1 2026, as average mined grades remained 0.9 g/t.
Processing Costs
Processing costs per tonne in Q2 2026 were $14.05, a 9% increase from Q2 2025. The increase in processing costs per tonne was largely driven by higher maintenance costs on the primary crusher and ball mill in Q2 2026.
Capital Expenditures
Sustaining capital expenditures totaled $2.0 million during Q2 2026, consistent with expenditures in Q2 2025. Sustaining capital expenditures in Q2 2026 primarily related to a tailings facility expansion. Sustaining capital expenditures are expected to accelerate in the second half of the year as additional waste material becomes available to complete the tailings facility expansion.
Development capital expenditures during Q2 2026 totaled $2.4 million, approximately 50% lower than Q2 2025 due to the comparative period including costs associated with completing the secondary crushing circuit at the processing plant. Development capital expenditures in Q2 2026 related mainly to costs of relocating villages near the AGM's operations.
Nkran Cut 3 Development
Nkran Cut 3 waste stripping progressed during Q2 2026 with 6.1 Mt of waste rock mined, a 30% increase from Q1 2026, supported by the mobilization of additional mining equipment. Mining costs at Nkran averaged $3.58/t in Q2 2026 compared to $4.00/t in Q2 2025. The decrease in mining costs per tonne was attributable to higher tonnes mined, partly offset by longer haul distances and higher diesel prices.
The mining contractor is currently mobilizing additional mining equipment to the AGM; therefore, waste stripping volumes at Nkran are expected to continue rising following the mobilization of additional mining equipment in Q3 2026.
| GALIANO GOLD INC. Management's Discussion and Analysis For the three and six months ended June 30, 2026 and 2025 |
Total Cash Costs and AISC
Total Cash Costs1
For the three and six months ended June 30, 2026, total cash costs1 were $2,128/oz and $1,934/oz, respectively, compared to $1,602/oz and $1,664/oz in the comparative periods of 2025. Total cash costs1 were higher in the 2026 periods due to higher royalties expense resulting from higher average gold sales prices and the amendment to Ghana's royalty framework, partly offset by higher gold ounces sold. Royalties expense was higher for the three and six months ended June 30, 2026 by $12.6 million and $22.5 million, respectively, relative to the comparative periods in 2025.
Total cash costs per ounce1 in Q2 2026 were 23% higher than Q1 2026 due to higher royalties and diesel costs.
AISC1
For the three and six months ended June 30, 2026, AlSC1 was $2,473/oz and $2,418/oz, respectively, compared to $2,251/oz and $2,339/oz in the comparative periods of 2025. The increase in AlSC1 was mainly due to the increase in total cash costs1 described above, partly offset by higher gold ounces sold and lower sustaining capital expenditures.
AISC1 was 5% higher in Q2 2026, compared to Q1 2026, driven primarily by higher royalties.
EXPLORATION ACTIVITIES
The Company holds a district-scale land package of 476km2 on the highly prospective and underexplored Asankrangwa Gold Belt. During Q2 2026, the Company conducted exploration programs at the AGM to assess existing mineralization and expansion potential at several deposits, while also evaluating their broader resource prospects. Concurrent efforts focused on identifying greenfield exploration opportunities throughout the regional tenement portfolio.
Following a successful 2025 program, exploration efforts at the AGM in 2026 will be focused on supporting a revised life of mine plan and mineral reserve and mineral resource updates, anticipated in Q1 2027.
Exploration activities will be heavily focused on delivering near-term value through mineral reserve and mineral resource growth within the brownfields space, while simultaneously continuing to advance the greenfields generative portfolio at the AGM via early-stage fieldwork and drill testing at numerous high-priority regional targets.
| GALIANO GOLD INC. Management's Discussion and Analysis For the three and six months ended June 30, 2026 and 2025 |
Esaase
The 2026 infill drilling program at Esaase is designed to convert existing open pit Mineral Resources from Inferred classification to the Indicated category, with an objective of significantly increasing the Esaase Mineral Reserve and supporting the planning of potential future open pit expansions.
Phase 1 of the program consisting of approximately 9,000m was completed in early Q2 2026, with initial results positive and in line with expectations. Following these results, the Esaase program was expanded to its full planned 33,700m with an additional $7.5 million approved by the Company's Board of Directors.
13,749m of drilling was completed in Q2 2026, bringing the total to 16,250m completed as of June 30, 2026. The program has been prioritized for completion in Q3 2026 with seven drill rigs now mobilized to Esaase, and results expected to be included in the AGM's 2027 Mineral Resource and Mineral Reserve update planned for Q1 2027.
Abore
The drilling campaign at Abore initiated in Q1 2026 continued in Q2 2026 with 4,564m of drilling completed during the quarter. 16,142m of a planned 32,000m of diamond drilling for 2026 has been completed. Drilling at Abore was slowed through the quarter as drill rigs were repositioned to prioritize the Esaase drill program. Continuation of Abore drilling is planned for Q3 2026 once the Esaase program is completed.
The Abore drilling program aims to continue to grow the underground Mineral Resource through step out drilling to at least 200m below the maiden Mineral Resource, which was released in February 2026. Planned drilling consists of selective infill drilling designed to prove continuity of mineralization within and below the current Mineral Resource with flexibility to step out and test for mineralization at deeper elevations based on results as drilling progresses.
Results from the first 14,500m of drilling were released in Q2 2026. The drilling was designed to include both step-out drilling, targeting new zones of mineralization beyond the known Mineral Resource, and infill drilling focused on expanding and upgrading the existing underground Mineral Resource. This drilling intersected mineralization up to 180m below the existing underground Mineral Resource, while infill drilling has improved continuity across key mineralized zones that currently sit outside the existing Mineral Resource. Drilling beneath the Main and South pit areas also continued to confirm robust extensions of mineralization both down plunge and along strike of existing mineralization.
Refer to the Company's news release dated May 11, 2026, a copy of which is available under the Company's SEDAR+ profile at www.sedarplus.ca, for drill results from the Abore program, including data verification and QA/QC measures.
Greenfield Targets
Work on regional greenfield targets across the AGM's tenements was focused on the New Obuasi and Amoaman prospecting leases, which contain the Nsoroma, Ahuofe, and other priority targets located along strike to the southwest of the Nkran deposit. Work in Q2 2026 consisted of soil sampling, ground magnetics and induced polarization (IP) surveying, along with general prospecting and ground truthing activities.
The Company also initiated an IP survey in the Fromenda 1 area during Q2 2026. This survey is designed to identify extensions of the known mineralized structures within the Fromenda tenement.
Exploration Cost
Exploration expenditures during the three and six months ended June 30, 2026 were $5.8 million and $10.8 million, respectively. Exploration costs are tracking in line with guidance.
| GALIANO GOLD INC. Management's Discussion and Analysis For the three and six months ended June 30, 2026 and 2025 |
ENVIRONMENTAL, SOCIAL AND CORPORATE GOVERNANCE
Sustainability is at the core of Galiano's business strategy. The Company believes that a comprehensive sustainability strategy is integral to meeting its strategic objectives by positively supporting stakeholder relationships, improving risk management, reducing the AGM's production costs, and benefiting host communities beyond the life of the mine.
For further details on the Company's sustainability program, refer to the Company's 2025 Sustainability Report (the "2025 Sustainability Report") published on June 1, 2026, which is available on the Company's website at www.galianogold.com.
Health & Safety
| Q2 2026 | Q1 2026 | Q4 2025 | Q3 2025 | Q2 2025 | |
| Health and safety | |||||
| LTIs(1) | - | - | - | - | - |
| TRIs(1) | - | - | - | 1 | - |
| 12-month rolling LTI frequency rate(1) | 0.00 | 0.00 | 0.24 | 0.39 | 0.42 |
| 12-month rolling TRI frequency rate(1) | 0.11 | 0.11 | 0.48 | 0.90 | 0.97 |
(1) The Company records and reports injuries in accordance with the International Council on Mining and Metals' (ICMM) Mining Principles.
Safety performance remained strong in Q2 2026, with no injuries recorded, reflecting sustained safety leadership and effective risk management. The Company achieved 15 consecutive months, and 11.0 million hours worked, without a reported LTI. As of June 30, 2026, it had been 456 days since an LTI occurred.
Social Performance
Implementation of the Five-Year Socio-Economic Development Plan continued during Q2 2026, with progress across local employment, skills development, alternative livelihoods and community infrastructure initiatives. Stakeholder engagement across catchment communities also remained strong.
Environmental Performance
Environmental monitoring during Q2 2026 indicated full compliance with regulatory standards for water and air quality. Routine quarterly regulatory inspections were completed during Q2 2026 with no non-conformances identified.
| GALIANO GOLD INC. Management's Discussion and Analysis For the three and six months ended June 30, 2026 and 2025 |
MACROECONOMIC FACTORS
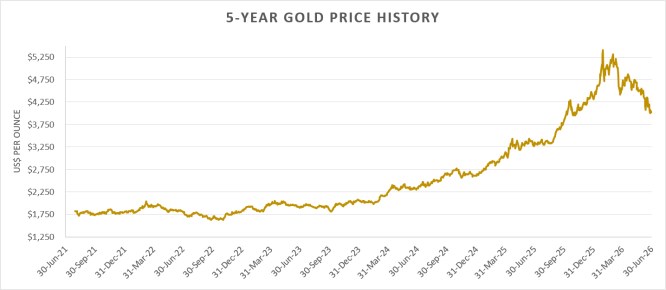
Gold Price
The price of gold is the largest single external factor in determining the Company's profitability and cash flow from operations. Therefore, the financial performance of the Company is expected to be closely linked to the price of gold. Historically, the price of gold has been subject to volatile price movements over short periods of time and affected by numerous macroeconomic factors that are beyond the Company's control. The price of gold may be impacted by currency exchange rate fluctuations and the relative strength of the US dollar, the supply of and demand for gold, geopolitical events, and macroeconomic factors, such as interest rates and inflation expectations. During Q2 2026, the price of gold traded between a low of $4,002/oz in late June and a high of $4,871/oz in mid-April. The average gold price for Q2 2026 was $4,506/oz, based on the London Bullion Market Association ("LBMA") PM benchmark, compared to the Q2 2025 average price of $3,280/oz. Gold prices during Q2 2026 were influenced by geopolitical risks and volatility in interest rates and the US dollar, among other factors. Central bank demand for gold continues to be a key driver influencing prices, as central banks diversify their reserve holdings away from treasuries and into gold.
During Q2 2026, the Company's average gross gold sales price was $4,432/oz, excluding the effect of realized losses on gold hedging instruments.
Ghana Economy
Ghana successfully completed its three-year, $3 billion Extended Credit Facility bailout program with the International Monetary Fund ("IMF"). The program helped restore macroeconomic stability, sharply reduced inflation and improved confidence in the Ghanaian Cedi ("Cedi"). Ghana's outstanding IMF debt is $2.7 billion, while the ratings agency Fitch upgraded Ghana's sovereign rating to 'B' from 'B-'.
Ghana's recent fiscal climate has not materially impacted the operations of the AGM, as much of the cost structure is tied to the US dollar.
During Q2 2026, the Cedi depreciated by approximately 3% relative to the US dollar. Periods when the Cedi demonstrates strength relative to the US dollar puts moderate pressure on the AGM's cost and capital structure. However, most of the AGM's significant cost drivers (e.g. mining contracts, diesel) are denominated in US dollars, thus isolating them from volatile movements in the Cedi.
| GALIANO GOLD INC. Management's Discussion and Analysis For the three and six months ended June 30, 2026 and 2025 |
Oil Prices
During Q2 2026, tensions in the Middle East remained high and tanker traffic in the Strait of Hormuz ("Strait") remains volatile. It is estimated that 20% to 30% of global oil supply flows through the Strait and, consequently, oil prices have experienced significant volatility in 2026 with Brent crude oil spot prices near $75 per barrel as of August 5, 2026.
Diesel fuel is a key cost driver of the AGM's cost structure. To the extent oil prices remain at elevated levels, the AGM's mining costs would be impacted. Since closure of the Strait in early March 2026, diesel prices in Ghana have increased by approximately 32% as of July 31, 2026.
REVIEW OF Q2 2026 CONSOLIDATED FINANCIAL RESULTS
Selected financial results for the three months ended June 30, 2026 and 2025
| Three months ended June 30, | ||||||
| 2026 | 2025 | |||||
| (in thousands of US dollars, except per share amounts) | $ | $ | ||||
| Revenue | 156,568 | 97,304 | ||||
| Realized and unrealized gains (loss es ) on gold hedges | 27,177 | (12,509 | ) | |||
| Net revenue | 183,745 | 84,795 | ||||
| Cost of sales: | ||||||
| Production costs | (54,996 | ) | (39,303 | ) | ||
| Depreciation and depletion | (15,603 | ) | (13,054 | ) | ||
| Royalties | (20,348 | ) | (7,785 | ) | ||
| Total cost of sales | (90,947 | ) | (60,142 | ) | ||
| Income from mine operations | 92,798 | 24,653 | ||||
| General and administrative expenses | (1,539 | ) | (4,625 | ) | ||
| Exploration and evaluation expenditures | (891 | ) | (910 | ) | ||
| Income from operations | 90,368 | 19,118 | ||||
| Finance income | 659 | 1,924 | ||||
| Finance expense | (5,918 | ) | (4,629 | ) | ||
| Foreign exchange (loss ) gain | (378 | ) | 5,480 | |||
| Income before taxes | 84,731 | 21,893 | ||||
| Current income tax expense | (11,336 | ) | (339 | ) | ||
| Deferred income tax expense | (4,497 | ) | - | |||
| Net income and comprehensive income | 68,898 | 21,554 | ||||
| Weighted average number of shares outstanding: | ||||||
| Basic | 261,300,578 | 257,734,700 | ||||
| Diluted | 269,783,870 | 264,423,547 | ||||
| Net income per share attributable to common shareholders : | ||||||
| Basic | 0.24 | 0.07 | ||||
| Diluted | 0.23 | 0.07 | ||||
| GALIANO GOLD INC. Management's Discussion and Analysis For the three and six months ended June 30, 2026 and 2025 |
Revenue
During Q2 2026, the Company sold 35,247 ounces of gold at an average gold sales price of $4,432/oz for total revenue of $156.6 million (including $0.4 million of by-product silver revenue). During Q2 2025, the Company sold 29,287 ounces of gold at an average gold sales price of $3,317/oz for total revenue of $97.3 million (including $0.2 million of by-product silver revenue). The average gold sales price, including the effect of realized gold hedging losses, for Q2 2026 amounted to $3,853/oz.
The increase in revenue quarter-on-quarter was due to a 34% increase in average gold sales price and a 20% increase in gold ounces sold.
Realized and Unrealized Gains (Losses) on Gold Hedges
In Q4 2025, the Company changed its presentation of realized and unrealized losses on gold hedge derivative instruments from a component of finance expense to a component of net revenue. The Q2 2025 comparative period financial information has been restated to conform with the current period presentation.
During Q2 2026, the Company recorded a $20.4 million realized loss on settled gold hedges, of which $19.6 million was recognized as unrealized losses in previous periods. The Company also recorded a $28.0 million unrealized gain during the quarter on its remaining hedged gold ounces. The unrealized gain was driven by a decrease in gold prices during Q2 2026.
Refer to "Liquidity and Capital Resources" in this MD&A for details regarding the Company's remaining gold hedging program.
Production costs
During Q2 2026, the Company incurred production costs of $55.0 million, compared to $39.3 million in Q2 2025. Production costs were higher than the comparative period due to more gold ounces sold in Q2 2026, as well as higher diesel costs.
Depreciation and Depletion
During Q2 2026, depreciation and depletion expense was $15.6 million, compared to $13.1 million in Q2 2025. Depreciation and depletion expense was higher in Q2 2026 due to 20% higher gold ounces sold.
Royalties
Until March 10, 2026, all of the AGM's concessions were subject to a 5% gross revenue royalty payable to the Government of Ghana. Effective March 10, 2026, the Government of Ghana passed into law a bill to amend the country's royalty framework such that gold royalties are subject to a sliding scale, starting at 5% and increasing to 12% when gold prices exceed $4,500/oz.
On March 13, 2026, the Government of Ghana passed into law an amendment to the Growth and Sustainability Levy ("GSL") rate, reducing it from 3% to 1% of gold revenues. The GSL is presented as a royalty expense in the Statement of Operations.
The net effect of the aforementioned royalty amendments is an increase in total royalty rates from 8% to 12% at gold prices between $4,000/oz to $4,500/oz.
Royalties expense was higher in Q2 2026 due to higher recorded revenues and the aforementioned amendments to royalty rates.
| GALIANO GOLD INC. Management's Discussion and Analysis For the three and six months ended June 30, 2026 and 2025 |
General and Administrative ("G&A") Expenses
G&A expenses in Q2 2026 were $3.1 million lower than Q2 2025 primarily due to a $3.2 million decrease in share-based compensation expense resulting from a decrease in the fair value of cash‐settled long‐term incentive plan awards linked to the price of the Company's common shares.
Finance Expense
The following table summarizes the significant components of finance expense for the three months ended June 30, 2026 and 2025:
| Three months ended June 30, | ||||||
| 2026 | 2025 | |||||
| (in thousands of US dollars ) | $ | $ | ||||
| Interest on lease liabilities | (2,118 | ) | (1,718 | ) | ||
| Accretion expense on asset retirement provisions | (830 | ) | (723 | ) | ||
| Accretion expense on deferred consideration | (436 | ) | (773 | ) | ||
| Change in fair value of contingent consideration | (1,544 | ) | (1,332 | ) | ||
| Mark-to-market adjustment on marketable securities | (432 | ) | - | |||
| RCF standby fee and other costs | (418 | ) | - | |||
| Other | (140 | ) | (83 | ) | ||
| Total finance expense | (5,918 | ) | (4,629 | ) | ||
Finance expense was higher in Q2 2026 primarily due to costs associated with a revolving credit facility, including $0.2 million of standby fees, a $0.4 million fair value adjustment on marketable securities and $0.4 million of higher interest on lease liabilities.
Foreign Exchange (Loss) Gain
The majority of the foreign exchange loss was unrealized and related to the quarter-end revaluation of value added tax ("VAT") receivables in Ghana that are denominated in Cedis. As noted previously, the value of the Cedi depreciated against the US dollar during the quarter, resulting in an unrealized revaluation loss on VAT receivables. The foreign exchange gain in the prior quarter was impacted by a 50% strengthening of the Cedi against the US dollar.
Current Income Tax Expense
During Q2 2026, the Company recorded current income tax ("CIT") expense of $11.3 million. The CIT expense primarily relates to taxable income generated in Ghana by the AGM, which is subject to a statutory tax rate of 35%. The increase in CIT expense quarter-on-quarter was due to higher gold prices and more gold ounces sold.
| GALIANO GOLD INC. Management's Discussion and Analysis For the three and six months ended June 30, 2026 and 2025 |
REVIEW OF YEAR-TO-DATE CONSOLIDATED FINANCIAL RESULTS
Selected financial results for the six months ended June 30, 2026 and 2025
| Six months ended June 30, | ||||||
| 2026 | 2025 | |||||
| (in thousands of US dollars, except per share amounts) | $ | $ | ||||
| Revenue | 323,092 | 173,894 | ||||
| Realized and unrealized gains (losses ) on gold hedges | 5,281 | (47,625 | ) | |||
| Net revenue | 328,373 | 126,269 | ||||
| Cost of sales: | ||||||
| Production costs | (100,246 | ) | (81,545 | ) | ||
| Depreciation and depletion | (27,983 | ) | (27,447 | ) | ||
| Royalties | (34,893 | ) | (12,380 | ) | ||
| Total cost of sales | (163,122 | ) | (121,372 | ) | ||
| Income from mine operations | 165,251 | 4,897 | ||||
| General and administrative expenses | (6,542 | ) | (9,343 | ) | ||
| Exploration and evaluation expenditures | (1,613 | ) | (2,381 | ) | ||
| Income (loss) from operations | 157,096 | (6,827 | ) | |||
| Finance income | 1,303 | 3,050 | ||||
| Finance expense | (11,641 | ) | (8,624 | ) | ||
| Foreign exchange (loss ) gain | (1,738 | ) | 5,284 | |||
| Income (loss) before taxes | 145,020 | (7,117 | ) | |||
| Current income tax expense | (35,044 | ) | (721 | ) | ||
| Deferred income tax expense | (4,218 | ) | - | |||
| Net income (loss) and comprehensive income (loss) | 105,758 | (7,838 | ) | |||
| Weighted average number of shares outstanding: | ||||||
| Basic | 260,791,920 | 257,454,965 | ||||
| Diluted | 269,698,377 | 257,454,965 | ||||
| Net income (loss ) per share attributable to common shareholders: | ||||||
| Basic | 0.36 | (0.03 | ) | |||
| Diluted | 0.35 | (0.03 | ) | |||
Revenue
During the six months ended June 30, 2026, the Company sold 69,428 ounces of gold at an average gold price of $4,641/oz for total revenue of $323.1 million (including $0.8 million of by-product silver revenue). During the comparative period of 2025, the Company sold 56,281 ounces of gold at an average gold price of $3,084/oz for total revenue of $173.9 million (including $0.3 million of by-product silver revenue). The average gold sales price, including the effect of realized gold hedging losses, for the six months ended June 30, 2026 amounted to $3,985/oz.
The increase in revenue period-on-period was due to a 50% increase in average gold sales prices and a 23% increase in gold ounces sold.
| GALIANO GOLD INC. Management's Discussion and Analysis For the three and six months ended June 30, 2026 and 2025 |
Realized and Unrealized Gains (Losses) on Gold Hedges
During the six months ended June 30, 2026, the Company recorded a $45.6 million realized loss on settled gold hedges, of which $37.7 million was recognized as unrealized losses in previous periods. The Company also recorded a $13.1 million unrealized gain during the period on its remaining hedged gold ounces. The unrealized gain was driven by a decrease in gold prices during 2026.
Refer to "Liquidity and Capital Resources" in this MD&A for details regarding the Company's remaining gold hedging program.
Production Costs
During the six months ended June 30, 2026, the Company incurred production costs of $100.2 million, compared to $81.5 million in the comparative period of 2025. Production costs were higher due to more gold ounces sold in 2026.
Depreciation and Depletion
Depreciation and depletion expense during the six months ended June 30, 2026 and 2025 were comparable.
Royalties
Royalties expense was higher during the six months ended June 30, 2026 due to higher recorded revenues and the aforementioned amendments to royalty rates.
G&A Expenses
G&A expenses during the six months ended June 30, 2026 were $2.8 million lower than the comparative period in 2025 due to a $2.9 million decrease in share-based compensation expense resulting from a decrease in the fair value of cash‐settled long‐term incentive plan awards linked to the price of the Company's common shares.
Finance expense
The following table summarizes the significant components of finance expense for the six months ended June 30, 2026 and 2025:
| Six months ended June 30, | ||||||
| 2026 | 2025 | |||||
| (in thousands of US dollars ) | $ | $ | ||||
| Interest on lease liabilities | (3,375 | ) | (3,281 | ) | ||
| Accretion expense on asset retirement provisions | (1,628 | ) | (1,410 | ) | ||
| Accretion expense on deferred consideration | (856 | ) | (1,527 | ) | ||
| Change in fair value of contingent consideration | (3,213 | ) | (2,224 | ) | ||
| Mark-to-market adjustment on marketable securities | (1,101 | ) | - | |||
| RCF standby fee and other costs | (906 | ) | - | |||
| Other | (562 | ) | (182 | ) | ||
| Total finance expense | (11,641 | ) | (8,624 | ) | ||
Finance expense was higher in 2026 due to the change in fair value of the Nkran royalty resulting from higher forecast gold prices that impact the amount of estimated future royalty payments. Additionally, the Company recorded a $1.1 million unrealized mark-to-market loss on its marketable securities in 2026. The Company also incurred $0.9 million in standby fees and amortization of other costs in 2026 related to the revolving credit facility.
| GALIANO GOLD INC. Management's Discussion and Analysis For the three and six months ended June 30, 2026 and 2025 |
Foreign Exchange (Loss) Gain
The majority of the foreign exchange loss was unrealized and related to the revaluation of VAT receivables in Ghana that are denominated in Cedis. The value of the Cedi depreciated against the US dollar during the six months ended June 30, 2026, resulting in an unrealized revaluation loss on VAT receivables. The foreign exchange gain in the prior period was impacted by a 44% strengthening of the Cedi against the US dollar.
Current Income Tax Expense
During the six months ended June 30, 2026, the Company recorded CIT expense of $35.0 million. In 2025, the Company's Ghanaian operating subsidiary had tax losses carried forward from prior years, which were utilized to offset taxes payable, in the comparable period.
FINANCIAL CONDITION
| June 30, | December 31, | ||||||||
| 2026 | 2025 | ||||||||
| (in thousands of US dollars) | $ | $ | |||||||
| Cash and cash equivalents | 80,025 | 108,327 | Cash and cash equivalents decreased resulting from working capital tie-up, namely in VAT receivables, which was partly offset by positive operating cash flow and supported by high gold prices. During Q2 2026, $25.9 million was reclassified to restricted cash related to an ongoing legal case. | ||||||
| Restricted cash | 25,922 | - | Refer to section "Liquidity and Capital Resources" under the heading "Contingencies and Restricted Cash" for a discussion on the nature of restricted cash. |
||||||
| Other current assets | 137,666 | 93,856 | Other current assets increased primarily due to a buildup of ore stockpiles and higher VAT receivables . | ||||||
| Non-current assets | 475,883 | 396,868 | Non-current assets increased due to capitalized stripping costs at the Abore, Esaase and Nkran deposits, and the recognition of $44.0 million in right-of-use assets related to mining and ore haulage contracts . | ||||||
| Total assets | 719,496 | 599,051 | |||||||
| Current liabilities | 198,628 | 220,580 | Current liabilities decreased due to a reduction in the fair value of gold hedge derivative liabilities . | ||||||
| Non-current liabilities | 189,577 | 156,813 | Non-current liabilities increased due to the recognition of new lease liabilities, partly offset by the remaining gold hedge derivative liabilities now being classified within current liabilities . | ||||||
| Total liabilities | 388,205 | 377,393 | |||||||
| Common shareholders' equity | 317,299 | 218,856 | Shareholders' equity increased as the Company reported net earnings for the six months ended June 30, 2026. | ||||||
| Non-controlling interest | 13,992 | 2,802 | |||||||
| Total liabilities and equity | 719,496 | 599,051 |
| GALIANO GOLD INC. Management's Discussion and Analysis For the three and six months ended June 30, 2026 and 2025 |
LIQUIDITY AND CAPITAL RESOURCES
A key financial objective of the Company is actively managing its cash balance and liquidity to achieve positive operating cash flows that internally fund operating, capital and project development requirements, and generate shareholder returns. Material changes in the Company's liquidity and capital resources will be substantially determined by the success or failure of the Company's operations, exploration, and development programs, the ability to obtain equity or other sources of financing, and the price of gold.
On December 19, 2025, the Company entered into the $75.0 million revolving credit facility ("RCF") with Rand Merchant Bank ("RMB"). The purpose of the RCF is for general working capital requirements. The RCF has a 4-year term and floating interest rate based on the Secured Overnight Financing Rate (SOFR) plus a margin of 3.95% to 4.20% per annum, while the undrawn portion of the RCF is subject to a standby fee of 1.38% to 1.47% per annum. As of June 30, 2026, the Company had not drawn on the RCF and was in full compliance with all covenants.
The Company's cash and cash equivalents of $80.0 million as of June 30, 2026, together with available funds under the RCF and projected cash flows from operations over the next 12 months at current spot gold prices, are expected to be sufficient to meet the Company's financial, operating, capital commitments and contractual obligations requiring settlement within the next 12 months, including the $30.0 million deferred consideration payment due on December 31, 2026. However, the Company's cash flows and its ability to meet working capital requirements and contractual obligations is significantly influenced by the price of gold. Volatility in the gold price contributes to risk that cash flow from operations and other sources of liquidity will be insufficient to meet the Company's financial obligations as they become due and fund the Company's ongoing development and exploration projects. The Company aims to manage its liquidity by ensuring that it can manage spending and provide adequate cash flow to meet all commitments as they fall due.
Working Capital
As at June 30, 2026, the Company had net working capital of $52.0 million (December 31, 2025 - working capital deficiency of $11.4 million). The increase in net working capital since December 31, 2025 was primarily due to a decrease in the fair value of the Company's gold hedge derivative liabilities, a build-up of ore stockpiles, and higher VAT receivables.
| June 30, 2026 | December 31, 2025 | |||||
| (in thousands of US dollars) | $ | $ | ||||
| Cash and cash equivalents | 80,025 | 108,327 | ||||
| Restricted cash | 25,922 | - | ||||
| Accounts receivable | 279 | 71 | ||||
| Inventories | 96,833 | 70,802 | ||||
| Value added tax receivables | 28,810 | 10,808 | ||||
| Prepaid expenses and other | 11,744 | 12,175 | ||||
| Accounts payable and accrued liabilities | (90,338 | ) | (87,053 | ) | ||
| Income taxes payable | (16,449 | ) | (4,167 | ) | ||
| Financial liabilities | (37,464 | ) | (77,317 | ) | ||
| Lease liabilities - current | (18,284 | ) | (16,806 | ) | ||
| Deferred consideration | (29,098 | ) | (28,242 | ) | ||
| Total net working capital (deficiency) | 51,980 | (11,402 | ) |
| GALIANO GOLD INC. Management's Discussion and Analysis For the three and six months ended June 30, 2026 and 2025 |
Cash Flows
The following table provides a summary of the Company's cash flows for the three and six months ended June 30, 2026 and 2025:
| Three months ended June 30, | Six months ended June 30, | |||||||||||
| 2026 | 2025 | 2026 | 2025 | |||||||||
| (in thousands of US dollars) | $ | $ | $ | $ | ||||||||
| Cash provided by (used in): | ||||||||||||
| Operating activities | 6,004 | 35,814 | 52,693 | 61,706 | ||||||||
| Investing activities | (36,514 | ) | (25,052 | ) | (71,573 | ) | (46,665 | ) | ||||
| Financing activities | (4,171 | ) | (4,499 | ) | (9,017 | ) | (7,865 | ) | ||||
| Impact of foreign exchange on cash and cash equivalents | (230 | ) | 2,037 | (405 | ) | 1,730 | ||||||
| (Decreased) increase in cash and cash equivalents | (34,911 | ) | 8,300 | (28,302 | ) | 8,906 | ||||||
| Cash and cash equivalents, beginning of period | 114,936 | 106,381 | 108,327 | 105,775 | ||||||||
| Cash and cash equivalents, end of period | 80,025 | 114,681 | 80,025 | 114,681 | ||||||||
Cash Flows From Operating Activities
The $29.8 million decrease in operating cash flows during Q2 2026, relative to the comparative period, was impacted by $25.9 million of the Company's cash and cash equivalents being presented as restricted cash as of June 30, 2026 (refer to discussion under the heading "Contingencies and Restricted Cash" below). Notwithstanding this accounting presentation, operating cash flows were $3.9 million lower in Q2 2026 compared to Q2 2025 and were driven by higher production costs, royalties and working capital tie-up. These factors were partly offset by higher revenues resulting from higher average gold sales prices and more gold ounces sold.
Notwithstanding the impact of the aforementioned restricted cash, the $16.9 million increase in operating cash flows during the six months ended June 30, 2026, relative to the comparative period in 2025, was driven by higher average gold sales prices and more gold ounces sold.
Cash Flows Used in Investing Activities
During Q2 2026, the Company invested $37.0 million in additions to mineral properties, plant and equipment ("MPP&E") (Q2 2025 - $26.0 million). Total cash expenditures on MPP&E during the current quarter included $22.1 million of development pre-stripping costs at Nkran Cut 3, $5.3 million of sustaining waste stripping costs at the Abore and Esaase deposits, capitalized infill drilling at Abore and Esaase and costs related to a tailings facility expansion. The increase in capital expenditure during Q2 2026 was largely due to higher volumes mined at Nkran Cut 3.
During the six months ended June 30, 2026, the Company invested $72.6 million in additions to MPP&E (six months ended June 30, 2025 - $48.1 million). The increase in capital expenditure during 2026 was driven by Nkran Cut 3 pre-stripping, capitalized exploration costs to support Mineral Resource and Mineral Reserve growth and a tailings facility expansion.
Cash Flows Used in Financing Activities
Cash flows used in financing activities primarily related to capitalized lease payments on the Company's mining and other service contracts and standby fees on the RCF. The increase in cash flows used in financing activities during the six months ended June 30, 2026 was due to additional lease agreements entered into in the second half of 2025. The Company also received $1.5 million from the exercise of stock options in 2026.
| GALIANO GOLD INC. Management's Discussion and Analysis For the three and six months ended June 30, 2026 and 2025 |
Commitments and Contractual Obligations
The following table summarizes the Company's commitments and contractual obligations as at June 30, 2026 and December 31, 2025.
| Less than | 1-3 | 4-5 | After | June 30, | December 31, | |||||||||||||
| (in thousands of US dollars) | 1 year | years | years | 5 years | 2026 | 2025 | ||||||||||||
| Accounts payable and accrued liabilities | 80,820 | - | - | - | 80,820 | 73,473 | ||||||||||||
| Gold hedges | 37,464 | - | - | - | 37,464 | 88,311 | ||||||||||||
| Long-term incentive plan (cash-settled awards) | 9,518 | - | - | - | 9,518 | 14,066 | ||||||||||||
| Mining and other services contracts | 27,709 | 46,772 | 22,915 | - | 97,396 | 63,901 | ||||||||||||
| Asset retirement provisions (undiscounted) | - | 3,299 | 367 | 80,506 | 84,172 | 81,553 | ||||||||||||
| Deferred and contingent consideration (undiscounted) | 30,000 | 30,938 | 10,672 | 4,818 | 76,428 | 73,004 | ||||||||||||
| Corporate office lease | 113 | 233 | 140 | - | 486 | 561 | ||||||||||||
| Total commitments | 185,624 | 81,242 | 34,094 | 85,324 | 386,284 | 394,869 |
The gold hedges commitment represents the mark-to-market fair value of the Company's current gold hedging program (see "Gold Price Hedging" below) based upon a spot price of approximately $4,025/oz as of June 30, 2026. The settlement amount of these hedges will depend on the price of gold at the settlement date.
Long-term incentive plan commitments due within one year include cash-settled deferred share unit ("DSU") awards granted prior to 2025 amounting to $9.0 million. These commitments are current liabilities because the timing of payments could be accelerated if a director retires, or in the event of a change of control. DSU awards granted from 2025 onwards will be settled by the issuance of the Company's common shares.
The Company has a number of mining and other service contracts. These contracts include monthly fixed fees as well as variable cost measures. The contractual obligations disclosed in the above table relate only to the fixed fees payable to the contractors. The variable cost measures of these contracts are dependent on volumes, such as bank cubic meters mined or ore tonnes transported. The expense relating to these variable payments and recognized as an operating expense was $37.3 million and $74.8 million, respectively, for the three and six months ended June 30, 2026 (three and six months ended June 30, 2025 - $30.2 million and $55.4 million, respectively). The mining services contracts include termination clauses, which allow the Company to terminate the agreements provided a termination fee is paid to the contractor.
The timing of contingent payments, totaling $46.4 million, is management's best estimate of when payments would be required to be made based upon the AGM's current life of mine plan.
Contingencies and Restricted Cash
In 2019, a former services provider of the AGM filed a dispute with an arbitration tribunal alleging the AGM breached the terms of a services agreement and claimed approximately $25.0 million in damages. The arbitrator ruled in favour of the AGM that there had not been a breach of any terms of the contract, yet made an award to the counterparty of approximately $13.0 million plus interest for services rendered. The Company, consistent with the arbitration ruling, maintains the view that there was no breach of contract, and all contractual amounts were paid as due. The Company has sought to appeal the arbitration ruling. On March 26, 2026, the Court of Appeal dismissed the case on a procedural matter and did not consider the substantive merits of the case. The Company will continue to follow the mandated Ghanaian judicial process until the matter is settled.
A provision of $7.0 million has been recorded as at June 30, 2026 as management's best estimate to settle the claim (December 31, 2025 - $7.0 million). While the Company cannot reasonably predict the ultimate outcome of these actions, and inherent uncertainties exist in predicting such outcomes, the Company believes the estimated provision is reasonable based on the information currently available.
| GALIANO GOLD INC. Management's Discussion and Analysis For the three and six months ended June 30, 2026 and 2025 |
On June 22, 2026, the Company's operating subsidiary Asanko Gold Ghana Ltd. ("AGGL") received a garnishee order from a court in Ghana in the amount of $25.9 million, which impacts AGGL's ability to withdraw these funds on demand. The garnishee order was in connection with the aforementioned arbitrator's award plus interest. The Company believes the garnishee order was issued in violation of a subsisting order previously granted by a High Court in Ghana, which prevented the service provider from collecting payment while AGGL's appeal of the arbitrator's original award of $13.0 million worked through the judicial process. Additionally, the Company believes the amount of interest determined in the garnishee order is erroneous. AGGL has taken legal steps to appeal the garnishee order and filed for a stay of execution of the garnishee order. Until such time that the garnishee order is set aside, $25.9 million of AGGL's cash balance cannot be withdrawn on demand and as such has been presented as restricted cash in the Statement of Financial Position.
Due to the nature of its business, the Company may from time to time be subject to regulatory investigations, claims, lawsuits and other proceedings in the ordinary course of its business. While the Company cannot reasonably predict the ultimate outcome of any such actions, and inherent uncertainties exist in predicting such outcomes, the Company believes that the ultimate resolution of these actions is not reasonably likely to have a material adverse effect on the Company's financial condition or future results of operations.
Off-Balance Sheet Arrangements
The Company has no off‐balance sheet arrangements.
Gold Price Hedging
The Company periodically enters into gold hedging arrangements to mitigate gold price risk during periods of planned elevated capital investment. During the three and six months ended June 30, 2026, the Company realized a $20.4 million and $45.6 million loss on its gold hedging arrangements, respectively (three and six months ended June 30, 2025 - realized losses of $10.7 million and $15.6 million, respectively). The Company does not apply hedge accounting to the gold hedges.
The Company's remaining gold hedges are for 30,000 gold ounces of production in 2026 and 7,500 gold ounces in 2027. The gold hedges have a weighted-average put strike of $2,300/oz and a weighted-average call strike of $3,070/oz.
| GALIANO GOLD INC. Management's Discussion and Analysis For the three and six months ended June 30, 2026 and 2025 |
SUMMARY OF QUARTERLY FINANCIAL RESULTS
The following table provides a summary of unaudited financial data for the last eight quarters. Except for basic and diluted income (loss) per share, the totals in the following table are presented in thousands of US dollars.
| Q2 2026 | Q1 2026 | Q4 2025 | Q3 2025 | Q2 2025 | Q1 2025 | Q4 2024 | Q3 2024 | |||||||||||||||||
| Gross revenue | 156,568 | 166,524 | 159,676 | 114,197 | 97,304 | 76,590 | 64,551 | 71,130 | ||||||||||||||||
| Income (loss) from mine operations | 92,798 | 72,453 | 51,139 | 9,977 | 24,653 | (19,756 | ) | 26,114 | 7,730 | |||||||||||||||
| Income (loss) from operations | 90,368 | 66,256 | 43,915 | 176 | 19,118 | (26,327 | ) | 7,401 | 4,190 | |||||||||||||||
| Net income (loss) for the period | 68,898 | 36,860 | 19,057 | (42,020 | ) | 21,554 | (29,392 | ) | 3,369 | 1,100 | ||||||||||||||
| Basic net income (loss) per share | $ | 0.24 | $ | 0.13 | $ | 0.06 | $ | (0.15 | ) | $ | 0.07 | $ | (0.10 | ) | $ | 0.00 | $ | 0.00 | ||||||
| Diluted net income (loss) per share | $ | 0.23 | $ | 0.12 | $ | 0.06 | $ | (0.15 | ) | $ | 0.07 | $ | (0.10 | ) | $ | 0.00 | $ | 0.00 | ||||||
| Adjusted net income (loss) attributable to common shareholders (1) | 23,086 | 29,515 | 39,959 | (2,770 | ) | 20,952 | 388 | 4,646 | 17,743 | |||||||||||||||
| Adjusted basic net income (loss) per share(1) | $ | 0.09 | $ | 0.11 | $ | 0.15 | $ | (0.01 | ) | $ | 0.08 | $ | 0.00 | $ | 0.02 | $ | 0.07 | |||||||
| Cash provided by operating activities | 6,004 | 46,689 | 55,839 | 40,449 | 35,814 | 25,892 | 13,806 | 24,449 | ||||||||||||||||
| EBITDA(1) | 105,625 | 77,780 | 67,635 | 50,412 | 37,681 | (11,716 | ) | 16,424 | 30,787 |
(1) Non-IFRS measure. Refer to section "Non-IFRS Measures" of this MD&A.
The decrease in EBITDA1 in Q4 2024 was due to the Company terminating a gold sales offtake agreement and paying a $13.1 million termination fee.
The net loss in Q1 2025 was primarily attributable to a $30.2 million unrealized loss and a $4.9 million realized loss on gold hedge derivatives.
The net loss in Q3 2025 was due to a $25.1 million unrealized loss and a $13.1 million realized loss on gold hedge derivatives. The Company also recorded CIT and deferred income tax expenses of $21.8 million and $14.7 million, respectively.
From Q2 2025 to Q2 2026, improved mining and production rates at the AGM, coupled with higher average gold sales prices, led to strong revenue, income from operations, net earnings and operating cash flow. The reduction in operating cash flow from Q1 2026 to Q2 2026 was impacted by the Company presenting $25.9 million of its cash and cash equivalents as restricted cash as of June 30, 2026.
NON-IFRS MEASURES
The Company has included certain non-IFRS performance measures throughout this MD&A. These performance measures are employed by management to assess the Company's operating and financial performance and to assist in business decision-making. The Company believes that, in addition to conventional measures prepared in accordance with IFRS, certain investors and other stakeholders use this information to evaluate the Company's operating and financial performance; however, as explained elsewhere herein, these non-IFRS performance measures do not have any standardized meaning and therefore may not be comparable to similar measures presented by other issuers. Accordingly, these performance measures are intended to provide additional information and should not be considered in isolation or as a substitute for measures of performance prepared in accordance with IFRS.
| GALIANO GOLD INC. Management's Discussion and Analysis For the three and six months ended June 30, 2026 and 2025 |
Total Cash Costs per Gold Ounce Sold
The Company has included the non-IFRS performance measure of total cash costs per gold ounce sold throughout this MD&A. The Company follows the recommendations of the Gold Institute Production Cost Standard (the "Gold Institute"). The Gold Institute, which ceased operations in 2002, was a non-regulatory body and represented a global group of suppliers of gold and gold products. The production cost standard developed by the Gold Institute remains the generally accepted standard of reporting cash costs of production by many gold mining companies. Total cash costs are calculated by taking production costs related to gold production, removing costs allocated to by-products and then adding royalties. Management uses total cash costs per gold ounce sold to monitor the operating performance of the AGM. The Company believes that, in addition to conventional measures prepared in accordance with IFRS, some investors use this information to evaluate the Company's performance and ability to generate cash flow.
The following table provides a reconciliation of the AGM's total cash costs per gold ounce sold to production costs of the Company (the nearest IFRS measure) as presented in the unaudited condensed consolidated interim financial statements of the Company for the three and six months ended June 30, 2026 and 2025.
| Three months ended June 30, | Six months ended June 30, | |||||||||||
| 2026 | 2025 | 2026 | 2025 | |||||||||
| (in thousands of US dollars, except per ounce amounts) | $ | $ | $ | $ | ||||||||
| Production costs | 54,996 | 39,303 | 100,246 | 81,545 | ||||||||
| Costs allocated to by-products | (354 | ) | (169 | ) | (845 | ) | (296 | ) | ||||
| Royalties | 20,348 | 7,785 | 34,893 | 12,380 | ||||||||
| Total cash costs | 74,990 | 46,919 | 134,294 | 93,629 | ||||||||
| Gold ounces sold | 35,247 | 29,287 | 69,428 | 56,281 | ||||||||
| Total cash costs per gold ounce sold ($/oz) | 2,128 | 1,602 | 1,934 | 1,664 | ||||||||
AISC per Gold Ounce Sold
The Company has adopted the reporting of "AISC per gold ounce sold", which is a non-IFRS performance measure. The Company believes that the AISC per gold ounce measure provides additional insight into the costs of producing gold by capturing all of the expenditures required for the discovery, development and sustaining of gold production and allows the Company to assess its ability to support capital expenditures to sustain future production from the generation of operating cash flows. The Company believes that, in addition to conventional measures prepared in accordance with IFRS, some investors use this information to evaluate the AGM's performance and ability to generate cash flow.
AISC adjusts total cash costs for mine site G&A expenses, reclamation cost accretion, sustaining capitalized stripping costs, sustaining capital expenditures and sustaining lease payments on the AGM's mining and service lease agreements. Sustaining capital expenditures, capitalized stripping costs, reclamation cost accretion and lease payments are not line items on the Company's financial statements. Sustaining capital expenditures are defined as those capital expenditures which do not materially benefit annual or life of mine gold ounce production at a mine site. A material benefit to a mine site is considered to be at least a 10% increase in annual or life of mine production, net present value, or mineral reserves compared to the remaining life of mine of the operation. As such, sustaining costs exclude all expenditures at the AGM's new projects and certain expenditures at the AGM's operating sites which are deemed expansionary in nature. Capitalized stripping costs represent costs incurred at steady-state operations during the period; these costs are generally not considered expansionary in nature as the stripping phase is expected to take less than 12 months and resulting ore production is of a short-term duration. Reclamation cost accretion represents the growth in the AGM's reclamation provision due to the passage of time. This amount does not reflect cash outflows, but it is considered to be representative of the periodic costs of reclamation and remediation. Lease payments on mining and service lease agreements represent cash outflows. Reclamation cost accretion is presented in finance expense in the Company's financial results.
| GALIANO GOLD INC. Management's Discussion and Analysis For the three and six months ended June 30, 2026 and 2025 |
The following table provides a reconciliation of AISC for the AGM to production costs and various operating expenses of the Company (the nearest IFRS measures) as presented in the unaudited condensed consolidated interim financial statements of the Company for the three and six months ended June 30, 2026 and 2025.
| Three months ended June 30, | Six months ended June 30, | |||||||||||
| 2026 | 2025 | 2026 | 2025 | |||||||||
| (in thousands of US dollars, except per ounce amounts) | $ | $ | $ | $ | ||||||||
| Total cash costs (as reconciled above) | 74,990 | 46,919 | 134,294 | 93,629 | ||||||||
| G&A expenses of the AGM (see table below) | 847 | 826 | 1,693 | 1,541 | ||||||||
| Sustaining capital expenditures and capitalized | 7,274 | 12,741 | 21,687 | 26,990 | ||||||||
| stripping costs (see table below) | ||||||||||||
| Reclamation accretion expense | 830 | 723 | 1,628 | 1,410 | ||||||||
| Sustaining lease payments(1) | 3,223 | 4,709 | 8,561 | 8,094 | ||||||||
| All-in sustaining costs | 87,164 | 65,918 | 167,863 | 131,664 | ||||||||
| Gold ounces sold | 35,247 | 29,287 | 69,428 | 56,281 | ||||||||
| All-in sustaining costs per gold ounce sold ($/oz) | 2,473 | 2,251 | 2,418 | 2,339 | ||||||||
(1) Sustaining lease payments for the three and six months ended June 30, 2026 were $3,873 and $9,862, respectively, per the Company's consolidated interim financial statements, which included $28 and $57 of lease payments for corporate office space, respectively, and $622 and $1,244 of non-sustaining lease payments on a mining services contract, respectively.
The following table reconciles G&A expenses of the AGM to the Company's G&A expenses (the nearest IFRS measure) as presented in the Statements of Operations of the Company's unaudited condensed consolidated interim financial statements for the three and six months ended June 30, 2026 and 2025.
| Three months ended June 30, | Six months ended June 30, | |||||||||||
| 2026 | 2025 | 2026 | 2025 | |||||||||
| (in thousands of US dollars) | $ | $ | $ | $ | ||||||||
| Consolidated G&A expenses | 1,539 | 4,625 | 6,542 | 9,343 | ||||||||
| Less: | ||||||||||||
| Corporate G&A expenses | (692 | ) | (3,799 | ) | (4,849 | ) | (7,802 | ) | ||||
| G&A expenses of the AGM | 847 | 826 | 1,693 | 1,541 | ||||||||
| GALIANO GOLD INC. Management's Discussion and Analysis For the three and six months ended June 30, 2026 and 2025 |
The following table reconciles sustaining capital expenditures and sustaining capitalized stripping costs to the Company's total MPP&E additions (the nearest IFRS measure) as presented in note 7 of the Company's unaudited condensed consolidated interim financial statements for the three and six months ended June 30, 2026 and 2025.
| Three months ended June 30, | Six months ended June 30, | |||||||||||
| 2026 | 2025 | 2026 | 2025 | |||||||||
| (in thousands of US dollars) | $ | $ | $ | $ | ||||||||
| Additions to MPP&E (note 7 of financial statements) | 84,100 | 30,474 | 115,367 | 62,716 | ||||||||
| Add (less): | ||||||||||||
| Non-sustaining capital expenditures | (29,702 | ) | (13,217 | ) | (50,893 | ) | (21,065 | ) | ||||
| Capital expenditures - corporate | - | (15 | ) | (5 | ) | (21 | ) | |||||
| Non-cash additions related to leases | (43,991 | ) | - | (43,991 | ) | (11,157 | ) | |||||
| Change in accounts payable related to capitalized stripping costs | (3,133 | ) | (4,501 | ) | 1,209 | (3,483 | ) | |||||
| Sustaining capital expenditures | 7,274 | 12,741 | 21,687 | 26,990 | ||||||||
EBITDA and Adjusted EBITDA
EBITDA is a non-IFRS measure and provides an indication of the Company's continuing capacity to generate income from operations before considering the Company's financing decisions and costs of amortizing capital assets. Accordingly, EBITDA comprises net income (loss) excluding finance expense, finance income, depreciation and depletion expense and income taxes. Adjusted EBITDA, also a non-IFRS measure, adjusts EBITDA to exclude non-recurring items and non-cash items ("Adjusted EBITDA").
The following table provides a reconciliation of the Company's EBITDA and Adjusted EBITDA to net income (loss) of the Company (the nearest IFRS measure) as presented in the Company's unaudited condensed consolidated interim financial statements for the three and six months ended June 30, 2026 and 2025.
| Three months ended June 30, | Six months ended June 30, | |||||||||||
| 2026 | 2025 | 2026 | 2025 | |||||||||
| (in thousands of US dollars ) | $ | $ | $ | $ | ||||||||
| Net income (loss) | 68,898 | 21,554 | 105,758 | (7,838 | ) | |||||||
| Add back (deduct): | ||||||||||||
| Depreciation and depletion expense | 15,635 | 13,083 | 28,047 | 27,508 | ||||||||
| Finance income | (659 | ) | (1,924 | ) | (1,303 | ) | (3,050 | ) | ||||
| Finance expense | 5,918 | 4,629 | 11,641 | 8,624 | ||||||||
| Current income tax expense | 11,336 | 339 | 35,044 | 721 | ||||||||
| Deferred income tax expense | 4,497 | - | 4,218 | - | ||||||||
| EBITDA | 105,625 | 37,681 | 183,405 | 25,965 | ||||||||
| Add back (deduct): | ||||||||||||
| Unrealized (gain) loss on gold hedge derivatives | (27,965 | ) | 3,852 | (13,132 | ) | 35,173 | ||||||
| Non-cash long-term incentive plan compensation | 831 | 701 | 2,115 | 1,608 | ||||||||
| Adjusted EBITDA | 78,491 | 42,234 | 172,388 | 62,746 | ||||||||
| GALIANO GOLD INC. Management's Discussion and Analysis For the three and six months ended June 30, 2026 and 2025 |
Adjusted Net Income (Loss)
The Company has included the non-IFRS performance measures of adjusted net income (loss) and adjusted net income (loss) per share throughout this MD&A. Neither adjusted net income (loss) nor adjusted net income (loss) per share have any standardized meaning and are therefore unlikely to be comparable to other measures presented by other issuers. Adjusted net income (loss) excludes certain non-cash items, and items of income or expense not expected to recur in the future, from net income (loss) to provide a measure which helps the Company and investors to evaluate the results of the underlying core operations of the Company and its ability to generate cash flows. The Company believes that the presentation of adjusted net income (loss) is appropriate to provide additional information to investors regarding items that management does not expect to continue at the same level in the future or that management does not believe to reflect the Company's ongoing operating performance or operating performance of the current period. The Company further believes that its presentation of this non-IFRS financial measure provides information that is useful to investors because it is an important indicator of the strength of operations and the performance of the Company's core business.
The following table provides a reconciliation of adjusted net income (loss) to net income (loss) of the Company (the nearest IFRS measure) as presented in the Company's unaudited condensed consolidated interim financial statements for the three and six months ended June 30, 2026 and 2025.
| Three months ended June 30, | Six months ended June 30, | |||||||||||
| 2026 | 2025 | 2026 | 2025 | |||||||||
| (in thousands of US dollars, except per s hare amounts ) | $ | $ | $ | $ | ||||||||
| Net income (loss) attributable to common shareholders | 61,877 | 19,326 | 94,568 | (7,480 | ) | |||||||
| Settlement of gold hedges with losses recognized in prior periods (1) | (17,669 | ) | (1,841 | ) | (33,944 | ) | (2,835 | ) | ||||
| Unrealized (gain) loss on gold hedge derivatives (1) | (25,169 | ) | 3,467 | (11,819 | ) | 31,656 | ||||||
| Deferred income tax expense(1) | 4,047 | - | 3,796 | - | ||||||||
| Adjusted net income | 23,086 | 20,952 | 52,601 | 21,341 | ||||||||
| Basic weighted average common shares outstanding | 261,300,578 | 257,734,700 | 260,791,920 | 257,454,965 | ||||||||
| Diluted weighted average common shares outstanding | 269,783,870 | 264,423,547 | 269,698,377 | 257,454,965 | ||||||||
| Adjusted net income per share - basic | $0.09 | $0.08 | $0.20 | $0.08 | ||||||||
| Adjusted net income per share - diluted | $0.09 | $0.08 | $0.20 | $0.08 | ||||||||
(1) Reflects the Company's 90% interest in the AGM.
OUTSTANDING SHARE DATA
As of the date of this MD&A, there were 261,591,764 common shares of the Company issued and outstanding and 9,166,841 stock options outstanding (each exercisable to purchase one common share at exercise prices ranging between C$0.66 and C$4.16 per share). Additionally, there were 3,083,307 long-term incentive plan (“LTIP”) awards, comprising restricted share units, performance share units and DSUs, that will be settled in equity. The maximum number of common shares issuable upon conversion of these LTIP awards is 3,782,807 common shares. The fully diluted outstanding share count at the date of this MD&A is 274,541,412.
| GALIANO GOLD INC. Management's Discussion and Analysis For the three and six months ended June 30, 2026 and 2025 |
RELATED PARTY TRANSACTIONS
As at June 30, 2026, the Company's related parties are its subsidiaries and key management personnel, defined as directors and executive officers of the Company. During the normal course of operations, the Company enters into transactions with its related parties. During the three and six months ended June 30, 2026, all related party transactions were in the normal course of business, including compensation payments to key management personnel.
CRITICAL ACCOUNTING POLICIES AND ESTIMATES
Estimates and Judgements
The preparation of financial statements in conformity with IFRS requires management to make estimates and assumptions that affect amounts reported in the financial statements and accompanying notes. Management believes the estimates and assumptions used in preparing the unaudited condensed consolidated interim financial statements for the three and six months ended June 30, 2026 and 2025 are reasonable; however, actual results could differ from those estimates and assumptions and could impact future results of operations and cash flows. The Company's significant accounting judgements and estimates are presented in note 5 of the Company's audited consolidated annual financial statements for the years ended December 31, 2025 and 2024.
Changes in Accounting Policies Including Initial Adoption
Accounting standards adopted during the period
IFRS 7 and 9
In May 2024, the IASB issued amendments to the classification and measurement of financial instruments (IFRS 7 and IFRS 9), which included clarification that a financial liability is derecognized on the 'settlement date'; an accounting policy option to derecognize financial liabilities that are settled through an electronic payment system before settlement date if certain conditions are met; clarification on how to assess the contractual cash flow characteristics of financial assets that include environmental, social and governance‐linked features; and requires additional disclosures under IFRS 7 for financial assets and liabilities with contractual terms that reference a contingent event. The amendments to IFRS 7 and IFRS 9 are effective for annual reporting periods beginning on or after January 1, 2026. The amendments to IFRS 7 and IFRS 9 had no material impact on the Company's consolidated financial statements.
Accounting standards and amendments issued but not yet adopted
The following standards and interpretations, which may be applicable to the Company, have been issued but are not yet effective as of June 30, 2026:
IFRS 18
On April 9, 2024, the IASB issued IFRS 18, Presentation and Disclosure in Financial Statements, a new standard on presentation and disclosure in financial statements with a focus on updates to the statement of profit or loss. The key new concepts introduced in IFRS 18 relate to: the structure of the statement of profit or loss; required disclosures in the financial statements for certain profit or loss performance measures that are reported outside an entity's financial statements; and enhanced principles on aggregation and disaggregation which apply to the primary financial statements and notes in general. IFRS 18 will not impact the recognition or measurement of items in the financial statements, but may change what an entity reports as its 'operating profit or loss'. IFRS 18 will apply for reporting periods beginning on or after January 1, 2027 and also applies to comparative information. The Company is currently evaluating how the detailed implications of applying IFRS 18 will impact the disclosures in its consolidated financial statements in future periods. Preliminarily, the Company has identified the following potential impacts, which are not exhaustive, of applying IFRS 18 on its consolidated financial statements:
| GALIANO GOLD INC. Management's Discussion and Analysis For the three and six months ended June 30, 2026 and 2025 |
– Items of income or expense may be grouped differently resulting in new subtotals or line items in the Statement of Operations and Comprehensive Income (Loss).
– There will be new disclosures for management-defined performance measures ("MPM"). An MPM has been defined as a subtotal of income and expenses that is used in communications outside of the financial statements to highlight a particular aspect of overall financial performance. Based on an initial review of the Company's communications outside of the financial statements, the following financial performance measures, which are not exhaustive, may meet the definition of an MPM: adjusted net income (loss); EBITDA; and Adjusted EBITDA.
RISKS AND UNCERTAINTIES
Financial Instruments and Risk
The Company's business, operations and future prospects are subject to significant risks. For details of these risks, refer to the risk factors set forth in the Company's most recently filed AIF for the year ended December 31, 2025, which can be found under the Company's SEDAR+ profile at www.sedarplus.ca, and the Company's most recently filed Form 40-F Annual Report for the year ended December 31, 2025, which can be found on EDGAR at www.sec.gov.
Additional risks and uncertainties not presently known to the Company or that the Company currently considers immaterial may also impair the business, operations, prospects and price of the Company's common shares. If any of the risks actually occur, the business of the Company may be harmed, and its financial condition and results of operations may suffer significantly.
Financial Instruments
As at June 30, 2026, the Company's financial instruments consist of cash and cash equivalents, restricted cash, accounts receivable, marketable securities, accounts payable and accrued liabilities, lease liabilities, financial liabilities (gold hedge derivatives), long-term incentive plan liabilities, deferred and contingent consideration payable and the 1% net smelter return royalty on production from the Nkran deposit (the "Nkran Royalty") payable. The Company classifies cash and cash equivalents, restricted cash and accounts receivables as financial assets measured at amortized cost, while accounts payable and accrued liabilities, lease liabilities and deferred consideration are classified as other financial liabilities and measured at amortized cost. Marketable securities, long-term incentive plan liabilities, contingent consideration and the Nkran Royalty are financial assets and financial liabilities, respectively, measured at fair value through profit or loss. Marketable securities fall within Level 1 of the fair value hierarchy, while the aforementioned financial liabilities all fall within Level 3. The gold hedge derivative liabilities are also recorded at fair value at the reporting date and fall within Level 1 of the fair value hierarchy. Refer to note 11 of the Company's unaudited condensed consolidated interim financial statements for the three and six months ended June 30, 2026 and 2025 for discussion on the significant assumptions made in determining the fair value of the contingent consideration and Nkran Royalty.
The credit risk, liquidity risk and market risk associated with the Company's financial instruments are disclosed in note 25(d) of the Company's unaudited condensed consolidated interim financial statements for the three and six months ended June 30, 2026 and 2025.
| GALIANO GOLD INC. Management's Discussion and Analysis For the three and six months ended June 30, 2026 and 2025 |
As at June 30, 2026, the carrying and fair values of the Company's financial instruments by category are as follows (in thousands of US dollars):
| Fair value through | ||||||||||||
| profit or loss | Amortized cost | Carrying value | Fair value | |||||||||
| As at June 30, 2026 | $ | $ | $ | $ | ||||||||
| Financial assets: | ||||||||||||
| Cash and cash equivalents | - | 80,025 | 80,025 | 80,025 | ||||||||
| Restricted cash | - | 25,922 | 25,922 | 25,922 | ||||||||
| Accounts receivable | - | 279 | 279 | 279 | ||||||||
| Marketable securities (1) | 3,457 | - | 3,457 | 3,457 | ||||||||
| Total financial assets | 3,457 | 106,226 | 109,683 | 109,683 | ||||||||
| Financial liabilities: | ||||||||||||
| Accounts payable and accrued liabilities (2) | 9,518 | 80,820 | 90,338 | 90,338 | ||||||||
| Financial liabilities (2) | 37,464 | - | 37,464 | 37,464 | ||||||||
| Lease liabilities | - | 74,579 | 74,579 | 74,579 | ||||||||
| Deferred consideration | - | 29,098 | 29,098 | 29,098 | ||||||||
| Contingent consideration | 29,521 | - | 29,521 | 29,521 | ||||||||
| Total financial liabilities | 76,503 | 184,497 | 261,000 | 261,000 | ||||||||
(1) Marketable securities are presented within prepaid expenses and other in the Statement of Financial Position.
(2) Accounts payable and accrued liabilities and financial liabilities include long-term incentive plan and gold hedge derivative liabilities, which are measured at fair value through profit or loss.
INTERNAL CONTROL
Internal Control over Financial Reporting ("ICFR")
Management, including the Chief Executive Officer ("CEO") and Chief Financial Officer ("CFO"), have evaluated the Company's ICFR to determine whether any changes occurred during the period that have materially affected, or are reasonably likely to materially affect, the Company's ICFR.
During the six months ended June 30, 2026, there have been no changes in ICFR that have materially affected, or are reasonably likely to materially affect, the Company's ICFR.
Limitations of Controls and Procedures
The Company's management, including the CEO and CFO, believes that any disclosure controls and procedures or ICFR, no matter how well conceived and operated, can provide only reasonable, not absolute, assurance that the objectives of the control system are met. Further, the design of a control system must reflect the fact that there are resource constraints, and the benefits of controls must be considered relative to their costs. Because of the inherent limitations in all control systems, they cannot provide absolute assurance that all control issues and instances of fraud, if any, within the Company have been prevented or detected. These inherent limitations include the realities that judgements in decision-making can be faulty, and that breakdowns can occur because of simple error or mistake. Additionally, controls can be circumvented by the individual acts of some persons, by collusion of two or more people, or by unauthorized override of the control. The design of any control system also is based in part upon certain assumptions about the likelihood of future events, and there can be no assurance that any design will succeed in achieving its stated goals under all potential future conditions. Accordingly, because of the inherent limitations in a cost-effective control system, misstatements due to error or fraud may occur and not be detected.
| GALIANO GOLD INC. Management's Discussion and Analysis For the three and six months ended June 30, 2026 and 2025 |
QUALIFIED PERSONS
The exploration information contained in this MD&A has been reviewed and approved by Mr. Chris Pettman, P.Geo, Vice President Exploration of Galiano. For further information regarding the exploration information in this MD&A, including the Quality Control and Quality Assurance and data verification measures taken with respect to such exploration information, refer to the Company's news releases dated January 29, 2026, February 12, 2026 and May 11, 2026, which are filed on the Company's SEDAR+ profile at www.sedarplus.ca.
All other scientific and technical information contained in this MD&A has been reviewed and approved by Ms. Victoria Addison, P.Eng., Director, Mine Planning of Galiano. Mr. Pettman and Ms. Addison are "Qualified Persons" as defined by National Instrument 43-101, Standards of Disclosure for Mineral Projects ("NI 43-101").
CAUTIONARY STATEMENTS
Cautionary Statement on Forward-Looking Information
The Company cautions readers regarding forward-looking statements found in this MD&A and in any other statement made by, or on behalf of the Company. Generally, forward-looking information can be identified by the use of forward-looking terminology such as "plans", "expects", "estimates", "anticipates", or variations of such words and phrases or statements that certain actions, events or results "may", "could", or "might" occur. Forward-looking statements are made based on management's beliefs, estimates and opinions and are given only as of the date of this MD&A. Such statements may constitute "forward-looking information" within the meaning of the United States Private Securities Litigation Reform Act of 1995 and applicable Canadian securities legislation.
Forward-looking statements are statements not based on historical information, and which relate to future operations, strategies, financial results or other developments. Forward-looking statements reflect the Company's current views with respect to expectations, beliefs, assumptions, estimates and forecasts about the business of the Company and the industry and markets in which the Company operates. Forward-looking statements include, but are not limited to, statements with respect to:
| GALIANO GOLD INC. Management's Discussion and Analysis For the three and six months ended June 30, 2026 and 2025 |
Forward-looking statements are not guarantees of future performance and involve risks, uncertainties and assumptions, which are difficult to predict. These uncertainties and contingencies can affect actual results and could cause actual results to differ materially from those expressed in any forward-looking statements made by or on behalf of the Company. The Company's actual future results or performance are subject to certain risks and uncertainties, including but not limited to:
| GALIANO GOLD INC. Management's Discussion and Analysis For the three and six months ended June 30, 2026 and 2025 |
| GALIANO GOLD INC. Management's Discussion and Analysis For the three and six months ended June 30, 2026 and 2025 |
Forward-looking statements are necessarily based upon estimates and assumptions, which are inherently subject to significant business, economic and competitive uncertainties and contingencies, many of which are beyond the Company's control and many of which, regarding future business decisions, are subject to change. Assumptions underlying the Company's expectations regarding forward-looking statements or information contained in this MD&A include, among others:
Although the Company has attempted to identify important factors that could cause actual results or events to differ materially from those described in the forward-looking statements, you are cautioned that this list is not exhaustive and there may be other factors that the Company has not identified. Furthermore, the Company undertakes no obligation to update or revise any forward-looking statements included in, or incorporated by reference in, this MD&A if these beliefs, estimates and opinions or other circumstances should change, except as otherwise required by applicable law.
Historical results of operations and trends that may be inferred from the following discussions and analysis may not necessarily indicate future results from operations. Historically, the Company's operations have been primarily funded from debt and share issuances, as well as the exercise of stock options. The Company has had and may have future capital requirements in excess of its currently available resources. In the event the Company's plans change, its assumptions change or prove inaccurate, or its capital resources in addition to projected cash flow, if any, prove to be insufficient to fund its future operations, the Company may be required to seek additional financing.
Although the Company has to date been able to raise capital, there can be no assurance that the Company will have sufficient financing to meet its future capital requirements or that additional financing will be available on terms acceptable to the Company in the future.
| GALIANO GOLD INC. Management's Discussion and Analysis For the three and six months ended June 30, 2026 and 2025 |
Cautionary Note for United States Investors
All technical disclosure in this MD&A has been prepared in accordance with the requirements of the securities laws in effect in Canada, which differ materially from the requirements of United States securities laws applicable to domestic United States issuers. The terms "mineral reserves", "proven mineral reserves", "probable mineral reserves", "mineral resources", "measured mineral resources", "indicated mineral resources" and "inferred mineral resources" used in this MD&A are in reference to the mining terms defined in the Canadian Institute of Mining, Metallurgy and Petroleum Standards, as adopted by NI 43-101. The Company's disclosure of mineralization and other technical information herein may differ significantly from the information that would be disclosed had the Company prepared the reserve and resource estimates under the standards adopted under the rule of the Securities and Exchange Commission ("SEC") applicable to domestic United States issuers. Accordingly, the disclosure in this MD&A regarding the Company's mineral properties is not comparable to the disclosure of United States issuers subject to the SEC's mining disclosure requirements.