What were the Fund costs for the past year?
(based on a hypothetical $10,000 investment)
|
Fund Name
|
Costs of a $10,000 investment
|
Costs paid as a percentage of a $10,000 investment
|
|---|---|---|
|
Adaptive Alpha Opportunities ETF
|
$140
|
1.24%
|
How did the Fund perform last year and what affected its performance?
For the fiscal year ended May 31, 2026, the Fund returned 26.69%. The Fund underperformed the MSCI ACWI Index and outperformed the Morningstar Moderate Aggressive Target Risk Index, which returned 30.80% and 22.67%, respectively, for the same period.
Factors that Impacted the Fund's Performance
Adaptive Alpha Opportunities ETF remains largely diversified across countries and sectors. There are periods where AGOX uses its’ ‘global-go-anywhere’ classification to take advantage of a focused approach to a sector or group of sectors. During the 1 year period ending on 5/31/2026, AGOX held modest allocations towards tech and semiconductor related positions, as well as Communication Services, Healthcare, and Infrastructure ETFs.
The main detractors from performance include:
• Cloudflare Inc (NET) had a rescaled portfolio weight of 0.55% and detracted (2.60%) during the period.
• Strategy Inc Class A (MSTR) had a rescaled portfolio weight of 0.37% and detracted (1.68%) during the period.
• Coinbase Global Inc (COIN) had a rescaled portfolio weight of 0.39% and detracted (1.22%) during the period.
The main contributors to performance include:
• VanEck Semiconductor ETF (SMH) had a rescaled portfolio weight of 5.43% and contributed 7.79% during the period.
• Invesco QQQ Trust (QQQ) had a rescaled portfolio weight of 7.89% and contributed 4.52% during the period.
• State Street Technology Select Sector SPDR ETF (XLK) had a rescaled portfolio weight of 2.51% and contributed 4.46% during the period.
Cumulative Performance
From June 1, 2025 through May 31, 2026
Initial Investment of $10,000
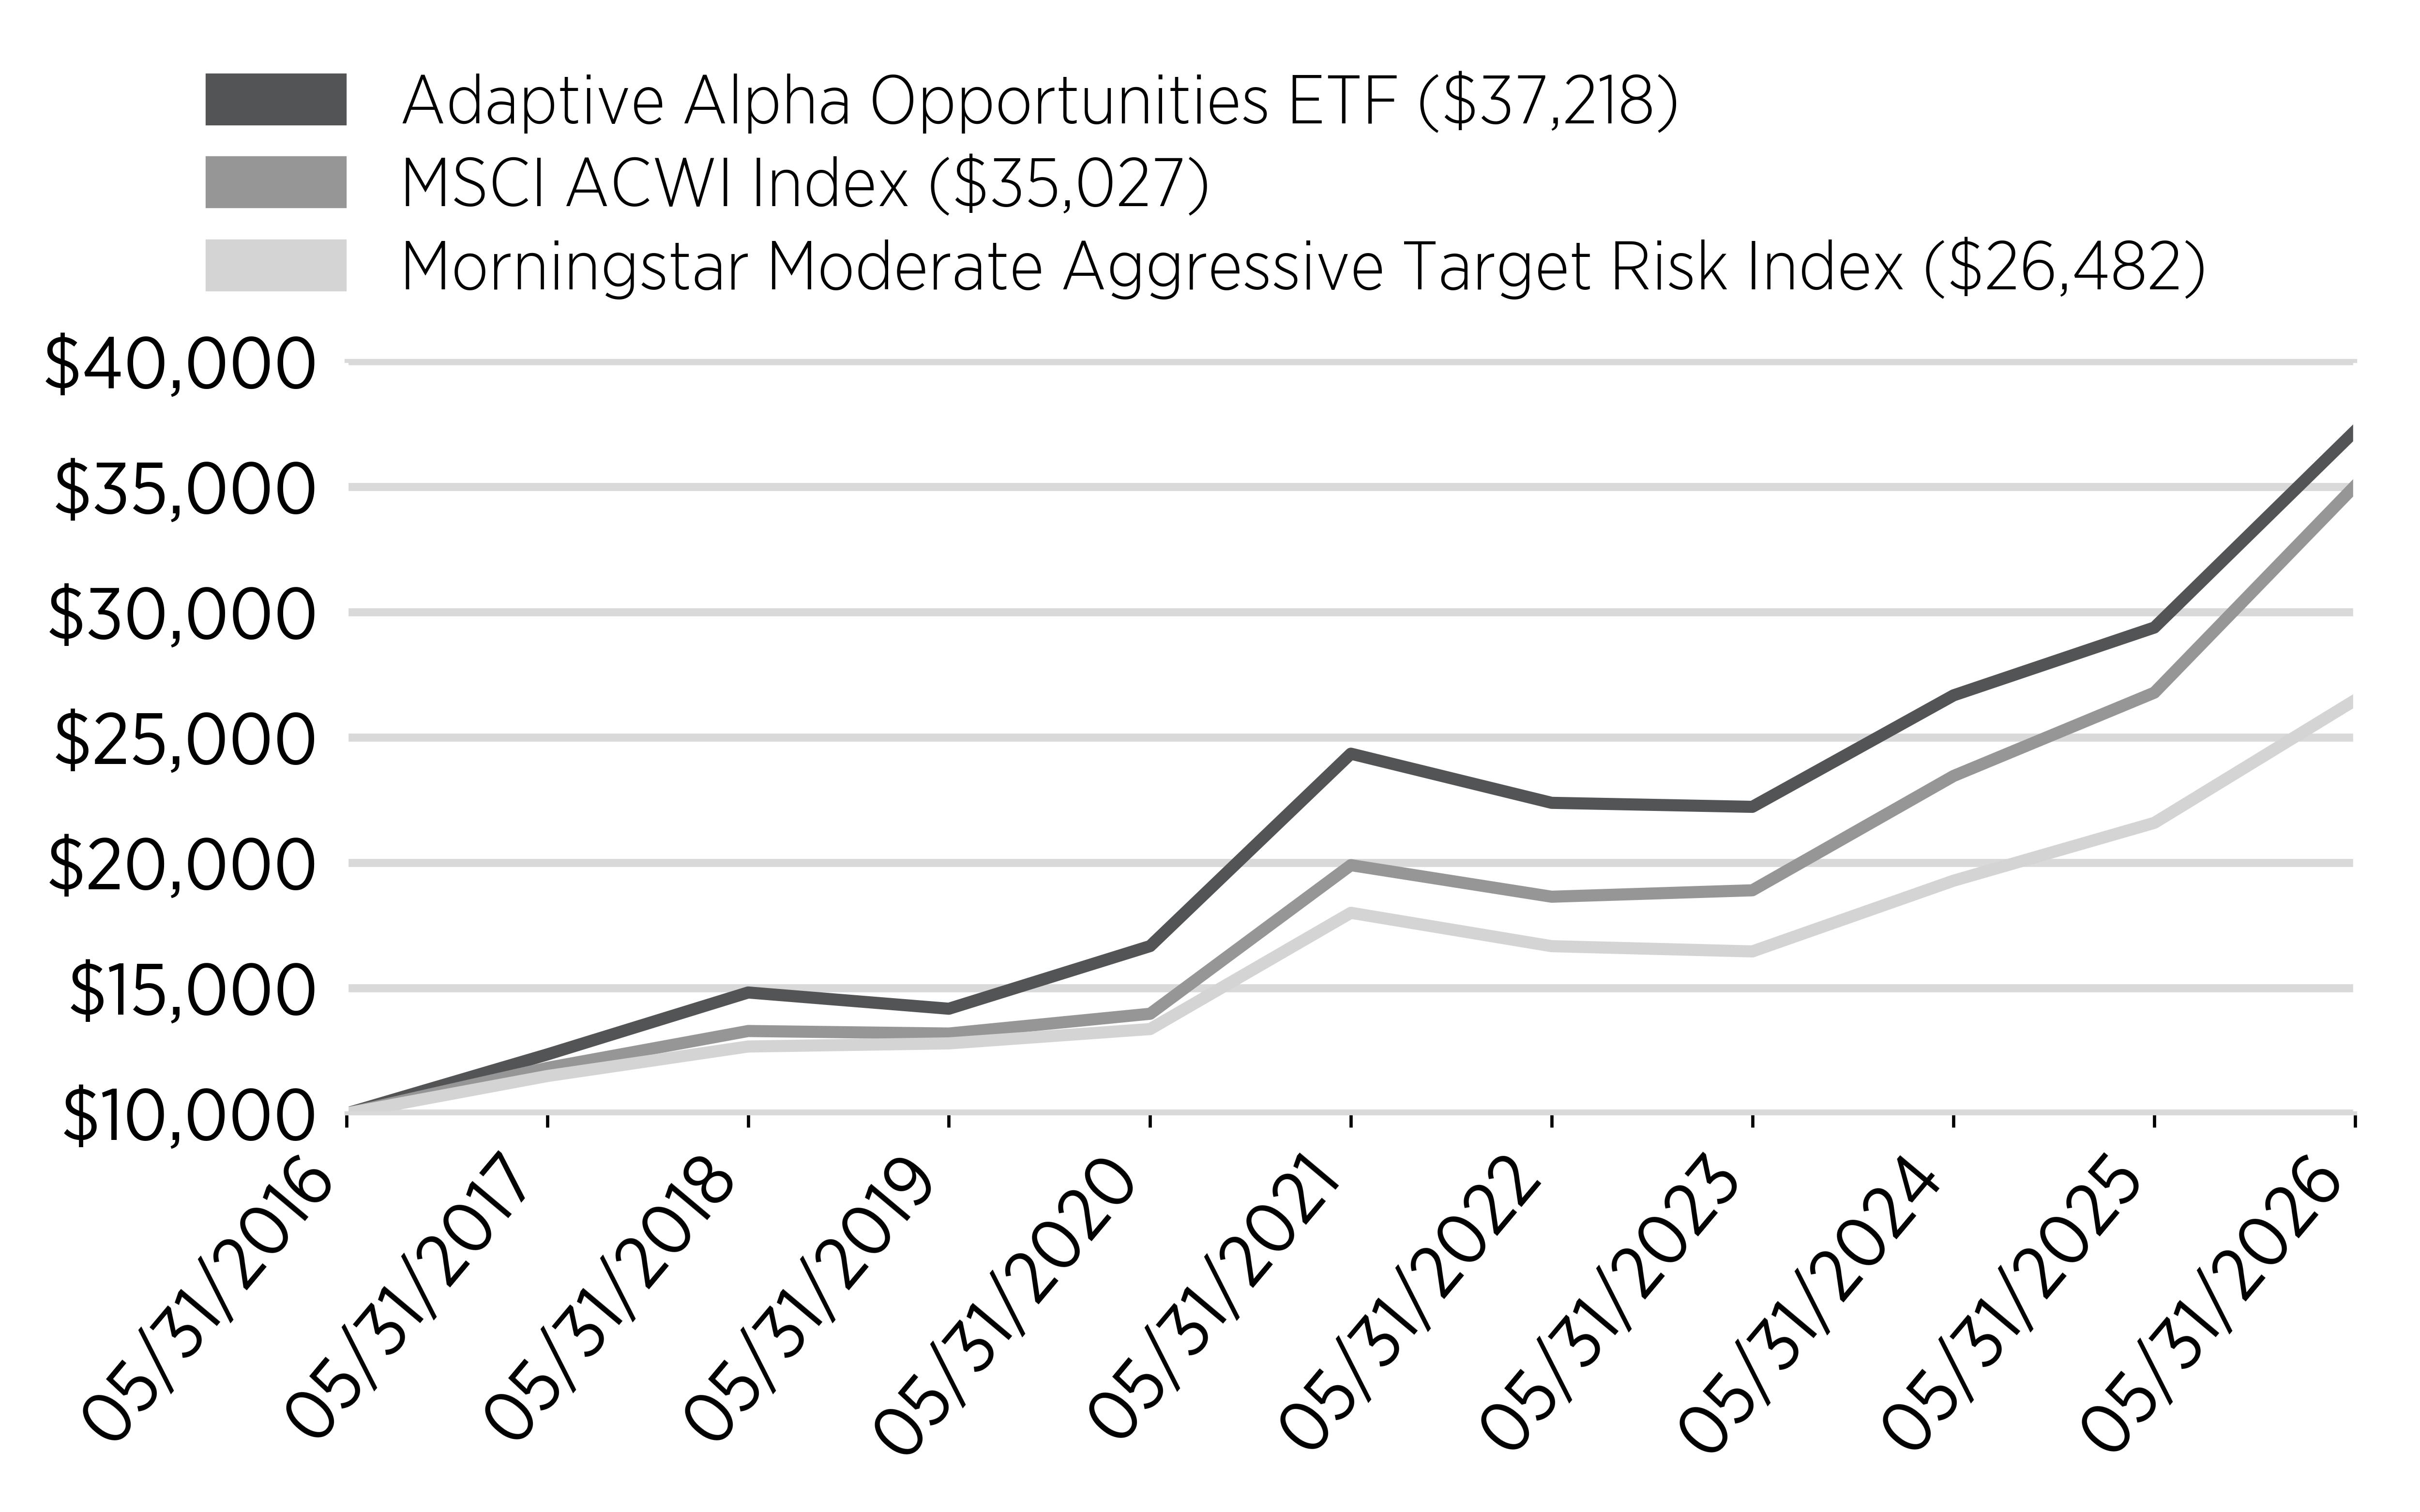
Average Annual Total Returns
(as of May 31, 2026 )
|
|
1 Year
|
5 Year
|
10 Year
|
Since
Inception
(09/20/12)
|
|---|---|---|---|---|
|
Adaptive Alpha Opportunities ETF
|
26.69%
|
8.86%
|
14.04%
|
11.93%
|
|
MSCI ACWI Index
|
30.80%
|
11.96%
|
13.35%
|
11.81%
|
|
Morningstar Moderate Aggressive
Target Risk Index
|
22.67%
|
8.02%
|
10.23%
|
9.37%
|
Key Fund Statistics
(as of May 31, 2026 )
|
Net Assets
|
$385,961,450
|
|
Number of Holdings
|
330
|
|
Net Advisory Fee
|
$3,525,129
|
|
Portfolio Turnover Rate
|
2,621.38%
|
What did the Fund invest in?
(as of
May 31, 2026
)
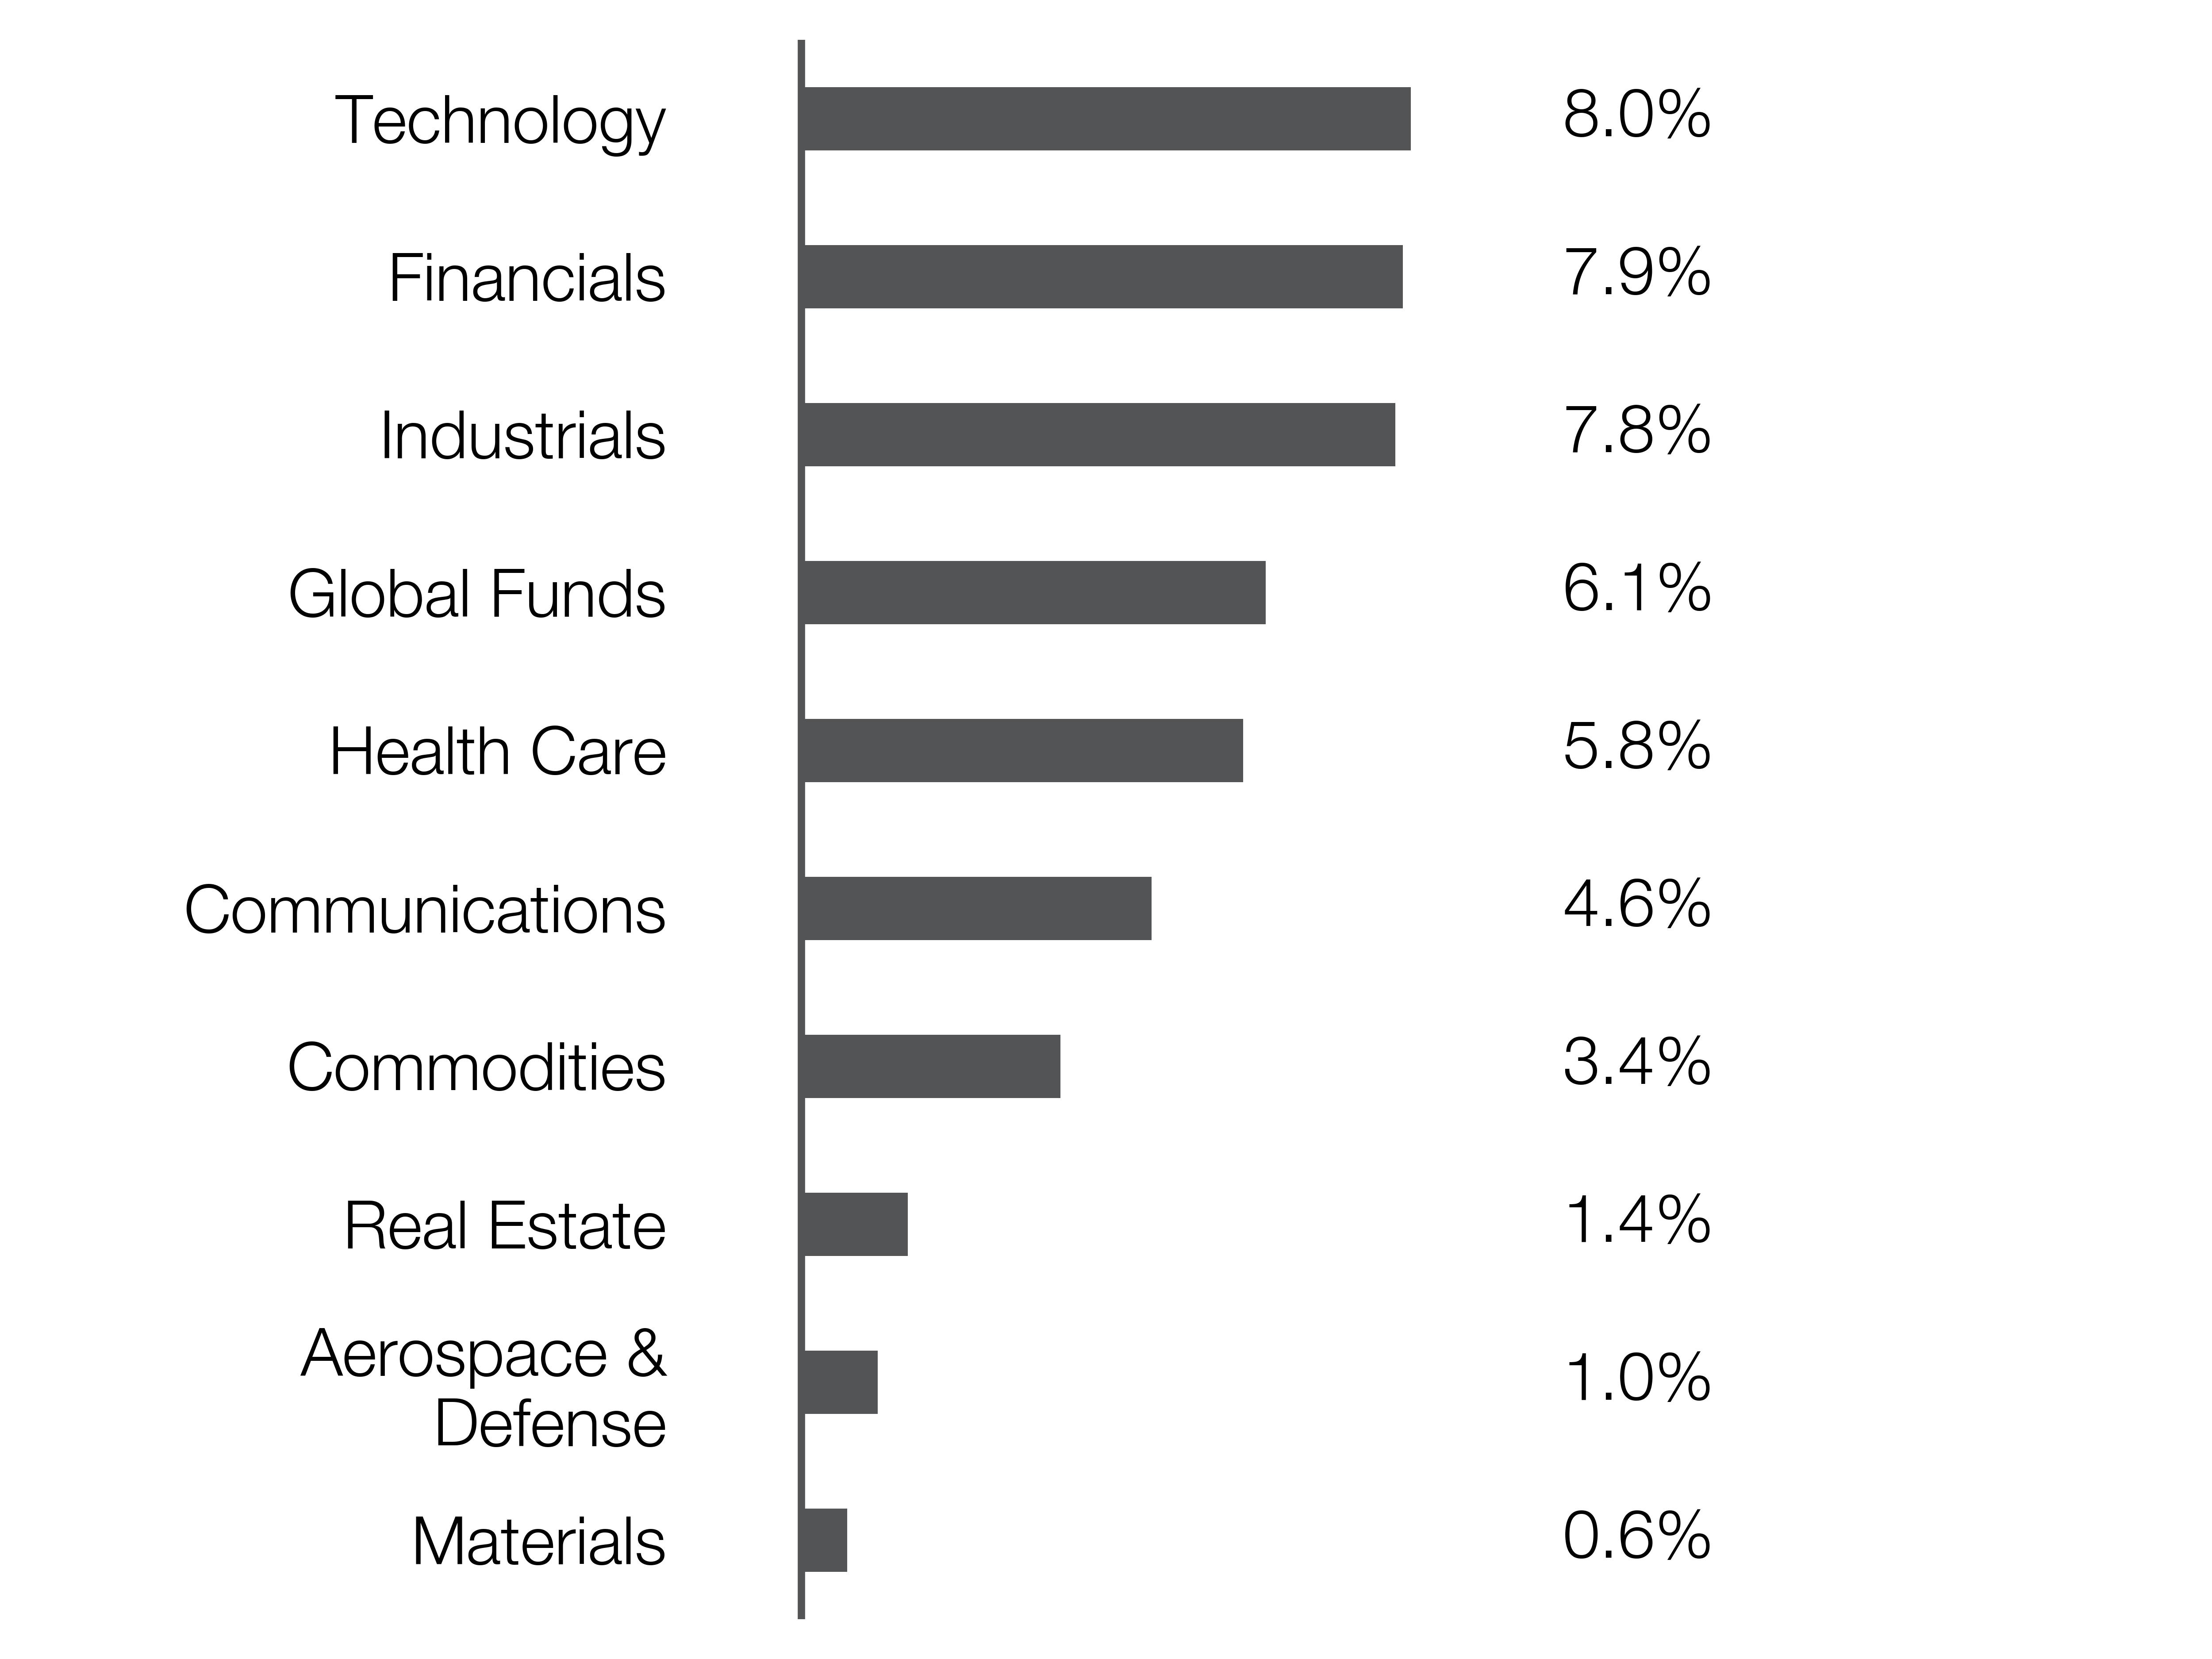
Sector Breakdown (% of Total Net Assets)
|
Top Ten Holdings
|
(% of Total Net Assets)
|
|---|---|
|
Fidelity Government Portfolio
|
|
|
Invesco QQQ Trust Series 1
|
|
|
State Street Health Care Select Sector SPDR ETF
|
|
|
State Street Technology Select Sector SPDR ETF
|
|
|
State Street Communication Services
Select Sector SPDR ETF
|
|
|
Vanguard FTSE Emerging Markets ETF
|
|
|
Invesco QQQ Trust Series 1
|
|
|
Western Digital Corp
|
|
|
State Street SPDR S&P 500 ETF Trust
|
|
|
iShares Global Infrastructure ETF
|
What were the Fund costs for the past year?
(based on a hypothetical $10,000 investment)
|
Fund Name
|
Costs of a $10,000 investment
|
Costs paid as a percentage of a $10,000 investment
|
|---|---|---|
|
Adaptive Hedged Multi-Asset Income ETF
|
$123
|
1.15%
|
How did the Fund perform last year and what affected its performance?
For the fiscal year ended May 31, 2026, the Fund returned 13.08%. The Fund outperformed the Bloomberg Capital US Aggregate Bond Index, which returned 5.13% for the same period.
Factors that Impacted the Fund's Performance
Adaptive Hedged Multi Asset Income ETF (AMAX) maintained a Equities-Treasuries-Gold-Bitcoin four part portfolio. AMAX continued using bitcoin related ETFs and equities to generate covered call premium income for the fund, as well as fund the purchase of long protective puts.
The main detractors from performance include:
• YieldMax META Option Income Strategy ETF (FBY) had a rescaled portfolio weight of 2.14% and detracted (0.21%) during the period.
• YieldMax MSFT Option Income Strategy ETF (MSFO) had a rescaled portfolio weight of 2.31% and detracted (0.04%) during the period.
• Strategy Inc Class A (MSTR) had a rescaled portfolio weight of 19.57% and detracted (17.72%) during the period.
The main contributors to performance include:
• VanEck Gold Miners ETF (GDX) had a rescaled portfolio weight of 16.30% and contributed 9.49% during the period.
• Invesco QQQ Trust (QQQ) had a rescaled portfolio weight of 12.01% and contributed 3.69% during the period.
• State Street® SPDR® S&P 500® ETF (SPY) had a rescaled portfolio weight of 31.09% and contributed 8.63% during the period.
Cumulative Performance
From June 1, 2025 through May 31, 2026
Initial Investment of $10,000
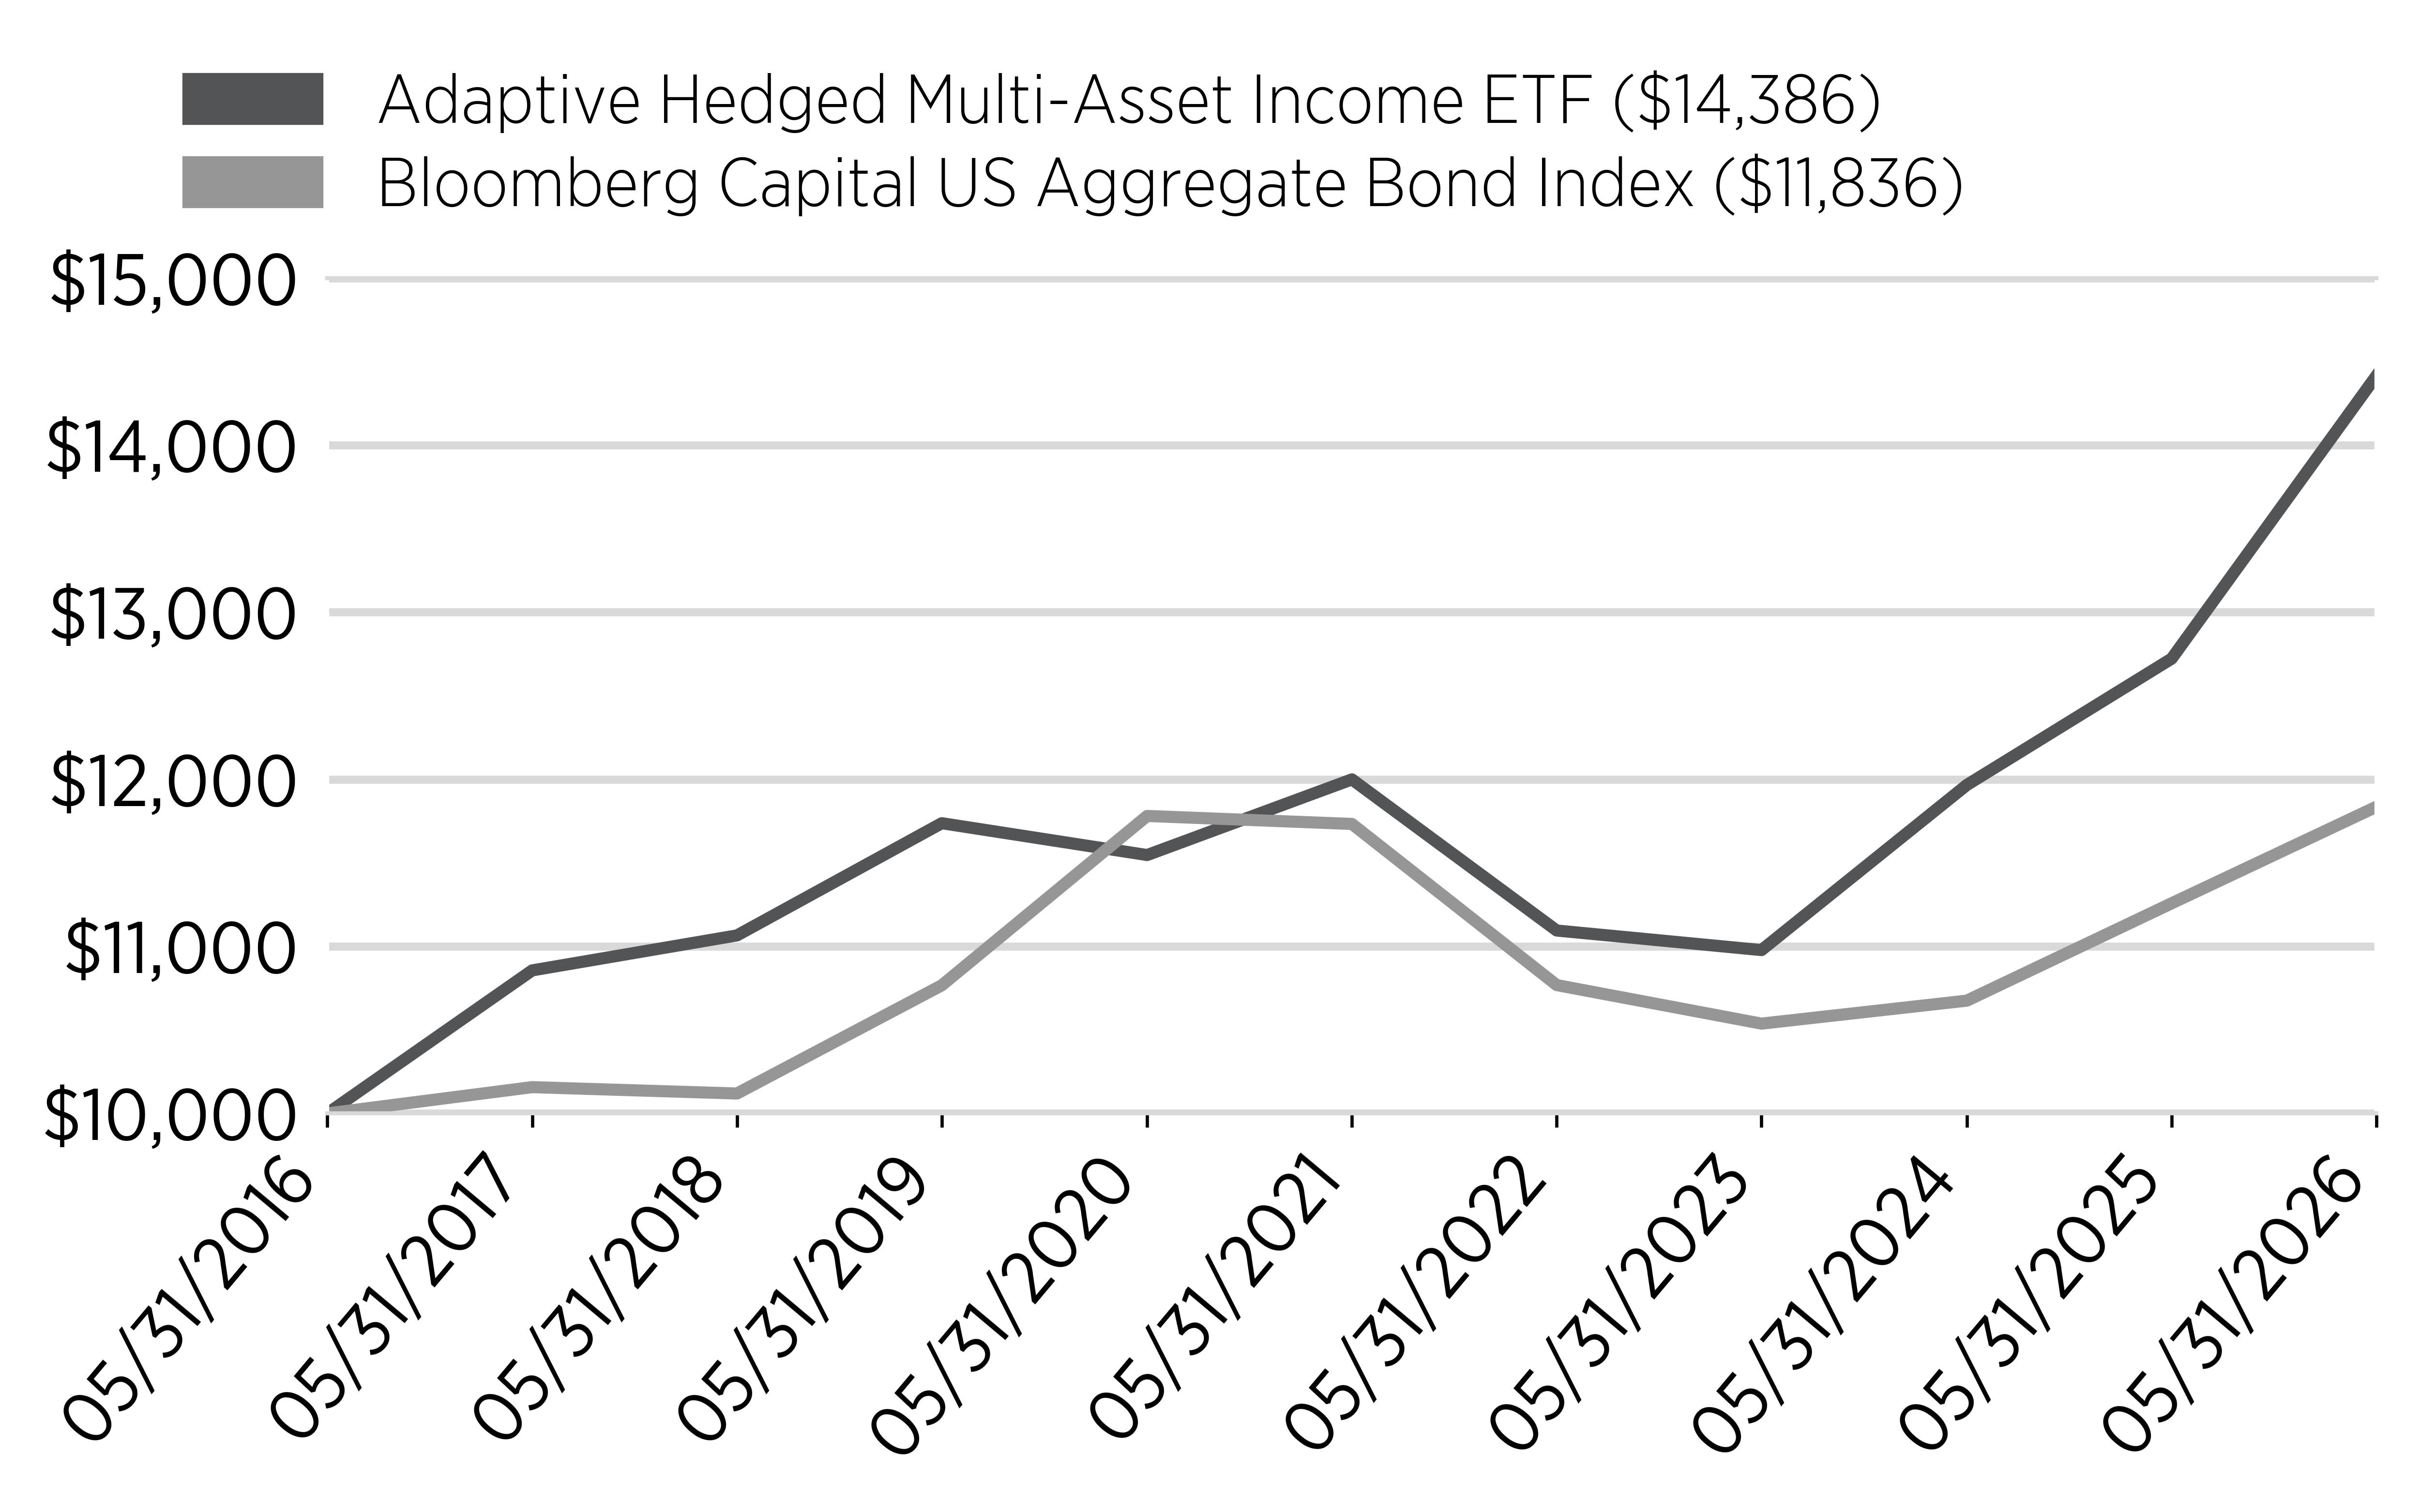
Average Annual Total Returns
(as of May 31, 2026 )
|
|
1 Year
|
5 Year
|
10 Year
|
Since
Inception
(10/02/09)
|
|---|---|---|---|---|
|
Adaptive Hedged Multi-Asset Income ETF
|
13.08%
|
3.69%
|
3.70%
|
3.01%
|
|
Bloomberg Capital US Aggregate
Bond Index
|
5.13%
|
0.17%
|
1.70%
|
2.58%
|
Key Fund Statistics
(as of May 31, 2026 )
|
Net Assets
|
$67,771,624
|
|
Number of Holdings
|
25
|
|
Net Advisory Fee
|
$183,818
|
|
Portfolio Turnover Rate
|
538.32%
|
What did the Fund invest in?
(as of
May 31, 2026
)
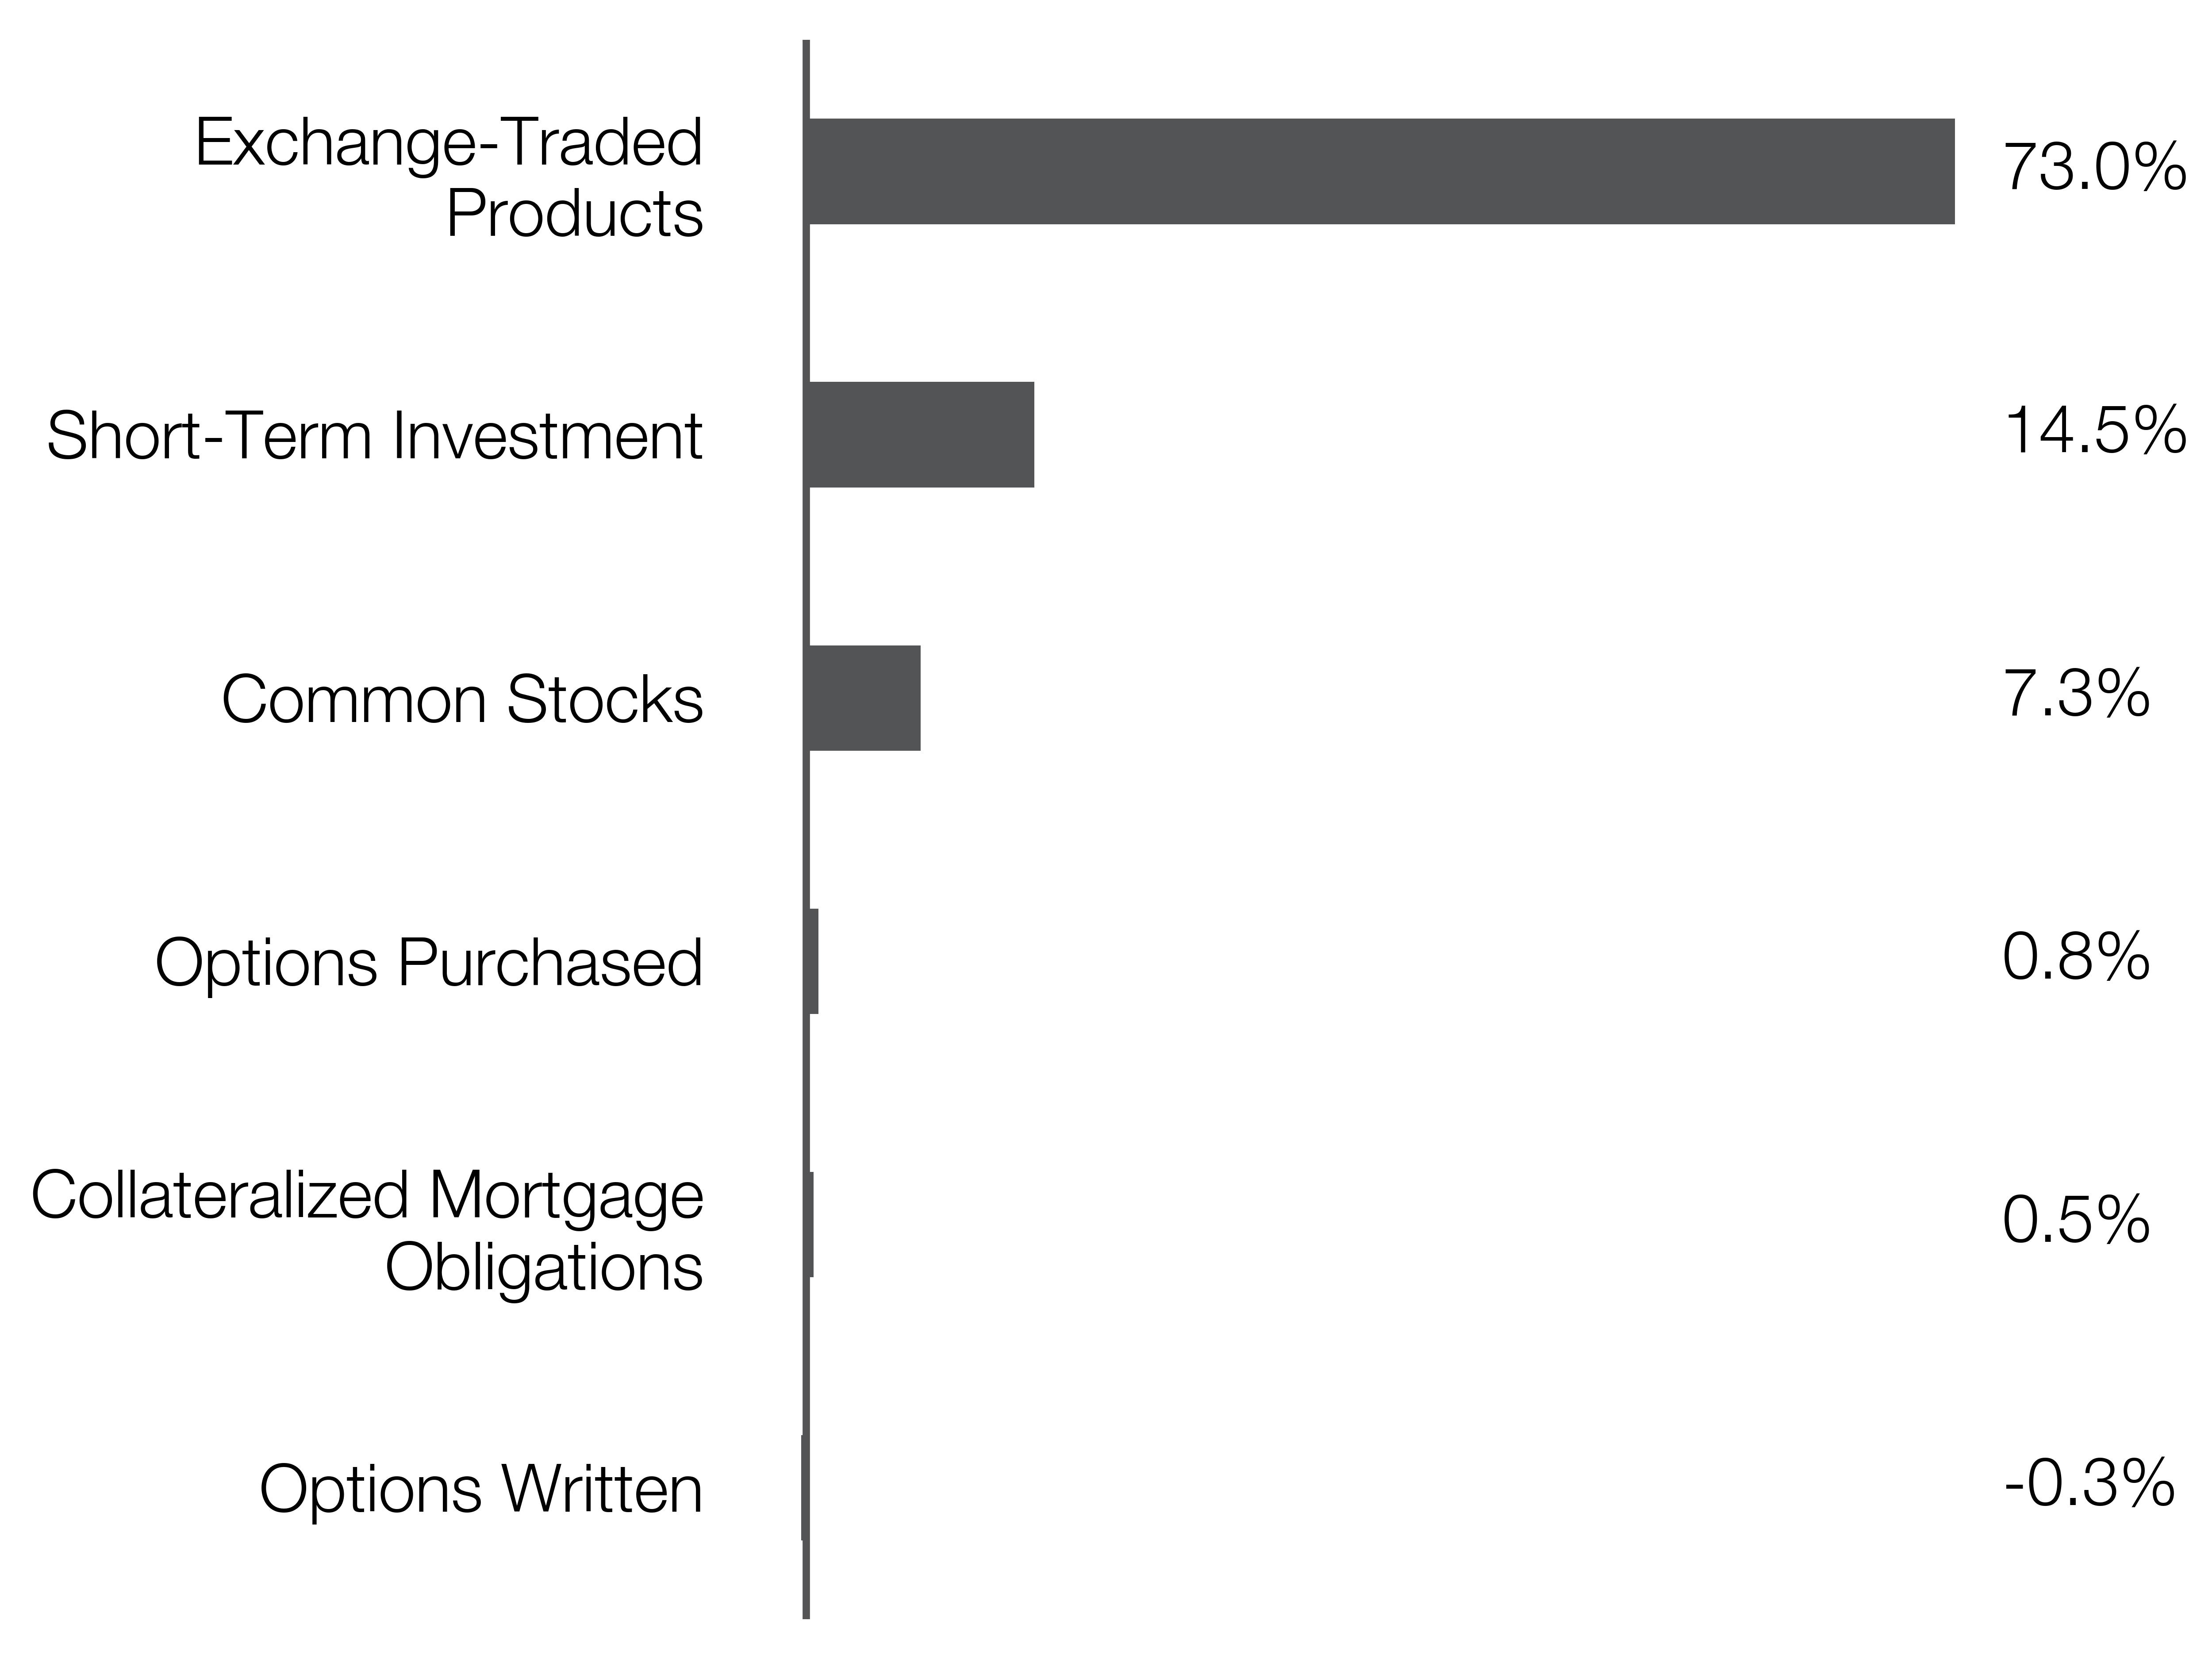
Security Type Breakdown (% of Total Net Assets)
|
Top Ten Holdings
|
(% of Total Net Assets)
|
|---|---|
|
iShares 20+ Year Treasury Bond ETF
|
|
|
State Street SPDR S&P 500 ETF Trust
|
|
|
FT Vest Gold Strategy Target Income ETF
|
|
|
Strategy Inc.
|
|
|
iShares Bitcoin Trust ETF
|
|
|
State Street SPDR Portfolio S&P 500 Growth ETF
|
|
|
VanEck Gold Miners ETF/USA
|
|
|
UBS AG ETRACS Crude Oil Shares Covered Call ETN
|
|
|
YieldMax GOOGL Option Income Strategy ETF
|
|
|
YieldMax AAPL Option Income Strategy ETF
|
What were the Fund costs for the past year?
(based on a hypothetical $10,000 investment)
|
Fund Name
|
Costs of a $10,000 investment
|
Costs paid as a percentage of a $10,000 investment
|
|---|---|---|
|
RH Tactical Outlook ETF
|
$159
|
1.40%
|
How did the Fund perform last year and what affected its performance?
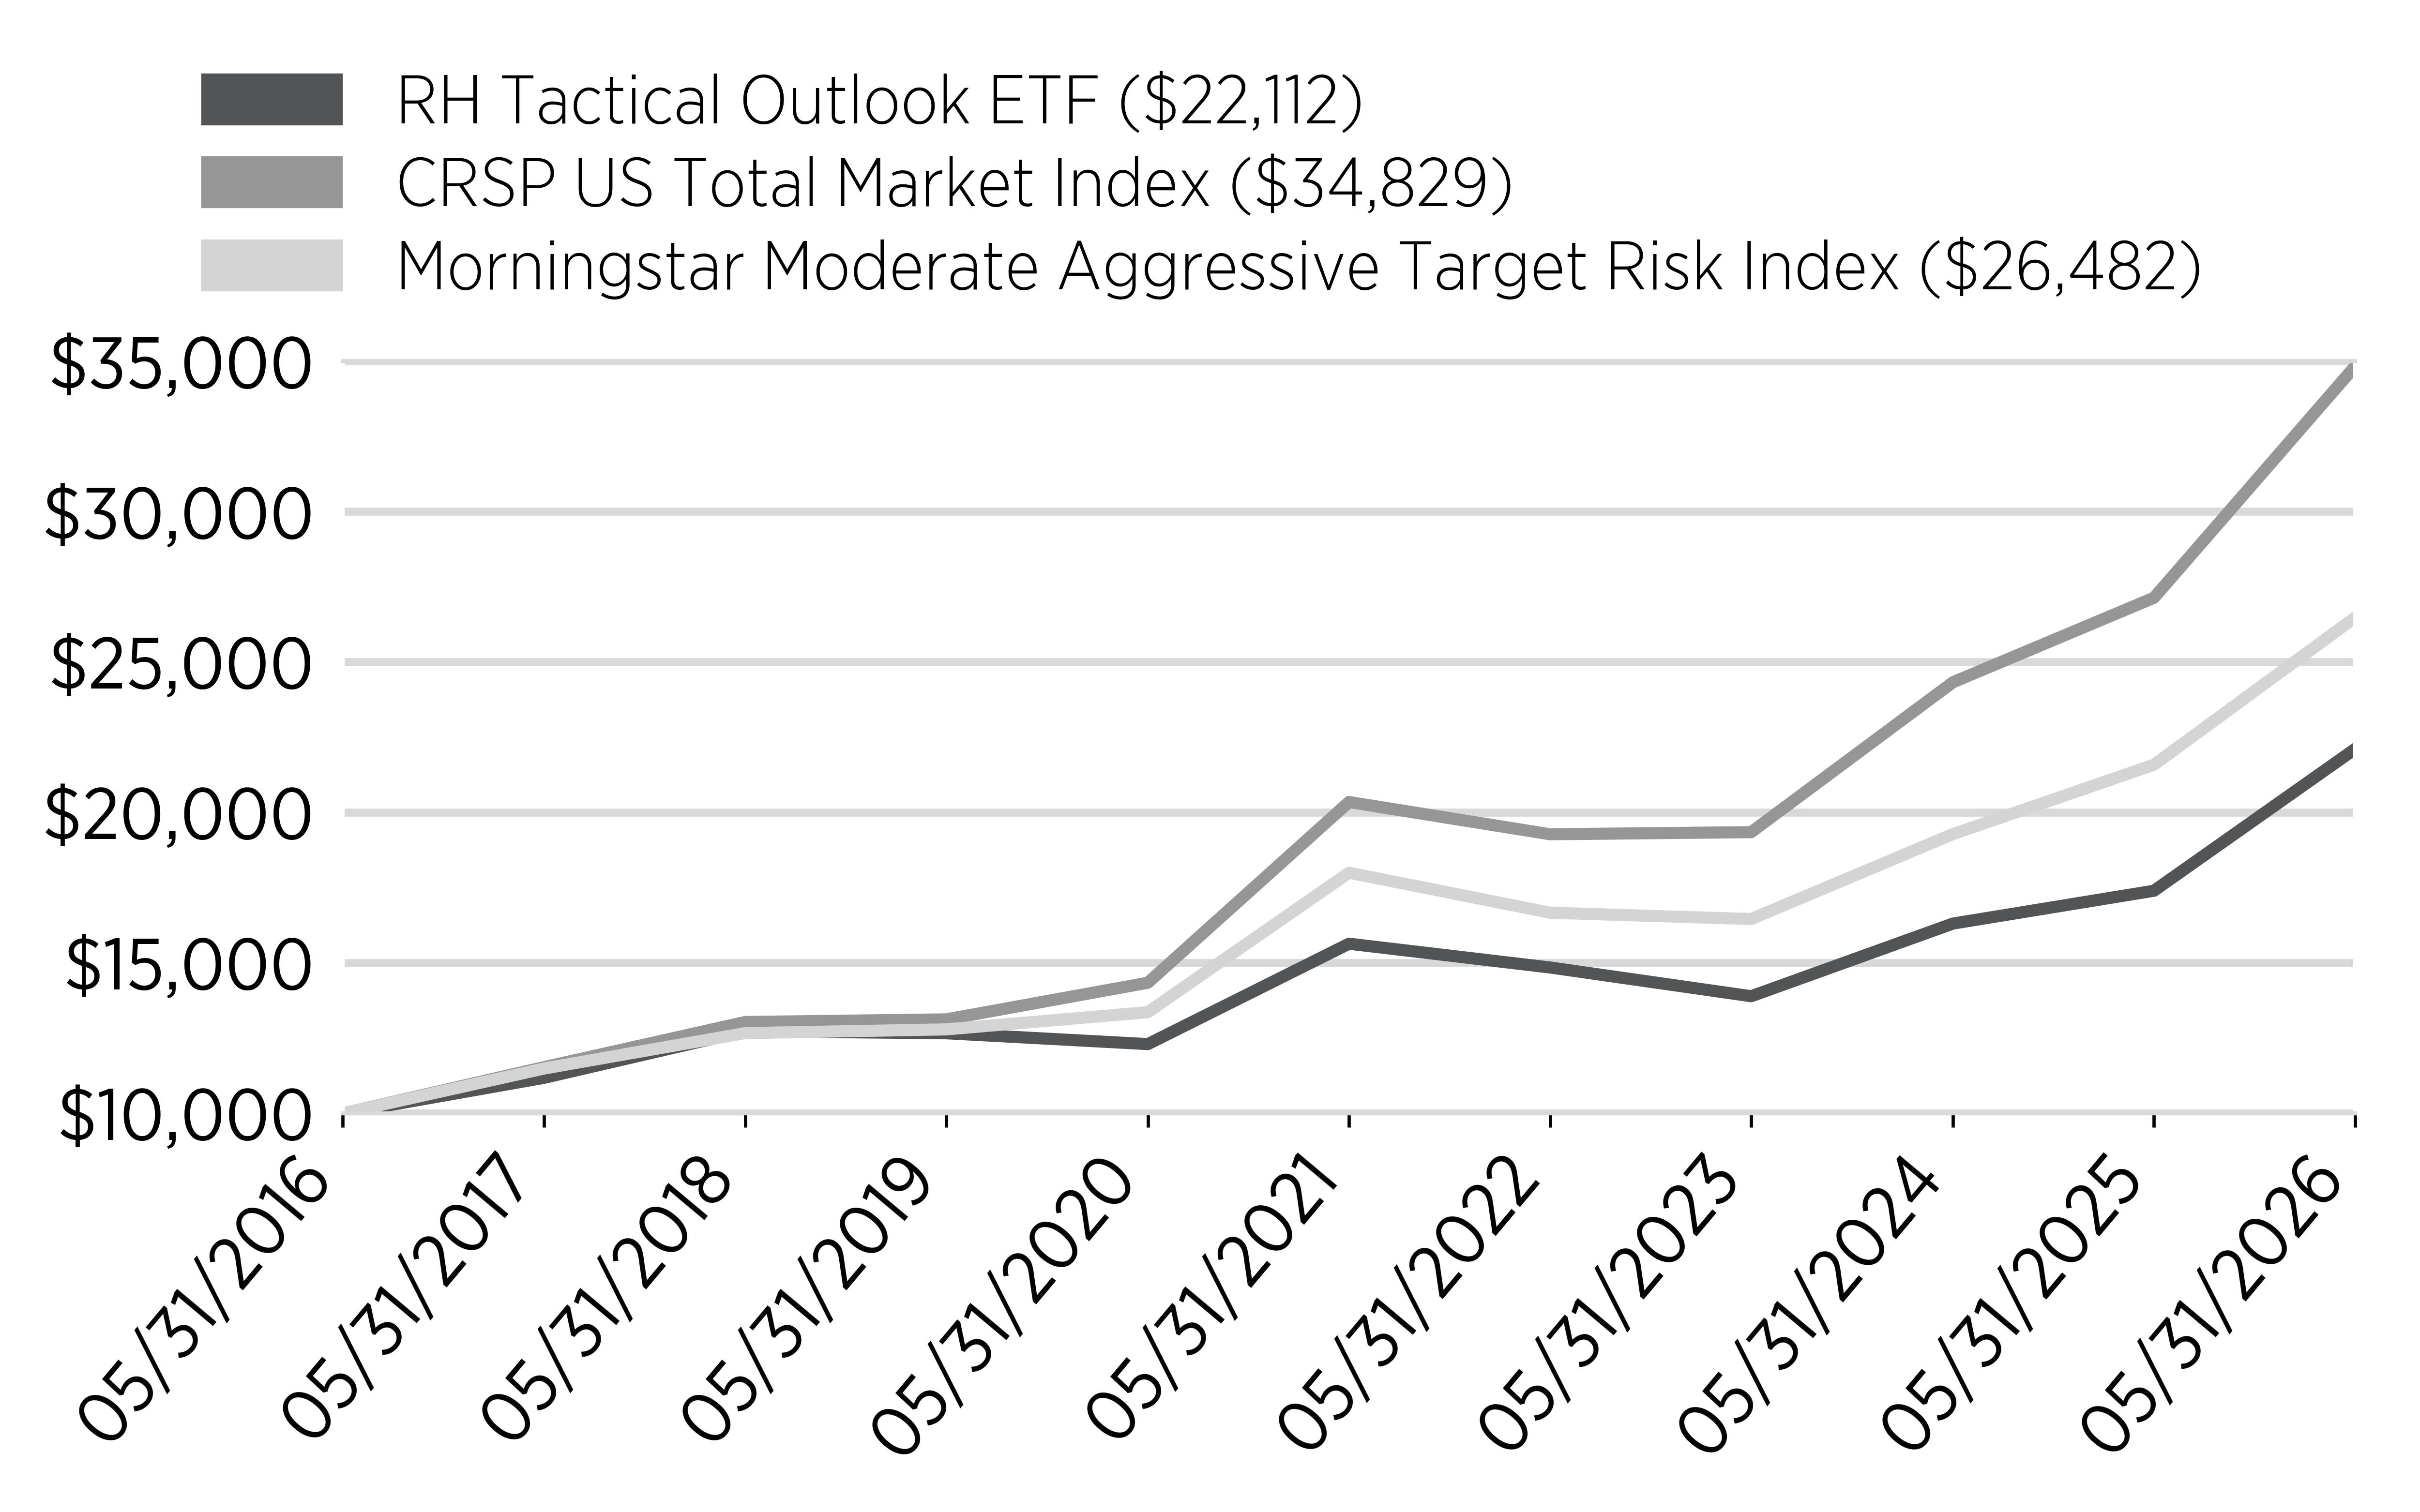
For the fiscal year ended May 31, 2026, the Fund returned 27.08%. The Fund underperformed the CRSP US Total Market Index, and outperformed the Morningstar Moderate Aggressive Target Risk Index, which returned 28.35% and 22.67%, respectively, for the same period.
Factors that Impacted the Fund's Performance
RH Tactical Outlook ETF (RHTX) maintained its multi-cap equity and precious metal exposure for the majority of the year. Although the precious metals that RHTX holds (GLD, SLV) provide some diversification benefit, the large equity bias in the portfolio allows the overall portfolio to go through drawdowns with broader equity indices. RHTX continued using bitcoin related ETFs and equities to generate covered call premium income for the fund, as well as fund the purchase of long protective puts.
The main detractors from performance include:
• Strategy Class A (MSTR) had a rescaled portfolio weight of 4.87% and detracted (3.18%) during the period.
The main contributors to performance include:
• State Street® SPDR® S&P 500® ETF (SPY) had a rescaled portfolio weight of 57.19% and contributed 16.11% during the period.
Cumulative Performance
From June 1, 2025 through May 31, 2026
Initial Investment of $10,000
Average Annual Total Returns
(as of May 31, 2026 )
|
|
1 Year
|
5 Year
|
10 Year
|
Since
Inception
(09/20/12)
|
|---|---|---|---|---|
|
RH Tactical Outlook ETF
|
27.08%
|
7.17%
|
8.26%
|
7.60%
|
|
CRSP US Total Market Index
|
28.35%
|
11.35%
|
13.29%
|
12.45%
|
|
Morningstar Moderate Aggressive
Target Risk Index
|
22.67%
|
8.03%
|
10.23%
|
9.37%
|
Key Fund Statistics
(as of May 31, 2026 )
|
Net Assets
|
$8,239,965
|
|
Number of Holdings
|
9
|
|
Net Advisory Fee
|
$0
|
|
Portfolio Turnover Rate
|
46.92%
|
What did the Fund invest in?
(as of
May 31, 2026
)
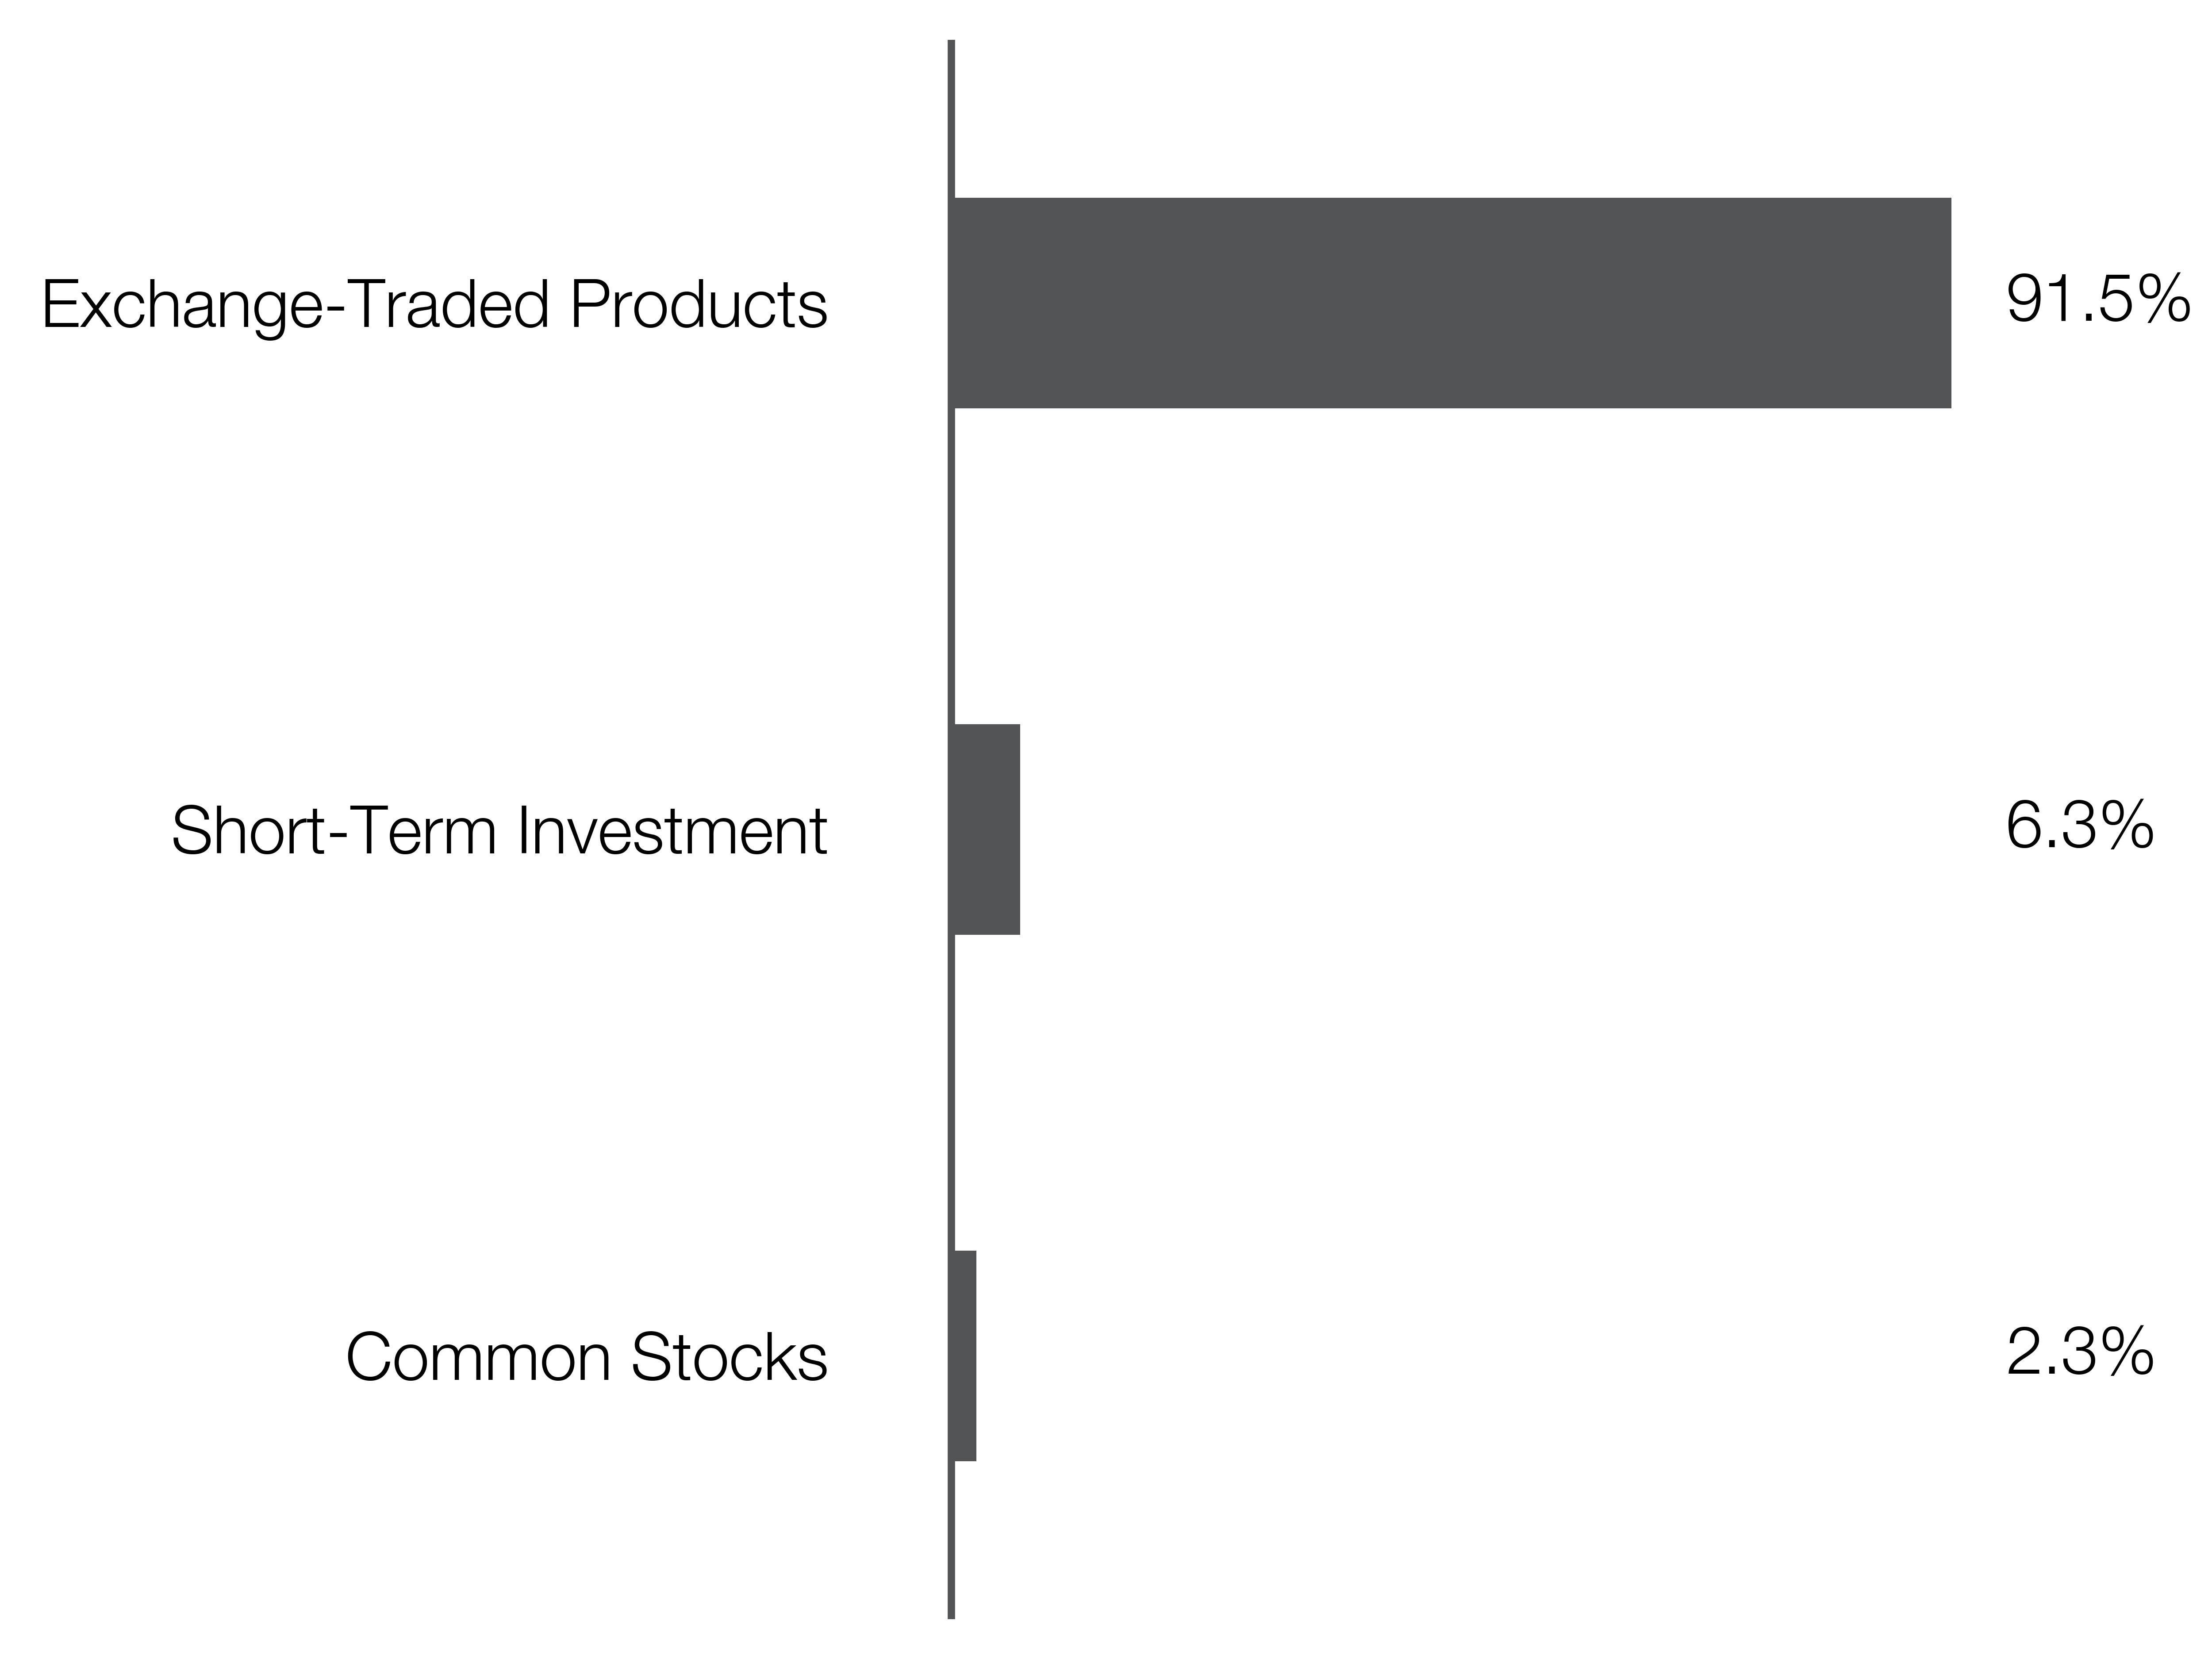
Security Type Breakdown (% of Total Net Assets)
|
Top Holdings
|
(% of Total Net Assets)
|
|---|---|
|
State Street SPDR S&P 500 ETF Trust
|
|
|
State Street SPDR Portfolio S&P 400 Mid Cap ETF
|
|
|
iShares Silver Trust
|
|
|
SPDR Gold Shares
|
|
|
iShares Russell 2000 ETF
|
|
|
Fidelity Government Portfolio
|
|
|
Strategy Inc.
|
What were the Fund costs for the past year?
(based on a hypothetical $10,000 investment)
|
Fund Name
|
Costs of a $10,000 investment
|
Costs paid as a percentage of a $10,000 investment
|
|---|---|---|
|
RH Tactical Rotation ETF
|
$151
|
1.25%
|
How did the Fund perform last year and what affected its performance?
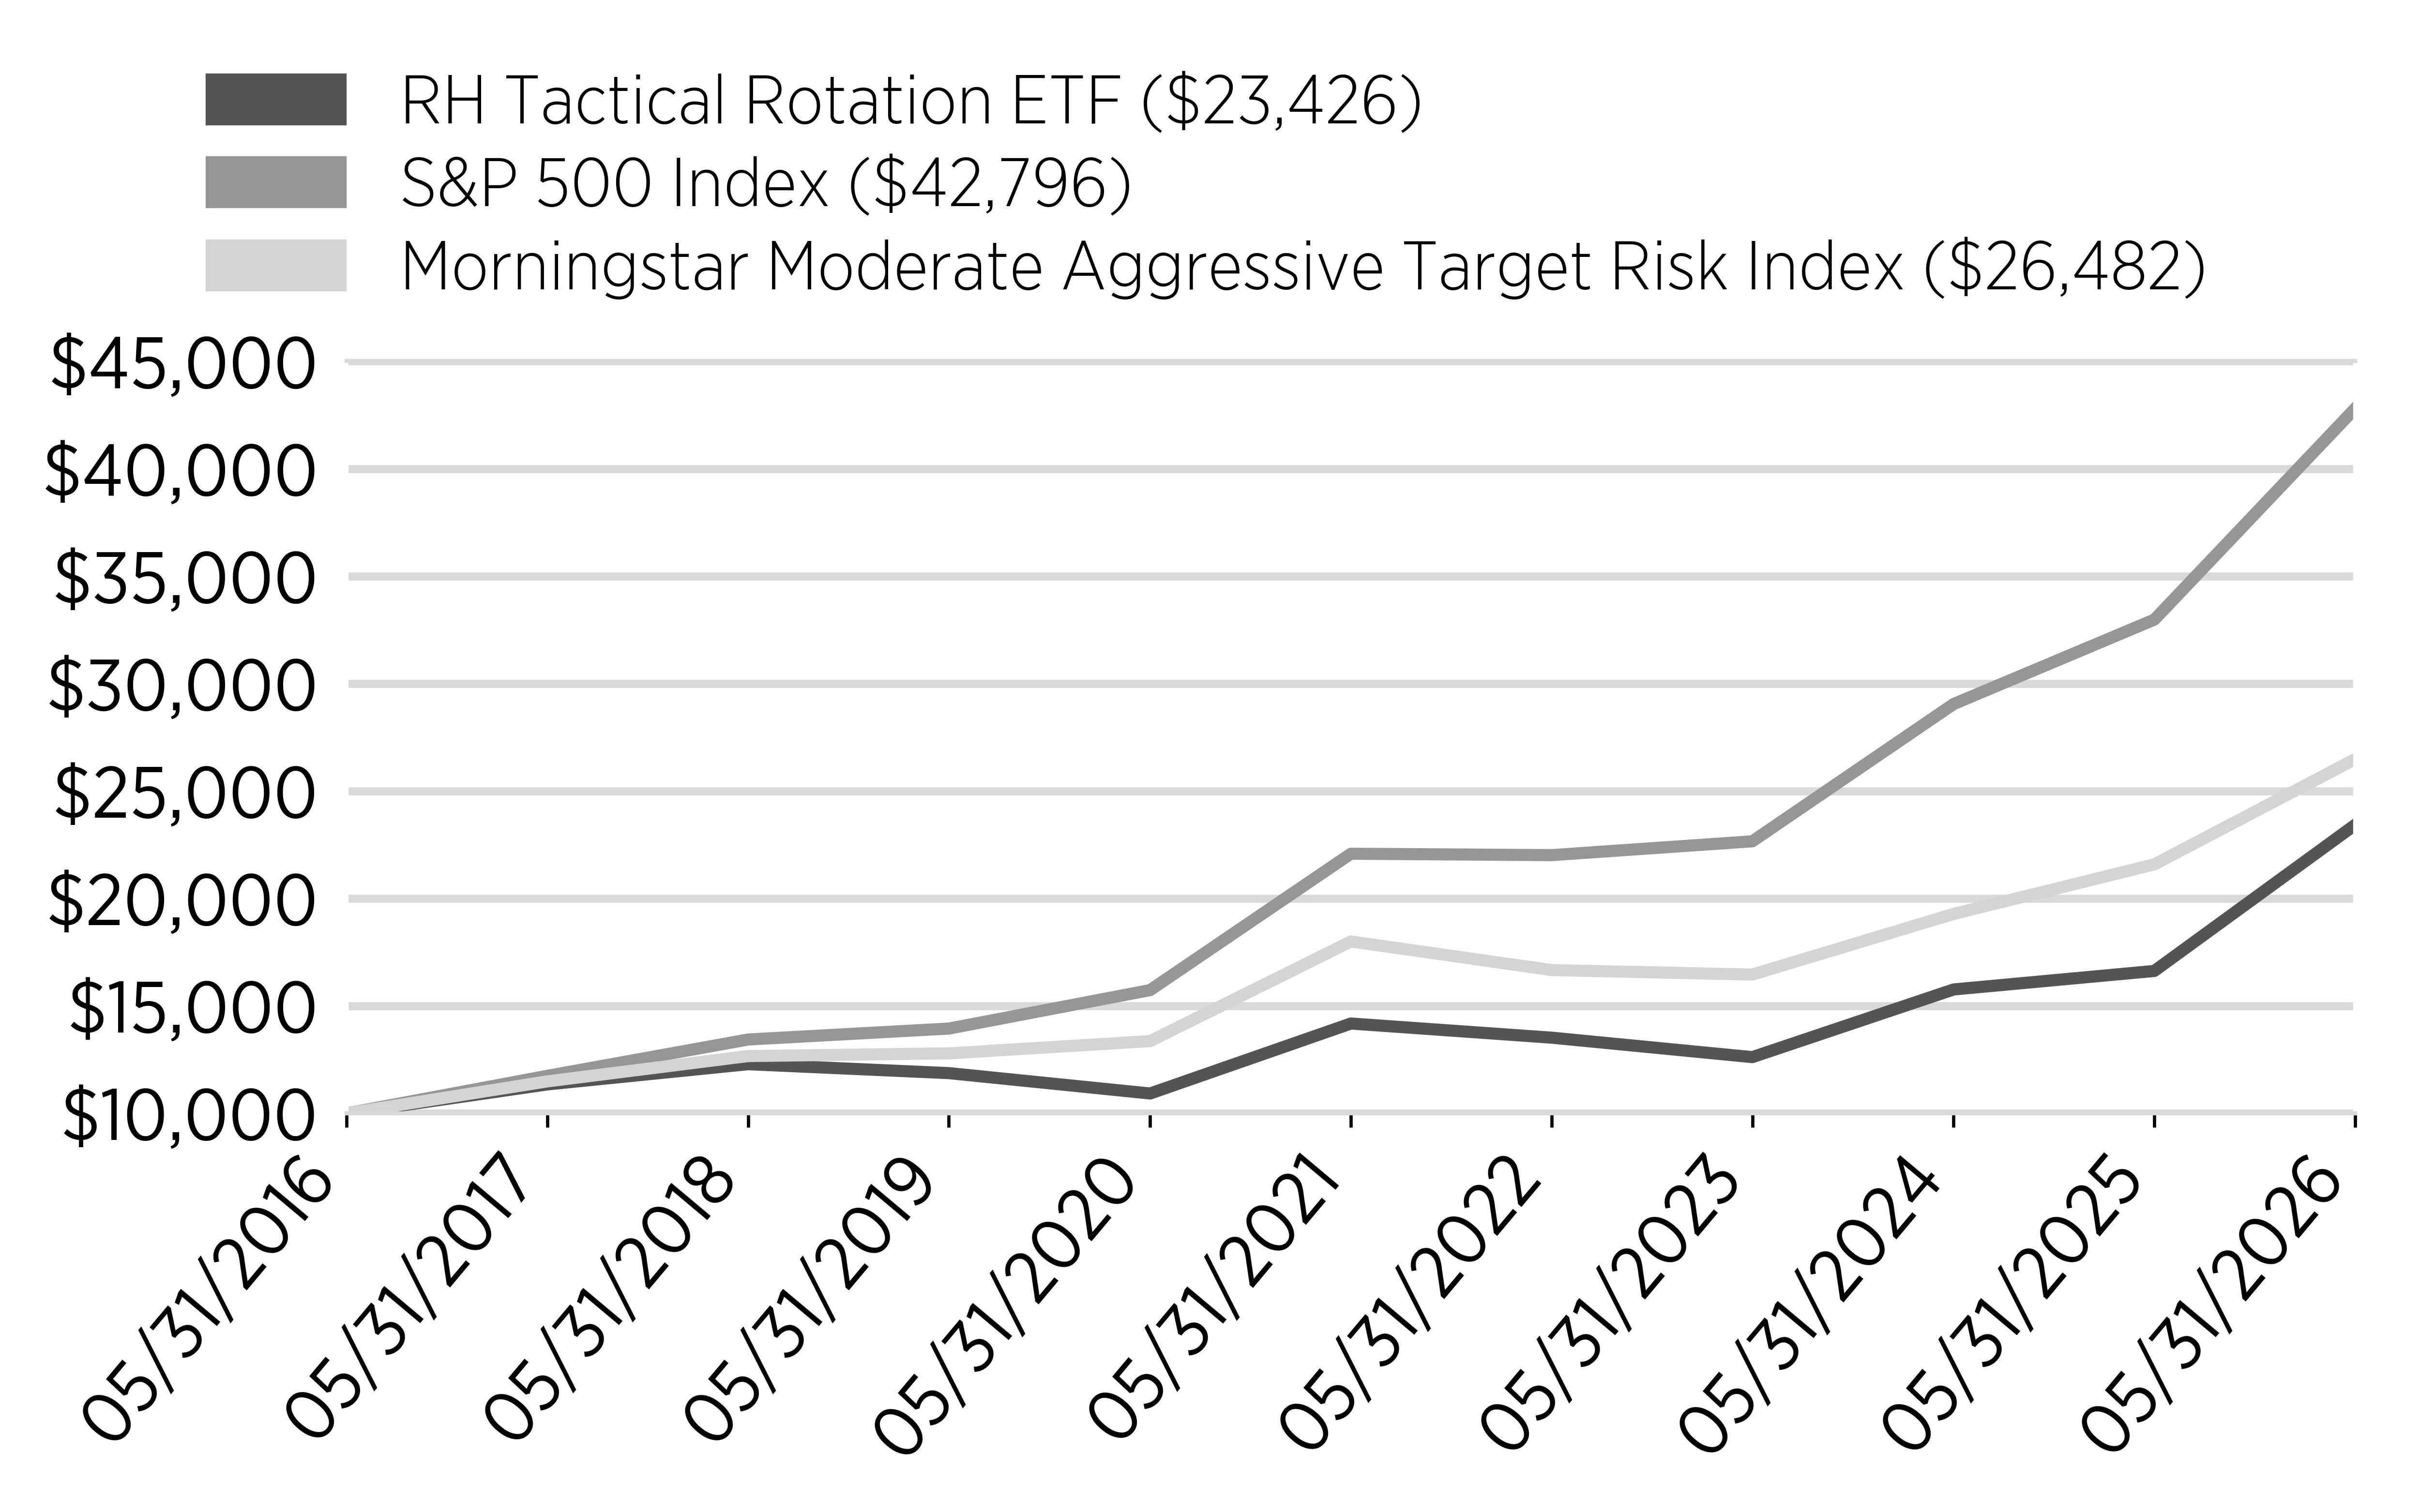
For the fiscal year ended May 31, 2026, the Fund returned 40.88%. The Fund outperformed the S&P 500 Index and the Morningstar Moderate Aggressive Target Risk Index, which returned 29.78% and 22.67%, respectively, for the same period.
Factors that Impacted the Fund's Performance
RH Tactical Rotation maintained its half broad equities, half ‘tri-sector’ approach utilizing third party research to choose in-favor sectors to hold at any given time. RH Tactical Rotation ETF also used ‘Adaptive Growth or Value’ (GVI) model to determine when to tilt the broad equities portion of the portfolio between growth and value styles.
The main detractors from performance include:
• State Street Health Care Select Sector SPDR ETF (XLV) had a rescaled portfolio weight of 0.69% and detracted (0.18%) during the period.
• State Street Utilities Select Sector SPDR ETF (XLU) had a rescaled portfolio weight of 1.49% and detracted (0.03%) during the period.
The main contributors to performance include:
• SPDR S&P 500 ETF (SPY) had a rescaled portfolio weight of 23.22% and contributed 7.51% during the period.
• iShares Semiconductor ETF (SMH) had a rescaled portfolio weight of 7.06% and contributed 14.22% during the period.
Cumulative Performance
From June 1, 2025 through May 31, 2026
Initial Investment of $10,000
Average Annual Total Returns
(as of May 31, 2026 )
|
|
1 Year
|
5 Year
|
10 Year
|
Since
Inception
(09/20/12)
|
|---|---|---|---|---|
|
RH Tactical Rotation ETF
|
40.88%
|
10.56%
|
8.89%
|
8.38%
|
|
S&P 500 Index
|
29.78%
|
14.15%
|
15.65%
|
14.83%
|
|
Morningstar Moderate Aggressive
Target Risk Index
|
22.67%
|
8.03%
|
10.23%
|
9.37%
|
Key Fund Statistics
(as of May 31, 2026 )
|
Net Assets
|
$36,132,154
|
|
Number of Holdings
|
7
|
|
Net Advisory Fee
|
$30,916
|
|
Portfolio Turnover Rate
|
226.73%
|
What did the Fund invest in?
(as of
May 31, 2026
)
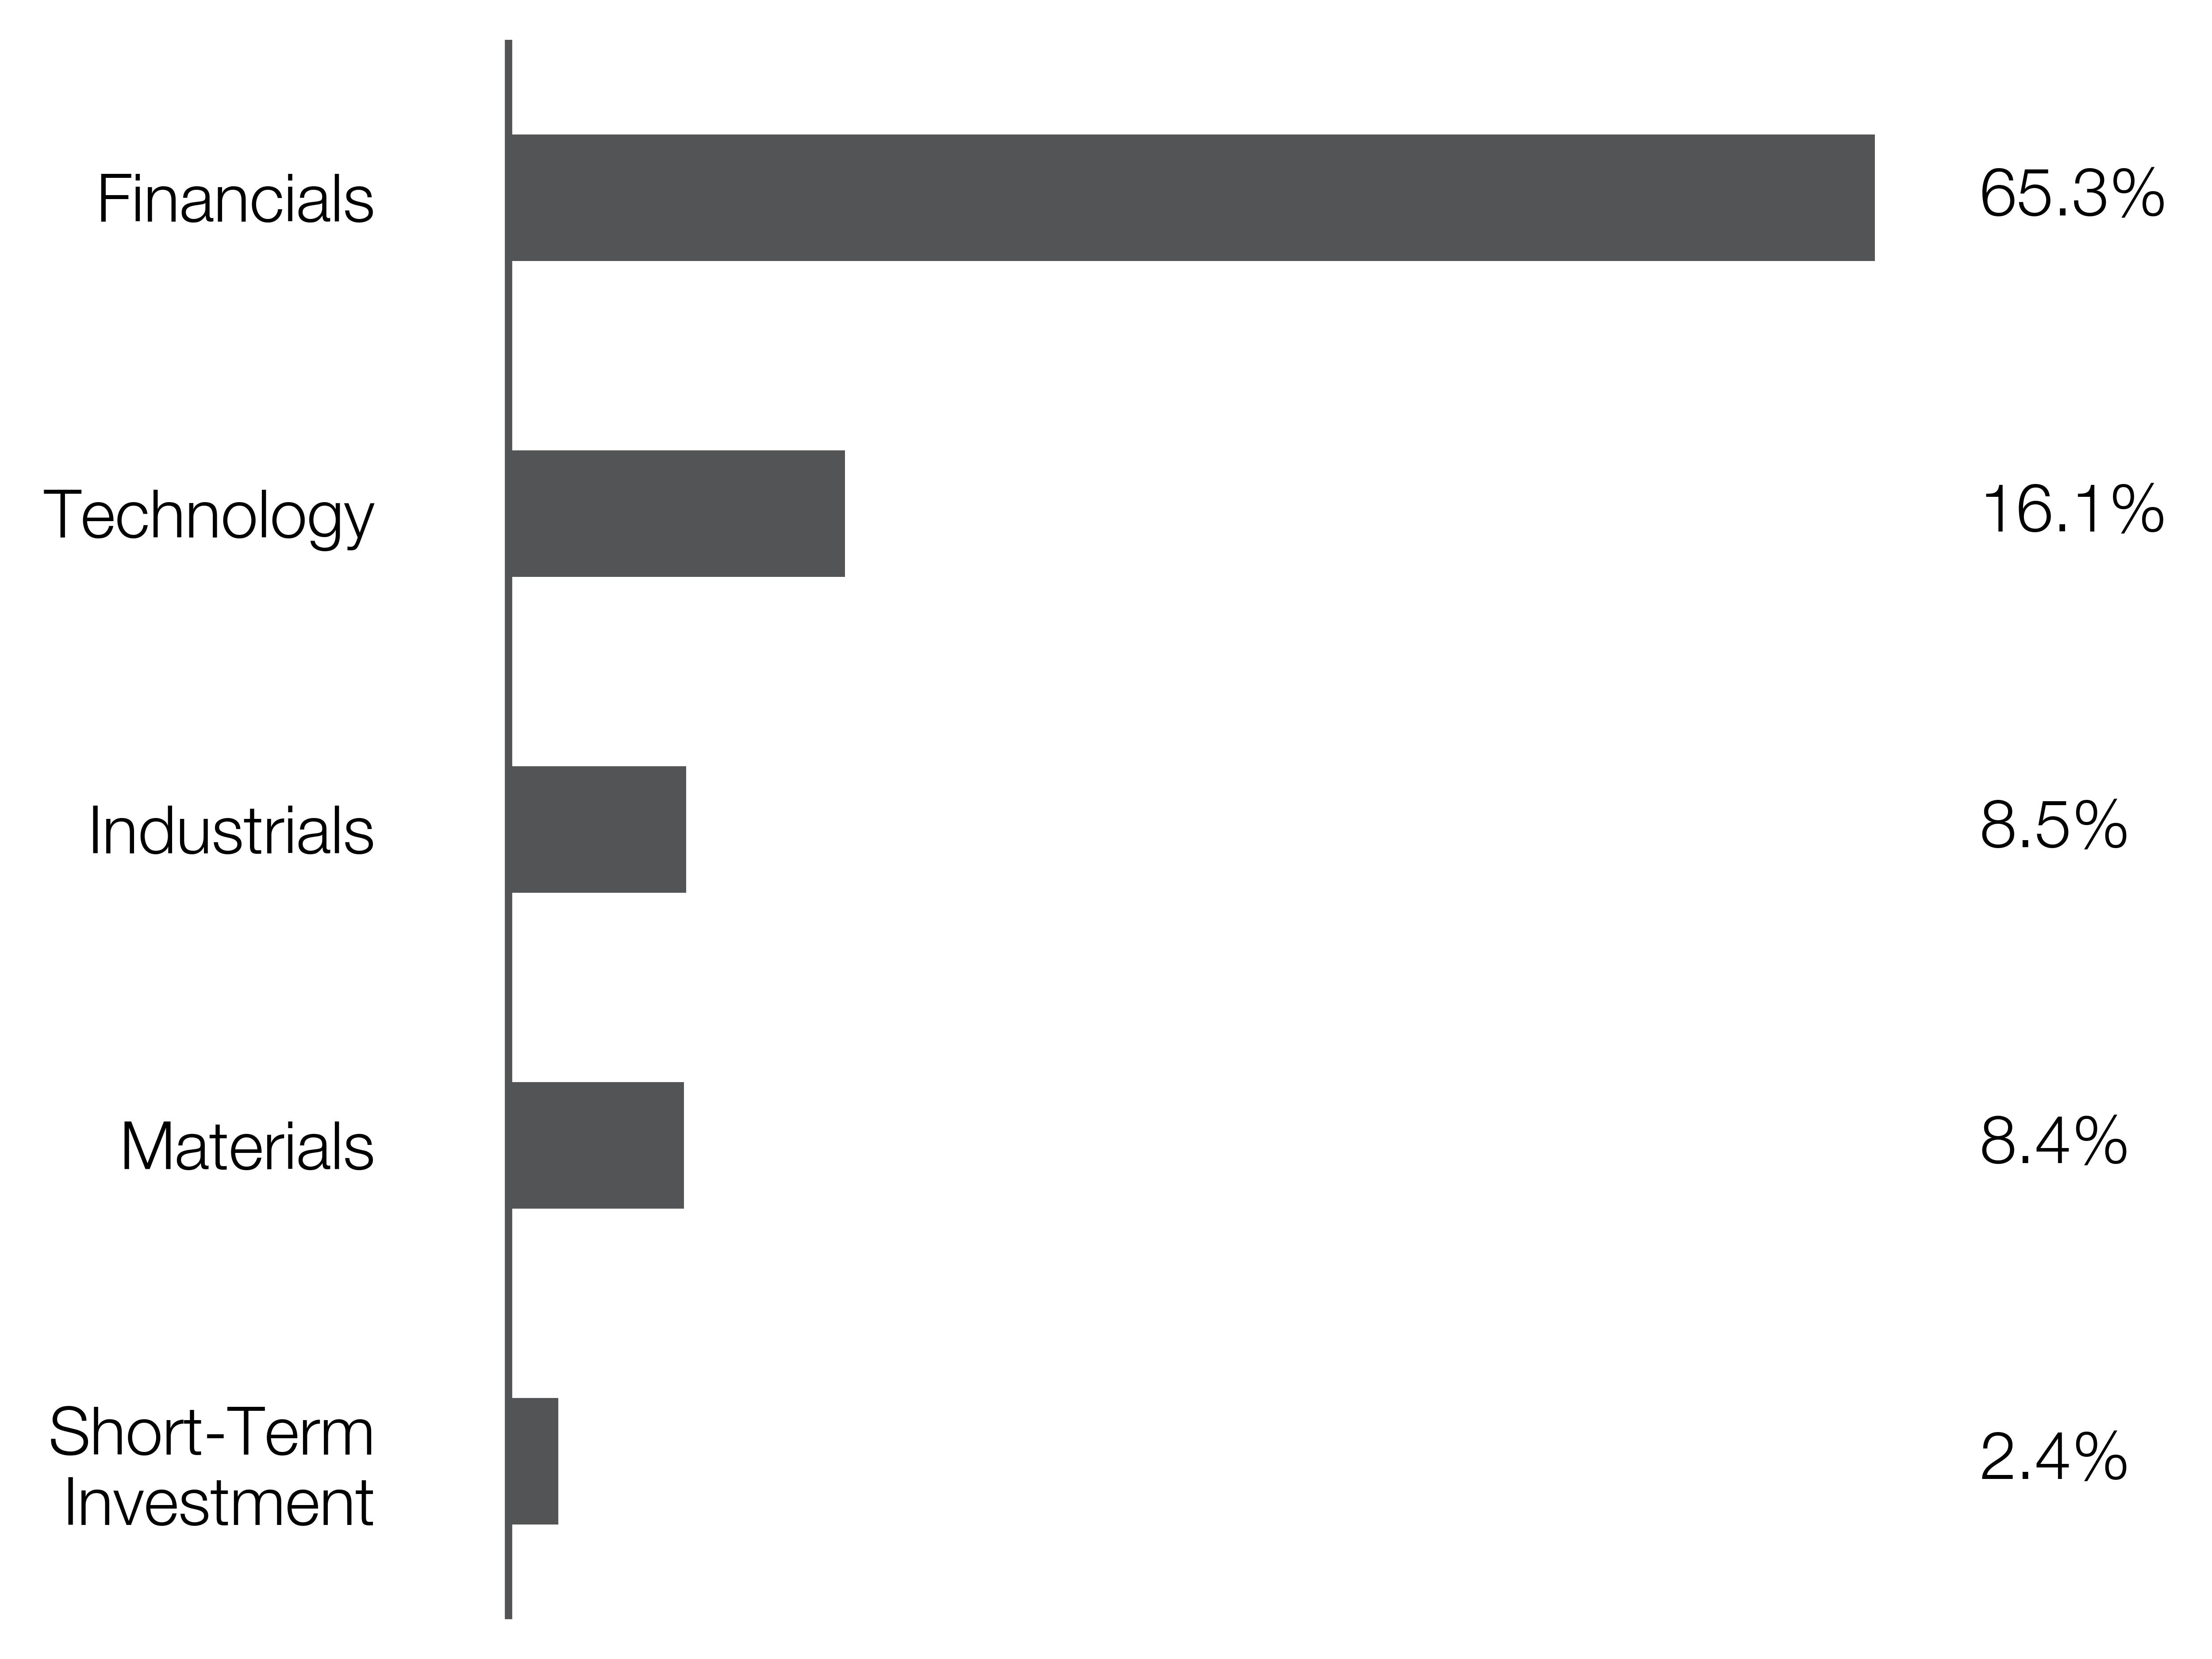
Sector Breakdown (% of Total Net Assets)
|
Top Holdings
|
(% of Total Net Assets)
|
|---|---|
|
State Street SPDR S&P 500 ETF Trust
|
|
|
State Street SPDR Portfolio S&P 500 Growth ETF
|
|
|
iShares Semiconductor ETF
|
|
|
State Street Industrial Select Sector SPDR ETF
|
|
|
State Street Materials Select Sector SPDR ETF
|
|
|
Fidelity Government Portfolio
|