Pay vs Performance Disclosure - USD ($) |
10 Months Ended | 12 Months Ended | |||||||||||||||||||||||||||||||||||||||||||||||||||||||||||||||||||||||||||||||||||||||||||||||||||||||||||||||||||||||||||||||||||||||||||||||||||||||||||||||||||||||||||||||||||||||||||||||||
|---|---|---|---|---|---|---|---|---|---|---|---|---|---|---|---|---|---|---|---|---|---|---|---|---|---|---|---|---|---|---|---|---|---|---|---|---|---|---|---|---|---|---|---|---|---|---|---|---|---|---|---|---|---|---|---|---|---|---|---|---|---|---|---|---|---|---|---|---|---|---|---|---|---|---|---|---|---|---|---|---|---|---|---|---|---|---|---|---|---|---|---|---|---|---|---|---|---|---|---|---|---|---|---|---|---|---|---|---|---|---|---|---|---|---|---|---|---|---|---|---|---|---|---|---|---|---|---|---|---|---|---|---|---|---|---|---|---|---|---|---|---|---|---|---|---|---|---|---|---|---|---|---|---|---|---|---|---|---|---|---|---|---|---|---|---|---|---|---|---|---|---|---|---|---|---|---|---|---|---|---|---|---|---|---|---|---|---|---|---|---|---|---|---|---|---|
Jun. 05, 2021 |
May 31, 2022 |
May 31, 2026 |
May 31, 2025 |
May 31, 2024 |
May 31, 2023 |
May 31, 2022 |
|||||||||||||||||||||||||||||||||||||||||||||||||||||||||||||||||||||||||||||||||||||||||||||||||||||||||||||||||||||||||||||||||||||||||||||||||||||||||||||||||||||||||||||||||||||||||||||
| Pay vs Performance Disclosure | |||||||||||||||||||||||||||||||||||||||||||||||||||||||||||||||||||||||||||||||||||||||||||||||||||||||||||||||||||||||||||||||||||||||||||||||||||||||||||||||||||||||||||||||||||||||||||||||||||
| Pay vs Performance Disclosure, Table |
Pay Versus Performance Table
(1) As noted above, in fiscal year 2022, Mr. Richard Robinson served as PEO for approximately 5 days, until he unexpectedly passed away on June 5, 2021 and Mr. Peter Warwick served as PEO beginning August 1, 2021. For purpose of this analysis Mr. Robinson’s brief tenure in fiscal 2022 is excluded. (2) The table below provides the adjustments required by Item 402(v) to be made to the SCT totals to determine “compensation actually paid” as reported in the Pay versus Performance Table. “Compensation actually paid” does not necessarily represent amounts actually paid to the executive or necessarily the value that will ultimately be realized under equity awards. Rather, it primarily reflects the changes in fair market value of equity awards during the applicable year. (3) Total Shareholder Return is based on the performance of a $100 investment in the Company made on May 31, 2021 through the last day of each reported fiscal year with the reinvestment of all dividends. (4) Peer Group Total Shareholder Return is based on the performance of a $100 investment in a Company selected peer group made on May 31, 2021 through the last day of each reported fiscal year with the reinvestment of all dividends. The peer group’s total shareholder return presented is weighted according to the stock market capitalizations of the peer group members at the beginning of each fiscal year presented. For the fiscal year 2022, the peer group consisted of Pearson plc, John Wiley & Sons, Inc. and Houghton Mifflin Harcourt. Houghton Mifflin Harcourt ceased being a publicly traded company as of April 8, 2022; therefore, the cumulative total shareholder return presented for fiscal year 2022 reflects the performance of Houghton Mifflin Harcourt from June 1, 2021 to April 7, 2022. Stride, Inc., an education company with a similar level of revenue to the Company, replaced Houghton Mifflin Harcourt in the peer group beginning with fiscal year 2023.
Accordingly, the peer group for fiscal years 2023 through 2026 consisted of Pearson plc, John Wiley & Sons, Inc. and Stride, Inc; the cumulative total shareholder return presented in the table for those years reflects the impact of the prior peer groups total cumulative shareholder return for fiscal year 2022.
If the peer group for fiscal 2023 had consisted of Pearson plc, John Wiley & Sons, Inc. and Houghton Mifflin Harcourt (through April 7, 2022 only), the cumulative total shareholder return of a $100 investment made on May 31, 2021 would have been $91.82, $111.66, $145.29 and $142.36 for fiscal years 2023, 2024, 2025 and 2026, respectively.
If the peer group for fiscal year 2022 had consisted of Pearson PLC, John Wiley & Sons, Inc. and Stride, Inc., the cumulative total shareholder return would have been $89.78, $86.20, $111.95, $168.49 and $142.90 for fiscal years 2022, 2023, 2024, 2025, and 2026 respectively. |
||||||||||||||||||||||||||||||||||||||||||||||||||||||||||||||||||||||||||||||||||||||||||||||||||||||||||||||||||||||||||||||||||||||||||||||||||||||||||||||||||||||||||||||||||||||||||||||||||
| Company Selected Measure Name | Operating Income/ (Loss) | ||||||||||||||||||||||||||||||||||||||||||||||||||||||||||||||||||||||||||||||||||||||||||||||||||||||||||||||||||||||||||||||||||||||||||||||||||||||||||||||||||||||||||||||||||||||||||||||||||
| Named Executive Officers, Footnote | For purposes of the Pay Versus Performance Table, the PEOs and other NEOs for the applicable years were as follows:
• For fiscal year 2022, Mr. Richard Robinson served as PEO for approximately 5 days, until he unexpectedly passed away on June 5, 2021, and consequentially is not reflected in the table below. Mr. Peter Warwick has served as PEO beginning August 1, 2021. The other NEOs for fiscal 2022 were Mr. Kenneth Cleary, Ms. Iole Lucchese, Ms. Rosamund Else-Mitchell and Ms. Sasha Quinton. • For fiscal year 2023, Mr. Peter Warwick served as PEO and Mr. Kenneth Cleary, Ms. Iole Lucchese, Ms. Rosamund Else-Mitchell and Ms. Sasha Quinton served as the other NEOs. • For fiscal year 2024, Mr. Peter Warwick served as PEO and Mr. Haji Glover (who joined the Company as the chief financial officer as of January 22, 2024), Mr. Kenneth Cleary (who served as the chief financial officer until January 22, 2024, when he transitioned to President, International), Ms. Iole Lucchese, Ms. Sasha Quinton and Mr. Andrew Hedden served as the other NEOs. •
For fiscal years 2025 and 2026, Mr. Peter Warwick served as PEO and Mr. Haji Glover, Mr. Jeffrey Mathews, Ms. Iole Lucchese, and Ms. Sasha Quinton served as the other NEOs. |
||||||||||||||||||||||||||||||||||||||||||||||||||||||||||||||||||||||||||||||||||||||||||||||||||||||||||||||||||||||||||||||||||||||||||||||||||||||||||||||||||||||||||||||||||||||||||||||||||
| Peer Group Issuers, Footnote | (4) Peer Group Total Shareholder Return is based on the performance of a $100 investment in a Company selected peer group made on May 31, 2021 through the last day of each reported fiscal year with the reinvestment of all dividends. The peer group’s total shareholder return presented is weighted according to the stock market capitalizations of the peer group members at the beginning of each fiscal year presented. For the fiscal year 2022, the peer group consisted of Pearson plc, John Wiley & Sons, Inc. and Houghton Mifflin Harcourt. Houghton Mifflin Harcourt ceased being a publicly traded company as of April 8, 2022; therefore, the cumulative total shareholder return presented for fiscal year 2022 reflects the performance of Houghton Mifflin Harcourt from June 1, 2021 to April 7, 2022. Stride, Inc., an education company with a similar level of revenue to the Company, replaced Houghton Mifflin Harcourt in the peer group beginning with fiscal year 2023.
Accordingly, the peer group for fiscal years 2023 through 2026 consisted of Pearson plc, John Wiley & Sons, Inc. and Stride, Inc; the cumulative total shareholder return presented in the table for those years reflects the impact of the prior peer groups total cumulative shareholder return for fiscal year 2022.
If the peer group for fiscal 2023 had consisted of Pearson plc, John Wiley & Sons, Inc. and Houghton Mifflin Harcourt (through April 7, 2022 only), the cumulative total shareholder return of a $100 investment made on May 31, 2021 would have been $91.82, $111.66, $145.29 and $142.36 for fiscal years 2023, 2024, 2025 and 2026, respectively.
If the peer group for fiscal year 2022 had consisted of Pearson PLC, John Wiley & Sons, Inc. and Stride, Inc., the cumulative total shareholder return would have been $89.78, $86.20, $111.95, $168.49 and $142.90 for fiscal years 2022, 2023, 2024, 2025, and 2026 respectively. |
||||||||||||||||||||||||||||||||||||||||||||||||||||||||||||||||||||||||||||||||||||||||||||||||||||||||||||||||||||||||||||||||||||||||||||||||||||||||||||||||||||||||||||||||||||||||||||||||||
| Changed Peer Group, Footnote | Stride, Inc., an education company with a similar level of revenue to the Company, replaced Houghton Mifflin Harcourt in the peer group beginning with fiscal year 2023. | ||||||||||||||||||||||||||||||||||||||||||||||||||||||||||||||||||||||||||||||||||||||||||||||||||||||||||||||||||||||||||||||||||||||||||||||||||||||||||||||||||||||||||||||||||||||||||||||||||
| PEO Total Compensation Amount | $ 3,742,972 | $ 3,300,513 | $ 2,038,591 | $ 3,300,361 | $ 5,178,808 | ||||||||||||||||||||||||||||||||||||||||||||||||||||||||||||||||||||||||||||||||||||||||||||||||||||||||||||||||||||||||||||||||||||||||||||||||||||||||||||||||||||||||||||||||||||||||||||||
| PEO Actually Paid Compensation Amount | $ 5,379,821 | 2,397,172 | 1,789,890 | 3,844,325 | 5,557,737 | ||||||||||||||||||||||||||||||||||||||||||||||||||||||||||||||||||||||||||||||||||||||||||||||||||||||||||||||||||||||||||||||||||||||||||||||||||||||||||||||||||||||||||||||||||||||||||||||
| Adjustment To PEO Compensation, Footnote | The determination of “compensation actually paid” begins with the total compensation reported in the SCT. In determining compensation actually paid, SEC proxy disclosure rules require that certain adjustments be made to the SCT totals with respect to equity-based and other compensation. For equity-based awards made during the year, the recorded grant date value is replaced with the estimated year-end value. For equity-based awards made in prior years, but paid out during the year, the value at payout is included. And for equity-based awards made in prior years that remain unvested at year-end, the estimated change in value from the beginning to the end of the year is included. For performance-based equity awards, the estimate of year-end value is based upon the “probable outcome” of the performance conditions as of the last day of the fiscal year.
Given the methodology under which “compensation actually paid” is required to be calculated, these amounts are subject to significant fluctuation based on stock price volatility. For discussion of how the HRCC assessed Company performance and the compensation of the NEOs, see “Compensation Discussion and Analysis.”
(1) Amounts for fiscal year 2023 have been updated to reflect STIP bonus amounts for fiscal 2023. (2)
There was no change in pension values during the fiscal year and no pension service costs; accordingly, no adjustment has been included. |
||||||||||||||||||||||||||||||||||||||||||||||||||||||||||||||||||||||||||||||||||||||||||||||||||||||||||||||||||||||||||||||||||||||||||||||||||||||||||||||||||||||||||||||||||||||||||||||||||
| Non-PEO NEO Average Total Compensation Amount | $ 2,169,087 | 1,965,682 | 1,197,289 | 1,602,983 | 1,762,021 | ||||||||||||||||||||||||||||||||||||||||||||||||||||||||||||||||||||||||||||||||||||||||||||||||||||||||||||||||||||||||||||||||||||||||||||||||||||||||||||||||||||||||||||||||||||||||||||||
| Non-PEO NEO Average Compensation Actually Paid Amount | $ 3,349,376 | 1,203,180 | 896,796 | 1,908,873 | 2,093,301 | ||||||||||||||||||||||||||||||||||||||||||||||||||||||||||||||||||||||||||||||||||||||||||||||||||||||||||||||||||||||||||||||||||||||||||||||||||||||||||||||||||||||||||||||||||||||||||||||
| Adjustment to Non-PEO NEO Compensation Footnote | The determination of “compensation actually paid” begins with the total compensation reported in the SCT. In determining compensation actually paid, SEC proxy disclosure rules require that certain adjustments be made to the SCT totals with respect to equity-based and other compensation. For equity-based awards made during the year, the recorded grant date value is replaced with the estimated year-end value. For equity-based awards made in prior years, but paid out during the year, the value at payout is included. And for equity-based awards made in prior years that remain unvested at year-end, the estimated change in value from the beginning to the end of the year is included. For performance-based equity awards, the estimate of year-end value is based upon the “probable outcome” of the performance conditions as of the last day of the fiscal year.
Given the methodology under which “compensation actually paid” is required to be calculated, these amounts are subject to significant fluctuation based on stock price volatility. For discussion of how the HRCC assessed Company performance and the compensation of the NEOs, see “Compensation Discussion and Analysis.”
(1) Amounts for fiscal year 2023 have been updated to reflect STIP bonus amounts for fiscal 2023. (2) There was no change in pension values during the fiscal year and no pension service costs; accordingly, no adjustment has been included. |
||||||||||||||||||||||||||||||||||||||||||||||||||||||||||||||||||||||||||||||||||||||||||||||||||||||||||||||||||||||||||||||||||||||||||||||||||||||||||||||||||||||||||||||||||||||||||||||||||
| Compensation Actually Paid vs. Total Shareholder Return | Scholastic TSR vs. Peer Group TSR and Compensation Actually Paid
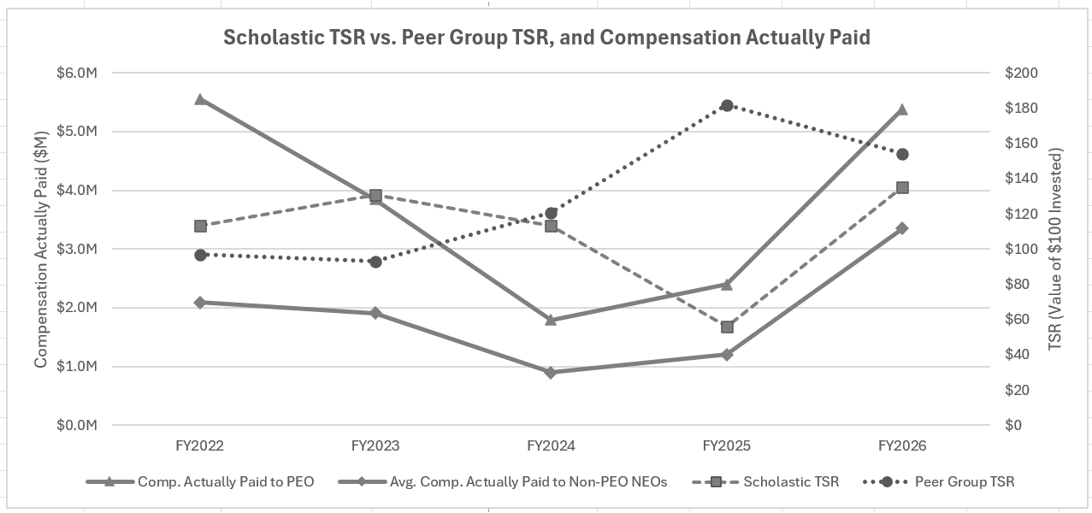
The chart below compares the Company’s cumulative Total Shareholder Return (“TSR”), the cumulative TSR of the peer group, and Compensation Actually Paid (“CAP”) to the Company’s Principal Executive Officer (“PEO”) and the average CAP to the Company’s Non-PEO Named Executive Officers (“NEOs”) for fiscal years 2022 through 2026. During the period presented, the Company’s TSR generally reflected changes in overall Company performance and market conditions, while CAP reflected annual incentive compensation outcomes and changes in the fair value of equity awards required to be included in CAP under Item 402(v) of Regulation S-K. CAP for the PEO and Non-PEO NEOs declined from FY23 through FY24, generally reflecting lower compensation outcomes as Company performance declined. CAP increased in FY25 and increased substantially in FY26, reflecting improved Company performance, higher annual incentive compensation outcomes, and changes in executive responsibilities. As a result of these factors, CAP generally moved in the same direction as TSR over the period presented, although the relationship was not directly proportional in each fiscal year.
|
||||||||||||||||||||||||||||||||||||||||||||||||||||||||||||||||||||||||||||||||||||||||||||||||||||||||||||||||||||||||||||||||||||||||||||||||||||||||||||||||||||||||||||||||||||||||||||||||||
| Compensation Actually Paid vs. Net Income | Scholastic Compensation Actually Paid Versus GAAP Net Income
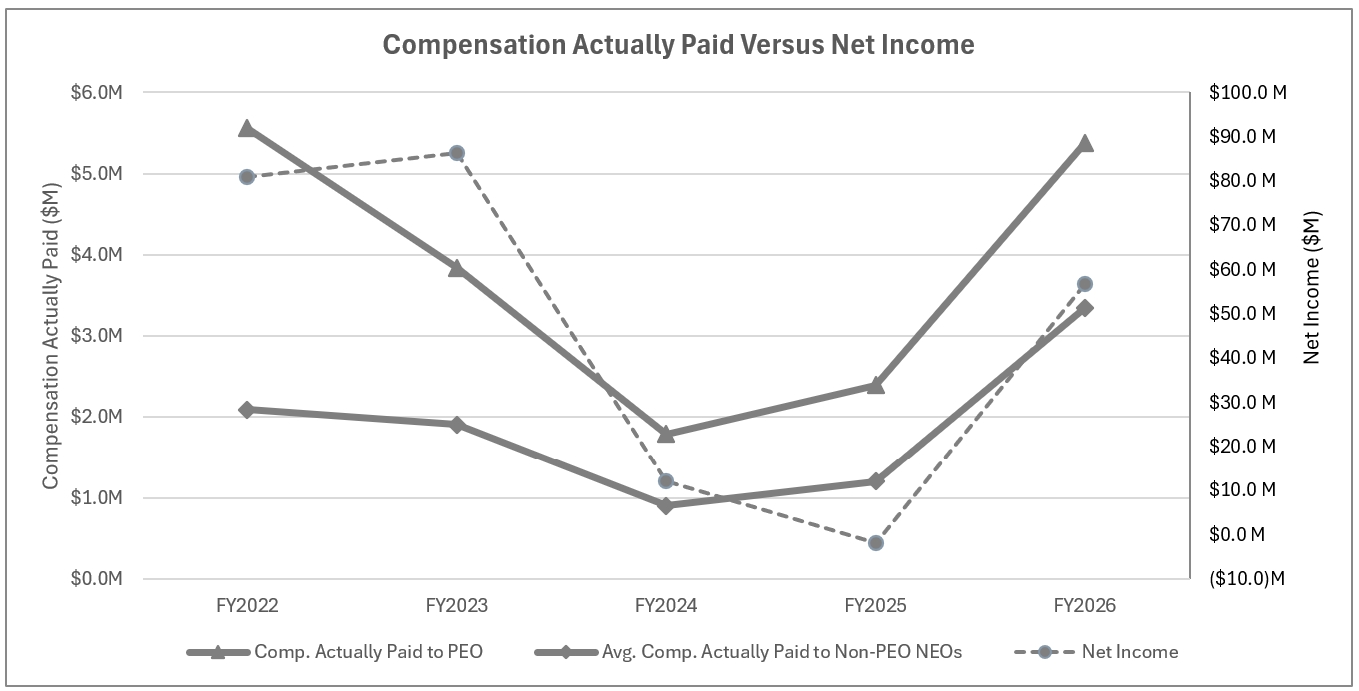
The chart below compares GAAP Net Income and CAP for the PEO and Non-PEO NEOs for fiscal years 2022 through 2026. Although Net Income is not a performance measure used directly to determine compensation under the Company’s executive compensation program, it reflects certain aspects of the Company’s overall financial performance that may affect compensation outcomes. CAP generally tracked the overall trend of Net Income during the period presented. Net Income declined from $86.3 million in FY23 to $12.1 million in FY24 and a net loss of $1.9 million in FY25, while CAP for both the PEO and Non-PEO NEOs also declined over that period. Net Income improved to $56.7 million in FY26, and CAP increased significantly in the same fiscal year. Differences between year-to-year changes in Net Income and CAP reflect the impact of annual incentive compensation outcomes, leadership transitions, changes in executive responsibilities, and adjustments to the fair value of equity awards required to be included in CAP under SEC rules. Consequently, CAP does not necessarily increase or decrease proportionately with changes in Net Income.
|
||||||||||||||||||||||||||||||||||||||||||||||||||||||||||||||||||||||||||||||||||||||||||||||||||||||||||||||||||||||||||||||||||||||||||||||||||||||||||||||||||||||||||||||||||||||||||||||||||
| Compensation Actually Paid vs. Company Selected Measure | Scholastic Compensation Actually Paid Versus GAAP Operating Income (Company Selected Measure)
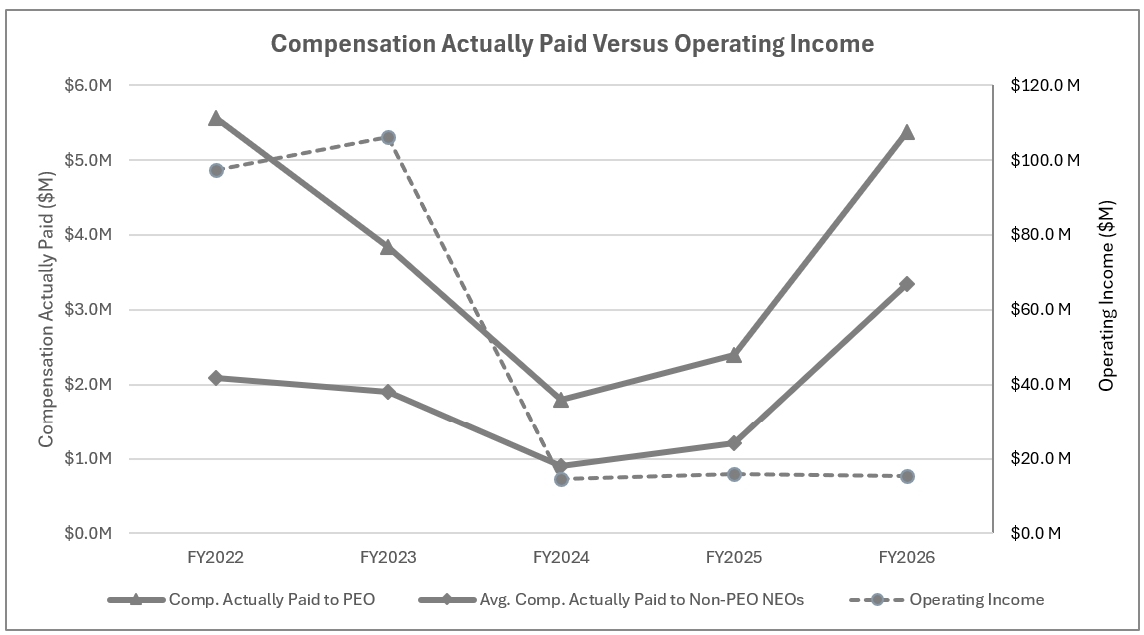
The chart below compares GAAP Operating Income and CAP for the PEO and Non-PEO NEOs for fiscal years 2022 through 2026. Operating Income is a component of the Company’s annual incentive compensation program and therefore influences a portion of executive compensation outcomes. Operating Income declined from $106.3 million in FY23 to approximately $15.0 million in FY24 and remained relatively consistent during FY25 and FY26. CAP for the PEO and Non-PEO NEOs similarly declined through FY24 but increased in FY25 and increased substantially in FY26 despite relatively stable Operating Income levels during those years. The divergence between CAP and Operating Income in FY25 and FY26 primarily reflects changes in annual incentive compensation outcomes, changes in executive responsibilities, and adjustments to the fair value of equity awards required to be included in CAP under Item 402(v) of Regulation S-K. Accordingly, CAP may not move directly with changes in Operating Income in any particular fiscal year.
|
||||||||||||||||||||||||||||||||||||||||||||||||||||||||||||||||||||||||||||||||||||||||||||||||||||||||||||||||||||||||||||||||||||||||||||||||||||||||||||||||||||||||||||||||||||||||||||||||||
| Total Shareholder Return Vs Peer Group | Scholastic TSR vs. Peer Group TSR and Compensation Actually Paid
The chart below compares the Company’s cumulative Total Shareholder Return (“TSR”), the cumulative TSR of the peer group, and Compensation Actually Paid (“CAP”) to the Company’s Principal Executive Officer (“PEO”) and the average CAP to the Company’s Non-PEO Named Executive Officers (“NEOs”) for fiscal years 2022 through 2026. During the period presented, the Company’s TSR generally reflected changes in overall Company performance and market conditions, while CAP reflected annual incentive compensation outcomes and changes in the fair value of equity awards required to be included in CAP under Item 402(v) of Regulation S-K. CAP for the PEO and Non-PEO NEOs declined from FY23 through FY24, generally reflecting lower compensation outcomes as Company performance declined. CAP increased in FY25 and increased substantially in FY26, reflecting improved Company performance, higher annual incentive compensation outcomes, and changes in executive responsibilities. As a result of these factors, CAP generally moved in the same direction as TSR over the period presented, although the relationship was not directly proportional in each fiscal year.
|
||||||||||||||||||||||||||||||||||||||||||||||||||||||||||||||||||||||||||||||||||||||||||||||||||||||||||||||||||||||||||||||||||||||||||||||||||||||||||||||||||||||||||||||||||||||||||||||||||
| Tabular List, Table | Required Tabular Disclosure of Most Important Measures for 2026
The most important financial and non-financial performance measures used by us to link compensation actually paid to our NEOs for the most recently completed fiscal year to our performance are set forth below. For further information regarding these performance metrics and their function in our executive compensation program, please see “Compensation Discussion and Analysis”.
Operating Income Net Income Company TSR STIP Funding
Corporate Operating Income targets, Divisional Operating Income targets (for business units) and Departmental Budget Objectives (for staff positions) and agreed individual goals are used to determine the funding of and payouts under the STIP as described above under “Compensation Discussion and Analysis.” Corporate Operating Income, Division Operating Income and Department Budget Objectives are each non-GAAP measures that are defined above under “Compensation and Discussion Analysis – Fiscal 2026 STIP Bonuses.” |
||||||||||||||||||||||||||||||||||||||||||||||||||||||||||||||||||||||||||||||||||||||||||||||||||||||||||||||||||||||||||||||||||||||||||||||||||||||||||||||||||||||||||||||||||||||||||||||||||
| Total Shareholder Return Amount | $ 135.25 | 56.23 | 113.12 | 130.75 | 113.31 | ||||||||||||||||||||||||||||||||||||||||||||||||||||||||||||||||||||||||||||||||||||||||||||||||||||||||||||||||||||||||||||||||||||||||||||||||||||||||||||||||||||||||||||||||||||||||||||||
| Peer Group Total Shareholder Return Amount | 154.18 | 181.79 | 120.79 | 93 | 96.87 | ||||||||||||||||||||||||||||||||||||||||||||||||||||||||||||||||||||||||||||||||||||||||||||||||||||||||||||||||||||||||||||||||||||||||||||||||||||||||||||||||||||||||||||||||||||||||||||||
| Net Income (Loss) | $ 56,731,588 | $ (1,887,295) | $ 12,126,191 | $ 86,322,599 | $ 80,915,979 | ||||||||||||||||||||||||||||||||||||||||||||||||||||||||||||||||||||||||||||||||||||||||||||||||||||||||||||||||||||||||||||||||||||||||||||||||||||||||||||||||||||||||||||||||||||||||||||||
| Company Selected Measure Amount | 15,240,486 | 15,794,114 | 14,550,314 | 106,294,472 | 97,377,254 | ||||||||||||||||||||||||||||||||||||||||||||||||||||||||||||||||||||||||||||||||||||||||||||||||||||||||||||||||||||||||||||||||||||||||||||||||||||||||||||||||||||||||||||||||||||||||||||||
| PEO Name | Mr. Richard Robinson | Mr. Peter Warwick has | Mr. Peter Warwick | Mr. Peter Warwick | Mr. Peter Warwick | Mr. Peter Warwick | |||||||||||||||||||||||||||||||||||||||||||||||||||||||||||||||||||||||||||||||||||||||||||||||||||||||||||||||||||||||||||||||||||||||||||||||||||||||||||||||||||||||||||||||||||||||||||||
| Measure:: 1 | |||||||||||||||||||||||||||||||||||||||||||||||||||||||||||||||||||||||||||||||||||||||||||||||||||||||||||||||||||||||||||||||||||||||||||||||||||||||||||||||||||||||||||||||||||||||||||||||||||
| Pay vs Performance Disclosure | |||||||||||||||||||||||||||||||||||||||||||||||||||||||||||||||||||||||||||||||||||||||||||||||||||||||||||||||||||||||||||||||||||||||||||||||||||||||||||||||||||||||||||||||||||||||||||||||||||
| Name | Operating Income | ||||||||||||||||||||||||||||||||||||||||||||||||||||||||||||||||||||||||||||||||||||||||||||||||||||||||||||||||||||||||||||||||||||||||||||||||||||||||||||||||||||||||||||||||||||||||||||||||||
| Measure:: 2 | |||||||||||||||||||||||||||||||||||||||||||||||||||||||||||||||||||||||||||||||||||||||||||||||||||||||||||||||||||||||||||||||||||||||||||||||||||||||||||||||||||||||||||||||||||||||||||||||||||
| Pay vs Performance Disclosure | |||||||||||||||||||||||||||||||||||||||||||||||||||||||||||||||||||||||||||||||||||||||||||||||||||||||||||||||||||||||||||||||||||||||||||||||||||||||||||||||||||||||||||||||||||||||||||||||||||
| Name | Net Income | ||||||||||||||||||||||||||||||||||||||||||||||||||||||||||||||||||||||||||||||||||||||||||||||||||||||||||||||||||||||||||||||||||||||||||||||||||||||||||||||||||||||||||||||||||||||||||||||||||
| Measure:: 3 | |||||||||||||||||||||||||||||||||||||||||||||||||||||||||||||||||||||||||||||||||||||||||||||||||||||||||||||||||||||||||||||||||||||||||||||||||||||||||||||||||||||||||||||||||||||||||||||||||||
| Pay vs Performance Disclosure | |||||||||||||||||||||||||||||||||||||||||||||||||||||||||||||||||||||||||||||||||||||||||||||||||||||||||||||||||||||||||||||||||||||||||||||||||||||||||||||||||||||||||||||||||||||||||||||||||||
| Name | Company TSR | ||||||||||||||||||||||||||||||||||||||||||||||||||||||||||||||||||||||||||||||||||||||||||||||||||||||||||||||||||||||||||||||||||||||||||||||||||||||||||||||||||||||||||||||||||||||||||||||||||
| PEO | Aggregate Grant Date Fair Value of Equity Award Amounts Reported in Summary Compensation Table | |||||||||||||||||||||||||||||||||||||||||||||||||||||||||||||||||||||||||||||||||||||||||||||||||||||||||||||||||||||||||||||||||||||||||||||||||||||||||||||||||||||||||||||||||||||||||||||||||||
| Pay vs Performance Disclosure | |||||||||||||||||||||||||||||||||||||||||||||||||||||||||||||||||||||||||||||||||||||||||||||||||||||||||||||||||||||||||||||||||||||||||||||||||||||||||||||||||||||||||||||||||||||||||||||||||||
| Adjustment to Compensation, Amount | $ (1,499,994) | $ (1,499,987) | $ (999,965) | $ (999,966) | $ (2,500,020) | ||||||||||||||||||||||||||||||||||||||||||||||||||||||||||||||||||||||||||||||||||||||||||||||||||||||||||||||||||||||||||||||||||||||||||||||||||||||||||||||||||||||||||||||||||||||||||||||
| PEO | Year-end Fair Value of Equity Awards Granted in Covered Year that are Outstanding and Unvested | |||||||||||||||||||||||||||||||||||||||||||||||||||||||||||||||||||||||||||||||||||||||||||||||||||||||||||||||||||||||||||||||||||||||||||||||||||||||||||||||||||||||||||||||||||||||||||||||||||
| Pay vs Performance Disclosure | |||||||||||||||||||||||||||||||||||||||||||||||||||||||||||||||||||||||||||||||||||||||||||||||||||||||||||||||||||||||||||||||||||||||||||||||||||||||||||||||||||||||||||||||||||||||||||||||||||
| Adjustment to Compensation, Amount | 2,958,414 | 666,744 | 879,402 | 1,206,092 | 2,874,060 | ||||||||||||||||||||||||||||||||||||||||||||||||||||||||||||||||||||||||||||||||||||||||||||||||||||||||||||||||||||||||||||||||||||||||||||||||||||||||||||||||||||||||||||||||||||||||||||||
| PEO | Year-over-Year Change in Fair Value of Equity Awards Granted in Prior Years That are Outstanding and Unvested | |||||||||||||||||||||||||||||||||||||||||||||||||||||||||||||||||||||||||||||||||||||||||||||||||||||||||||||||||||||||||||||||||||||||||||||||||||||||||||||||||||||||||||||||||||||||||||||||||||
| Pay vs Performance Disclosure | |||||||||||||||||||||||||||||||||||||||||||||||||||||||||||||||||||||||||||||||||||||||||||||||||||||||||||||||||||||||||||||||||||||||||||||||||||||||||||||||||||||||||||||||||||||||||||||||||||
| Adjustment to Compensation, Amount | 0 | (0) | (122,819) | 214,702 | 0 | ||||||||||||||||||||||||||||||||||||||||||||||||||||||||||||||||||||||||||||||||||||||||||||||||||||||||||||||||||||||||||||||||||||||||||||||||||||||||||||||||||||||||||||||||||||||||||||||
| PEO | Vesting Date Fair Value of Equity Awards Granted and Vested in Covered Year | |||||||||||||||||||||||||||||||||||||||||||||||||||||||||||||||||||||||||||||||||||||||||||||||||||||||||||||||||||||||||||||||||||||||||||||||||||||||||||||||||||||||||||||||||||||||||||||||||||
| Pay vs Performance Disclosure | |||||||||||||||||||||||||||||||||||||||||||||||||||||||||||||||||||||||||||||||||||||||||||||||||||||||||||||||||||||||||||||||||||||||||||||||||||||||||||||||||||||||||||||||||||||||||||||||||||
| Adjustment to Compensation, Amount | 0 | 0 | 0 | 0 | 0 | ||||||||||||||||||||||||||||||||||||||||||||||||||||||||||||||||||||||||||||||||||||||||||||||||||||||||||||||||||||||||||||||||||||||||||||||||||||||||||||||||||||||||||||||||||||||||||||||
| PEO | Change in Fair Value as of Vesting Date of Prior Year Equity Awards Vested in Covered Year | |||||||||||||||||||||||||||||||||||||||||||||||||||||||||||||||||||||||||||||||||||||||||||||||||||||||||||||||||||||||||||||||||||||||||||||||||||||||||||||||||||||||||||||||||||||||||||||||||||
| Pay vs Performance Disclosure | |||||||||||||||||||||||||||||||||||||||||||||||||||||||||||||||||||||||||||||||||||||||||||||||||||||||||||||||||||||||||||||||||||||||||||||||||||||||||||||||||||||||||||||||||||||||||||||||||||
| Adjustment to Compensation, Amount | 178,429 | (70,097) | (5,319) | 123,136 | 4,889 | ||||||||||||||||||||||||||||||||||||||||||||||||||||||||||||||||||||||||||||||||||||||||||||||||||||||||||||||||||||||||||||||||||||||||||||||||||||||||||||||||||||||||||||||||||||||||||||||
| PEO | Prior Year End Fair Value of Equity Awards Granted in Any Prior Year that Fail to Meet Applicable Vesting Conditions During Covered Year | |||||||||||||||||||||||||||||||||||||||||||||||||||||||||||||||||||||||||||||||||||||||||||||||||||||||||||||||||||||||||||||||||||||||||||||||||||||||||||||||||||||||||||||||||||||||||||||||||||
| Pay vs Performance Disclosure | |||||||||||||||||||||||||||||||||||||||||||||||||||||||||||||||||||||||||||||||||||||||||||||||||||||||||||||||||||||||||||||||||||||||||||||||||||||||||||||||||||||||||||||||||||||||||||||||||||
| Adjustment to Compensation, Amount | 0 | 0 | 0 | 0 | 0 | ||||||||||||||||||||||||||||||||||||||||||||||||||||||||||||||||||||||||||||||||||||||||||||||||||||||||||||||||||||||||||||||||||||||||||||||||||||||||||||||||||||||||||||||||||||||||||||||
| Non-PEO NEO | Aggregate Grant Date Fair Value of Equity Award Amounts Reported in Summary Compensation Table | |||||||||||||||||||||||||||||||||||||||||||||||||||||||||||||||||||||||||||||||||||||||||||||||||||||||||||||||||||||||||||||||||||||||||||||||||||||||||||||||||||||||||||||||||||||||||||||||||||
| Pay vs Performance Disclosure | |||||||||||||||||||||||||||||||||||||||||||||||||||||||||||||||||||||||||||||||||||||||||||||||||||||||||||||||||||||||||||||||||||||||||||||||||||||||||||||||||||||||||||||||||||||||||||||||||||
| Adjustment to Compensation, Amount | (728,736) | (949,972) | (459,998) | (524,990) | (443,750) | ||||||||||||||||||||||||||||||||||||||||||||||||||||||||||||||||||||||||||||||||||||||||||||||||||||||||||||||||||||||||||||||||||||||||||||||||||||||||||||||||||||||||||||||||||||||||||||||
| Non-PEO NEO | Year-end Fair Value of Equity Awards Granted in Covered Year that are Outstanding and Unvested | |||||||||||||||||||||||||||||||||||||||||||||||||||||||||||||||||||||||||||||||||||||||||||||||||||||||||||||||||||||||||||||||||||||||||||||||||||||||||||||||||||||||||||||||||||||||||||||||||||
| Pay vs Performance Disclosure | |||||||||||||||||||||||||||||||||||||||||||||||||||||||||||||||||||||||||||||||||||||||||||||||||||||||||||||||||||||||||||||||||||||||||||||||||||||||||||||||||||||||||||||||||||||||||||||||||||
| Adjustment to Compensation, Amount | 1,122,976 | 513,686 | 434,869 | 529,499 | 541,228 | ||||||||||||||||||||||||||||||||||||||||||||||||||||||||||||||||||||||||||||||||||||||||||||||||||||||||||||||||||||||||||||||||||||||||||||||||||||||||||||||||||||||||||||||||||||||||||||||
| Non-PEO NEO | Year-over-Year Change in Fair Value of Equity Awards Granted in Prior Years That are Outstanding and Unvested | |||||||||||||||||||||||||||||||||||||||||||||||||||||||||||||||||||||||||||||||||||||||||||||||||||||||||||||||||||||||||||||||||||||||||||||||||||||||||||||||||||||||||||||||||||||||||||||||||||
| Pay vs Performance Disclosure | |||||||||||||||||||||||||||||||||||||||||||||||||||||||||||||||||||||||||||||||||||||||||||||||||||||||||||||||||||||||||||||||||||||||||||||||||||||||||||||||||||||||||||||||||||||||||||||||||||
| Adjustment to Compensation, Amount | 654,626 | (248,771) | (97,541) | 180,454 | 198,824 | ||||||||||||||||||||||||||||||||||||||||||||||||||||||||||||||||||||||||||||||||||||||||||||||||||||||||||||||||||||||||||||||||||||||||||||||||||||||||||||||||||||||||||||||||||||||||||||||
| Non-PEO NEO | Vesting Date Fair Value of Equity Awards Granted and Vested in Covered Year | |||||||||||||||||||||||||||||||||||||||||||||||||||||||||||||||||||||||||||||||||||||||||||||||||||||||||||||||||||||||||||||||||||||||||||||||||||||||||||||||||||||||||||||||||||||||||||||||||||
| Pay vs Performance Disclosure | |||||||||||||||||||||||||||||||||||||||||||||||||||||||||||||||||||||||||||||||||||||||||||||||||||||||||||||||||||||||||||||||||||||||||||||||||||||||||||||||||||||||||||||||||||||||||||||||||||
| Adjustment to Compensation, Amount | 0 | 0 | 0 | 0 | 0 | ||||||||||||||||||||||||||||||||||||||||||||||||||||||||||||||||||||||||||||||||||||||||||||||||||||||||||||||||||||||||||||||||||||||||||||||||||||||||||||||||||||||||||||||||||||||||||||||
| Non-PEO NEO | Change in Fair Value as of Vesting Date of Prior Year Equity Awards Vested in Covered Year | |||||||||||||||||||||||||||||||||||||||||||||||||||||||||||||||||||||||||||||||||||||||||||||||||||||||||||||||||||||||||||||||||||||||||||||||||||||||||||||||||||||||||||||||||||||||||||||||||||
| Pay vs Performance Disclosure | |||||||||||||||||||||||||||||||||||||||||||||||||||||||||||||||||||||||||||||||||||||||||||||||||||||||||||||||||||||||||||||||||||||||||||||||||||||||||||||||||||||||||||||||||||||||||||||||||||
| Adjustment to Compensation, Amount | 131,423 | (77,445) | (177,824) | 120,927 | 34,979 | ||||||||||||||||||||||||||||||||||||||||||||||||||||||||||||||||||||||||||||||||||||||||||||||||||||||||||||||||||||||||||||||||||||||||||||||||||||||||||||||||||||||||||||||||||||||||||||||
| Non-PEO NEO | Prior Year End Fair Value of Equity Awards Granted in Any Prior Year that Fail to Meet Applicable Vesting Conditions During Covered Year | |||||||||||||||||||||||||||||||||||||||||||||||||||||||||||||||||||||||||||||||||||||||||||||||||||||||||||||||||||||||||||||||||||||||||||||||||||||||||||||||||||||||||||||||||||||||||||||||||||
| Pay vs Performance Disclosure | |||||||||||||||||||||||||||||||||||||||||||||||||||||||||||||||||||||||||||||||||||||||||||||||||||||||||||||||||||||||||||||||||||||||||||||||||||||||||||||||||||||||||||||||||||||||||||||||||||
| Adjustment to Compensation, Amount | $ 0 | $ 0 | $ 0 | $ 0 | $ 0 | ||||||||||||||||||||||||||||||||||||||||||||||||||||||||||||||||||||||||||||||||||||||||||||||||||||||||||||||||||||||||||||||||||||||||||||||||||||||||||||||||||||||||||||||||||||||||||||||