Summary | Average | Value of Initial Fixed |
| ||||||||||||||||||||||
Compensation | Summary | Average | $100 Investment |
| |||||||||||||||||||||
Table Total for | Compensation | Compensation | Based On: | Adjusted |
| ||||||||||||||||||||
Principal | Table Total for | Actually Paid to | Total | Peer Group | EBITDA |
| |||||||||||||||||||
Executive | Compensation | Non-PEO Named | Non-PEO Named | Shareholder | Total | Net (loss) | (non-GAAP) |
| |||||||||||||||||
Officer (PEO) | Actually Paid to | Executive | Executive Officers | Return | Shareholder | income | ($ in millions) | ||||||||||||||||||
Year | | | ($) (1) | | | PEO ($) (3) | | | Officers ($) (2) | | | ($) (3) | | | ($) | | | Return ($) (4) | | | ($ in millions) | | | (5) |
|
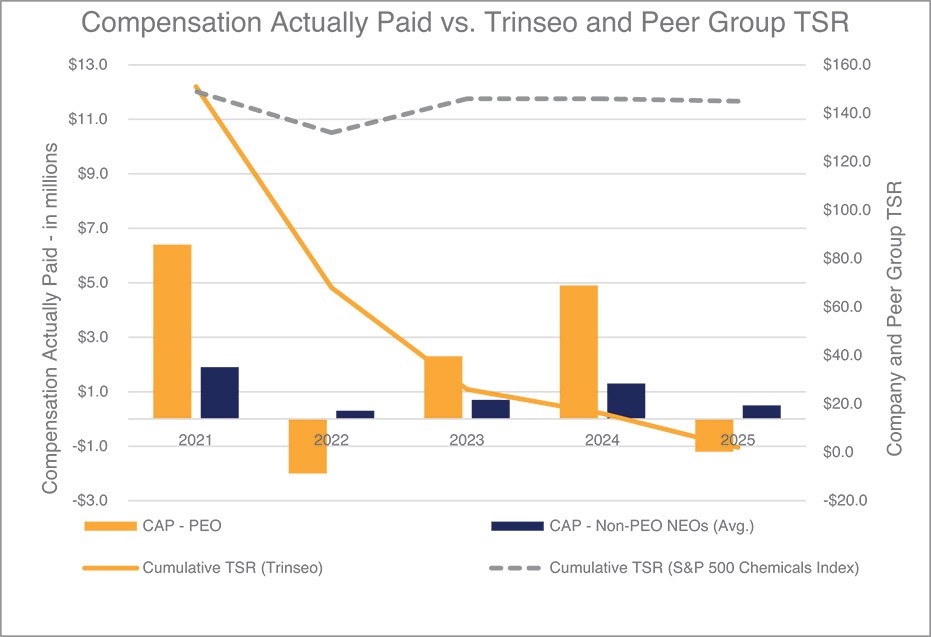
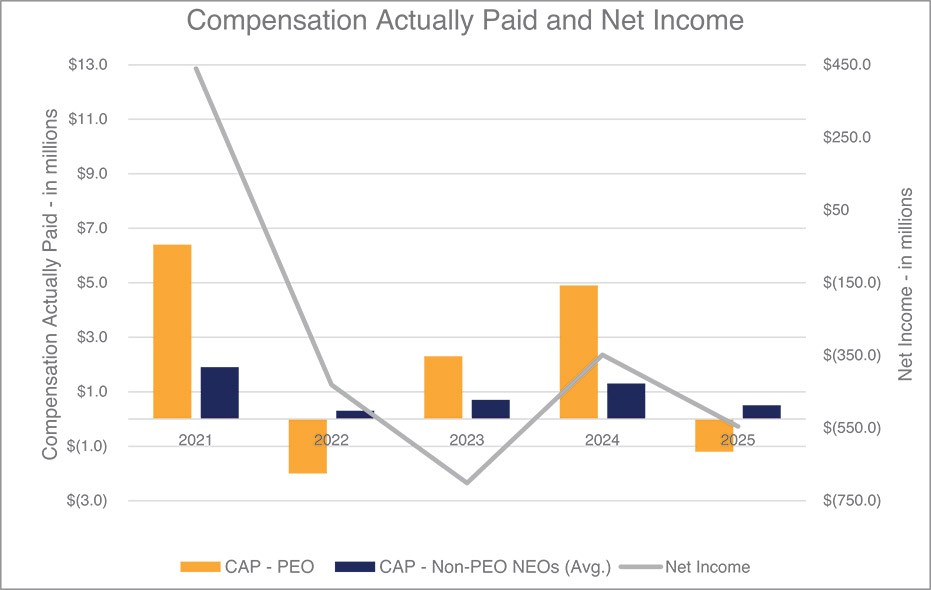
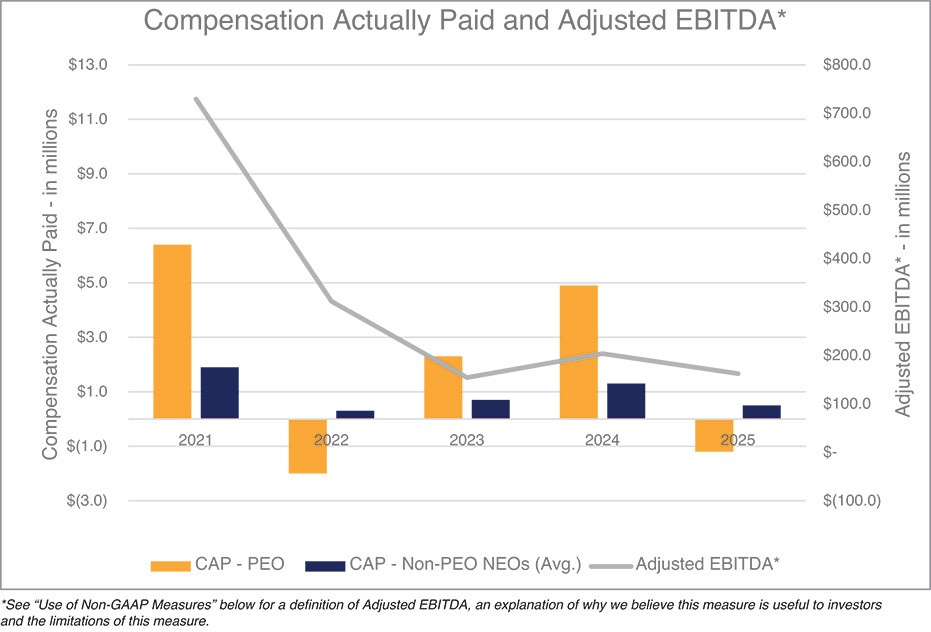
2025 | 5,358,983 | (1,220,529) | 1,984,661 | 545,114 | 2 | 145 | (545.6) | 162.5 | |||||||||||||||||
2024 |
| 5,423,299 |
| 4,947,052 |
| 1,562,968 |
| 1,275,165 |
| 16 |
| 146 |
| (348.5) |
| 203.7 | |||||||||
2023 |
| 5,779,845 |
| 2,320,488 |
| 1,923,323 |
| 749,722 |
| 26 |
| 146 |
| (701.3) |
| 154.3 | |||||||||
2022 |
| 5,793,583 |
| (1,961,363) |
| 1,561,047 |
| 305,441 |
| 68 |
| 132 |
| (430.9) |
| 311.7 | |||||||||
2021 |
| 7,001,892 |
| 6,409,637 |
| 1,747,866 |
| 1,868,496 |
| 151 |
| 149 |
| 440.0 |
| 729.4 | |||||||||
| (1) | Mr. Bozich served as the Company’s PEO (President and CEO) for each year presented. |
| (2) | The Company’s Non-PEO NEOs were: (i) in 2025, Mr. Stasse, Mr. Chaclas, Ms. Van Kessel and Ms. Reverberi; (ii) in 2024, Mr. Stasse, Ms. Reverberi, Mr. Chaclas and Ms. Cooney; (iii) in 2023, Mr. Stasse, Mr. Chaclas, Ms. Cooney and Han Hendriks, and Andre Lanning (as former NEO); (iv) in 2022, Mr. Stasse, Mr. Chaclas, Andre Lanning and Ms. Cooney and (v) in 2021, Mr. Stasse, Mr. Chaclas, Andre Lanning and Ms. Reverberi. |
| (3) | The following table provides additional information as to the amounts deducted from and added to Summary Compensation Table (“SCT”) total compensation for the applicable year pursuant to Item 402(v) of Regulation S-K to determine “compensation actually paid” to the PEO and Non-PEO NEOs: |
PEO (a) | | | 2025 | | | 2024 | | | 2023 | | | 2022 | | | 2021 |
| |||||
Summary Compensation Table – Total Compensation | $ | 5,358,983 | $ | 5,423,299 | $ | 5,779,845 | $ | 5,793,583 | $ | 7,001,892 | |||||||||||
Subtract fair value of stock awards and options awards granted in fiscal year | $ | (4,161,228) | $ | (2,991,139) | $ | (4,127,971) | $ | (3,959,041) | $ | (3,587,469) | |||||||||||
Add fair value of current-year equity awards outstanding and unvested as of year-end | $ | 377,130 | $ | 3,492,354 | $ | 1,071,413 | $ | 1,141,272 | $ | 2,944,350 | |||||||||||
Add fair value of current-year equity awards that vested during the fiscal year | $ | 0 | $ | 0 | $ | 0 | $ | 0 | $ | 0 | |||||||||||
Add/subtract change in fair value of prior-year equity awards | $ | (2,763,394) | $ | (684,680) | $ | (1,111,075) | $ | (5,226,633) | $ | (635,819) | |||||||||||
Add/subtract change in fair value as of vesting date of prior-year equity awards vested during fiscal year | $ | 89,468 | $ | (144,590) | $ | 807,733 | $ | 473,289 | $ | 686,682 | |||||||||||
Subtract fair value of prior-year awards forfeited during fiscal year | $ | (121,489) | $ | (148,192) | $ | (99,457) | $ | (183,833) | $ | 0 | |||||||||||
Compensation Actually Paid | $ | (1,220,529) | $ | 4,947,052 | $ | 2,320,488 | $ | (1,961,363) | $ | 6,409,637 | |||||||||||
Average Non-PEO Named Executive Officers (a) | | | 2025 | | | 2024 | | | 2023 | | | 2022 | | | 2021 |
| |||||
Summary Compensation Table – Average Total Compensation | $ | 1,984,661 | $ | 1,562,968 | $ | 1,923,323 | $ | 1,561,047 | $ | 1,747,866 | |||||||||||
Subtract fair value of stock awards and options awards granted in fiscal year | $ | (811,940) | $ | (532,621) | $ | (1,067,944) | $ | (777,406) | $ | (600,379) | |||||||||||
Add fair value of current-year equity awards outstanding and unvested as of year-end | $ | 78,574 | $ | 603,086 | $ | 290,243 | $ | 224,104 | $ | 492,497 | |||||||||||
Add fair value of current-year equity awards that vested during the fiscal year | $ | 0 | $ | 0 | $ | 0 | $ | 0 | $ | 0 | |||||||||||
Add/subtract change in fair value of prior-year equity awards | $ | (543,313) | $ | (188,895) | $ | (191,378) | $ | (754,874) | $ | 13,556 | |||||||||||
Add/subtract change in fair value as of vesting date of prior-year equity awards vested during fiscal year | $ | 14,187 | $ | (26,303) | $ | 68,982 | $ | 25,904 | $ | 123,014 | |||||||||||
Subtract fair value of prior-year awards forfeited during fiscal year | $ | (13,447) | $ | (12,916) | $ | (10,253) | $ | (5,841) | $ | (24,085) | |||||||||||
Subtract change in present value of accumulated benefit under all defined benefit and actuarial pension plans | $ | (346,579) | $ | (261,449) | $ | (274,313) | $ | (124,783) | $ | (44,879) | |||||||||||
Add pension value attributable to current year and change in pension value attributable to plan amendments made in the current year | $ | 182,970 | $ | 131,296 | $ | 11,061 | $ | 157,290 | $ | 160,906 | |||||||||||
Compensation Actually Paid | $ | 545,114 | $ | 1,275,165 | $ | 749,722 | $ | 305,441 | $ | 1,868,496 | |||||||||||
| (a) | The fair value of equity awards were calculated using valuation assumptions that materially differ from those disclosed at the time of grant, including: (1) the fair value of RSU awards was calculated using the closing price of our ordinary shares as of the last day of the applicable year or on the date of vesting, as applicable; (2) the fair value of PSU awards was estimated using the Monte Carlo Simulation method (which reflects for each particular award and valuation date adjustments for: actual performance, expected volatility, risk-free interest rate, correlation coefficient, and accrued dividends); and (3) the fair value of options was estimated using the Black-Scholes option-pricing model (which reflects, for each particular award and valuation date, adjustments for expected volatility, risk-free interest rate, dividend yield, expected term (calculated using the simplified method) and stock price). |
| (4) | The Company’s peer group is the S&P 500 Chemicals Industry GICS Level 3 Index. This index is the published line-of-business index utilized in the Company’s Annual Report on Form 10-K for the year ended December 31, 2025. |
| (5) | Adjusted EBITDA is our primary non-GAAP financial measure. See “Use of Non-GAAP Measures” below for a definition of Adjusted EBITDA, an explanation of why we believe this measure is useful to investors and the limitations of this measure. |
| (1) | Mr. Bozich served as the Company’s PEO (President and CEO) for each year presented. |
| (2) | The Company’s Non-PEO NEOs were: (i) in 2025, Mr. Stasse, Mr. Chaclas, Ms. Van Kessel and Ms. Reverberi; (ii) in 2024, Mr. Stasse, Ms. Reverberi, Mr. Chaclas and Ms. Cooney; (iii) in 2023, Mr. Stasse, Mr. Chaclas, Ms. Cooney and Han Hendriks, and Andre Lanning (as former NEO); (iv) in 2022, Mr. Stasse, Mr. Chaclas, Andre Lanning and Ms. Cooney and (v) in 2021, Mr. Stasse, Mr. Chaclas, Andre Lanning and Ms. Reverberi. |
| (4) | The Company’s peer group is the S&P 500 Chemicals Industry GICS Level 3 Index. This index is the published line-of-business index utilized in the Company’s Annual Report on Form 10-K for the year ended December 31, 2025. |
| (3) | The following table provides additional information as to the amounts deducted from and added to Summary Compensation Table (“SCT”) total compensation for the applicable year pursuant to Item 402(v) of Regulation S-K to determine “compensation actually paid” to the PEO and Non-PEO NEOs: |
PEO (a) | | | 2025 | | | 2024 | | | 2023 | | | 2022 | | | 2021 |
| |||||
Summary Compensation Table – Total Compensation | $ | 5,358,983 | $ | 5,423,299 | $ | 5,779,845 | $ | 5,793,583 | $ | 7,001,892 | |||||||||||
Subtract fair value of stock awards and options awards granted in fiscal year | $ | (4,161,228) | $ | (2,991,139) | $ | (4,127,971) | $ | (3,959,041) | $ | (3,587,469) | |||||||||||
Add fair value of current-year equity awards outstanding and unvested as of year-end | $ | 377,130 | $ | 3,492,354 | $ | 1,071,413 | $ | 1,141,272 | $ | 2,944,350 | |||||||||||
Add fair value of current-year equity awards that vested during the fiscal year | $ | 0 | $ | 0 | $ | 0 | $ | 0 | $ | 0 | |||||||||||
Add/subtract change in fair value of prior-year equity awards | $ | (2,763,394) | $ | (684,680) | $ | (1,111,075) | $ | (5,226,633) | $ | (635,819) | |||||||||||
Add/subtract change in fair value as of vesting date of prior-year equity awards vested during fiscal year | $ | 89,468 | $ | (144,590) | $ | 807,733 | $ | 473,289 | $ | 686,682 | |||||||||||
Subtract fair value of prior-year awards forfeited during fiscal year | $ | (121,489) | $ | (148,192) | $ | (99,457) | $ | (183,833) | $ | 0 | |||||||||||
Compensation Actually Paid | $ | (1,220,529) | $ | 4,947,052 | $ | 2,320,488 | $ | (1,961,363) | $ | 6,409,637 | |||||||||||
| (a) | The fair value of equity awards were calculated using valuation assumptions that materially differ from those disclosed at the time of grant, including: (1) the fair value of RSU awards was calculated using the closing price of our ordinary shares as of the last day of the applicable year or on the date of vesting, as applicable; (2) the fair value of PSU awards was estimated using the Monte Carlo Simulation method (which reflects for each particular award and valuation date adjustments for: actual performance, expected volatility, risk-free interest rate, correlation coefficient, and accrued dividends); and (3) the fair value of options was estimated using the Black-Scholes option-pricing model (which reflects, for each particular award and valuation date, adjustments for expected volatility, risk-free interest rate, dividend yield, expected term (calculated using the simplified method) and stock price). |
| (3) | The following table provides additional information as to the amounts deducted from and added to Summary Compensation Table (“SCT”) total compensation for the applicable year pursuant to Item 402(v) of Regulation S-K to determine “compensation actually paid” to the PEO and Non-PEO NEOs: |
Average Non-PEO Named Executive Officers (a) | | | 2025 | | | 2024 | | | 2023 | | | 2022 | | | 2021 |
| |||||
Summary Compensation Table – Average Total Compensation | $ | 1,984,661 | $ | 1,562,968 | $ | 1,923,323 | $ | 1,561,047 | $ | 1,747,866 | |||||||||||
Subtract fair value of stock awards and options awards granted in fiscal year | $ | (811,940) | $ | (532,621) | $ | (1,067,944) | $ | (777,406) | $ | (600,379) | |||||||||||
Add fair value of current-year equity awards outstanding and unvested as of year-end | $ | 78,574 | $ | 603,086 | $ | 290,243 | $ | 224,104 | $ | 492,497 | |||||||||||
Add fair value of current-year equity awards that vested during the fiscal year | $ | 0 | $ | 0 | $ | 0 | $ | 0 | $ | 0 | |||||||||||
Add/subtract change in fair value of prior-year equity awards | $ | (543,313) | $ | (188,895) | $ | (191,378) | $ | (754,874) | $ | 13,556 | |||||||||||
Add/subtract change in fair value as of vesting date of prior-year equity awards vested during fiscal year | $ | 14,187 | $ | (26,303) | $ | 68,982 | $ | 25,904 | $ | 123,014 | |||||||||||
Subtract fair value of prior-year awards forfeited during fiscal year | $ | (13,447) | $ | (12,916) | $ | (10,253) | $ | (5,841) | $ | (24,085) | |||||||||||
Subtract change in present value of accumulated benefit under all defined benefit and actuarial pension plans | $ | (346,579) | $ | (261,449) | $ | (274,313) | $ | (124,783) | $ | (44,879) | |||||||||||
Add pension value attributable to current year and change in pension value attributable to plan amendments made in the current year | $ | 182,970 | $ | 131,296 | $ | 11,061 | $ | 157,290 | $ | 160,906 | |||||||||||
Compensation Actually Paid | $ | 545,114 | $ | 1,275,165 | $ | 749,722 | $ | 305,441 | $ | 1,868,496 | |||||||||||
| (a) | The fair value of equity awards were calculated using valuation assumptions that materially differ from those disclosed at the time of grant, including: (1) the fair value of RSU awards was calculated using the closing price of our ordinary shares as of the last day of the applicable year or on the date of vesting, as applicable; (2) the fair value of PSU awards was estimated using the Monte Carlo Simulation method (which reflects for each particular award and valuation date adjustments for: actual performance, expected volatility, risk-free interest rate, correlation coefficient, and accrued dividends); and (3) the fair value of options was estimated using the Black-Scholes option-pricing model (which reflects, for each particular award and valuation date, adjustments for expected volatility, risk-free interest rate, dividend yield, expected term (calculated using the simplified method) and stock price). |
Most Important Financial Measures
Below is an unranked list of the most important financial measures the Company used during 2025 to link Company performance to executive compensation actually paid.
Adjusted EBITDA* |
Free Cash Flow* |
Capital Expenditures |
Total Shareholder Return |
* See “Use of Non-GAAP Measures” below for a reconciliation of Adjusted EBITDA and Free Cash Flow, which are non-GAAP measures, to Net Income (Loss) and Cash provided by operating activities.
| (5) | Adjusted EBITDA is our primary non-GAAP financial measure. See “Use of Non-GAAP Measures” below for a definition of Adjusted EBITDA, an explanation of why we believe this measure is useful to investors and the limitations of this measure. |