Shareholder Report
May 31, 2026
USD ($)
$ / shares
WHAT WERE THE FUND COSTS FOR THE LAST SIX MONTHS? (based on a hypothetical $10,000 investment)
|
Class Name
|
Costs of a $10,000 investment
|
Costs paid as a percentage of a $10,000 investment*
|
|
Class A
|
$65
|
1.25%
|
HOW DID THE FUND PERFORM DURING THE LAST SIX MONTHS AND WHAT AFFECTED ITS PERFORMANCE?
The MSCI ACWI Net Total Return Index returned 13.32% versus the Fund’s Class A shares return of 8.63% (without sales charges) for the six-month period ended May 31, 2026. The Fund underperformed due to stock selection within the Information Technology and Industrials sectors. Trimble (TRMB US ) within the Information Technology sector was the top detracting position during the period potentially pressured by multiple compression driven by AI disruption fears across its basket of software names. Financials and Consumer Staples were the top contributing sectors due primarily to stock selection effects. StoneX Group (SNEX US), a global brokerage and financial services firm, was the top contributor, potentially benefiting from heightened market volatility and shifting expectations for short term interest rates amid renewed inflation concerns.
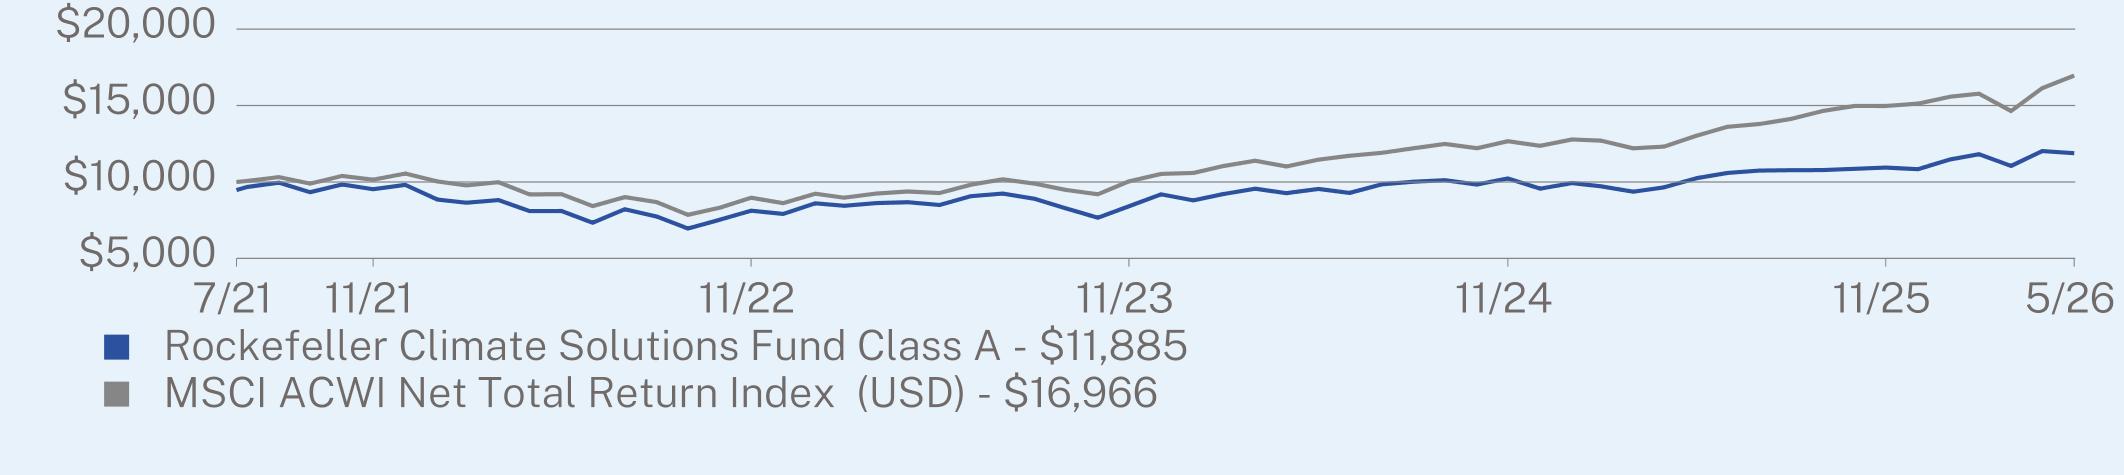
ANNUAL AVERAGE TOTAL RETURN (%)
|
|
1 Year
|
Since Inception
(07/21/2021) |
|
Class A (without sales charge)
|
16.03
|
4.77
|
|
Class A (with maximum 5.25% sales charge)
|
9.94
|
3.62
|
|
MSCI ACWI Net Total Return Index (USD)
|
30.27
|
11.49
|
Visit https://www.rockefellerfunds.com/equity-funds/ for more recent performance information.
KEY FUND STATISTICS (as of May 31, 2026)
|
Net Assets
|
$72,855,760
|
|
Number of Holdings
|
53
|
|
Portfolio Turnover
|
12%
|
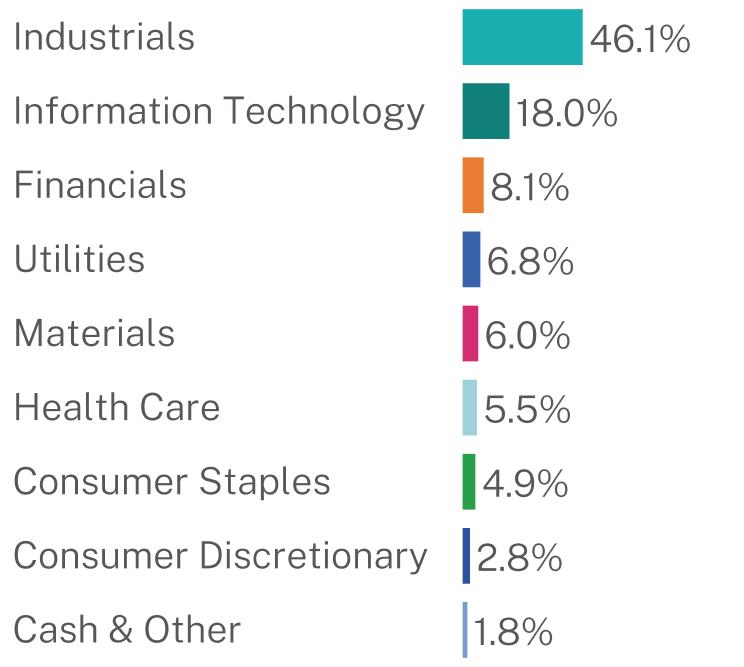
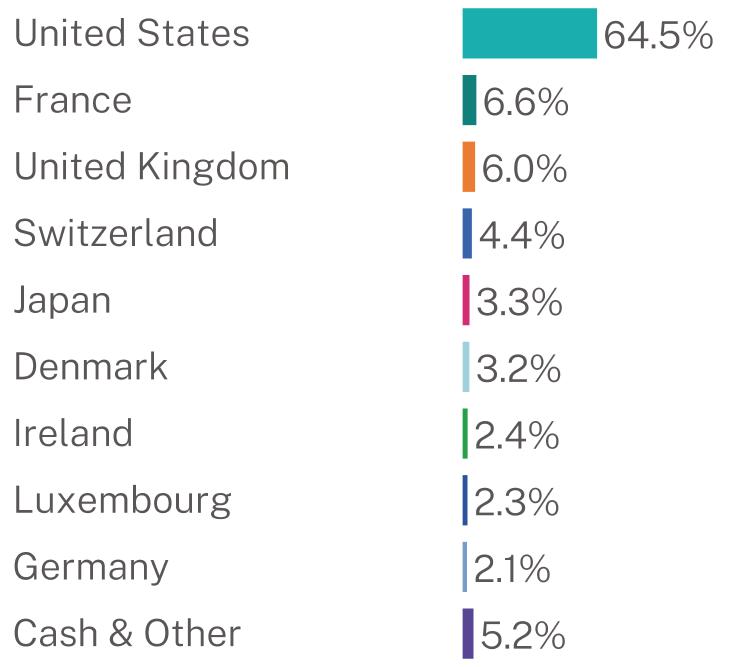
WHAT DID THE FUND INVEST IN? (% of net assets as of May 31, 2026)
Sector Breakdown *
|
Top 10 Issuers
|
(%)
|
|
Mueller Industries, Inc.
|
3.8%
|
|
StoneX Group, Inc.
|
3.7%
|
|
AAON, Inc.
|
3.5%
|
|
Chubb Ltd.
|
3.2%
|
|
Schneider Electric SE
|
3.0%
|
|
Halma PLC
|
3.0%
|
|
SSE PLC
|
3.0%
|
|
ESCO Technologies, Inc.
|
2.8%
|
|
GE Vernova, Inc.
|
2.5%
|
|
WESCO International, Inc.
|
2.4%
|
Geographic Breakdown
WHAT WERE THE FUND COSTS FOR THE LAST SIX MONTHS? (based on a hypothetical $10,000 investment)
|
Class Name
|
Costs of a $10,000 investment
|
Costs paid as a percentage of a $10,000 investment*
|
|
Institutional Class
|
$52
|
1.00%
|
HOW DID THE FUND PERFORM DURING THE LAST SIX MONTHS AND WHAT AFFECTED ITS PERFORMANCE?
The MSCI ACWI Net Total Return Index returned 13.32% versus the Fund’s Institutional Class shares return of 8.76% for the six-month period ended May 31, 2026. The Fund underperformed due to stock selection within the Information Technology and Industrials sectors. Trimble (TRMB US ) within the Information Technology sector was the top detracting position during the period potentially pressured by multiple compression driven by AI disruption fears across its basket of software names. Financials and Consumer Staples were the top contributing sectors due primarily to stock selection effects. StoneX Group (SNEX US), a global brokerage and financial services firm, was the top contributor, potentially benefiting from heightened market volatility and shifting expectations for short term interest rates amid renewed inflation concerns.
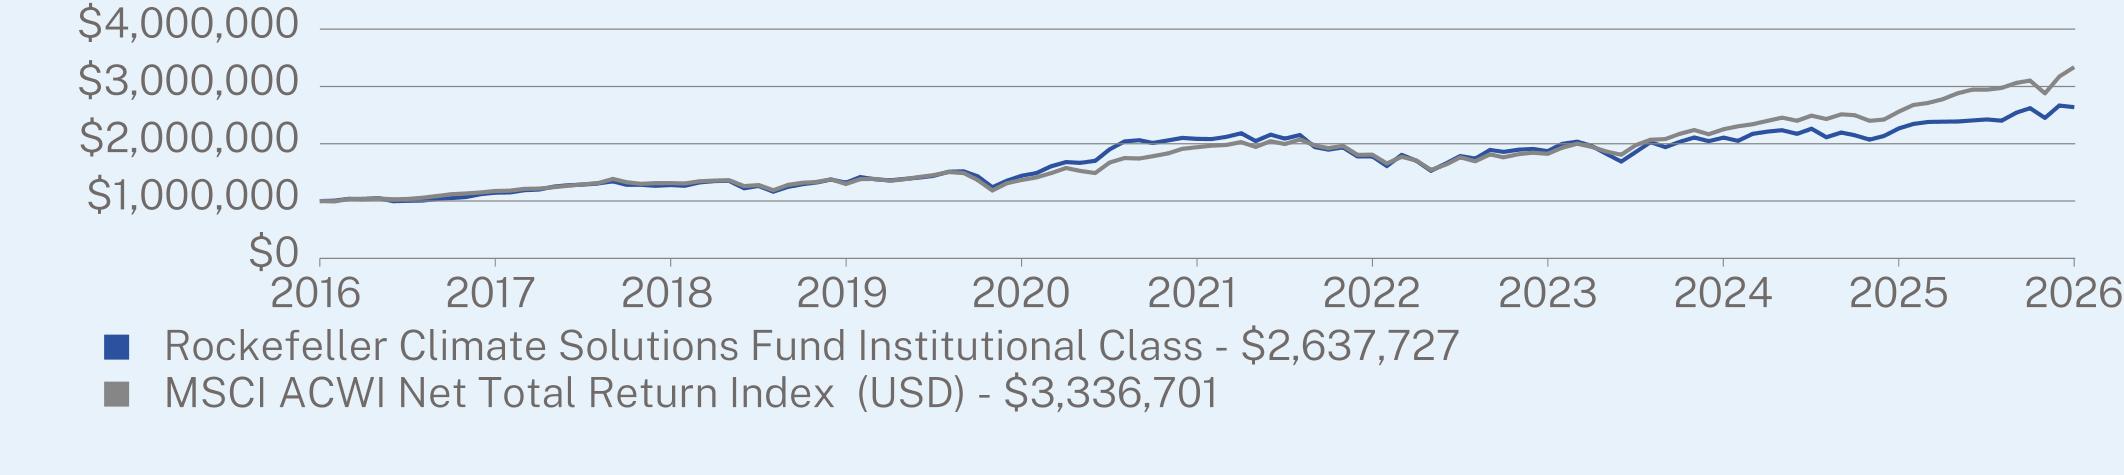
ANNUAL AVERAGE TOTAL RETURN (%)
|
|
1 Year
|
5 Year**
|
10 Year**
|
|
Institutional Class
|
16.32
|
4.81
|
10.19
|
|
MSCI ACWI Net Total Return Index (USD)
|
30.27
|
11.45
|
12.81
|
Visit https://www.rockefellerfunds.com/equity-funds/ for more recent performance information.
KEY FUND STATISTICS (as of May 31, 2026)
|
Net Assets
|
$72,855,760
|
|
Number of Holdings
|
53
|
|
Portfolio Turnover
|
12%
|
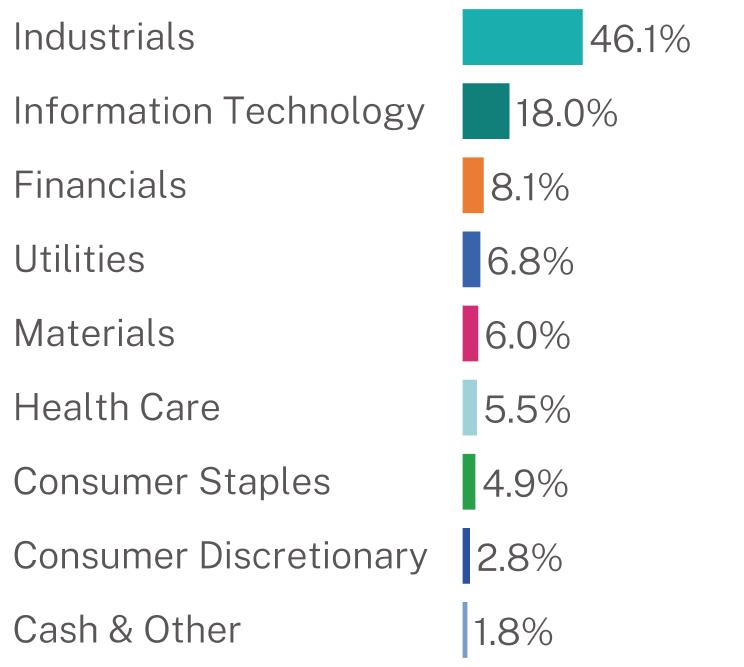
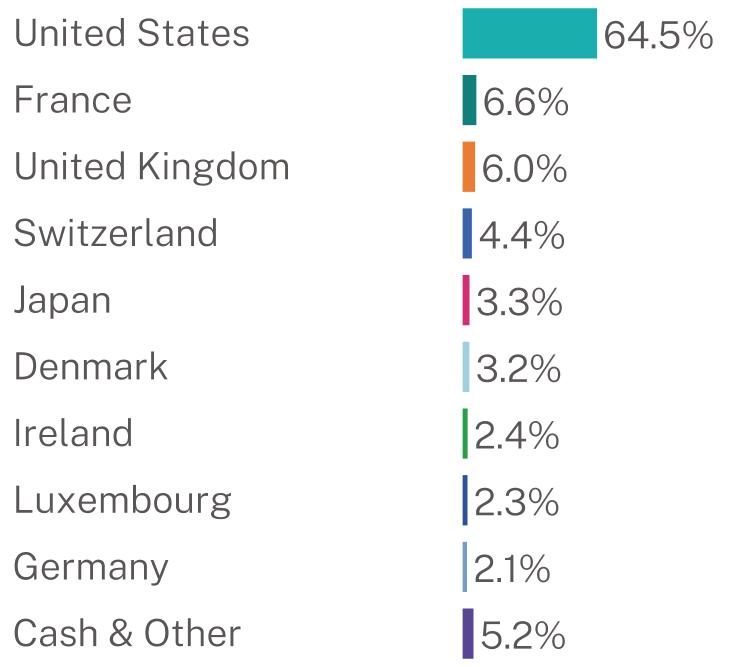
WHAT DID THE FUND INVEST IN? (% of net assets as of May 31, 2026)
Sector Breakdown *
|
Top 10 Issuers
|
(%)
|
|
Mueller Industries, Inc.
|
3.8%
|
|
StoneX Group, Inc.
|
3.7%
|
|
AAON, Inc.
|
3.5%
|
|
Chubb Ltd.
|
3.2%
|
|
Schneider Electric SE
|
3.0%
|
|
Halma PLC
|
3.0%
|
|
SSE PLC
|
3.0%
|
|
ESCO Technologies, Inc.
|
2.8%
|
|
GE Vernova, Inc.
|
2.5%
|
|
WESCO International, Inc.
|
2.4%
|
Geographic Breakdown
WHAT WERE THE FUND COSTS FOR THE LAST SIX MONTHS? (based on a hypothetical $10,000 investment)
|
Class Name
|
Costs of a $10,000 investment
|
Costs paid as a percentage of a $10,000 investment*
|
|
Class A
|
$67
|
1.30%
|
HOW DID THE FUND PERFORM DURING THE LAST SIX MONTHS AND WHAT AFFECTED ITS PERFORMANCE?
The Russell 2000 Total Return Index returned 17.47% versus the Fund’s Class A shares return of 7.83% (without sales charges) for the six-month period ended May 31, 2026. The Fund underperformed as stock selection in the Information Technology and Health Care sectors detracted from performance. Huron Consulting (HURN US) in the Industrials sector was the top detracting stock during the period potentially driven by perceived AI disruption risk despite continued revenue growth, margin expansion, backlog strength, and buybacks. Stock selection within the Consumer Discretionary and Financials sectors contributed positively to performance. StoneX Group (SNEX US), a global brokerage and financial services firm, was the top contributor, potentially benefiting from heightened market volatility and shifting expectations for short term interest rates amid renewed inflation concerns.
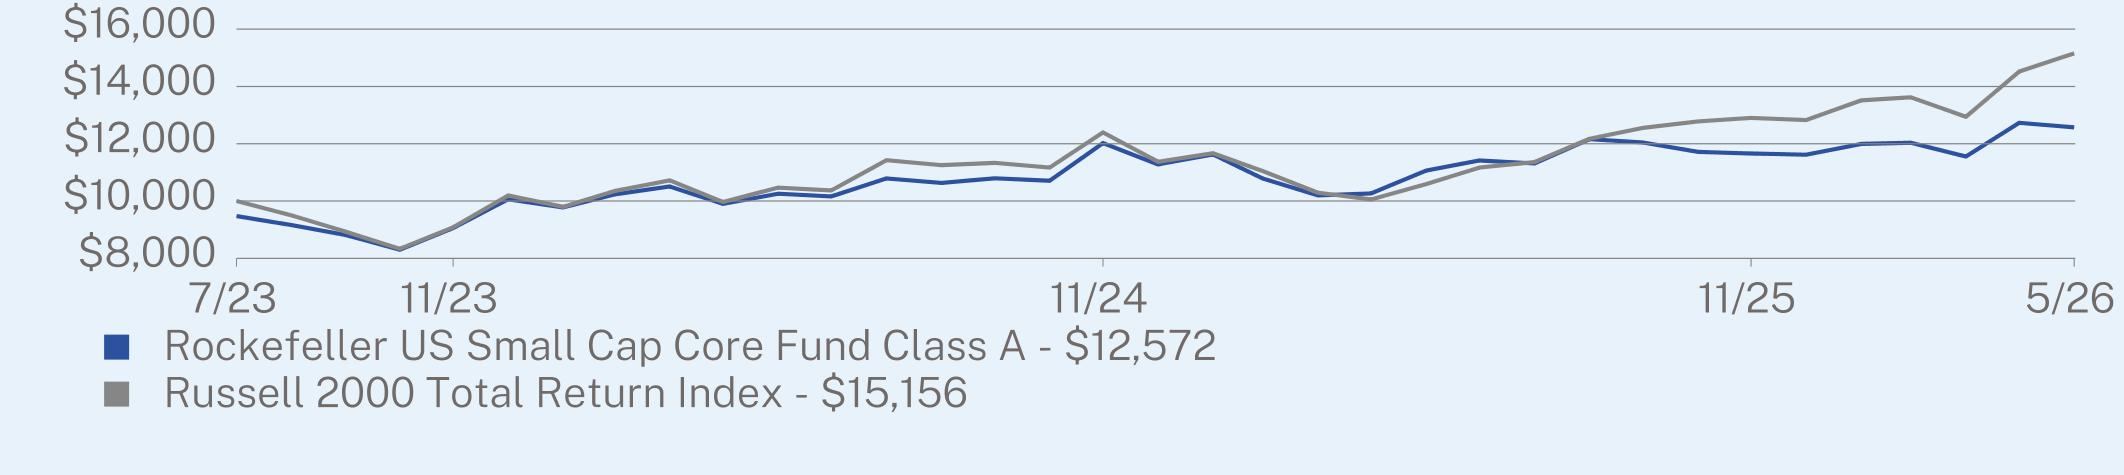
ANNUAL AVERAGE TOTAL RETURN (%)
|
|
1 Year
|
Since Inception
(07/31/2023) |
|
Class A (without sales charge)
|
13.62
|
10.49
|
|
Class A (with maximum 5.25% sales charge)
|
7.66
|
8.41
|
|
Russell 2000 Total Return Index
|
43.08
|
15.79
|
Visit https://www.rockefellerfunds.com/equity-funds/ for more recent performance information.
KEY FUND STATISTICS (as of May 31, 2026)
|
Net Assets
|
$99,591,878
|
|
Number of Holdings
|
47
|
|
Portfolio Turnover
|
46%
|
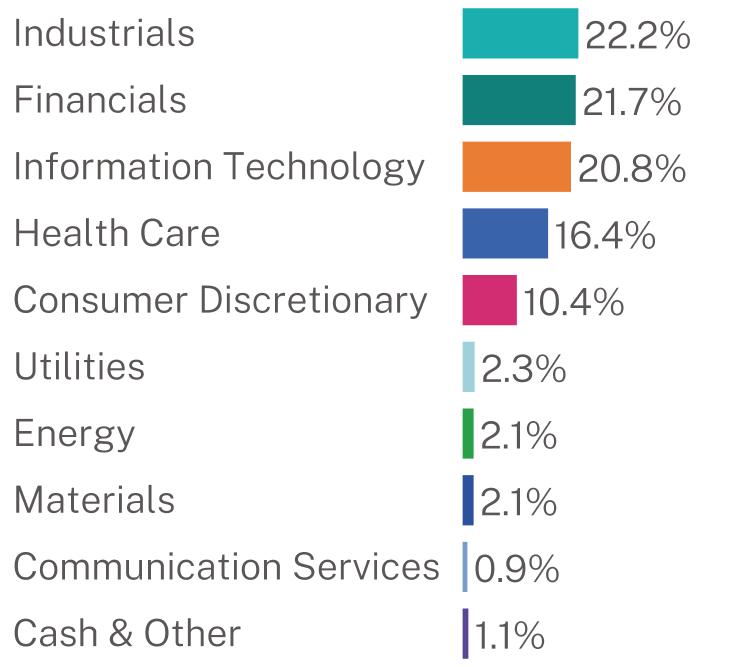
WHAT DID THE FUND INVEST IN? (% of net assets as of May 31, 2026)
Sector Breakdown *
|
Top 10 Issuers
|
(%)
|
|
First Bancorp.
|
4.0%
|
|
HA Sustainable Infrastructure Capital, Inc.
|
3.9%
|
|
StoneX Group, Inc.
|
3.2%
|
|
Stewart Information Services Corp.
|
3.2%
|
|
Helios Technologies, Inc.
|
3.1%
|
|
CECO Environmental Corp.
|
3.0%
|
|
Korn Ferry
|
3.0%
|
|
Pediatrix Medical Group, Inc.
|
2.9%
|
|
Limbach Holdings, Inc.
|
2.9%
|
|
Winmark Corp.
|
2.8%
|
WHAT WERE THE FUND COSTS FOR THE LAST SIX MONTHS? (based on a hypothetical $10,000 investment)
|
Class Name
|
Costs of a $10,000 investment
|
Costs paid as a percentage of a $10,000 investment*
|
|
Class I
|
$54
|
1.05%
|
HOW DID THE FUND PERFORM DURING THE LAST SIX MONTHS AND WHAT AFFECTED ITS PERFORMANCE?
The Russell 2000 Total Return Index returned 17.47% versus the Fund’s Class I shares return of 7.97% for the six-month period ended May 31, 2026. The Fund underperformed as stock selection in the Information Technology and Health Care sectors detracted from performance. Huron Consulting (HURN US) in the Industrials sector was the top detracting stock during the period potentially driven by perceived AI disruption risk despite continued revenue growth, margin expansion, backlog strength, and buybacks. Stock selection within the Consumer Discretionary and Financials sectors contributed positively to performance. StoneX Group (SNEX US), a global brokerage and financial services firm, was the top contributor, potentially benefiting from heightened market volatility and shifting expectations for short term interest rates amid renewed inflation concerns.
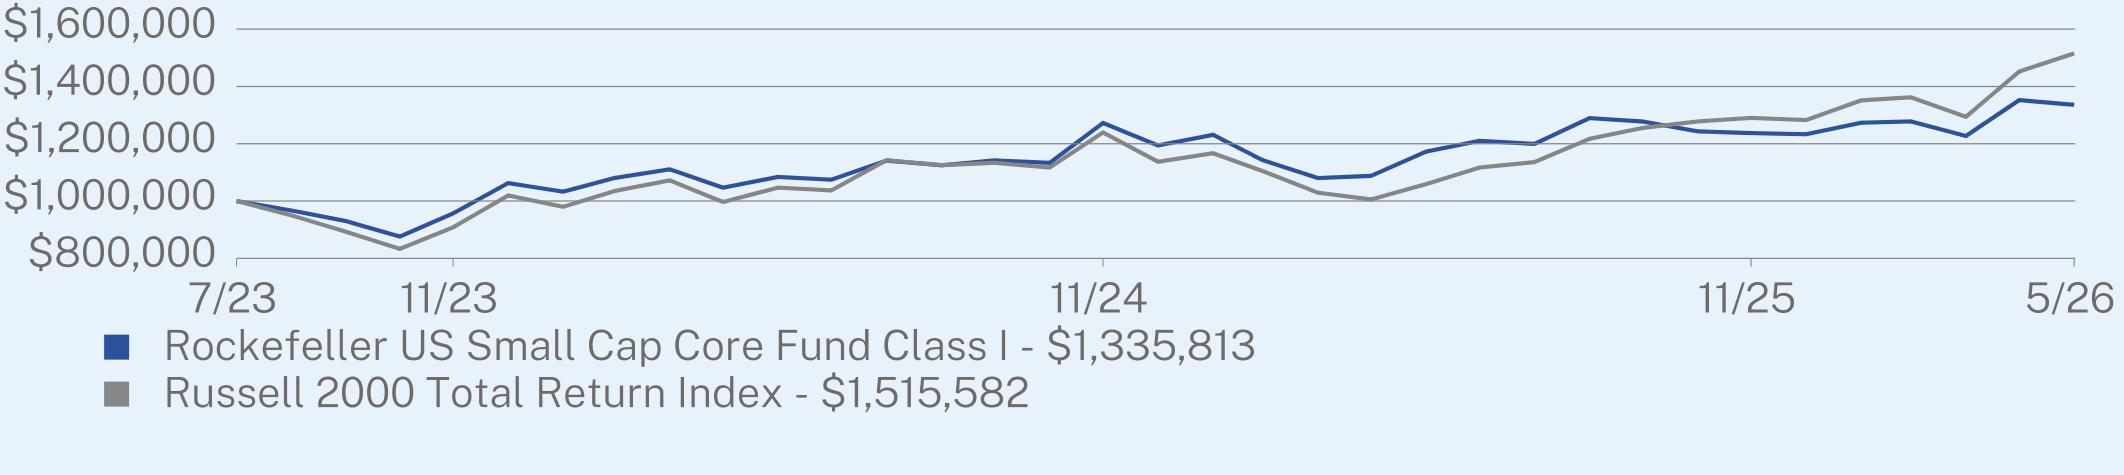
ANNUAL AVERAGE TOTAL RETURN (%)
|
|
1 Year
|
Since Inception
(07/31/2023) |
|
Class I
|
13.90
|
10.75
|
|
Russell 2000 Total Return Index
|
43.08
|
15.79
|
Visit https://www.rockefellerfunds.com/equity-funds/ for more recent performance information.
KEY FUND STATISTICS (as of May 31, 2026)
|
Net Assets
|
$99,591,878
|
|
Number of Holdings
|
47
|
|
Portfolio Turnover
|
46%
|
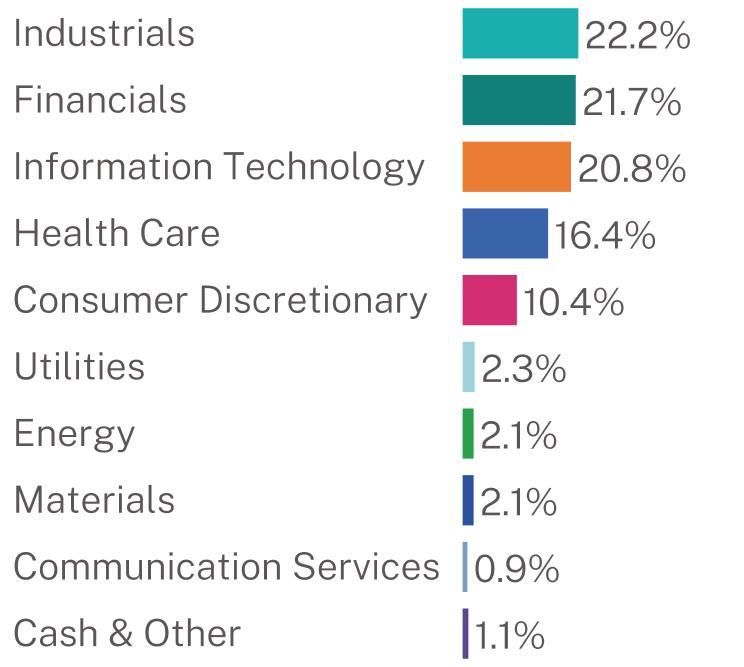
WHAT DID THE FUND INVEST IN? (% of net assets as of May 31, 2026)
Sector Breakdown *
|
Top 10 Issuers
|
(%)
|
|
First Bancorp.
|
4.0%
|
|
HA Sustainable Infrastructure Capital, Inc.
|
3.9%
|
|
StoneX Group, Inc.
|
3.2%
|
|
Stewart Information Services Corp.
|
3.2%
|
|
Helios Technologies, Inc.
|
3.1%
|
|
CECO Environmental Corp.
|
3.0%
|
|
Korn Ferry
|
3.0%
|
|
Pediatrix Medical Group, Inc.
|
2.9%
|
|
Limbach Holdings, Inc.
|
2.9%
|
|
Winmark Corp.
|
2.8%
|
| [1] |
|
||
| [2] |
|
||
| [3] |
|
||
| [4] |
|
||
| [5] |
|
||
| [6] |
|
||
| [7] |
|
||
| [8] |
|
||
| [9] |
|